
LEE KAI SEN - eprints.utar.edu.myeprints.utar.edu.my/2026/1/CM-2016-1304023.pdfTHE MECHANICAL...
91
THE MECHANICAL PROPERTIES OF TREATED RICE HUSK ASH (TRHA)MORTAR LEE KAI SEN UNIVERSITI TUNKU ABDUL RAHMAN
-
Upload
trinhthuan -
Category
Documents
-
view
213 -
download
0
Transcript of LEE KAI SEN - eprints.utar.edu.myeprints.utar.edu.my/2026/1/CM-2016-1304023.pdfTHE MECHANICAL...

THE MECHANICAL PROPERTIES OF TREATED
RICE HUSK ASH (TRHA)MORTAR
LEE KAI SEN
UNIVERSITI TUNKU ABDUL RAHMAN

THE MECHANICAL PROPERTIES OF TREATED RICE HUSK ASH
(TRHA) MORTAR
LEE KAI SEN
A project report submitted in partial fulfilment of the requirements for the
award of Bachelor of Science (Hons.) Construction Management
Faculty of Engineering and Green Technology
Universiti Tunku Abdul Rahman
May 2016

ii
DECLARATION
I hereby declare that this project report is based on my original work except for
citations and quotations which have been duly acknowledged. I also declare that it
has not been previously and concurrently submitted for any other degree or award at
UTAR or other institutions.
Signature : ____________________________
Name : Lee Kai Sen
ID No. : 13AGB04023
Date : 06 May 2016

iii
APPROVAL FOR SUBMISSION
I certify that this project report entitled “THE MECHANICAL PROPERTIES OF
TREATED RICE HUSK ASH (TRHA) MORTAR” was prepared by LEE KAI
SEN has met the required standard for submission in partial fulfilment of the
requirements for the award of Bachelor of Science (Hons.) Construction
Management at Universiti Tunku Abdul Rahman.
Approved by
Signature : ____________________________
Supervisor : Mr. Chang Kok Yung
Date : 06 May 2016

iv
The copyright of this report belongs to the author under the terms of the
copyright Act 1987 as qualified by Intellectual Property Policy of Universiti Tunku
Abdul Rahman. Due acknowledgement shall always be made of the use of any
material contained in, or derived from, this report.
© 2016, LEE KAI SEN.All right reserved.

v
ACKNOWLEDGEMENTS
I would like to thank everyone who had contributed to the successful completion of
this project. I would like to express my gratitude to my research supervisor, Mr
Chang Kok Yung for this invaluable advice, guidance and his enormous patience
throughout the development of the research.
In addition, I would also like to express my gratitude to my loving parent who
given the financial support to me and friends especially Non Kee Sam and Tan Wei
Lun who had helped throughout the process of research and given me encouragement.
Lastly, I would like to express my gratitude to Mr. Cheah Chew Keat for
given technical advice and assistance in this research.

vi
THE MECHANICAL PROPERTIES OF TREATED RICE HUSK ASH
(TRHA) MORTAR
ABSTRACT
Cement is an important material in construction industry which widely use nowadays.
However, it is a non-environmental friendly product. One tonne of cement produce
same amount of carbon dioxide (CO2). Besides that, the calcium hydroxide Ca(OH)2
contained in cement product will susceptible to chemical attack when react with CO2
which turn the cement product become acidic. The Ca(OH)2 will dissolved and
escaped from concrete after contacted with water hence pores were formed inside the
concrete. Hence supplementary cementitious materials (SCM) should be investigated
to lower down the usage of cement and increase the concrete performances. The rice
husk (RH) is an agriculture waste which was by-product of rice production. RH
typically send to burn or landfill and release harmful gaseous which pollute the
environment and harm to people. A large amount of amorphous silica (SiO2) is
produced when the RH was undergone a control incineration. However the SiO2
content can be increased by giving an acid pre-treatment for RH to remove the
metallic impurities on RH. The treated rice hush ash (TRHA) which contained high
amount of SiO2 is suitable to be used as SCM to substitute some of the cement in
concrete. This study was determined the treatment method for rice husk and optimum
replacement ratio of (TRHA) in mortar. Some tests such as workability test,
compressive strength test, porosity test and gas permeability test was carried out to
determine the performances of TRHA mortar. The results showed the 5% of TRHA
where RH undergone citric acid treatment with 80°C gave the highest strength and 5%
to 15% of TRHA as partial replacement material for cement has lower porosity and
permeability than conventional mortar. Further study on acid treatment of rice husk
with different molarity of citric acid as well as the period of treatment without extra
heat can be carried out.

vii
TABLE OF CONTENTS
DECLARATION ii
APPROVAL FOR SUBMISSION iii
ACKNOWLEDGEMENTS v
ABSTRACT vi
TABLE OF CONTENTS vii
LIST OF TABLES x
LIST OF FIGURES xii
LIST OF ABBREVATIONS xiv
LIST OF SYMBOLS xvii
CHAPTER
1 INTRODUCTION 1
1.1 Background 1
1.2 Problem Statement 4
1.3 Aim and Objectives 9
1.4 Significant of Study 9
1.5 Scope of Study 10
1.6 Chapter Outline 12
2 LITERATURE REVIEW 14
2.1 Introduction 14
2.2 Concrete 14
2.2.1 Portland Cement 16
2.3 Rice Husk 16
2.4 Rice Husk Ash 17
2.4.1 Properties of Rice Husk Ash 18
viii
CHAPTER
2
2.5 Pre-treatment of Rice Husk Ash 18
2.5.1 Hydrochloric Acid as Acid Leaching Agent 20
2.5.2 Oxalic Acid as Leaching Agent 24
2.5.3 Dilute sulphuric acid (H2SO4) as
the Acid Leaching Agent 25
2.5.4 Citric Acid as the Acid Leaching Agent 26
2.5.5 Comparison between Citric Acid and
HCl Acid Treatment for RRH 27
2.5.6 Comparison between Citric Acid and
H2SO4 Acid Treatment for RRH 29
2.6 Concluding Remark 30
3 RESEARCH METHODOLOGY 32
3.1 Introduction 32
3.2 Material 32
3.2.1 Portland Cement 32
3.2.2 Treated Rice Husk Ash 33
3.2.3 Fine Aggregate 35
3.2.4 Water 36
3.2.5 Superplasticizer 37
3.3 Mix Proportion of TRHAMortar 38
3.4 Mortar Mixing Process 40
3.5 Cast, Mould and Demould Mortar 41
3.6 Curing 42
3.7 Tests for the Fresh and Hardened Mortar 43
3.7.1 Flow Table Test 44
3.7.2 Compressive Strength Test 45
3.7.3 Porosity Test 46
3.7.4 Permeability Test 47
4 RESULTS AND DISCUSSION 48
4.1 Introduction 48

ix
CHAPTER
4
4.2 Rice Husk Ash Production 48
4.3 Mortar Performances 49
4.3.1 Flow Table Test 50
4.3.2 Compressive Strength Test 52
4.3.3 Gas Permeability Test 55
4.3.4 Porosity Test 60
4.4 Concluding Remark 63
5 CONCLUSION AND RECOMMENDATIONS 65
5.1 Conclusion 65
5.2 Recommendations 66
REFERENCES 67
STANDARDS 73

x
LIST OF TABLES
TABLE TITLE PAGE
1.1 World Production and Capacity 3
1.2 Paddy Production, Rice Production and
Rice Husk Production in Malaysia by Year 7
1.3 Details of the Mortar Mix Proportion 11
1.4 Tests with the Standard to Investigate
the Mechanical Properties and Durability of TRHA Mortar 12
2.1 Concrete Application Grades 15
2.2 Composition of Rice Husk 17
2.3 Relationship between Leaching Agent’s
Temperature and the Different Concentration of HCl 20
2.4 SiO2 (wt.%) in RHA Burned at 700 oC 21
2.5 Chemical and Physical Properties of RRHA and TRHA 22
2.6 SiO2 of RRHA and TRHA by Oxalic Acid
which Burned at 700 oC 24
2.7 SiO2 in Citric Acid Leached RHA at 50 oC
with Difference Acid Concentration 26
2.8 SiO2 in Citric Acid Leached RHA
with 5% Concentration at Difference Temperature 27
2.9 SiO2 Content in RHs after Thermal
Treatment of 750oC Analysed by XRF 27
2.10 The Percentage of Silica of the RHA 29

xi
TABLE TITLE PAGE
2.11 SiO2 Obtained in RHA at 800oC Thermal Treatment
for RRH, Citric Acid Treated RH and H2SO4 Treated RH 30
3.1 Steps to Produce Difference TRHAs 35
3.2 Mix Proportions Table for TRHA Mortar 39
3.3 Tests' Details for Fresh and Hardened Mortar 44
4.1 Weight of TRHAs 49
4.2 Flow Table Test Result 51
4.3 Mortar Average Compressive Strength 53
4.4 Intrinsic Permeability Result 57
4.5 Average Intrinsic Permeability Result 58
4.6 Specimens Weight for Porosity Test 61
4.7 Porosity Result 62

xii
LIST OF FIGURES
FIGURE TITLE PAGE
1.1 The Dirtiest Countries by CO2 Emissions in 2009 5
2.1 Rice Husk 16
2.2 Rice Husk Ash 17
2.3 Carbonised RH and RHA 18
2.4 SEM Micrographs of Outer Epidermis of RRH 23
2.5 SEM Micrographs of Outer Epidermis of RH
Treated by 3 N HCl 23
2.6 SEM Micrographs of Outer Epidermis of RH
Treated by 5.6 N HCl 23
2.7 The SEM of RRH and TRHA by H2SO4 25
3.1 50 kg TasekBuaya Ordinary Portland Cement 33
3.2 RH from Paddy Milling Plant Perak 34
3.3 CARBOLITE Furnace 34
3.4 Mining Sand 36
3.5 Water Source 37
3.6 Superplasticiser 38
3.7 Mortar Casted in the Mould 41
3.8 Mould Use to Cast 50 mm x 50 mm x 50 mm
Mortar 42
xiii
FIGURE TITLE PAGE
3.9 Mortar Curing Process 43
3.10 Flow Table Test Equipment 45
3.11 Compressive Strength Test Machine 46
4.1 Mortar Performance Tests' Flowchart 50
4.2 Flow Table Test Result Bar Chart 52
4.3 Twenty Eight Days Compressive Strength 54
4.4 Mortar Average Compressive Strength 55
4.5 Average Intrinsic Permeability for TRHA Mortars
and Conventional Mortar 59
4.6 Porosity of TRHA and Conventional Mortar 63

xiv
LIST OF ABBREVATIONS
Ca(OH)2 Calcium Hydroxide
CH4 Methane Gas
CSH Calcium Silicate Hydrate
CO Carbon Monoxide
CO2 Carbon Dioxide
H2SO4 Sulphuric Acid
HCl Hydrochloric Acid
HNO3 Nitric Acid
K Potassium
Na Sodium
NaOH Sodium Hydroxide
NH4OH Ammonium Hydroxide
NO Nitrogen Oxides
SiO2 Silica
SO2 Sulphur Dioxide
kg Kilogramme
kg/m3
Kilogramme per Cubic Metre
kW Kilowatt
M Mol
N Normality
ml Millilitre
mm Millimetre
cm Centimetre
m2 Square Metre
cm3
Cubic Centimetre

xv
μm Micrometre
Nmm-2
Newton per Square Millimetre
cm3/s Cubic Centimetre per Second
s Second
RH Rice Husk
RHA Rice Husk Ash
RRH Raw Rice Husk
RRHA Raw Rice Husk Ash
TRH Treated Rice Husk
TRHA Treated Rice Husk Ash
SCM Supplementary Cementitious Materials
SEM Scanning Electron Microscope
VRC Vibrated Reinforced Concrete
w/c Water : Cement Ratio
XRF X-ray Fluorescent
ASTM American Society of the International Association for Testing
and Materials
BS British Standard
IS Indian Standard
RILEM International Union of Laboratories and Experts in
Construction Materials, Systems and Structures
D1 Diameter of flow (mm)
d Original diameter (mm)
K Intrinsic Permeability (m2)
P1 Absolute Applied Pressure Bars (Atmosphere Pressure)
Usually 2 Bars
P2 Pressure at which the Flow Rate is Measured (Atmosphere
Pressure) Usually 1 Bar
A Cross Sectional Areas of Specimen (m2)
L Length of Specimen (m)
V Flow Rate (cm3/s)

xvi
D Flowmeter Diameter (cm)
H Length Read on Flowmeter (cm)
T Average Time (s)
P Porosity (%)
W1 Weight of Specimen in Air after Passed through the Porosity
Test (kg)
W2 Weight of Dry Specimen (kg)
W3 Weight of Specimen in Water after Passed through the
Porosity Test (kg)

xvii
LIST OF SYMBOLS
% Percentage
wt. % Percentage by Mass (Weight)
oC Degree Celsius

1
CHAPTER 1
INTRODUCTION
1.1 Background
Nowadays, the construction sector becomesthe vital part in enhancing the economy
of a country. Construction is defined as the process to create and build the building
or infrastructure such as shopping mall, school, hospital, bridge, road, semi-detached
house, factory etc. The population of people is the most important factor that affects
the number construction projects. The prime purpose of construction is fulfill the
need of people, as the number of people increase, the number of buildings or
construction projects also increase.
At the ancient time, human was lived near to the river or in the caves. The
knowledge of humans was increased as time increased. People tried to use stones or
timbers as the materials to construct their houses or purpose buildings. Near 1840,
Portland cement was introduced and being used as the main material to replace the
timber and stone (Nawy, 2008). It is because the cement’s product- concrete was
more flexible to use compare to timbers and stones. One of the examples is: not all
the timbers are suitable to use in construction for the structural support and those
timbers sometimes are also hard to find. Therefore, concrete was brings many
advantages to people in construction industry.

2
Concrete is a composite material that strong in compression but weak in
tension. The concrete will crack when there is not enough strength to overcome the
force. Therefore reinforcement bars are added into concrete to increase the tensile
strength. This concrete is so called vibrated reinforced concrete (VRC).
Cement is playing the role as the agent to bind the aggregate and sand which
contribute strength to the hardened concrete. Cement will has chemical reaction
become hardened when contact to water (Nawy, 2008).On the construction site, the
cement’s quality can be guaranteed by the supplier like other materials. A good
quality of cement will give the concrete structure of good performances in terms of
durability, strength and etc. Cement in concrete can be said like flour in the sponge
cake, and the cook is manipulating the quality of the sponge cake (Neville and
Brooks, 2010).Hence a good quality cement not necessary will produced a good
quality concrete if the procedures of mixing concrete, ratio of concrete mixture, other
factors such as curing are not take in consideration.
According to previous research in United States, there was 70 percent of the
total cement (83.3 million tonnes) produced approximate 58.31 million
tonnescontributed to ready mixed concrete producers, concrete product
manufacturers used 11 percent (9.163 million tonnes), 9 percent (7.497 million
tonnes) for contractors used especially road paving, oil and gas well drillers and
building material dealers each used 4 percent (3.332 million tonnes), lastly the
remaining 2 percent (1.666 million tonnes) was other uses(Van Oss, 2015).
Table 1.1 showed the quantity of cement production (milliontonnes) was
increased from 2013 to 2014 due to high spending levels for new non-residential and
residential constructions (Van Oss, 2015).

3
Table 1.1 World Production and Capacity (Van Oss, 2015)
Cement Production,
million tonnes
Clinker Capacity, million
tonnes
2013 2014 2013 2014
U.S. 77.4 83.3 104.3 104.3
Brazil 70 72 60 60
China 2,420 2,500 1,900 2,000
Egypt 50 50 46 46
Germany 31.3 31 31 31
India 280 280 280 280
Indonesia 56 60 51 50
Iran 72 75 80 80
Italy 22 22 46 46
Japan 57.4 58 55 55
Korea, Republic 47.3 47.7 50 50
Mexico 34.6 35 42 42
Pakistan 31 32 43.4 44
Russia 66.4 69 80 80
Saudi Arabia 57 63 55 55
Thailand 42 42 50 50
Turkey 71.3 75 68.6 69
Vietnam 58 60 80 80
Other Counties
(rounded)
536 525 348 349
Total 4,080 4,180 3,470 3,570
Nowadays people are tried to use some supplementary cementitious materials
(SCM)to modify the concrete by substitute some portion of Portland cement. The
main reason to use SCM in concrete is SCM believed can contribute to lower the
carbon dioxide (CO2) in concrete compared to pure Portland cement concrete
(Lothenbacha, Scrivenerb and Hooton, 2011). The combination of SCM with cement
produces a more complication reaction. Portland cement’s hydration and hydraulic

4
reaction of SCM can occur at the same time and they may influence each other
unlike Portland cement which only has simple reaction.The advantages of use SCM
in concrete mix are improve the concrete durability, lower the greenhouse gaseous
emission, increase concrete strength and etc.
Recently people found that the rice husk ash (RHA) which pass through a
pre-treatment process can produce higher content of silica (SiO2) compare to
untreated RHA. There are few methods that generally use by people to produce
higher purity silica in RHA such as acid leaching, basic pre-treatment. However acid
leaching showed the better result compare to basic pre-treatment in getting the high
purity silica (Ugheoke and Mamat, 2012). Acid leaching is actually a treatment for
rice husk before it sends to incinerate. The rice husk (RH) was soaked in the acid to
remove the metallic impurities and sent to incinerate after washed few times until
there was no acid in the RH. Many researches are focused on this direction as the
worthiness and feasibility of RHA as SCM in concrete was high.
1.2 Problem Statement
Due to the development of a country, many construction activities are rise day by day
and it directly increase the production of cement. However the cement is not an
environmental friendly material, it will release a lot of CO2 and other greenhouse
gasses. One tonne of cement production produced the same amount of CO2(Gautam,
Krishna and Srivastava, 2014).Some research showed that concrete industry was the
world largest user of natural resources, most of the raw materials used each year
produced large quantity of CO2 (Mehta, 2002). The global CO2 gas for cement
production was emitted almost 829 million metric tons in 2000 (Hu and Kavan,
2014). It was a serious case in the global warming issue. The production of cement
increased due to increase of construction activities (Utusan online, 2009). Figure 1.1
showed the global CO2 emission in percent. In the cement production, clinker is the
used the most energy and release most CO2 (Zhu, 2011). It is a necessary to replace
the clinker by other SCMs to reduce the CO2 emissions.

5
Figure 1.1 The Dirtiest Countries by CO2 Emissions in 2009 (Helgi Library,
n.d.)
The concrete contain of 25 wt.% to 50 wt.% calcium hydroxide (Ca(OH)2)
which susceptible to the chemical attack. It will react with the CO2 in the air to have
another reaction called carbonation. Carbonation of concrete reduces the pH value of
the concrete towards acidic which will harm to the reinforcement bar inside the
concrete. Besides that, when Ca(OH)2met calcium chloride, it will change it
chemical reaction and cause the bonding become weaker and reduce the strength.
Hence concrete need SiO2 which can form a continuous connection within the
cement particles to increase its bonding force so that its strength is also increases.
There was calcium hydroxide in the mortar and concrete. According to
Thomas and Jennings (n.d.), calcium hydroxide is found and appeared or formed at

6
the capillary pores inside the OPC paste. It has a weak bonding with the hardened
concrete due to it is a soluble substance. When the concrete contact to the water, the
calcium hydroxide will dissolve and escape from the hardened concrete.Thus pores
formed and directly affect the durability of concrete and lead it weaker for chemical
attacks.This problem can be solved by calcium-silicate-hydrate (C-S-H) gel which is
smaller and bind the cement particles into a continuous form. Besides that, the C-S-H
gel also can fill up the pores inside the concrete hence the durability of concrete will
increase. The concrete has low amount of C-S-H gel hence it is necessary to add on
SCM to insert the amount of silica to produce the C-S-H gel in the concrete to
increase its mechanical properties and durability.
As the population of human being increases, the demand for the food
especially rice also increases. This situation directly contributed large quantity of
waste (rice husk) in our world. Around 649.7 million tonnes rice produced every year
worldwide (Habeeb and Mahmud, 2010) and the rice husk was 20 % (Northoff,
2008)of it about 130 million tonnes. That means there will almost 130 million tonnes
of waste is producing annually. Table 1.2 showed the paddy and the RH production
in Malaysia. It can be seen that the by-product from rice was increasing year by year.

7
Table 1.2 Paddy Production, Rice Production and Rice Husk Production in
Malaysia by Year (Department of Agriculture, 2014)
Year Paddy
Production,
metric tonnes
Rice Production,
metric tonnes
Rice Husk
Production,
metric tonnes
2004 2,291,352 1,467,052 824,300
2005 2,314,378 1,490,015 824,363
2006 2,187,519 1,407,221 780,298
2007 2,375,604 1,530,971 844,633
2008 2,353,036 1,516,474 836,562
2009 2,511,043 1,620,256 890,787
2010 2,464,831 1,588,456 876,375
2011 2,578,519 1,661,260 917,259
2012 2,599,382 1,674,981 924,401
2013 2,615,845 1,685,236 930,609
Due to the protein contain in RH is very low and RH also a low digestible
substance hence it is not suitable for human to eat. Typically RH will be solving by
two ways: combustion and landfill. During the combustion process, the harmful
gaseous been released such as CO2, carbon monoxide (CO), nitrogen oxides (NO),
sulphur dioxide (SO2) and etc. These gaseous will seriously affect human being’s
health and environment to global warming, increase the earth temperature. The
sulphur dioxide gas will contribute to the acid rain which can harm the natural
environment and built environment (National Park Service, 2013). The aquatic life
will die due to the pH value of the water decrease become acidic, the trees will die
too because they can’t survive in acidic environment. For sulphur dioxide in acid rain
will corrode the steel structure of the building, the building will become weaker and
may tend to failure.
Besides that, rice husk need large area for landfill and when the rice husk is
being decomposed, it will release heat, methane gas (CH4) and CO2 which cause the
global warming. CH4 is a gas that can trap heat 21 times more than CO2 (Mark, 2012).

8
Send the RH to landfill is meanings to increase the global warming rate. Moreover
the landfill will release the smell which caused by the ammonia and hydrogen
sulphites during the RH being breakdown by microorganism (New York State
Department of Health, 2012).Other than that, the time for RH to decompose
completely is very long because RH is non-biodegradable material, it hard to
decompose compare to biodegradable material. Landfill also will cause the water
pollution. The water pollution formed when there is water pass through the RH
which undergoing decomposes process. This liquid contains of virus and toxic which
is very danger and harmful to human when it penetrate to nearby water supply,
groundwater or river. Most of the ways to solve the problem of rice husk are non-
environmental friendly.
The RHA has promising high SiO2that can improve concrete performance. It
contain of 87-92 wt.% of SiO2 (Ugheoke and Mamat, 2012). The SiO2 form a
stronger bonding and give higher compressive strength and durability of
concrete(Nair et al., 2008).However, SiO2 content of RHA can be lifted up by pre-
treatment to remove the metallic impurities on the RH. Some of the studies found
that the bonding between the oxides especially potassium (K) and sodium (Na) affect
the percentage of SiO2 in RHA. If want to obtain the higher percentage of SiO2, there
must has some treatment for RH.
Besides that, the pre-treatment for rice husk ash can further separate into few
methods: acid leaching, basic pre-treatment and carbonisation. Many studies found
that acid leaching pre-treatment for rice husk ash required certain temperature and
time to effectively decompose the metallic impurities inside the rice husk. When
thetemperature needs to produce treated rice husk ash (TRHA) increase, the cost of
TRHA also will increase. There is necessary to investigate a more convenient and
cheaper RHA treated method. The most preferable way is acid leaching at room
temperature, short period and with low concentrated acid.

9
1.3 Aim and Objectives
To determine the treatment method for rice husk and optimum replacement ratio of
TRHA in mortar. In this study, the following objectives been formulated in order to
achieve the aim of this study.
Objective 1
To investigate the mechanical properties of TRHA mortar
Objective 2
To determine the durability of TRHA mortar
1.4 Significant of Study
This study can bring a lot of benefits to human and the environment. First of all, it
can reduce the environment impact that brings from cement and RH such as the
waste produce from them and CO2 emission especially during cement production and
its outcome. This study is tried to use the agriculture waste to replace construction
material whichis not environment friendly to reduce the emission of CO2 besides
reduce the agriculture waste.
The previous researches showed that it is possible to insert the RHA into the
concrete and mortar which can improve the performance such as compressive
strength and durability (Sata, Jaturapitakkul and Kiattikomol, 2007; Reddy and
Alvarez, 2006).Yet there are still many researches to modify the rice husk ash by
giving it some treatment to increase its effectiveness in concrete compare to raw rice
husk ash and it is succeed.
This study is very important to human because this technology shows that the
rice husk ash which originally was a waste and hazardous material to environment
can convert into useful material. For the experimental benefit is maybe can develop
an acid leaching method without insert additional heat the acid and something
different from previous studies. Moreover, this technology also can turn the rubbish
into money.

10
1.5 Scope of Study
This study is carry out within some scopes due to there are some limitation during
this research process. This study is more focus on the laboratory test to analyse and
investigate the workability, compressive strength of TRHA mortar compare to
control mortar.The limitation for this research is the flexural test will not be carry out
due to the material, TRHA not sufficient to carry out the specimens to do the test.
Apart from that, the compressive test for hardenedmortar will only conduct until 28
days testing age due to limitation of time. Each compressive strength test for mortar
will used three mortar cubes for each group at 3 days, 7 days and 28 days of mortar
testing age.
The TRHA is produced at 800oC. While the percentage of TRHA adds into
the mortar mixture is 5% which means the mortar cube contain of 5% volume TRHA
and 95 % volume cement binder. The mortarsare cast with the size of 50mm x 50mm
x 50mm.

11
Table 1.3 Details of the Mortar Mix Proportion
Mix
code
Ordinary
Portland
Cement,
kg/m3
Sand,
kg/m3
Water Ratio TRHA
1,
kg/m3
TRHA
2,
kg/m3
TRHA
3,
kg/m3
Super
plasti
cizer,
%
W/C Sand
Weight
, %
CTRL 733.33 1466.67 0.38 3.00 - - - 1.00
H 5 696.66 1466.67 0.38 3.00 26.77 - - 1.00
H10 659.99 1466.67 0.38 3.00 53.54 - - 1.00
H 15 623.33 1466.67 0.38 3.00 80.32 - - 1.00
TD 5 696.66 1466.67 0.38 3.00 - 26.77 - 1.00
TD 10 659.99 1466.67 0.38 3.00 - 53.54 - 1.00
TD 15 623.33 1466.67 0.38 3.00 - 80.32 - 1.00
FD 5 696.66 1466.67 0.38 3.00 - - 26.77 1.00
FD 10 659.99 1466.67 0.38 3.00 - - 53.54 1.00
FD 15 623.33 1466.67 0.38 3.00 - - 80.32 1.00
The TRHA 1 is the RH that treated by citric acid at 80oC for 15 minutes
meanwhile the TRHA 2 is RH treated by citric acid at room temperature for 72 hours
and TRHA 3 is citric acid treated RH at room temperature for 96 hours. All of the
citric acid used for leach the RH is 5 % concentration and they will dry at furnace
with 100 oC for 1 hour after washed three times and it is then send to burned at 800
oC for 3 hours.

12
The flowtable test is use to carry out the workability of the TRHA mortar
which follow the standard of ASTM C 1437 and the compressive strength determine
by destructive compressive strength test.
Table 1.4 Tests with the Standard to Investigate the Mechanical Properties
and Durability of TRHA Mortar
Test Standard Type Size
Flow Table ASTM C 1437 Fresh Mortar
-
Compressive
Strength
BS EN 12390-4
(2000) Cube
50mm x50mm
x50mm
Porosity RILEM CP 11.3 Cylinder 45mm diameter x
40mm height
Gas Permeability Lynsdale Cabrera
1984 Cylinder
45mm diameter x
40mm height
1.6 Chapter Outline
Chapter 1: Introduction
Cement and RHA are discussed in this chapter to have a clear mind-set about them.
In this chapter also discuss the problems that bring by cement and RHA either
toward concrete or environment, aim and objectives of this study, significant and
scope of this study.

13
Chapter 2: Literature Review
This chapter will discuss the experiments or studies done by previous researchers to
collect some data make this research become successful. Previous researchers’
experiences and conclusion are very useful for a new study.
Chapter 3: Research Methodology
The materials use in this study and tests that conduct to achieve the objectives will be
discuss and the whole process of the experiment can be more understand at this
chapter.
Chapter 4: Results and Discussion
The result collected from the tests will be record and analyse in this chapter.
Chapter 5: Conclusion and Recommendations
The recommendations and the conclusion of this research will be state in this chapter
to let the next researcher won’t repeat the mistake or get better result.

14
CHAPTER 2
LITERATURE REVIEW
2.1 Introduction
This chapter will discuss about the concrete and the materials used to form the
concrete, the RHA and some previous research about RHA in concrete. This is very
important to make sure the study that will carry out later be successful.
2.2 Concrete
Concrete is the mixture of cement, supplementary cementitious material, water,
aggregates, and chemical mixtures in suitable proportion to obtain a better result in
setting time, workability, strength, time to gain strength etc. This type of concrete
was the normal concrete that for normal use, it is insufficient for the high quality
concrete production. For the concrete that use at the special area such as jetty should
be modified by add some other materials. A hardened concrete been defined as brittle
material and has low tensile strength, to make it achieve the higher level tensile
strength, the fibre or reinforcement bar was added in. When casting the concrete, the
proportion must be taking correctly because the ratio will affect the hardened
concrete strength. Besides that, the concrete making process must be look seriously
and carefully which the concrete should be mixed, placed and cured properly (Nawy,
2008).

15
Concrete has different grades which represent different compressive strength
gain by the hardened concrete at the first 28 days. For example concrete grade 30
produced 30 Newton per square millimetre at 28 days. The concrete been designed
with different grades is because different grades of concrete have different
applications.
Table 2.1 Concrete Application Grades (Expertsmind.com, n.d.)
Grade Mix proportion
Compressive
strength on
28days, Nmm-2
Group (IS: 456-
2000)
M5 1:5:10 5
Lean mix
M7.5 1:4:8 7.5
M10 1:3:6 10
Ordinary concrete
M15 1:2:4 15
M20 1:1.5:3 20
M25 1:1:2 25
Standard concrete
M30
designed
30
M35 35
M40 40
M45 45
M50 50
M55 55
M60 60 High strength
concrete

16
2.2.1 Portland cement
Portland cement act as a binding agent or instant glue when water is added to bonds
the coarse aggregate, fine aggregate and sometimes the other materials such as steel
fibre to form a concrete (Mamlouk and Zaniewski, 2006). The cement can fill up the
voids that formed by coarse and fine aggregates and produce the strength to the
concrete when the concrete is setting and hardened due to its reaction with water.
2.3 Rice Husk
RH contains of high quantity of amorphous silica and carbon. In India, around
125,000 small rural villages are lack of electricity supply. People tried to use RH to
solve the problem and husk power system was formed which the RH acted as fuel to
generate power. First of all, RH is heated by high temperature until it decomposes
and release a type of combustible gas. After that, the power will be generated by the
turbine which burned the combustible gas released from RH to produce steam or heat
(Opic.gov, n.d.). The power generated from it around 25kW- 100kW (Santiaguel,
n.d.). The product from heated RH will be sending for other uses such as
construction industry.
Figure 2.1 Rice Husk

17
Table 2.2 Composition of Rice Husk (Bogeshwaran et al., 2014).
Composition Percentage (%)
Cellulose
Hemi Cellulose
Lignin
Mineral Ash
Water
Extractives
31.12
22.48
22.34
13.87
7.86
2.33
2.4 Rice Husk Ash
RHA obtained from incineration of RH. In every incineration of RH, there will
produce 20-22 % of RHA and silica was consists of more than 75 % of the RHA total
weight (Ramezanianpour, Mahdi Khani and Hmadibeni, 2009). RHA can be
categories as a renewable resource that can produce for annually while natural
pozzolan is not. Most of the study were carried out prove that 5-10 % of RHA
replaced the cement in the concrete succeed increased the strength of the
concrete(Taylor, 2004).
Many benefits can get by insert the RHA into concrete mixture as natural
admixture. Besides the strength can be improve, the problem and cost use to deal the
RHA also can solved.
Figure 2.2 Rice Husk Ash

18
2.4.1 Properties of Rice Husk Ash
Once the RH is completely burnt, the cellulose and lignin will be completely
removed and remained silica ash. RHA at certain control temperatures have the
chemical and physical properties that met American Society for Testing and
Materials (ASTM) Standard C618-94a. The percentage of amorphous SiO2 in RHA
depends on the temperature, period of burning and thermal treatment’s environment.
Typically the higher the thermal treatment temperature, the higher the SiO2 can
obtain in the RHA. The percentage of SiO2 normally is between 87-92 % of the RHA
(Ugheoke and Mamat, 2012). When the temperature is within 550-800 oC, the higher
the temperature, the more crystalline silica produced (Reddy and Alvarez, 2006).The
temperature also will affect the colour of RHA; RHA produced between 300-450 oC
was carbonised husk while those heated 500-650 oC was grey-coloured ash (Kapur,
1985).
Figure 2.3 Carbonised RH and RHA
2.5 Pre-treatment of Rice Husk Ash
Although the SiO2 obtained from burned raw rice husk (RRH) was around 92 % but
there were still have many researchers carry out studies try to improve the SiO2 in
RH. The SiO2 will react with calcium hydroxide during hydration of cement. Once
the reaction completely done, it will produce calcium silicate hydrate which is a
substance that can improve the concrete’s mechanical properties and it durability.

19
Researchers found that by applying some treatment for RH before thermal
treatment can improve the SiO2 content in RHA. Therefore many studies were
carried out to investigate the most effective way to increase the volume of SiO2 in
RHA.
Typically there are three types of treatment generally used by people to
increase the content of SiO2 in RHA, for example acid leaching, basic pre-treatment
and microbiological pre-treatment (Ugheoke and Mamat, 2012). Acid leaching
actually is a pre-treatment for RH. Firstly the RH will be send to do a treatment
which soak in the acid with certain temperature and period. After that soaking
process, the RH will be washing few times until there is totally free from acid and
will send for thermal treatment with certain temperature. While the alkali pre-
treatment also has the same procedures as acid leaching, it just change the acid into
alkali. From the result, researchers found that acid leaching pre-treatment was shown
a better result than alkali pre-treatment which used sodium hydroxide (NaOH) and
ammonium hydroxide (NH4OH) as the leaching agent. The acid is more effective in
removing the metallic impurities in RH than alkali. Some of the researchers tried the
post-treatment for RHA which use the acid and alkali to remove the metallic
impurities in raw RHA. However the result obtained was shown negative (Ugheoke
and Mamat, 2012). Moreover, although there is a similarity shown in the result of
using the microbiological pre-treatment and acid leaching but the time to complete
the microbiological pre-treatment is longer than acid leaching. Hence researchers
concluded that pre-treatment is the effective and appropriate way to remove the
metallic impurities in RH.
There were some studies about acid leaching pre-treatment had been carried
out and shown that hydrochloric acid (HCl) can effectively remove the metallic
impurities (Kurama and Kurama, 2003; Ugheoke and Mamat, 2012; Salas et al.,
2009). One of the researches was shown that HCl more effective than sulphuric acid
(H2SO4)and followed by nitric acid (HNO3) in removing metallic impurities in RH,
the SiO2 can be obtain approximately 95 % by using HCl (Ugheoke and Mamat,
2012).

20
2.5.1 Hydrochloric Acid as Acid Leaching Agent
As many studies shown that HCl was a more effective acid leaching agent, hence
there was a study carried out to determine the optimum concentration of HCl, time of
contact between HCl and RH and it leaching temperature to get better result. The
pre-treatment’s procedures in this study are similar to other acid leaching pre-
treatment. Firstly RH was washed to remove the impurities by water to get the pure
RH for the test. After that they were weighted and put into HCl solution with 100ml.
This experiment was carried out by 1, 2, 3 M of HCl at the temperature of 25 oC, 60
oC and 90
oC with different contact times. All RH were burned at 700
oC which been
defined as the optimum thermal treatment (Kula et al., 1996).
The result shown that the SiO2 was rose from 88 % to 97 % when the time for
RH contacted to 1 M acid at 25 oC increased 2 hours and it remained constant at 97 %
as the contacting period increased every 2 hours (Kurama and Kurama, 2003). In this
experiment, the concentration of acid did not showed any linear relationship to
volume of SiO2 in RHA. It showed a fluctuating however 2 M HCl had 99.50 % of
SiO2.
The temperature was showed that 60 oC is the appropriate leaching
temperature to obtain maximum content of SiO2. Table 2.3 shows the RH reacted
with 1 and 2 M HCl at 25 oC, 60
oC and 90
oC.
Table 2.3 Relationship between Leaching Agent’s Temperature and the
Different Concentration of HCl (Kurama and Kurama, 2003)
Temperature,oC SiO2, %
1 M HCl 2 M HCl
25 97.63 99.50
60 98.44 99.74
90 98.44 99.74

21
Other study was carried out by Krishnarao, Subrahmanyam and Jagadish
Kumar on 2001 to investigate the relationship on the SiO2 obtained from TRHA and
the methods of thermal treatment. The RRH were separated into three groups where
two groups leached by 3 N HCl (TRH1) and 5.6 N HCl (TRH2) for 1 hour in boiling
condition and another group without any treatment. The treated rice husk (TRH)
were washed to remove acid and dried at 110 oC before sent to burn at 400
oC, 500
oC, 600
oC and 700
oC. However this study used two types of thermal treatment:
normal heating and sudden heating. Normal heating was the TRH put into the
furnace at room temperature and heated to the required temperature. Meanwhile the
sudden heating was direct put the TRH into the furnace at required temperature.
The Table 2.4 shows that the SiO2 obtained from TRHA were more than raw
rice husk ash (RRHA) however there hadnot much different for the SiO2 obtained
from RRHA by normal heating and sudden heating.
Table 2.4 SiO2 (wt.%) in RHA Burned at 700 oC (Krishnarao,
Subrahmanyam and Jagadish Kumar, 2001)
RRH normal
heating
TRH1 normal
heating
TRH2 normal
heating
RRH
Sudden
heating
SiO2, wt.% 90.20 92.20 92.30 89.80
Moreover, an experiment was conducted to investigate the SiO2 content in
RHA when it leached with acid at room temperature. This experiment carried out by
Salas et al. to compare the SiO2 obtained from RRH and TRH where the TRH was
used HCl as acid leaching agent with concentration of 1 N and the RH was soaking
in HCl for 1 day at room temperature. The TRH was washed to remove the acid
completely until TRH shows neutral pH value. Both RRH and TRH were sent to
burn at temperature of 600 oC for 3 hours.
22
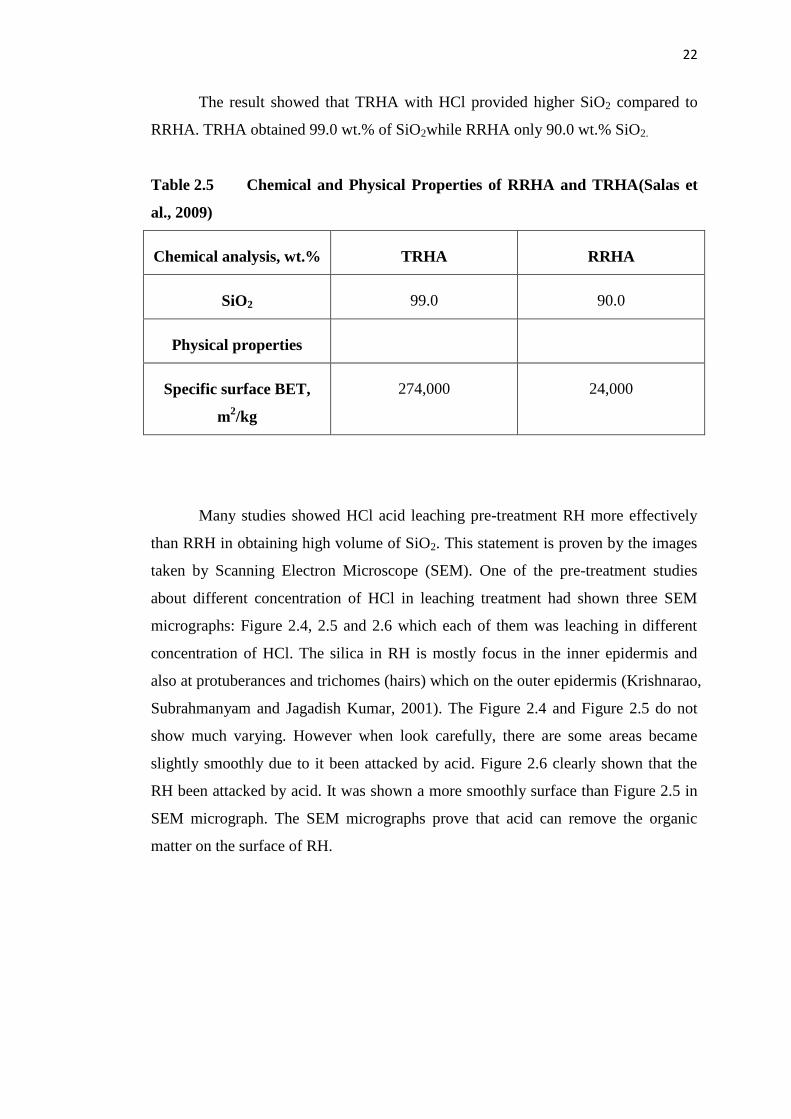
The result showed that TRHA with HCl provided higher SiO2 compared to
RRHA. TRHA obtained 99.0 wt.% of SiO2while RRHA only 90.0 wt.% SiO2.
Table 2.5 Chemical and Physical Properties of RRHA and TRHA(Salas et
al., 2009)
Chemical analysis, wt.% TRHA RRHA
SiO2 99.0 90.0
Physical properties
Specific surface BET,
m2/kg
274,000 24,000
Many studies showed HCl acid leaching pre-treatment RH more effectively
than RRH in obtaining high volume of SiO2. This statement is proven by the images
taken by Scanning Electron Microscope (SEM). One of the pre-treatment studies
about different concentration of HCl in leaching treatment had shown three SEM
micrographs: Figure 2.4, 2.5 and 2.6 which each of them was leaching in different
concentration of HCl. The silica in RH is mostly focus in the inner epidermis and
also at protuberances and trichomes (hairs) which on the outer epidermis (Krishnarao,
Subrahmanyam and Jagadish Kumar, 2001). The Figure 2.4 and Figure 2.5 do not
show much varying. However when look carefully, there are some areas became
slightly smoothly due to it been attacked by acid. Figure 2.6 clearly shown that the
RH been attacked by acid. It was shown a more smoothly surface than Figure 2.5 in
SEM micrograph. The SEM micrographs prove that acid can remove the organic
matter on the surface of RH.

23
Figure 2.4 SEM Micrographs of Outer Epidermis of RRH (Krishnarao,
Subrahmanyam and Jagadish Kumar, 2001)
Figure 2.5 SEM Micrographs of Outer Epidermis of RH Treated by 3 N
HCl(Krishnarao, Subrahmanyam and Jagadish Kumar, 2001)
Figure 2.6 SEM Micrographs of Outer Epidermis of RH Treated by 5.6 N
HCl(Krishnarao, Subrahmanyam and Jagadish Kumar, 2001)

24
2.5.2 Oxalic Acid as Leaching Agent
The RH was put into oxalic acid with temperature of 90 oC and 1 M concentration
for 1 hour. After 1 hour, it was placed at other place to lower down it temperature
and the TRH continue soaked in the oxalic acid for 20 hours before it sent to remove
the oxalic acid completely. The TRH was put into oven with 110 oC temperature to
let it dry for 1 day. After 1 day drying process, a thermal treatment been carried out
by 700 oC with difference hours where 1 to 6 hours. TRH were used to compare to
raw RH (RRH) with 3 difference hours.
The result shown that TRHA have the higher SiO2 content than RRHA. Table
2.6 shows the oxalic acid TRHA burned for 3 hours contained the highest percentage
of SiO2 which 91.26 % among those six specimens.
Table 2.6 SiO2 of RRHA and TRHA by Oxalic Acid which Burned at 700
oC(Olawale et al., 2012)
Thermal
Treatment
Hour
1 hour 3 hours 6 hours
Types of
RHA
RRHA TRHA RRHA TRHA RRHA TRHA
SiO2, % 86.78 89.87 89.16 91.26 88.74 89.92

25
2.5.3 Dilute Sulphuric Acid (H2SO4) as the Acid Leaching Agent
Using the high concentrated strong acid to running the treatment for RH is not an
ideal way to remove metallic impurities in the RH. Hence an experiment using a
dilute strong acid which has 5 % concentrated H2SO4 to leached the RH. The RH is
leached in volume of 500 ml H2SO4 with 5 % concentration in 44 oC for 15 minutes.
After that it was dried at 100oC and burned at two different temperatures which are
600 oC and 1000
oC.
The result showed that dilute acid didn’t change the morphology of the RH.
The SEM shown the RRH and TRHA has high similarity appearance. Dilute H2SO4
only removed some of the metallic impurities on the surface. This study stated that
the dilute acid was quite different from high concentration acid where high
concentrated acid can caused the RH become fragment but dilute acid was not.
Figure 2.7 The SEM of RRH and TRHA by H2SO4(Umeda, Kondoh and
Michiura, 2007)

26
This study concluded that the concentration of H2SO4 below 3 % is enough to
break the impurities from the RH. The SiO2 can be obtained more up to 99.3 wt.%
when the temperature of thermal treatment is higher.
2.5.4 Citric Acid as the Acid Leaching Agent
The previous study shows that citric acid is useful to remove the metallic impurities
in RH to increase the SiO2 in RHA after combustion (Umeda, Kondoh and Michiura,
2007; Umeda and Kondoh, 2008). One study was carried out to determine the
optimum concentration for citric acid and the temperature to leach the RH. This
research was investigated the effect of citric acid concentration used for leach RH
and temperature when leaching the RH.
The experiment was used citric acid with 1 % to 7 % concentrated citric acid
to leach the RH with difference temperature started from 25 oC to 80
oC for 1 hour
and the RH was stirred all the time. After the acid leaching process, the RH was
washed with 20 oC distilled water for 15 minutes and dried at 100
oC for 1 hour.
Lastly the leached RH sent to received thermal treatment at 800 oC for 30 minutes.
Table 2.7 shows the RH undergo 1% of concentrated citric leaching for 1 hour at 50
oC produced 99.52 % of SiO2 in TRHA meanwhile Table 2.8 shows that RH treated
by 5 % concentrated citric acid at 80 oC can produced 99.77 % of SiO2 in TRHA.
Table 2.7 SiO2 in Citric Acid Leached RHA at 50 oC with Difference Acid
Concentration (Umeda, Imai and Kondoh, 2009)
Citric acid solution concentration, %
0 1 3 5 7
SiO2
obtained, %
97.25 99.52 99.54 99.56 99.47

27
Table 2.8 SiO2 in Citric Acid Leached RHA with 5% Concentration at
Difference Temperature (Umeda, Imai and Kondoh, 2009)
Citric acid solution temperature, oC
25.0 40.0 50.0 60.0 80.0
SiO2
obtained, %
99.25 99.54 99.56 99.58 99.77
2.5.5 Comparison between Citric Acid and HCl Acid Treatment for RRH
A previous study was carried out to investigate the percentage to replace the citric
acid to the strong acid, HCl in leaching the RH to get more SiO2 in RHA. These
studies have three groups of specimens which were RRH, citric acid treated RH
(TRH1) which leached by 5 % concentrated citric acid with temperature of 80 oC for
15 minutes to 20 minutes and HCl treated RH (TRH2) which leached by 10 %
concentrated HCl with temperature of 100 oC for 2 hours. After removed the acid and
dried at 100 oC for 1 hour, the RHs were sent for thermal treatment for 5 hours at 750
oC. TRH1 produced more SiO2 than TRH2 after thermal treatment hence citric acid
could be used to replace HCl for leaching due to it is harmless compare to HCl.
Table 2.9 SiO2 Content in RHs after Thermal Treatment of 750oC Analysed
by XRF (Sapei, Pramudita and Widjaja, 2014)
Wt.% SiO2
Without any leaching 91.5
Leached by citric acid 99
Leached by HCl 98.8

28
Besides that, one more study is carried out by three types of treatment for RH
to get high percentage of SiO2 where the first method was conduct the treatment for
RRH with hot organic acid before the thermal treatment; second method was same
with first method but replaced the hot organic acid by the boiling water while the
third method was a post-treatment for RHA which RH had been burned at 250 oC
and milled into powder.
This experiment separated into 5 processes: A, B, C, D and E where: Process
A was the RRH directly received thermal treatment of 900 oC with a period of 6
hours. Process B was the RRH leached with 5 wt.% of HCl with 1 hour long period
under 150 oC. The TRHA was then washed and undergoes 2 hours thermal treatment
at 500 oC. Process C was replaced the HCl by citric acid and 700
oC thermal
treatment while the other steps remained unchanged. Process D was consisted three
different times of washing (1, 2 and 3 times, each time with 1 hour) to wash the
TRHA with 150 oC hot water and followed by 2 hours thermal treatment at 700
oC.
Process E was used the RH which finished the half an hour thermal treatment at 250
oC and been milled into powder before receive the treatment almost same as Process
B to Process D with 700 oC thermal treatment.
The result on Table 2.10 shows that Process B and C have the higher
percentage of SiO2 which 99.5 % and 99.3 %. This experiment showed that acid
leaching was more effective than hot water treatment and sent the RH to burned and
milled it became powder before received treatment are not helping in increase the
percentage of SiO2 in RHA.

29
Table 2.10 The Percentage of Silica of the RHA (Souza, Magalhães and
Persegil, 2002)
Process SiO2, %
A 94.0
B 99.5
C 99.3
D-i (treated with hot water for 1 hour) 97.6
D-ii (treated with hot water for 2 hour) 98.8
D-iii (treated with hot water for 3 hour) 99.1
E-i (treated with boiling HCl for 2 hour and
burned for 6 hours)
98.9
E-ii (treated with hot water and burned for
2 hours)
96.6
E-iii (treated with tap water and burned for
6 hours)
96.0
E-iv (directly burned 6 hours after became
black colour powder)
94.0
2.5.6 Comparison between Citric Acid and H2SO4 Acid Treatment for RRH
This study was to compare the effectiveness of citric acid and sulphuric acid in
remove metallic impurities on RH. The reasons to used citric acid to do a comparison
to H2SO4 are strong acids have economical problem for the equipment use to
withstand themselves during acid leaching and the water treatment for strong acid

30
removed from leaching treatment. Moreover it also brings the hazardous to human
being and the surround environment (Umeda and Kondoh, 2008).
The test was carried out by soaked each 20 grams of RH in 500 ml of H2SO4
and citric acid with 5 % concentration for 15 minutes while the temperature was kept
at 50 oC. A thermal treatment of 800
oC is introduced to TRH after removed the acid
completely. The result showed that citric acid leaching more effective in removing
metallic impurities on RH hence it can increase the quantity of SiO2 in RHA.
Table 2.11 SiO2 Obtained in RHA at 800oC Thermal Treatment for RRH,
Citric Acid Treated RH and H2SO4 Treated RH (Umeda and Kondoh, 2008)
RHA SiO2, wt.%
Without any acid leaching 94.58
Leached by citric acid 99.14
Leached by H2SO4 90.99
2.6 Concluding Remark
There were many researches regarding to the present of RHA in concrete and mortar
to test their performances such as workability, compressive strength, frost resistance
and etc. Those studies showed the temperature to prepare the RHA, RHA percentage
in mixed concrete and etc are very important to the concrete’s performances. It
proven that the RHA can improve the performances of the concrete and mortar.
Hence the future study can be conduct to find out the most appropriate mix
proportional and temperature with the right pre-treatment of RH for the RHA to
improve the performances of concrete and mortar.

31
However there is rare study shows which type of acid is the most effective
leaching agent in remove the metallic impurities in RH. This is because different
temperature, period of treatment and concentration of acid will give different results.
Based on previous studies, citric acid pre-treatment showed slightly more effective
than HCl that it can produce 99.77 % of SiO2 in TRHA. Howeverthe research study
on the effect of the room temperature citric acid with difference leaching period
towards RH is rarely found.

32
CHAPTER 3
RESEARCH METHODOLOGY
3.1 Introduction
To achieve the aim of this study, the materials of TRHA will be determined and few
tests are carrying out to analyse the mortar’s properties.
3.2 Material
Since the aim of this research is to determine the optimum replacement ratio of
TRHA in mortar hence the TRHA is the most important element and also other
materials in composition of designed TRHA mortar. Those other materials included
ordinary portland cement (OPC), fine aggregate and water.
3.2.1 Portland Cement
The first “Portland” cement was found on 1824 by Joseph Aspdin, and the real or
true Portland cement produced 20 years later. The cement will have the chemical
reaction when it contact to the water (Nawy, 2008). The cement act as an agent to
bind all other materials in the concrete mixture, it will become harden after the react

33
with water. The cement used for this research is Tasek Buaya cement. This cement
quality was assured by MS EN 197-1: 2007 and it also certified by EN 196 . This
cement must be place on a place that avoids any contact with water to prevent
cement become hardened. Figure 3.1 indicates the ordinary portland cement that will
be used to carried out the research.
Figure 3.1 50 kg TasekBuayaOrdinary Portland Cement
3.2.2 Treated Rice Husk Ash
Rice husk is a convex shape and yellowish colour thing act as a protection agent to
protect rice grain from the insects and natural weather. A paddy consists of rice
(72 %), bran (5-8 %) and rice husk (20-22 %) (Yuzer et al., 2013). That means for
every 100 kg of paddy there will has approximate 22 kg of rice husk. It is the by-
product when the rice produced and it is important for this research. The RH used for
34
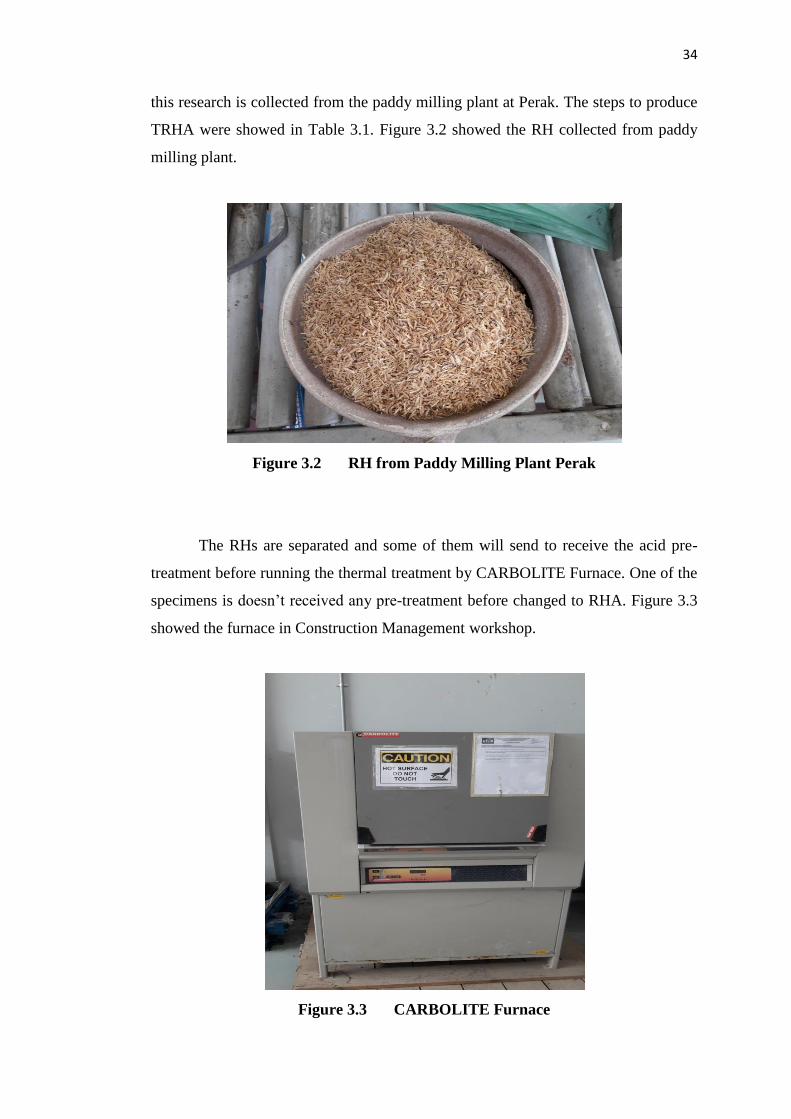
this research is collected from the paddy milling plant at Perak. The steps to produce
TRHA were showed in Table 3.1. Figure 3.2 showed the RH collected from paddy
milling plant.
Figure 3.2 RH from Paddy Milling Plant Perak
The RHs are separated and some of them will send to receive the acid pre-
treatment before running the thermal treatment by CARBOLITE Furnace. One of the
specimens is doesn’t received any pre-treatment before changed to RHA. Figure 3.3
showed the furnace in Construction Management workshop.
Figure 3.3 CARBOLITE Furnace

35
Meanwhile another three specimens were been leached by 5 % concentrated
citric acid by difference heat during acid leaching process and difference period.
After the acid leaching process, they will send to remove the acid by washing with
water. The thermal treatment will be conduct to these TRHs with temperature of 800
oC. The TRHAs are then grinding to become fine particles with 75 μm and it will be
weighted before it use to carry out this research due to its weight reduced during the
thermal treatment process. RH only left 20 %-22 % of its weight once became RHA
(Ramezanianpour, Mahdi Khani and Hmadibeni, 2009).
Table 3.1 Steps to Produce Difference TRHAs
RRH
5 % citric acid leaching
Wash three
times to
remove
acid
completely
Dry in
furnace
at 100
oC for 1
day
Thermal
treatment
at 800 oC
for 3 hours
80 oC
for 1
hour
Room
temperature
for 72
hours
Room
temperature
for 96
hours
3.2.3 Fine Aggregate
The fine aggregate was defined as the aggregate which can pass through the 4 mm
sieve which stated in BS EN 12620. Typically the fine aggregate collect from land
and marine. This fine aggregate is used more when there is a need of better surface
area. Typically, the aggregate will be sieved to get the diameter less than 4 mm
before mix with other materials to form concrete mixture. The fine aggregate used
for this research is mining sand that smaller than 1.18 mm diameter and it is shows in
Figure 3.4.

36
Figure 3.4 Mining Sand
3.2.4 Water
Water is the most important agent to have chemical reaction with cement to form a
glue effect to bind all the materials in the concrete mixture such as aggregate, rebar
etc. The water-cement ratio will affect the bonding strength between the cement
molecules. Typically the quality of the concrete will increase when it’s water: cement
ratio is decrease. However if the water: cement ratio is too low which is not listed in
the standard will give the negative result (Alawode and Idowu, 2011). Almost all the
water that is drinkable without any smell or taste is suitable to form the concrete.
However there is still a low portion of non-drinkable water that might still be able to
use for concrete making. Hence the tap water which met standard of BS EN 1008
from Lembaga Air Perak (LAP) is suitable to make the concrete since it was treated
and filtered for human daily uses. Besides that, the tap water also not acidic or
alkaline water that might affect the strength of the normal concrete. Figure 3.5
showed the water source for this research.

37
Figure 3.5 Water Source
3.2.6 Superplasticizer
Superplasticizer used to increase the workability of the fresh concrete without
affecting the w/c ratio. The workability of the fresh concrete affected by the mix
proportion of concrete, w/c ratio, quantity of fine aggregate in the fresh concrete, the
air content in fresh concrete and etc. However excess water, air content and fine
aggregate will affect the strength of the concrete and sometimes segregation may
occur when there is excess water in the fresh concrete. To prevent these kind of
problem happen, the plasticiser or superplasticizer was added during or before mix
the concrete.

38
Figure 3.6 Superplasticizer
Figure 3.6 showed the superplasticizer that will be used in this research.
Typically the superplasticizer should add with the weight around 1 % of the binders’
weight. This is because too much superplasticizer will cause the segregation in
concrete and directly affect the strength of the concrete. According to Salas et al.
(2009), it is necessary to add the plasticiser to the TRHA concrete to increase the
workability of the TRHA mortar.
3.3 Mix Proportion of TRHAMortar
To find out the most optimum replacement ratio for TRHA in mortar, many ratios
has been designed for running tests. The mix proportions of TRHA are show in Table
3.2. The TRHA 1 is the RH that treated by citric acid at 80 oC for 15 minutes
meanwhile the TRHA 2 is RH treated by citric acid at room temperature for 72 hours

39
and TRHA 3 is citric acid treated RH in room temperature for 96 hours. This
research carry out by replace 5 %, 10 % and 15 % of cement by volume with TRHA1,
TRHA 2 and TRHA 3.The weight of TRHA as partial replacement for cement is
calculate by the using the percentage of cement replacement weight divide 3.15
multiple 2.3.
Table 3.2 Mix Proportions Table for TRHA Mortar
Mix
code
Ordinary
Portland
Cement,
kg/m3
Sand,
kg/m3
Water Ratio TRHA
1,
kg/m3
TRHA
2,
kg/m3
TRHA
3,
kg/m3
Super
plasti
cizer,
%
W/C Sand
weigh
t, %
CTRL 733.33 1466.67 0.38 3.00 - - - 1.00
H 5 696.66 1466.67 0.38 3.00 26.77 - - 1.00
H 10 659.99 1466.67 0.38 3.00 53.54 - - 1.00
H 15 623.33 1466.67 0.38 3.00 80.32 - - 1.00
TD 5 696.66 1466.67 0.38 3.00 - 26.77 - 1.00
TD 10 659.99 1466.67 0.38 3.00 - 53.54 - 1.00
TD 15 623.33 1466.67 0.38 3.00 - 80.32 - 1.00
FD 5 696.66 1466.67 0.38 3.00 - - 26.77 1.00
FD 10 659.99 1466.67 0.38 3.00 - - 53.54 1.00
FD15 623.33 1466.67 0.38 3.00 - - 80.32 1.00

40
3.4 Mortar Mixing Process
Before mix the mortar, all the materials needed must be weight to make sure the
mortar mixture are same as the mix proportion that been designed before. The mortar
are mixing according to ASTM C 348. Due to this research is use different TRHA to
replace some portion of cement in the mortar, hence the weighted TRHA is mix with
the weighted cement with the ratio in mix proportion table before making the mortar
mixture. For H 10,659.99 kg/m3
of cement is mix with 53.54 kg/m3 TRHA 1 before
add in fine aggregate, water and superplasticizer. The well mixed OPC and TRHA
put in a yellow coloured container while the sand put in another container. 3% of
sand weight water is then pour into the sand and mix well before add in the OPC and
TRHA. The superplasticizer is pour into the water and stir well. Next, insert all the
OPC and TRHA into sand's container and mix them. After that, 50 % of water and
plasticiser will be added to the dry mixture and mix again. Finally the remaining
water is added to the mixture. The mortar mixture is always ensuring to mix evenly
during the mixing process.
After complete the mixing process, the mortar mixture is cast in the mould
and a rectangle wooden stick will be used to make the concrete mixture spread
evenly in the mould by remove some of the air trapped in the mortar mixture during
pour into the mould. The mortar mixture in the mould is then put in Construction
Management workshop to avoid direct sunlight towards the mortar mixture and any
vibration on it. According to BS EN 12390-2 (2009), the specimens should be place
at the temperature of 20 °C ± 5 °C or 25 °C ± 5 °C for the higher temperature
countries. Figure 3.7 illustrates the mortar casted in the mould.

41
Figure 3.7 Mortar Casted in the Mould
3.5 Cast, Mould and Demould Mortar
The objective of this research is to find out the mechanical properties of the TRHA
concrete hence few tests must be conduct for this research. Due to the test for this
research will be carry out by laboratory test, hence the mortars are cast with two
sizes; 50 mm x 50 mm x 50 mm and cylinder with 45 mm diameter and 40 mm
height. The mortar is cast to the dimension of 50 mm x 50 mm x 50 mm for running
compressive strength test while the cylinder is use for porosity and permeability test.
Figure 3.8 illustrates the mould use to cast mortar cubes.
The mould will be make sure clear from any substances and coat it by used
engine oil to let the mortar easier to remove from mould. The mortar mixture is pour
into mould by two times. Each time mortar mixture poured into the mould, the
rectangle wooden stick will be used by to remove the air that formed void in mortar
mixture. The cement trowel used to remove the excess fresh concrete once it
completely filled the mould. The mortar will be removed from the mould after 24
hours later and marked by marker to avoid any mistake.

42
Figure 3.8 Mould Use to Cast 50 mm x 50 mm x 50 mm Mortar
3.6 Curing
Curing actually is a process to provide suitable water content and satisfactory heat to
concrete for a certain time (Mamlouk and Zaniewski, 2006). Hence, once the
concretes demoulded from the mould, they will have the curing process according to
the BS EN 12390-2 (2009) by tap water from LAP with the temperature of 25 °C to
29 oC until the age for testing strength. The ages for testing strength are 3 days, 7 day
and 28 days. Figure 3.9 shows the place that the mortar undergo curing process.

43
Figure 3.9 Mortar Curing Process
3.7 Tests for the Fresh and HardenedMortar
In this research, there are few tests will be carried out for identified the performance,
mechanical properties of the mortar. The tests that will be conducted are flow table
test, compressive strength test,porosity test and gas permeability test. These tests are
necessary for determine the workability of fresh mortar, compressive strength and
the void in the hardened mortar. Those tests that will be carried out during the
research was showed in Table 3.3.

44
Table 3.3 Tests' Details for Fresh and Hardened Mortar
Test Testing age, days No. of mortar
Flow Table - -
Compressive Strength
3 3
7 3
28 3
Porosity 28 3
Gas Permeability 28 3
3.7.1 Flow Table Test
When the fresh concrete has high workability, it is easy to handle and flowing into
the formwork and around reinforcement. It can avoid the percentage of void forming
in the hardened concrete. When the workability too low, the fresh concrete very hard
to pour and separate evenly to the formwork. However when it is too high, there will
occur segregation and bleeding which will affect the strength of the hardened
concrete. In this study, the flow table test is the test that to identify the fresh mortar’s
workability.
The flow table test is carried out by follow the ASTM C 1437 which the
mortar mixture is fill into the mould by two layers. Firstly, the mould must put in the
centre of flow table disc before insert the mortar. Every layer filled with mortar
mixture must be compact with at least 10 strokes of wooden stick. After the mould
full with the mortar mixture, remove the mould by raising it carefully and switch on
the start button for the flow table machine. Figure 3.10 shows the flow table machine
that will be used to carry out the test.

45
Figure 3.10 Flow Table Test Equipment
The flow table machine will start to let the disc rises and drops for 25 times.
The disc has 4 straight lines as guide line. Measure and record the diameters of the
mortar by using the straight lines as guide line. After that remove the fresh mortar
and wipe the disc by a wet cloth and the mould is send to wash by clean water to
avoid the mortar from getting hardened.
3.7.2 Compressive Strength Test
The hardened concrete is send to the compressive strength test to determine the
compressive strength of the concrete. It is important to those concrete that used as the
structural member in a building such as footing, column, beam and etc. The
compressive strength test is carrying out according the BS EN 12390-4:2000. Due to
it is a destructive test for strength test, hence it only test on the concrete or mortar
cube after conducted rebound hammer test. In this research, the mortar cube with size
of 50 mm x 50 mm x 50 mm is send to the compressive machine and the machine
will exert the force towards the mortar cube until the mortar cube fail to withstand
the force. The result is record for the investigation of mortar strength. The Figure

46
3.11 demonstrates the compressive strength test machine which will be used for
testing the mortar's strength.
Figure 3.11 Compressive Strength Test Machine
3.7.3 Porosity Test
Porosity is one of the factors that affect the concrete's durability. Porosity is measure
the void inside the concrete or mortar. The amount of porosity increased, the shorter
the durability for the concrete. The porosity test that will be carried out in this
research follow RILEM CP 11.3, it required the sample size with 45mm diameter
and 40mm height. These cylinders will put in the oven for 24 hours. After 24 hours
of dehydration process, the cylinders are then send to weighing and marking one by
one. When all the cylinders done marking and weighing, they will be moved into a
glass desiccators and the opening will seal by silicone gel. Next step is switch on the
generator for 15 minutes to let the glass desiccators in a vacuum state and 3 hours
later switch on the generator again for 15 minutes and left it for 24 hours. Take out
the samples, dry them by cloth and weight them in water and air one by one.
47
3.7.4 PermeabilityTest
According to Neville and Brooks (2010), the permeability test is used for checking
the durability of the concrete which will affect the lifetime of the building by
determine the rate of water or gas flow through the concrete. The permeability test
will be carrying out according to Lynsdale Cabrera 1984. The mortar cylinder with
45 mm diameter and 40 mm height will be used to conduct the test at 28 days of
testing age. This test is useful for mortar in the structures such as sewerage tanks and
gas purifiers to avoid the poisonous gas escaped from those structure.

48
CHAPTER 4
RESULTS AND DISCUSSION
4.1 Introduction
This chapter discussed the results getting from the laboratory tests and analyse those
results. The performances of mortars which replaced 5%, 10% and 15% OPC by
different methods of treated rice husk ash were evaluated and compare their
performances with the conventional mortar. Those performances are in term of
mortar's workability, compressive strength, void inside the mortar and it's
permeability ability against gas.
4.2 Rice Husk Ash Production
The RH was treated in heated citric acid for 1 hour, leached with citric acid in room
temperature for 72 hours and leached with citric acid in room temperature for 96
hours. The acid pre-treatment can remove the metallic impurities in the raw rice husk
(Kurama and Kurama, 2003; Ugheoke and Mamat, 2012; Salas et al., 2009). The
weight of the RRH after pre-treatment was reduced around 15.8% - 15.97%. It is
most probably that the citric acid removed the impurities in the RH.

49
Table 4.1 Weight of TRHAs
Code
TRHA 1
80°C, 1 hour
(Umeda, Imai and
Kondoh, 2009)
TRHA 2
26°C, 72 hours
TRHA 3
26°C, 96 hours
Weight before
treatment, g 1000
Weight after
treatment, g 840.3 842.0 841.2
Wash 3 times remove acid and dry in oven for 24 hours
Incineration with 800°C for 3 hours
Weight after
incineration/
1000g leached
RHA
153.0 153.0 154.00
From this research, the most effective pre-treatment is leached by heated
citric acid in term of weight which showed in Table 4.1 where the weight of TRHA 1
loss greater than TRHA 2 and TRHA 3. It produced up to 99% of SiO2 (Umeda, Imai
and Kondoh, 2009). Besides that, the result also shown that the longer the period of
leaching, the higher the weight loss. It is most probably that the period of leaching
affected the amount of impurities being removed.
4.3 Mortar Performances
To achieve this research's objectives, where determine the durability and mechanical
properties of treated rice husk ash mortar with different types of treated rice husk
ashes and it replacement volume to cement in mortar, few tests were carried out.
Those tests included flow table test, compressive strength test, porosity test and gas

50
permeability test.Figure 4.1 showed the sequence of those tests which were carried
out to investigate the performances of the mortars.
Figure 4.1 Mortar Performance Tests' Flowchart
4.3.1 Flow Table Test
The workability of the concrete is the ability of fresh concrete fill up the formwork
that contained of rebar without exert any vibration on it. In this research, the
workability of fresh mortar was determined by using flow table test. This flow table
test is carried out according ASTM C 1437. The fresh properties of specimens were
tested and the results are showed in Table 4.2. The results were obtained by using the
equation as shown in Equation 4.1.
Flow = 𝐷1−𝑑
𝑑𝑥 100
Where :D1 = diameter of flow
d = original diameter (100.0 mm)
(4.1)

51
Table 4.2 Flow Table Test Result
Mix
Code
Flow diameter, mm Average flow
diameter, D1(mm)
Flow
One Two Three Four
CTRL 200.0 203.0 192.0 195.0 197.5 97.5
H 5 188.0 190.0 185.0 185.0 187.0 87.0
H 10 145.0 135.0 135.0 130.0 136.3 36.3
H 15 130.0 130.0 125.0 125.0 127.5 27.5
TD 5 175.0 177.0 180.0 185.0 179.3 79.3
TD 10 135.0 138.0 138.0 140.0 137.8 37.8
TD 15 130.0 130.0 134.0 130.0 131.0 31.0
FD 5 160.0 160.0 160.0 160.0 160.0 60.0
FD 10 135.0 135.0 135.0 135.0 135.0 35.0
FD 15 113.0 113.0 110.0 118.0 113.5 13.5
Figure 4.2 showed the flow of the conventional mortar and TRHA mortar
with different portions of cement replacement. The graph showed the conventional
mortar has the highest flow 97.5, among all other specimens in this research. While
the fresh mortar with 15 % cement replacement by four days treated rice husk ash
showed the lowest flow of 13.5. From the graph, it can be seen that the percentage of
TRHA replace cement increases, the fresh properties of the mortar will decreases.
The fresh properties of TRHA mortar lower than control mortar because the TRHA
has the properties of water absorption due to the RHA has high specific surface area
(Ganesan, K., K. Rajagopal,2008). It will absorb the water during the mortar mixing
process and affect the water cement ratio. Hence the result getting from this
experiment showed valid and reasonable.Besides that, as the workability decreased,

52
the porosity also decreased. This is because the chemical reaction of TRHA in
forming C-S-H gel which required water and it water absorption properties (Kartini,
Mahmud and Hamidah, 2010) hence the porosity and the workability decreased as
the amount of TRHA increased.
Figure 4.2 Flow Table Test Result Bar Chart
4.3.2 Compressive Strength Test
Compressive strength is the test that falls under mortar mechanical properties. The
mortar specimens that required for this test are with size of 50 mm x 50 mm x 50 mm
cube. These cubes were cured at the curing tank for 3 days, 7 days and 28 days.
When the cubes reached their testing age, they were sent to receive the compressive
strength test. Table 4.3 showed the 3 days, 7 days and 28 days compressive strength.
According to Khassaf, Jasim and Mahdi (2014), the strength of cement
binders that contained of RHA will started gain higher at the later period. From
Figure 4.3, it can be seen that most of the TRHAs mortars 28 days compressive
strength are lower than control mortar. It is because when the amount of TRHA in
mortar increase, the amount of cement will decrease and it will cause the capillary
0
20
40
60
80
100
120
Control 80°C TRHA Three daysTRHA in roomtemperature
Four daysTRHA in roomtemperature
5 % TRHA replacement
10 % TRHA replacement
15 % TRHA replacement
Without TRHA

53
pore volume increase. The capillary pore will cause the calcium hydroxide
accumulate on the interface. When this situation happened, the structures are less
compact compared to conventional mortar hence the strength reduced (Khassaf,
Jasim and Mahdi, 2014). According toNguyen (2011), when the amount of RHA in
the mortar is higher, it will absorb the water and affect the cement hydration process
at the beginning. As the time go, the mortar's strength will rise because the water
absorbed by the RHA will be released to the cement and let it continue the hydration
process. H 5 has the highest compressive strength at 28 days because it has higher
water remaining in binder for cement hydration taking place compared with other.
The result also showed the H 10 has the lowest compressive strength due to the
TRHA volume increase and it directly affected the cement to gain strength through
hydration process.
Table 4.3 Mortar Average Compressive Strength
Mix code
Average compressive strength, N/mm2
3 days 7 days 28 days
CTRL 31.88 40.40 56.84
H 5 34.10 40.71 63.69
H 10 25.83 26.03 40.58
H 15 24.55 31.29 41.12
TD 5 28.09 36.14 47.98
TD 10 26.76 33.58 47.70
TD 15 27.55 39.65 45.09
FD 5 25.18 31.79 44.02
FD 10 26.54 33.31 40.77
FD 15 26.07 29.73 48.02

54
Figure 4.3 Twenty Eight Days Compressive Strength
C-S-H gel can bind the cement particles into a continuous form to reduce
capillaries pores and increase strength (Kassim et al., 2004). In Figure 4.4, H 5 which
used TRHA 2 which was treated with citric acid for 3 days showed a higher average
compressive strength than TRHA 3 and TRHA 1 mortars with different replacement
ratio. In general, the mortars with 5 % TRHA replacement have a higher compressive
strength than 10 % TRHA replacement mortars. It is probably that the water in 5 %
TRHA replacement mortars have better hydration than 10 % TRHA replacement
mortars. It produced higher amount of C-H that react to silica from TRHA hence
better strength gained. While the 10 % TRHA replacement mortar has lesser water
for cement hydration hence the C-H became lesser than silica hence the strength
gained was weaker than 5 % TRHA replacement mortar (Habeeb and Mahmud,
2010).
0
10
20
30
40
50
60
70
CTRL H 5 H 10 H 15 TD 5 TD 10 TD 15 FD 5 FD 10 FD 15
Twenty Eight Days Compressive Strength
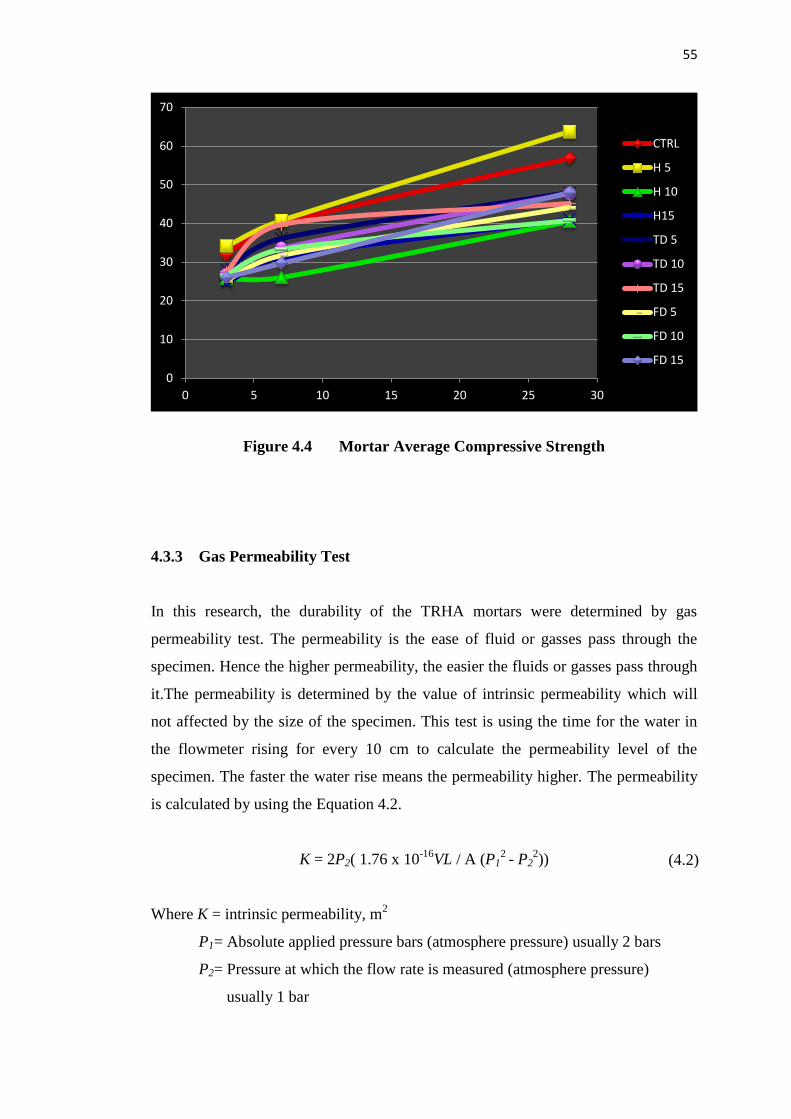
55
Figure 4.4 Mortar Average Compressive Strength
4.3.3 Gas Permeability Test
In this research, the durability of the TRHA mortars were determined by gas
permeability test. The permeability is the ease of fluid or gasses pass through the
specimen. Hence the higher permeability, the easier the fluids or gasses pass through
it.The permeability is determined by the value of intrinsic permeability which will
not affected by the size of the specimen. This test is using the time for the water in
the flowmeter rising for every 10 cm to calculate the permeability level of the
specimen. The faster the water rise means the permeability higher. The permeability
is calculated by using the Equation 4.2.
K = 2P2( 1.76 x 10⁻¹⁶
VL / A (P12
- P22))
Where K = intrinsic permeability, m2
P1= Absolute applied pressure bars (atmosphere pressure) usually 2 bars
P2= Pressure at which the flow rate is measured (atmosphere pressure)
usually 1 bar
0
10
20
30
40
50
60
70
0 5 10 15 20 25 30
CTRL
H 5
H 10
H15
TD 5
TD 10
TD 15
FD 5
FD 10
FD 15
(4.2)

56
A = Cross sectional areas of specimen, m2
L = Length of specimen, m
V = Flow rate cm3/s
The flow rate, V = (D2/4)πH/ T
Where D = Flowmeter diameter, cm
H = Length read on flowmeter, cm
T = Average time, s
All the required data were showed in Table 4.4 which will be used to
calculate the intrinsic permeability of the specimens. There were three specimens for
each group of the TRHA mortar and control mortar. Meanwhile, the average intrinsic
permeability was showed in Table 4.5.

57
Table 4.4 Intrinsic Permeability Result
Mix
Code
Average time
taken, T (s) Flow rate, V (cm
3/s)
Intrinsic permeability,
K(m2)
1 2 3 1 2 3 1 2 3
CTRL 8 8 12.8 0.09 0.09 0.06 2.66E-
16
2.66E-
16
1.77E-
16
H 5 23 16 30 0.03 0.04 0.02 8.86E-
17
1.18E-
16
5.90E-
17
H 10 31 16.2 37 0.02 0.04 0.02 5.90E-
17
1.18E-
16
5.90E-
17
H 15 30 16.5 26.6 0.02 0.04 0.03 5.90E-
17
1.18E-
16
8.86E-
17
TD 5 42 30.49 24.59 0.02 0.02 0.03 5.90E-
17
5.90E-
17
8.86E-
17
TD 10 61.82 23.52 54.8 0.01 0.03 0.01 2.95E-
17
8.86E-
17
2.95E-
17
TD 15 57 51.78 32.2 0.01 0.01 0.02 2.95E-
17
2.95E-
17
5.90E-
17
FD 5 26.2 46.21 17.35 0.03 0.02 0.04 8.86E-
17
5.90E-
17
1.18E-
16
FD 10 51.34 44.63 49.78 0.01 0.02 0.01 2.95E-
17
5.90E-
17
2.95E-
17
FD 15 23.83 54.85 56.14 0.03 0.01 0.01 8.86E-
17
2.95E-
17
2.95E-
17

58
Table 4.5 Average Intrinsic Permeability Result
Mix
Code
Intrinsic permeability, K(m2)
Average Intrinsic
permeability, K(m2) 1 2 3
CTRL 2.66E-16 2.66E-16 1.77E-16 2.36E-16
H 5 8.86E-17 1.18E-16 5.90E-17 8.85E-17
H 10 5.90E-17 1.18E-16 5.90E-17 7.87E-17
H 15 5.90E-17 1.18E-16 8.86E-17 8.85E-17
TD 5 5.90E-17 5.90E-17 8.86E-17 6.89E-17
TD 10 2.95E-17 8.86E-17 2.95E-17 4.92E-17
TD 15 2.95E-17 2.95E-17 5.90E-17 3.93E-17
FD 5 8.86E-17 5.90E-17 1.18E-16 8.85E-17
FD 10 2.95E-17 5.90E-17 2.95E-17 3.93E-17
FD 15 8.86E-17 2.95E-17 2.95E-17 4.92E-17

59
Figure 4.5 Average Intrinsic Permeability for TRHA Mortars and
Conventional Mortar
Figure 4.5 showed the average intrinsic permeability for TRHA mortars and
conventional mortar. It can be seen that conventional mortar has the highest
permeability compared to other TRHA mortars, the mortar which contained TRHA
as partial replacement of cement is 62.5% better than conventional mortar. It is
because the TRHA will fill up the empty void in the mortar and effectively reduce
the permeability (Kartini, Mahmud and Hamidah, 2010). Another research concluded
that the RHA has tiny size of particles which believed can increase the particles
packing density which helps to decrease the pores inside the specimen hence the
permeability can be reduced (Saraswathy and Song, 2007).Hence when the amount
of TRHA present in mortar increased, the permeability will be reduced. For the
mortar H 15 and FD 15 which replaced with 15 % of TRHA have higher
permeability than 10 % TRHA replacement are probably affected by the water for
hydration. Mortar with 15 % TRHA replacement will remain less water for cement to
run its hydration (Habeeb and Mahmud, 2010). The hydration process will produce
C-H bond which will be used to react with S to form C-S-H gel to reduce the pore
volume and permeability in the mortar (Dakroury et al., 2008; Kartini, Mahmud and
Hamidah, 2010).
CTRL H 5 H 10 H 15 TD 5 TD 10 TD 15 FD 5 FD 10 FD 15
Average Intrinsic Permeability, K (m2)

60
4.3.4 Porosity Test
Porosity test is to test the pore volume of the mortar in this research. It used to
determine the durability of the mortar. According to Neville and Brooks (2010), the
amount of pores in the specimen directly affect the strength of specimen, hence the
higher the amount of pores in specimen, the weaker the strength. The samples used
for this test were with 45 mm diameter and 40 mm height. Those specimens were at
the 28 days testing age. The result obtained is calculated by the Equation 4.3.
P (%) = 𝑊1−𝑊2
𝑊1−𝑊3 𝑥 100
Where :P= Porosity, %
W1 = Weight of specimen in air after passed through the porosity test
W2 = Weight of dry specimen
W3 = Weight of specimen in water after passed through the porosity test
Table 4.6 showed the weight of the mortar before immersed into water and
weight after immersed in water. The mortar's weight was increased after immersed in
water. The result was then analysed by Equation 4.3 to find out the porosity of the
TRHA mortar as shown in Table 4.7.
(4.3)

61
Table 4.6 Specimens Weight for Porosity Test
Mix
Code
Weight in air, W1(kg) Weight in water,
W3(kg)
Weight for dry
specimen, W2(kg)
1 2 3 1 2 3 1 2 3
CTRL 0.145 0.148 0.153 0.079 0.084 0.087 0.131 0.135 0.139
H 5 0.151 0.149 0.147 0.084 0.083 0.082 0.138 0.137 0.134
H 10 0.145 0.148 0.152 0.080 0.083 0.086 0.134 0.134 0.140
H 15 0.144 0.144 0.141 0.078 0.077 0.077 0.132 0.132 0.130
TD 5 0.150 0.144 0.150 0.086 0.081 0.085 0.138 0.132 0.138
TD 10 0.148 0.149 0.147 0.083 0.084 0.083 0.137 0.139 0.136
TD 15 0.148 0.150 0.150 0.083 0.082 0.084 0.136 0.137 0.138
FD 5 0.149 0.146 0.145 0.085 0.085 0.082 0.136 0.134 0.133
FD 10 0.150 0.151 0.150 0.085 0.084 0.085 0.137 0.137 0.137
FD 15 0.145 0.148 0.148 0.080 0.081 0.082 0.132 0.134 0.135

62
Table 4.7 Porosity Result
Mix
Code
Porosity, P(%) Average porosity, P(%)
1 2 3
CTRL 21.21 20.31 21.21 20.91
H 5 19.40 18.18 20.00 19.19
H 10 16.92 21.54 18.18 18.88
H 15 18.18 17.91 17.19 17.76
TD 5 18.75 19.05 18.46 18.75
TD 10 16.92 15.38 17.19 16.50
TD 15 18.46 19.12 18.18 18.59
FD 5 20.31 19.67 19.05 19.68
FD 10 20.00 20.90 20.00 20.30
FD 15 20.00 20.90 19.70 20.20
From Figure 4.6, it can be seen that the mortar which contained TRHA have
lower pore volume compare to conventional mortar which without THRA.
According to Saraswathy and Song (2007), the volume of pores in the cement
product can be reduced by increase the amount of RHA. RHA has smaller particles
that can fill up the pore hence the pore volume been decreased. The mortars which
replaced by TRHA 1 and TRHA 2 showed a better result than mortars which
replaced by TRHA 3. It is probably the silica content in TRHA 1 and TRHA 2 are
higher than TRHA 3. When the silica content in mortar decreased, the C-S-H gel
which can reduce the pore size decreased because the calcium hydroxide bond
cannot react with enough silica (Dakroury et al., 2008 ; Sugita et al., 1997).

63
Figure 4.6: Porosity of TRHA and Conventional Mortar
Another researchers Kartini, Mahmud and Hamidah (2010) found that the
pore in the RHA replacement concrete and mortar is higher when the amount of
RHA replacement is lower. The reason is because the RHA water absorption
characteristic. For 5 % RHA replacement mortar, the water amount remaining for
hydration is higher than 10 % RHA replacement mortar. When the water is being
evaporated, it will leave voids and contribute to the water absorption. Hence the
higher the water remaining, the higher the amount of void in mortar after water
evaporated.
4.4 Concluding Remark
From the results getting from the experiments, the workability showed that the higher
the amount of TRHA in mortar, the lower the workability. In average, the mortars
with TRHA 2 replacement are almost similar to TRHA 1 mortar while the TRHA 3
mortar gave a lowest workability among other groups mortar.
0
5
10
15
20
25
CTRL H 5 H 10 H 15 TD 5 TD 10 TD 15 FD 5 FD 10 FD 15
Porosity of TRHA and Conventional Mortar

64
The compressive strength of mortars are affected by the amount of TRHA
replacement and the type of TRHA. In overall, the TRHA mortars showed a lower
compressive strength then control mortar but according to Khassaf, Jasim and Mahdi
(2014), the higher the amount of THRA in mortar, the later the strength gained.
Among three types of THRA mortars, the mortars groups which replaced by THRA
2 have the higher compressive strength in every testing ages.
This research showed the permeability and porosity of TRHA mortars are
much lower than control mortar. This is because the TRHA filled up the voids inside
the mortar (Kartini, Mahmud and Hamidah, 2010) and the C-S-H gel took place
(Dakroury et al., 2008). TRHA 2 which treated with 3 days citric acid at normal
room temperature exerted in the mortar given a better low permeability and porosity
result.

65
CHAPTER 5
CONCLUSION AND RECOMMENDATIONS
5.1 Conclusion
A research on the optimize replacement ratio of different types of treated rice husk
ashes in mortar was conducted to investigate the mechanical properties and durability
compared to conventional mortar. The results getting from this study were analysed
and several conclusions can be make:
1) TRHA mortars have lower fresh properties than conventional mortar due to
the TRHA has high specific surface area that will absorb the water during
mixing process. When the amount of TRHA in mortar increases, the
workability will decreases. Hence, an adjustment of w/c ratio and the amount
of superplasticiser shall be made to improve the workability for high amount
TRHA replacement mortar.
2) All the TRHA mortars showed a slow growth of compressive strength than
conventional mortar due to the TRHA affected the water content in the mortar
hence the cement has no enough water to process the hydration process to
gain strength.
3) The permeability of the mortars which contained of TRHA are much lower
than conventional mortar due to the TRHA were filled up the capillaries pores
and formed C-S-H gel to reduce the void and permeability of mortar.

66
4) All the TRHA provided a better resistance against the pores in the mortar.
5) The TRHA mortar showed a good characteristic of gas penetration and low
pores hence it is suitable to apply at the structure that contained of gas such as
sewerage structure.
5.2 Recommendations
This study aim is mainly focused on the methods of preparing TRHA and the
optimize replacement ratio in mortar. To achieve the aim of this research, the TRHAs
mortars were undergo certain tests to determine the fresh properties and mechanical
properties such as compressive strength, permeability and porosity test. There are
some recommendations for future researchers to obtain a more accurate and useful
information regarding to TRHA mortar:
1) A comprehensive study on the mechanical properties of TRHA mortar as the
pozzolanic reaction took place in it.
2) Other durability test for TRHA mortar should be investigated as TRHA
mortar has better porosity and permeability characteristics.
3) A study on acid treatment of rice husk with different molarity of citric acid as
well as the period of treatment without extra heat.

67
REFERENCES
Abhisek Das (2009). Strength Characterisation of Fly Ash Composite Material. 1st
ed. Rourkela: National Institute of Technology, p.35.
ASTM Standard C 618-94a, Standard Specification for Coal Fly Ash and Raw or
Calcined Natural Pozzolan for Use as a Mineral Admixture in Portland Cement
Concrete.
Babor, D., Plian, D. and Judele, L. (2009). Environmental Impact of Cconcrete.
[online] Available at: <http://www.ce.tuiasi.ro/~bipcons/Archive/161.pdf>
[Accessed 28 Jul. 2015].
Bhanumathidas, N.,and Mehta, P.K. (2001), “Concrete Mixtures Made with Ternary
Blended Cements Containing Fly Ash and Rice-Husk Ash,” Seventh
CANMET/ACI Int. Conf. on Fly Ash, Silica Fume, Slag and Natural Pozzolans in
Concrete, 22-27 July, Madras, India, V.M. Malhotra, Ed., ACI SP- 199, ACI,
Michigan, 379-391
Bogeshwaran, K., Kalaivani, R., Ashraf, S., Manikandan, G. and Prabhu, G. (2014).
Production of Silica from Rice Husk. International Journal of ChemTech
Research, 6(9), pp.4337-4345.
Csbp.com.au, (2015). Concrete. [online] Available at:
<http://csbp.com.au/Media/Contractor-resources/Engineering/ES-14-202-10.aspx>
[Accessed 28 Jun. 2015].
Dakroury, A.E., and Gasser, M.S. 2008. Rice husk ash (RHA) as cement admixture
for immobilization of liquid radioactive waste at different temperatures. Journal of
Nuclear Materials. 381(3): 271–277
Department of Agriculture Peninsular Malaysia. (2014). Paddy Statistic of Malaysia.
[online] available at:
<http://www.doa.gov.my/c/document_library/get_file?uuid=cef1fc5b-0adf-437d-
a80e-f3136ee8b968&groupId=358510>[Accessed 19 Jul. 2015].
Edward G. N., 2008. Concrete Construction Engineering Handbook. 2nd
ed. Rutgers
University Piscataway, New Jersey: CRC Press
Expertsmind.com, (n.d.). Grades Of Concrete, Concrete Technology, Assignment
Help. [online] Available at: <http://www.expertsmind.com/topic/concrete-
technology/grades-of-concrete-914591.aspx> [Accessed 1 Aug. 2015].

68
Ganesan, K., K. Rajagopal, K. Thangavel, 2008. Rice husk ash blended cement:
Assessment of optimal level of replacement for strength and permeability
properties of concrete. Construction and Building Materials, 22(8): 1675-1683
Gautam, N., Krishna, V. and Srivastava, A. (2014). Sustainability in the Concrete
Construction. International Journal of Environmental Research and Development,
4(1), pp.81-90.
Gite, B., Rathi, M., Rajguru, R. and Shaikh, A. (n.d.). Advance Construction
Material – Micro Silica In Concrete. [online] Engineeringcivil.com. Available at:
<http://www.engineeringcivil.com/advance-construction-material-micro-silica-in-
concrete.html> [Accessed 19 Jul. 2015].
Gjorv, O.E., Ngo, M.H., and Mehta, P.K. (1998), “Effect of Rice Husk Ash on the
Resistance of Concrete Against Chloride Penetration”, Concrete in Severe
Environment, Tromso, Norway.
Habeeb, G. and Mahmud, H. (2010). Study on Properties of Rice Husk Ash and Its
Use as Cement Replacement Material. Mat. Res., 13(2), pp.185-190.
Health.ny.gov, (2012). Important Things to Know About Landfill Gas. [online]
Available at:
<https://www.health.ny.gov/environmental/outdoors/air/landfill_gas.htm>
[Accessed 28 Jul. 2015].
Helgilibrary.com,. (n.d.). HelgiLibrary - HelgiLibrary. [online] available at:
<http://www.helgilibrary.com/charts/index/the-dirtiest-countries-by-co2-
emissions>[Accessed 19 Jul. 2015].
Hu, H. and Kavan, P. (2014). Energy Consumption and Carbon Dioxide Emissions
of China’s Non-Metallic Mineral Products Industry: Present State, Prospects and
Policy Analysis. Sustainability, 6(11), pp.8012-8028.
Kapur, P. C. (1985) "Production of Reactive Bio-silica from the Combustion of Rice
husk in a Tube-in Basket (TiB) Burner", Powder Technol., 44, 63-67.
Kartini, Mahmud, H. and Hamidah, M. (2010). Absorption and Permeability
Performance of Selangor Rice Husk Ash Blended Grade 30 Concrete. Journal of
Engineering Science and Technology, Volume 1(No.1), pp.1-16.
Kassim, K.A., and Chern, K.K. 2004. Lime stabilized Malaysian cohesive soils. Civil
engineering National Journal. 16(1): 13-23
Khassaf, S., Jasim, A. and Mahdi, F. (2014). Investigation The Properties Of
Concrete Containing Rice Husk Ash To Reduction The Seepage In Canals.
International Journal Of Scientific & Technology Research, Volume 3(Issue 4),
pp.348-354.

69
Knowledgebank.irri.org, (2015). Importance of Rice. [online] Available at:
<http://www.knowledgebank.irri.org/ericeproduction/Importance_of_Rice.htm>
[Accessed 18 Jul. 2015].
Krishnarao, R., Subrahmanyam, J. and Jagadish Kumar, T. (2001). Studies on the
Formation of Black Particles in Rice Husk Silica Ash. Journal of the European
Ceramic Society, 21(1), pp.99-104.
Kula. S.. Ay. N..Turan. S. and Putiııı. E., 1996. Effect of Active Silica on the
Microstructure of Porcelain IV.CeramtcConn/essProteetliiijis Book lEılt. Turan,
S., Kara, F. anılPutıiıı, E.) 279-86.
Kurama, H. and Kurama, S. (2003). The Effect of Chemical Treatment on The
Production of Active Silica from Rice Husk. In: International Mining Congress
and Exhibition of Turkey. pp.431-435.
Lothenbacha, B., Scrivenerb, K. and Hooton, R. (2011). Supplementary
Cementitious Materials. In: Cement and Concrete Research. Elsevier, pp.1244–
1256.
Mamlouk, M. and Zaniewski, J. (2006). Materials for civil and construction
engineers. 2nd ed.
Mark, J. (2012). Methane’s Contribution to Global Warming is Worse than You
Thought. [online] Earthisland.org. Available at:
<http://www.earthisland.org/journal/index.php/elist/eListRead/methanes_contribu
tion_to_global_warming_is_worse_than_you_thought/> [Accessed 28 Jul. 2015].
Mehta, P. K. (2002). ―Greening of the Concrete Industry for Sustainable
Development.‖ ACI Concrete International, V. 24(7), 23-28.
Mehta, P.K. and Folliard, K.J. (2002), “Rice Husk Ash - A Unique Supplementary
Cementing Material” Durability Aspects, Recent Advances in Cementitious
Materials, University of Wisconsin, Milwaukee, Wisconsin, USA.
Nair, D., Fraaij, A., Klaassen, A. and Kentgens, A. (2008). A Structural Investigation
Relating to the Pozzolanic Activity of Rice Husk Ashes. Cement and Concrete
Research, 38(6), pp.861-869.
Nature.nps.gov,. (2013). NPS: Explore Nature » Air Resources » Air Quality Basics -
Sulfur Dioxide Effects on Health. [online] available at:
<http://www.nature.nps.gov/air/AQBasics/understand_so2.cfm>[Accessed 19 Jul.
2015].
Neville, A.M. (2002). Properties of Concrete. 4th ed. Pearson Education Limited.
Neville, A.M. and Brooks, J.J. (2010). Concrete Technology. 2nd ed. Essex: Pearson
Education Limited, p.442.

70
Nguyen, V. (2011). Rice Husk Ash as a Mineral Admixture for Ultra High
Performance Concrete. 1st ed. Netherlands, pp.1-183.
Nicole, P.H., Monteiro, P.J.M., and Carasek, H. 2000. Effect of Silica Fume and Rice
Husk Ash on Alkali-Silica Reaction. Materials Journal. 97(4): 486-492.
Northoff, E. (2008). FAO Expects Rice Production to Rise by 1.8 Percent in 2008.
[online] Fao.org. Available at:
<http://www.fao.org/Newsroom/en/news/2008/1000820/index.html> [Accessed
17 Jul. 2015].
Olawale, O., Oyawale, F., Makinde, O. and Ogundele, K. (2012). Effect of Oxalic
Acid on Rice Husk. International Journal of Applied Science and Engineering
Research, 1(5), pp.663-668.
OmotolaAlawode and O.I. Idowu (2011) Effects of Water-Cement Ratios on the
Compressive Strength and Workability of Concrete and Lateritic Concrete Mixes.
The Pacific Journal Of Science And Technology, 105(104).
Opic.gov, (n.d.). Renewable Energy in India's Rice Belt: Husk Power Systems |
OPIC : Overseas Private Investment Corporation. [online] Available at:
<https://www.opic.gov/projects/husk-power-systems> [Accessed 19 Jul. 2015].
Preeti Tiwari et al. "Effect Of Salt Water On Compressive Strength Of Concrete"Int.
Journal of Engineering Research and Applications ISSN : 2248-9622, Vol. 4,
Issue 4( Version 5), April 2014, pp.38-42
Ramezanianpour, A., Mahdi khani, M. and Hmadibeni, G. (2009). The Effect of Rice
Husk Ash on Mechanical Properties and Durability of Sustainable Concretes.
International Journal of Civil Engineering, 7(2), pp.83-91.
Reddy, D.V., and Alvarez, M. (2006), “Marine Durability Characteristics of Rice
Husk Ash-Modified Reinforced Concrete”.
Sakr, K. 2006. Effects of Silica Fume and Rice Husk Ash on the Properties of Heavy
Weight Concrete. Journal of materials in civil engineering. 18 (3): 367-376.
Salas, A., Delvasto, S., de Gutierrez, R. and Lange, D. (2009). Comparison of Two
Processes for Treating Rice Husk Ash for Use in High Performance Concrete.
Cement and Concrete Research, 39(9), pp.773-778.
Santiaguel, A. (n.d.). IRRI - A Second Life for Rice Husk. [online] Irri.org. Available
at: <http://irri.org/rice-today/a-second-life-for-rice-husk> [Accessed 19 Jul. 2015].
Sapei, L., Pramudita, A. and Widjaja, L. (2014). Pure Amorphous Silica Derived
from Calcined Acid-Leached Rice Husk - Ubaya Repository. [online]
Repository.ubaya.ac.id. Available at: <http://repository.ubaya.ac.id/9123/>
[Accessed 3 Aug. 2015].

71
Saraswathy, V., Song Ha-Won. Corrosion performance of rice husk ash blended
concrete. Construction and Building Materials, 2007. 21 (8): p.1779–1784
Sata, V., Jaturapitakkul, C. and Kiattikomol, K. (2007). Influence of Pozzolan from
Various By-product Materials on Mechanical Properties of High-strength
Concrete. Construction and Building Materials, 21(7), pp.1589-1598.
Smith, R.G. and Kamwanja, G.A. 1986. The Use of Rice Husk for Making a
Cementitious Material, Proc. Joint Symposium on the Use of Vegetable Plants
and their Fibers as Building Material, Baghdad.
Souza, M., Magalhães, W. and Persegil, M. (2002). Silica Derived from Burned Rice
Hulls. Mat. Res., 5(4), pp.467-474.
Sugita, S., Yu, Q., Shoya, M., Sukinaga, Y.T., and Isojima, Y. (1997), “The
Resistance of Rice Husk Ash Concrete to Carbonation, Acid Attack and Chloride
Penetration”, High Performance Concrete, ACI Int. Conf., Kuala Lumpur,
Malaysia, 29-43.
Sugita, S., Yu, Q., Shoya, M., Tsukinaga, Y., and Isojima, Y. 1997. In the
Proceedings of the 1997 10th International Congress on the Chemistry of Cement,
Gothenburg. pp.85-109.
Sustainableconcrete.org.uk,.Aggregates. [online] available at:
<http://www.sustainableconcrete.org.uk/top_nav/what_is_concrete/aggregates.asp
x>[Accessed 3 Aug. 2015].
Taylor, G. (2004,). Rice Husk Ash. [online] The Institute of Concrete Technology.
Available at: http://www.ricehuskash.com/UK%20-
%20ICT%20News%2055%20-%20Nov%20Edition.pdf> [Accessed 19 Jul. 2015].
Thomas, J. and Jennings, H. (n.d.). 5.4.2 - Calcium-Silicate-Hydrate (C-S-H) gel.
[online] Iti.northwestern.edu. Available at:
http://iti.northwestern.edu/cement/monograph/Monograph5_4_2.html [Accessed 4
Feb. 2016].
Ugheoke, I. and Mamat, O. (2012). A Critical Assessment and New Research
Directions of Rice Husk Silica Processing Methods and Properties. 1st ed. [ebook]
Maejo International Journal of Science and Technology, pp.434-435. Available at:
<http://www.mijst.mju.ac.th/vol6/430-448.pdf> [Accessed 18 Jul. 2015].
Ujhelyi, J. and Ibrahim, A. (1991). Hot Weather Concreting with Hydraulic
Additives. Cement and Concrete Research, 21(2-3), pp.345-354.
Umeda, J. and Kondoh, k. (2008). Process Optimization to Prepare High-purity
Amorphous Silica from Rice Husks via Citric Acid Leaching Treatment. Joining
and Welding Research Institute, 37(1).

72
Umeda, J., Imai, H. and Kondoh, K. (2009). Polysaccharide Hydrolysis and Metallic
Impurities Removal Behavior of Rice Husk in Citric Acid Leaching Treatment.
Joining and Welding Research Institute, 38(2), pp.13-18.
Umeda, J., Kondoh, K. and Michiura, Y. (2007). Process Parameters Optimization in
Preparing High-Purity Amorphous Silica Originated from Rice Husks. Materials
Transactions, 48(12), pp.3095-3100.
Van Oss, H. (2015). Cement. [online] minerals.usgs.gov. Available at:
<http://minerals.usgs.gov/minerals/pubs/commodity/cement/mcs-2015-cemen.pdf>
[Accessed 23 Jul. 2015].
Vrijheid, M. (2000). Health Effects of Residence Near Hazardous Waste Landfill
Sites: A Review of Epidemiologic Literature. Environ Health Perspect, 108(s1),
101-112. doi:10.1289/ehp.00108s1101
Wada, I., Kawano, T., Kawakami, M., and Maeda, N. (2000), “Effect of Highly
Reactive Rice Husk Ash on Durability of Concrete and Mortar”, Durability of
Concrete, CANMET/ACI, Barcelona, Spain, 205-222.
Ww2.utusan.com.my,. (2009). Bajet 2010. [online] available at:
<http://ww2.utusan.com.my/utusan/special.asp?pr=bajet2010&y=2009&dt=1025
&pub=BAJET2010&sec=Laporan_Ekonomi&pg=le_16.htm>[Accessed 20 July.
2015].
Yuzer, N., Cinar, Z., Akoz, F., Biricik, H., YalcinGurkan, Y., Kabay, N. and
Kizilkanat, A. (2013). Influence of Raw Rice Husk Addition on Structure and
Properties of Concrete. Construction and Building Materials, 44, pp.54-62.
Zhang, M.H., Lastra, R., and Malhotra, V.M. 1996. Rice Husk Ash Paste and
Concrete: Some Aspects of Hydration and the Microstructure of the Interfacial
Zone between the Aggregate and Paste. Cement and Concrete Research. 26(6):
963-977.
Zhu, Q. (2011). CO2 Abatement in the Cement Industry. [online] Iea-coal.org.uk.
Available at: <http://www.iea-coal.org.uk/documents/82745/8189/co2-abatement-
in-the-cement-industry> [Accessed 7 Aug. 2015].

73
STANDARDS
ASTM C1437-15, Standard Test Method for Flow of Hydraulic Cement Mortar,
ASTM International, West Conshohocken, PA, 2015,www.astm.org
British Standard Institution (2009). Testing hardened concrete. Making and curing
specimens for strength tests. London, BS EN 12390-2.
British Standard Institution (2000). Testing hardened concrete. Compressive
strength– Specification for testing machines. London, BS EN 12390-4.
Cabrera JG, Lynsdale CJ. A new gas permeameter for measuringthe permeability of
mortar and concrete. Mag Concr Res1988;40:77–82.
RILEM, CP 11.3, Absorption of water by immersion under vacuum, Materials and
Structures, Research and Testing, No 101, 1984, pp: 292-394.


![Lalita Sen Texas Southern University Sen [email protected]](https://static.fdocuments.in/doc/165x107/622e60a3b8fa00305f3a7328/lalita-sen-texas-southern-university-sen-emailprotected.jpg)