Lee County Community Food Security Assessment - AUrora
30
Transcript of Lee County Community Food Security Assessment - AUrora


Lee County Community Food Security AssessmentErica Meissner
INTRODUCTIONTh e purpose of this assessment is to evaluate the condition of community food security in Lee County, Alabama, with a specifi c focus on the ability of low-income households to meet their food needs. In conducting this assessment we hope to better understand food availability, food access, and food utilization in Lee County and identify ways to improve food security for the benefi t all local residents. We believe that the results of this community food security assessment will provide a starting point for a more comprehensive examination of food security in Lee County involving a wide range of stakeholders in the local food system. If the problems with and opportunities for improving local food security are identifi ed, we believe that Lee County residents and policymakers are capable of constructing a socially and economically vibrant local food system.
BACKGROUND
Understanding Food Security and Community Food SecurityAs defi ned by the World Food Summit of 1996, food security is a condition existing “when all people, at all times, have access to suffi cient, safe, nutritious food to maintain a healthy and active life” (FAO 1996). Th e condition of food security is satisfi ed when adequate amounts of food are available on a regular and consistent basis, when there are suffi cient resources to obtain nutritious food, and when food consumption and use is informed by an understanding of basic nutrition and food safety (WHO 2012). Th e Food and Agricultural Organiza-tion (FAO) identifi es three pillars of food security:
• food availability,• food access, and• food utilization (WHO 2012).
One can assess food security at various levels: individual, household, com-munity, region, state, and nation. Th is particular assessment will evaluate food security among the households and communities within Lee County, Alabama.
Erica Meissner was a research assistant in the Department of Agricultural Exonomics and Rural Sociology, in the Col-lege of Agriculture at Auburn University.
CONTENTS page Introduction ---------------------------------------------------------------------------------- 3Background ----------------------------------------------------------------------------------- 3 Understanding Food Security and Community Food Security ---------------------- 3 Geography of Lee County ---------------------------------------------------------------- 4 Feeding America’s Map the Meal Gap Assessment ------------------------------------ 6Food Availability ----------------------------------------------------------------------------- 7 Food Availability in the United States --------------------------------------------------- 7 Commercial Food Production in Lee County------------------------------------------ 7 Residential Food Growing ---------------------------------------------------------------- 9Food Access ---------------------------------------------------------------------------------- 10 Food Access in the United States --------------------------------------------------------10 Household Food Security ----------------------------------------------------------------10 Federal Food Assistance Programs ------------------------------------------------------13 Supplemental Nutrition Assistance Program---------------------------------------15 National School Lunch Program ----------------------------------------------------19 Food Pantries and Soup Kitchens in Lee County -------------------------------------24 Transportation and Food Security in Lee County ------------------------------------28Food Utilization ---------------------------------------------------------------------------- 31 Food Utilization in the United States --------------------------------------------------31 Food Utilization in Lee County ---------------------------------------------------------31 Health Consequences of Food Insecurity ----------------------------------------------32Next Step ------------------------------------------------------------------------------------- 33 Understanding Food Policy Councils --------------------------------------------------34 Moving Forward in Lee County --------------------------------------------------------36Appendix ------------------------------------------------------------------------------------ 38 A. Lee Country Houshold Characteristics ---------------------------------------------38 B-1. Lee County Food Store Survey: Evaluating Food Items Available to Lee County SNAP Recipients -------------------------------------------------------------40 B-2. Th rifty Food Plan Market Basket -------------------------------------------------42 B-3. Availability of Th rift Food Plan Items by Store Type --------------------------46 C. Primary Means of Transportation of Employed Lee County Residents -------50 D. Literature and Resources on Food Policy Councils ------------------------------51Bibliography -------------------------------------------------------------------------------- 53
Cover photographs courtesy of the Community Market, a program of the Food Bank of East Alabama. Photo credit: Kim Appel
Th is publication may be found online athttp://repo.lib.auburn.edu/repo/handle/123456789/44099
4 ALABAMA AGRICULTURAL EXPERIMENT STATION LEE COUNTY COMMUNITY FOOD SECURITY ASSESSMENT 5
When food security is considered in the context of the community, the term community food security is often used. Th e most cited defi nition of community food security is that of Hamm and Bellows (2003):
Community food security is a condition in which all community residents obtain a safe, culturally acceptable, nutritionally adequate diet through a sustainable food system that maximizes community self-reliance and so-cial justice.
Growing interest in community food security has led to analytical and meth-odological tools to address barriers and opportunities. As such, community food security addresses a wide range of problems through a systems approach, unites disparate sectors and individuals in both conversation and action, promotes in-tegrative and collaborative solutions, and embraces democratic decision-making processes (Hugh 1995; Winne 2004). Th e United States Department of Agricultural (USDA) consolidates the two understandings of community food security—condition and methodology—to defi ne it as a prevention-oriented concept that embraces sustainable and com-munity-based strategies that function to
• improve the ability of low-income households and individuals to access adequate amounts of nutritious and culturally appropriate food,• better the ability of communities to satisfy their own food needs, and• promote integrative and holistic approaches to issues of local food, agricul-ture, and nutrition (Andrews 2010).
Th is study represents a starting point for a more comprehensive community food security assessment that will involve the participatory and collaborative processes unique to community food security. Th ough many people contributed to this study, it will take an engaged citizenry to truly fulfi ll the objectives of community food security.
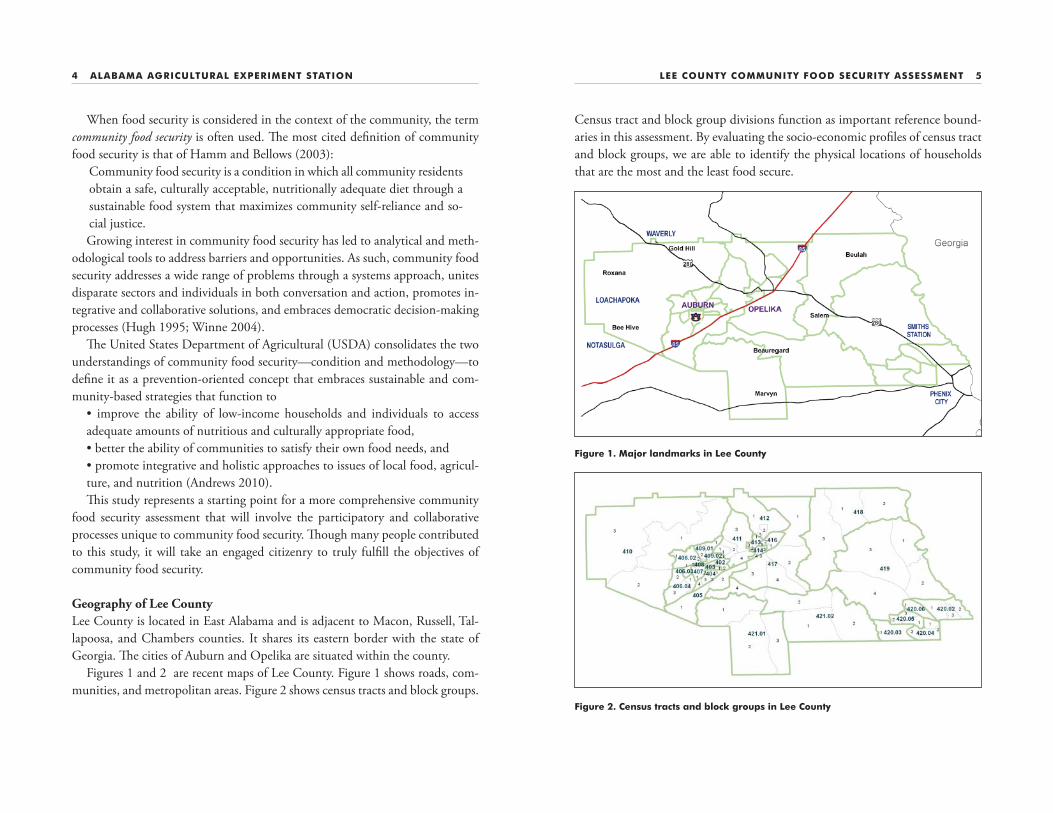
Geography of Lee CountyLee County is located in East Alabama and is adjacent to Macon, Russell, Tal-lapoosa, and Chambers counties. It shares its eastern border with the state of Georgia. Th e cities of Auburn and Opelika are situated within the county. Figures 1 and 2 are recent maps of Lee County. Figure 1 shows roads, com-munities, and metropolitan areas. Figure 2 shows census tracts and block groups.
Figure 1. Major landmarks in Lee County
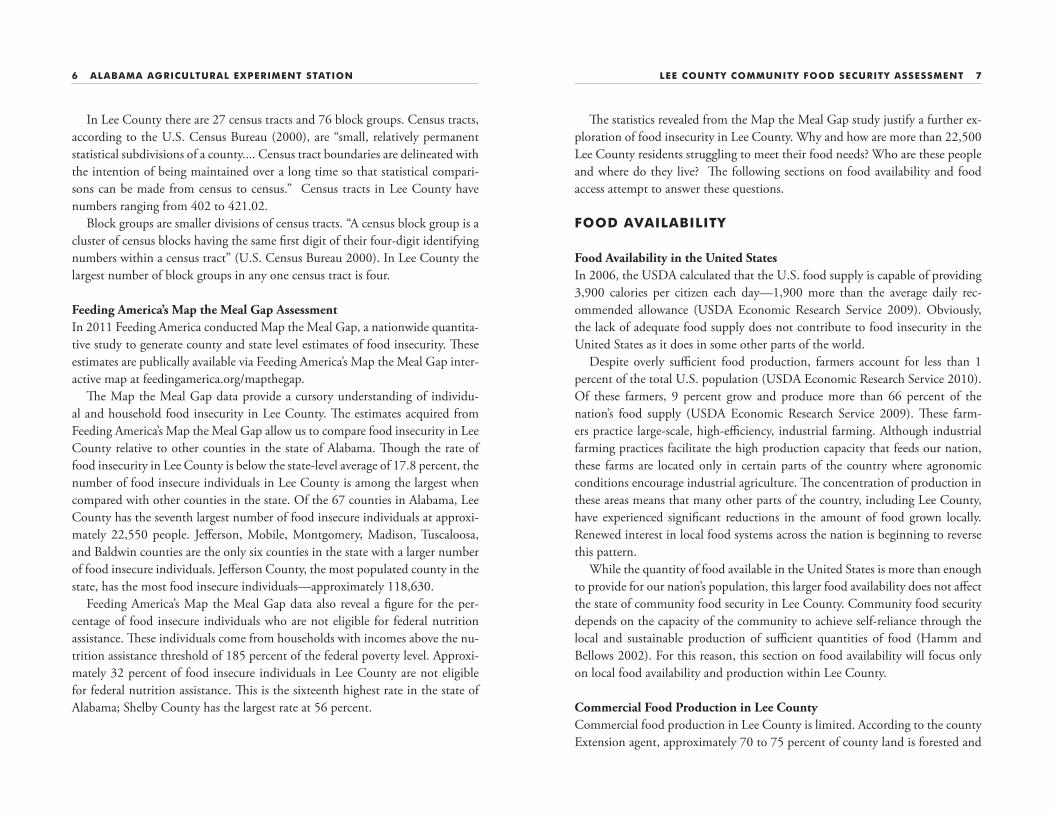
Figure 2. Census tracts and block groups in Lee County
Census tract and block group divisions function as important reference bound-aries in this assessment. By evaluating the socio-economic profi les of census tract and block groups, we are able to identify the physical locations of households that are the most and the least food secure.
6 ALABAMA AGRICULTURAL EXPERIMENT STATION LEE COUNTY COMMUNITY FOOD SECURITY ASSESSMENT 7
In Lee County there are 27 census tracts and 76 block groups. Census tracts, according to the U.S. Census Bureau (2000), are “small, relatively permanent statistical subdivisions of a county.... Census tract boundaries are delineated with the intention of being maintained over a long time so that statistical compari-sons can be made from census to census.” Census tracts in Lee County have numbers ranging from 402 to 421.02. Block groups are smaller divisions of census tracts. “A census block group is a cluster of census blocks having the same fi rst digit of their four-digit identifying numbers within a census tract” (U.S. Census Bureau 2000). In Lee County the largest number of block groups in any one census tract is four.
Feeding America’s Map the Meal Gap Assessment In 2011 Feeding America conducted Map the Meal Gap, a nationwide quantita-tive study to generate county and state level estimates of food insecurity. Th ese estimates are publically available via Feeding America’s Map the Meal Gap inter-active map at feedingamerica.org/mapthegap. Th e Map the Meal Gap data provide a cursory understanding of individu-al and household food insecurity in Lee County. Th e estimates acquired from Feeding America’s Map the Meal Gap allow us to compare food insecurity in Lee County relative to other counties in the state of Alabama. Th ough the rate of food insecurity in Lee County is below the state-level average of 17.8 percent, the number of food insecure individuals in Lee County is among the largest when compared with other counties in the state. Of the 67 counties in Alabama, Lee County has the seventh largest number of food insecure individuals at approxi-mately 22,550 people. Jeff erson, Mobile, Montgomery, Madison, Tuscaloosa, and Baldwin counties are the only six counties in the state with a larger number of food insecure individuals. Jeff erson County, the most populated county in the state, has the most food insecure individuals—approximately 118,630. Feeding America’s Map the Meal Gap data also reveal a fi gure for the per-centage of food insecure individuals who are not eligible for federal nutrition assistance. Th ese individuals come from households with incomes above the nu-trition assistance threshold of 185 percent of the federal poverty level. Approxi-mately 32 percent of food insecure individuals in Lee County are not eligible for federal nutrition assistance. Th is is the sixteenth highest rate in the state of Alabama; Shelby County has the largest rate at 56 percent.
Th e statistics revealed from the Map the Meal Gap study justify a further ex-ploration of food insecurity in Lee County. Why and how are more than 22,500 Lee County residents struggling to meet their food needs? Who are these people and where do they live? Th e following sections on food availability and food access attempt to answer these questions.
FOOD AVAILABILITY
Food Availability in the United StatesIn 2006, the USDA calculated that the U.S. food supply is capable of providing 3,900 calories per citizen each day—1,900 more than the average daily rec-ommended allowance (USDA Economic Research Service 2009). Obviously, the lack of adequate food supply does not contribute to food insecurity in the United States as it does in some other parts of the world. Despite overly suffi cient food production, farmers account for less than 1 percent of the total U.S. population (USDA Economic Research Service 2010). Of these farmers, 9 percent grow and produce more than 66 percent of the nation’s food supply (USDA Economic Research Service 2009). Th ese farm-ers practice large-scale, high-effi ciency, industrial farming. Although industrial farming practices facilitate the high production capacity that feeds our nation, these farms are located only in certain parts of the country where agronomic conditions encourage industrial agriculture. Th e concentration of production in these areas means that many other parts of the country, including Lee County, have experienced signifi cant reductions in the amount of food grown locally. Renewed interest in local food systems across the nation is beginning to reverse this pattern. While the quantity of food available in the United States is more than enough to provide for our nation’s population, this larger food availability does not aff ect the state of community food security in Lee County. Community food security depends on the capacity of the community to achieve self-reliance through the local and sustainable production of suffi cient quantities of food (Hamm and Bellows 2002). For this reason, this section on food availability will focus only on local food availability and production within Lee County.
Commercial Food Production in Lee CountyCommercial food production in Lee County is limited. According to the county Extension agent, approximately 70 to 75 percent of county land is forested and

8 ALABAMA AGRICULTURAL EXPERIMENT STATION LEE COUNTY COMMUNITY FOOD SECURITY ASSESSMENT 9
slightly more than 20 percent of the land is designated as residential and com-mercial. Th is leaves less than 5 percent of the land for agricultural use, amount-ing to roughly 63,000 acres (Brown 2012, USDA Census of Agriculture 2007). According to the most recent USDA Census of Agriculture (2007), only 7,556 acres of this agriculture land is harvested cropland. Th e majority of the agricultural land, more than 49,000 acres, is used for raising beef cattle, sheep, hogs, and/or poultry (Brown 2012; USDA Census of Agriculture 2007). Th e average net income per farm in Lee County amounts to approximately $5,500 each year. Th ough commercial agricultural production of crops accounts for a very small percentage of Lee County’s economy and land use, the number of growers’ permits issued each year has more than doubled the last fi ve years to more than 50. While the majority of these growers harvest small plots of land averaging 1 acre in size, there are approximately seven larger growers in the county that harvest 10 or more acres of land (Brown 2012). Th ese individuals possessing grower’s permits are allowed to sell the crops they harvest. Due to generally small production output, Lee County growers typically sell their food products at local farmers’ markets and roadside stands. Th ere are two major farmers’ markets in Lee County—the Market at Ag Heritage Park and the Opelika Farmers’ Market—and between six and eight roadside stands. Both of the markets are seasonal and operate only during the summer months. Pres-ently there are also talks of starting a third seasonal market in Notasulga (Brown 2012). Lee County is far from being able to satisfy its own food needs and, due to environmental restrictions, it is highly unlikely that Lee County will ever support large-scale industrial farming. However, striving to increase local food production is not a fruitless endeavor. Expanding local food production could enhance community food security, generate income and employment oppor-tunities, promote local economic growth, and foster meaningful relationships between producers and consumers. Fortunately, there is considerable potential for increased agricultural produc-tion within the county limits. It is speculated that 40 percent of the land in the county is suitable for agricultural production. Most of this land, comprised of sandier soil, is situated in southern part of the county. Th e land in the northern part of the county is largely undesirable for agricultural production due to its high red clay and rock content (Brown 2012). Soil profi les of Lee County are
available to growers, producers, and the general public at the offi ces of the Natu-ral Resources Conservation Services located on Skyway Drive in Opelika.
Residential Food Growing Perhaps one of the more interesting trends concerning local food production is that more and more Lee County residents are becoming interested in back-yard food growing. According to the county Extension agent, 25 percent of the people who contact his offi ce have questions about growing food for personal consumption. Recognizing the growing interest in backyard food growing, the county Extension offi ce has started to off er workshops to the public that address everything from raising poultry and honey bees to growing the perfect tomato. Th ese workshops are presented through a series called “Home Grown.” More than 200 Lee County residents attended the last four workshops through the Home Grown series (Brown 2012). Local Master Gardeners help to promote local gardening for both food and enjoyment. Informal backyard food growing, though typically small scale, can function as an important support mechanism for community food security. Backyard food growing contributes to household food security at all income levels by provid-ing opportunities for convenient access to nutritious produce (Kortwright and Wakefi eld 2009). Residential food growing is a logical solution for bolstering the availability of nutritious food in Lee County. However, particularly in the more densely popu-lated regions of the county, barriers exist to successful backyard food production. A 2009 study (Kortwright and Wakefi eld) found that secure access to suitable land is one of the greatest hindrances to individuals wishing to grow their own produce. Many people either do not own the land on which they live or, if they do own it, there is insuffi cient space or soil quality to eff ectively grow produce. Fortunately, these are surmountable barriers. Auburn University rents small gar-den plots to students and faculty who are interested in growing their own food, and communities in Lee County could do the same thing for local residents. Another signifi cant barrier to home food growing is lack of gardening skills (Kortwright and Wakefi eld 2009). Fortunately, the Home Grown series spon-sored by the county Extension offi ce is taking the fi rst steps to overcome this barrier. Th ere are also a number of individuals employed in schools across the county that are taking active measures to teach children basic gardening skills.

10 ALABAMA AGRICULTURAL EXPERIMENT STATION LEE COUNTY COMMUNITY FOOD SECURITY ASSESSMENT 11
FOOD ACCESS
Food Access in the United StatesWhen considering the three pillars of food security—food availability, food ac-cess, and food utilization—food access asserts itself as the greatest barrier to uni-versal food security in the United States. As we discovered on the previous pages, there is more than enough food available in the United States to provide for all. Food insecurity exists in our country largely due to socio-economic constraints operating at the household level (Nord 2001). Th e following pages will evaluate food access in Lee County at the household level. In addition to exploring socio-economic indicators of food security, we will also look at the eff orts of federal food assistance programs to minimize the prevalence of food insecurity.
Household Food SecurityHousehold food security is the cornerstone of community food security. As-sessing household food security allows us to fully comprehend the needs of low-income community members and the problems that they face in obtaining adequate amounts of safe, nutritious, and culturally appropriate food. As the defi nition of community food security reminds us, meeting the needs of these low-income individuals is paramount (Hamm and Bellows 2003). In the United States the ability of a household to meet its food needs and maintain food security is primarily dependent on economic indicators of well-being, namely, household income and incidence of poverty (Nord 2001). Due to this relationship, this assessment of food security in Lee County relies on income and poverty as the principle indicators for evaluating the prevalence of household food insecurity. Th e 2010 U.S. Census provides block group level data for these two indicators. Th ese data are mapped in Figures 3 and 4, which reveal the physical distribution of high- and low-income households. Th e loca-tion of the largest number of households with incomes at or below 130 percent of offi cial poverty rates is highly variable in Lee County. Generally speaking, the highest incomes and the lowest number of households at or near poverty are to be found in and around the City of Auburn. Th at said, there are large parts of Auburn that have the lowest incomes and the largest numbers of households at or near poverty. With some variation, it can be said that incomes are lower and the number of households at or near poverty are higher in Opelika and in sur-rounding rural areas.
Figure 3. Average median household income by block group (U.S. Census Bureau 2010)
Figure 4. Number of households below 130 percent of the federal poverty level by block group (U.S. Census Bureau 2010)

12 ALABAMA AGRICULTURAL EXPERIMENT STATION LEE COUNTY COMMUNITY FOOD SECURITY ASSESSMENT 13
Figure 5 considers both median household income and incidence of poverty to determine the most and the least vulnerable block groups. Relative vulner-ability was determined by assigning a rank to all block groups for each indicator. Th e ranks—two for each block group—were then added together to establish a fi gure for relative vulnerability. From this map we see that there are 15 block groups that are considered as highly vulnerable to experiencing food insecurity. Th e six most vulnerable block groups are located within the City of Auburn. Th ese groups are
1. block group 2, census tract 408,2. block group 1, census tract 406.04,3. block group 2, census tract 406.04,4. block group 1, census tract 408, 5. block group 3, census tract 409.02, and 6. block group 1, census tract 406.03.
Of the remaining block groups classifi ed as highly vulnerable, three more are located in the City of Auburn, four are located in the City of Opelika, one is located in the community of Notasulga, and one is located in the community of Salem. Th ere are another 15 block groups classifi ed with a moderately high level of vulnerability. Th ese block groups are highlighted in orange in Figure 5. Seven of these block groups are located in the City of Auburn, six in the City of Opelika, one in the community of Marvyn, and one in the community of Beulah. Census tracts 408, 406.04, and 406.03 of Auburn and census tracts 414 and 416 of Opelika are the only fi ve census tracts that have all block groups classifi ed with a high or moderately high level of vulnerability. Th e consistently high rate of vulnerability within these census tracts is important when considering future allocation of resources and assets to food security. Figures 6 and 7 are enlargements of Figure 5 and focus on the block groups that are ranked with high or moderately high vulnerability. Figure 6 enlarges the block groups located near Auburn University and within the City of Auburn. Figure 7 enlarges the block groups located within the City of Opelika. Th ough median household income and incidence of poverty possess a strong association with food security, these economic indicators alone are not the only factors infl uencing the ability of households to meet their food needs. Studies have shown (Rose 1998; Nord 2009) that household food security also possesses a negative correlation with the following household characteristics:
• Householder did not graduate from high school;• Householder is unemployed;• Householder is a single-parent with dependents;• Householder is black or Hispanic; and • Household contains more than two people.
Appendix A: Lee County Household Characteristics includes census tract level maps of the fi rst four household characteristics listed above.
Federal Food Assistance ProgramsWith the understanding that food insecurity and hunger are realities faced by a signifi cant number of Americans, the U.S. government has set up safety nets in the form of federal nutrition assistance programs. Th ese federal nutrition assistance programs include:
• Supplemental Nutrition Assistance Program (SNAP) • National School Lunch Program (NSLP)• School Breakfast Program (SBP)• Special Milk Program for Children
Figure 5. Relative vulnerability for experiencing food insecurity based on economic indicators bock group (U.S. Census Bureau 2010)

14 ALABAMA AGRICULTURAL EXPERIMENT STATION LEE COUNTY COMMUNITY FOOD SECURITY ASSESSMENT 15
• Child and Adult Care Food Program (CACFP)• Special Supplemental Nutrition Program for Women, Infants, and Children (WIC)• Summer Food Service Program (SFSP)• Th e Emergency Food Assistance Program (TEFAP)• Commodity Supplemental Food Program (CSFP)• Food Distribution Program on Indian Reservations (FDPIR)• WIC Farmers’ Market Nutrition Program• Nutrition Services Incentives Program (NSIP)
More information about each of these nutrition assistance programs is avail-able at www.fns.usda.gov/fdd. In our community food security assessment, we focused on the two larg-est programs—the Supplemental Nutrition Assistance Program (SNAP) and the National School Lunch Program (NSLP). Of eligible households in 2009, nationwide participation for each of these programs was 35.2 percent and 34.1 percent, respectively (Nord, Coleman-Jensen, Andrews, and Carlson 2009).
Supplemental Nutrition Assistance Program (SNAP) Th e Supplemental Nutrition Assistance Program (SNAP) is the largest federal nutritional assistance program in the United States. Known as the Food Stamp Program prior to October 2008, SNAP allows for eligible households to receive benefi ts to purchase or receive approved food items at authorized food stores, restaurants, and group feeding sites (Cohen 2002). Eligibility for receiving SNAP benefi ts is based largely on household size, income relative to the federal poverty level, basic expenses, and assets. Households receiving Temporary As-sistance for Needy Families (TANF) or Supplemental Security Income (SSI) are automatically eligible for receipt of SNAP benefi ts (Food and Nutrition Services 2012). In 2009 the average monthly benefi t received per SNAP participant was approximately $124 (Nord, Coleman-Jensen, Andrews, and Carlson 2009). In 2011, the average monthly benefi t received by Alabama residents participating in SNAP was $135.18 (FNS 2011). Table 1, also available at the USDA Food and Nutrition Service website, is used to determine eligibility for SNAP benefi ts. Gross income refers to a house-hold’s total, non-excluded income before any deductions are made. In order for a household to qualify and maintain eligibility for SNAP benefi ts, gross household income must not exceed 130 percent of the federal poverty level. Exceptions apply for those who are unemployed, disabled, or elderly. Th e income eligibility fi gures listed in the chart will remain applicable until September 30, 2012 (Food and Nutrition Services 2012).
Figure 6. Relative vulnerability for experiencing food insecurity based on economic indicators within Auburn by block group (U.S. Census Bureau 2010)
Figure 7. Relative vulnerability for experiencing food insecurity based on economic indicators within Opelika by block group (U.S. Census Bureau 2010)

16 ALABAMA AGRICULTURAL EXPERIMENT STATION LEE COUNTY COMMUNITY FOOD SECURITY ASSESSMENT 17
Th e 2010 American Community Survey estimates that there are approxi-mately 4,377 households in the Lee County that had received SNAP ben-efi ts in the twelve months prior. Th is amounts to approximately 8.1 percent of total households; 2,513 of the house-holds receiving SNAP benefi ts reported incomes below the SNAP eligibility threshold of 130 percent poverty. Th ese households account for 40.4 percent of all eligible households, a fi gure that is approximately 5 percent higher than the national average (Nord, Coleman-Jensen, Andrews, and Carlson 2009). Figure 8 shows the number of people by census tract receiving SNAP benefi ts in 2010 (American Community Sur-
vey). As seen in this map, the majority of SNAP recipients in Lee County reside in the City of Opelika and the community of Beulah. Th ough there are more than 4,000 eligible Lee County households participat-ing in SNAP, there are substantially more eligible households not participating in the program. Th is trend is not unique to Lee County. Hundreds of thousands of households in Alabama and nationwide do not receive SNAP benefi ts despite eligibility. Recent research has attempted to quantify the reasons why these eligible households do not receive SNAP benefi ts. A 2003 study (Farrell et al.) found that there are three primary reasons:
• Th e household is already receiving other means-tested benefi ts (i.e. SSI, Medicaid, WIC, Housing Assistance, cash public assistance, or TANF);• Th e household is experiencing a short-term drop in income that temporarily places it below the SNAP eligibility level of 130 percent poverty; and • Th e householder faces barriers to application and participation, such as il-literacy, lack of awareness, or physical or mental disability.
Th ere also exists a possibility that some eligible households choose not to re-ceive SNAP benefi ts because they feel there is a stigma associated with receiving
Table 1: Income and House-hold Size Requirements for Determining SNAP Eligibility
Household Size
Gross Monthly Income 1
1 $1,180
2 $1,594
3 $2,008
4 $2,422
5 $2,836
6 $3,249
7 $3,663
8 $4,077
Each additional member
+$414
1 130 percent of official poverty rate.Figure 8. Number of households receiving SNAP benefits by census tract (U.S. Census Bureau 2010)
welfare assistance (Farrell et al. 2003). Th ough this is an oft-cited cause of low SNAP participation rates, an analysis of the National Food Stamp Survey (Dion and Pavetti, 2000) found that a small percentage of people—approximately 7 percent—claim welfare stigma as the most important reason for not participat-ing in the SNAP program. Figure 9 illustrates the number of households with incomes below the federal poverty level that are not receiving SNAP benefi ts at the level of the census tract. It indicates that the majority of eligible households reside within the city limits of Opelika. However, there are two particularly signifi cant conclusions to draw from this map that are easy to overlook as they are made in the context of relative vulnerability (see Figure 5). First, a large number of eligible households in Cen-sus Tract 10 are not receiving SNAP benefi ts. Th ese households are concentrated in the community of Notasulga. And second, though relative vulnerability in Census Tract 419 is moderate, there are a substantial number of households that could benefi t from the assistance of SNAP. In Lee County, there are 82 stores authorized to accept SNAP benefi ts. Th ese stores range from supermarkets, to small grocers, to convenience stores, to spe-cialty stores. Presently no restaurants or group feeding sites exist in the county that are authorized to redeem SNAP benefi ts.

18 ALABAMA AGRICULTURAL EXPERIMENT STATION LEE COUNTY COMMUNITY FOOD SECURITY ASSESSMENT 19
Figure 10 shows the location of retailers authorized to accept SNAP benefi ts relative to the number of SNAP recipients per block group. Buff ers indicating a one-mile radius are placed around each food retailer. Presumably, SNAP re-cipients living within these buff er areas are capable of walking to a food retailer that is authorized to accept SNAP benefi ts. From this map we see that many Lee County SNAP recipients do not have easy access to a food retailer authorized to redeem their benefi ts and that a majority of these households are located in northern census tracts of Opelika and in the community of Beulah. Also indi-cated on this map are the locations of major food retailers, i.e. supermarkets. We see from the map that supermarkets in Lee County are concentrated in the city limits of Auburn and Opelika. Not all food retailers authorized to accept SNAP benefi ts are equal. Depend-ing on the type of retailer (supermarket, convenient store, etc.), the availability and aff ordability of the food varies considerably. For this reason, we have also conducted a survey of SNAP authorized food retailers in Lee County. Results from this survey are presented in Appendix B-1, Lee County Food Store Survey: Evaluating Food Items Available to Lee County SNAP Recipients; Appendix
Figure 9. Number of households below 130 percent poverty level not receiving SNAP benefits by census tract (U.S. Census Bureau 2010)NOTE: Data from the census tracts shaded white have been intentionally omitted from this map. These census tracts have populations consisting of largely Auburn University students. The majority of these students are financially dependent on their parents and are food secure.
B-2 Th rifty Food Plan Market Basket; and Appendix B-3 Availability of Th rifty Food Plan Items by Store Type.
National School Lunch Program (NSLP)Th e National School Lunch Program (NSLP) is a federally assisted program operating nationwide in approximately 101,000 public and non-profi t private schools and residential childcare institutions. In 2009 it was estimated that 31.3 million children in the United States participated in the program each day (Nord, Coleman-Jensen, Andrews, and Carlson 2009). School districts and pri-vate schools choosing to participate in the NSLP receive cash subsidies and food from the USDA for each meal they serve. In order to participate in the program, schools must ensure that all of the lunches served satisfy the Dietary Guidelines for Americans and off er free or reduced priced meals to eligible children (FNS 2011). Similar to SNAP, eligibility for free and reduced priced meals through the NSLP is dependent on household size and gross household income. Free meals are available to children from households with incomes at or below 130 percent of the federal poverty level. Reduced priced meals are available to children from
Figure 10. Location of food retailers accepting SNAP benefits relative to SNAP recipi-ents by census tract (U.S. Census Bureau 2010)

20 ALABAMA AGRICULTURAL EXPERIMENT STATION LEE COUNTY COMMUNITY FOOD SECURITY ASSESSMENT 21
households with incomes between 130 percent and 185 percent of the federal poverty level (Tribiano 2012). All three school districts in Lee County—Auburn City Schools, Lee County Schools, and Opelika City Schools—participate in the NSLP. Th ese school dis-tricts also participate in the School Breakfast Program and the Special Milk Pro-gram for Children. Table 2 lists all of the public schools within Lee County and the percent-age of the student body receiving free or reduced breakfast and lunch. Schools within each school district are listed in order from greatest percentage of stu-dents to least percentage of students. Th ese data are valuable because they reveal which schools service the county’s most vulnerable populations. We see from this table that Loachapoka Elementary School, the Opelika Learning Center, and Loachapoka High School have the three highest rates for receipt of free or reduced school lunch. While the NSLP off ers subsidized meals to all children in participating schools, children from food insecure and marginally food secure households reap the greatest benefi ts from the program. Th ese benefi ts are particularly evi-
Table 2: Students Receiving Free/Reduced Lunches through the NSLP in Lee County
School Percentage of Student Body Receiving Free/Reduced Lunch
———————————Auburn City Schools———————————
Richland Elementary School 31.4%
Yarborough Elementary School 31.2%
Wright’s Mill Road Elementary School 28.3%
Auburn Early Education Centers 28.3%
Cary Woods Elementary School 27.0%
JF Drake Middle School 26.7%
Dean Road Elementary School 26.0%
Auburn Junior High School 25.6%
Auburn High School 22.8%
Ogletree Elementary School 17.5%
continued
Table 2: Students Receiving Free/Reduced Lunches through the NSLP in Lee County (continued)
School Percentage of Student Body Receiving Free/Reduced Lunch
——————————Lee County Schools——————————
Loachapoka Elementary School 91.4%
Loachapoka High School 89.3%
Beauregard Elementary School 54.8%
Sanford Middle School 54.2%
Beulah Elementary School 52.0%
East Smiths Station Elementary School 44.9%
Beauregard High School 44.6%
Beulah High School 42.3%
Smiths Station Freshman Center N/A
Smiths Station High School 29.7%
Wacoochee Junior High School 42.1%
Smiths Station Intermediate 43.7%
Wacoochee Elementary School N/A
Smiths Station Primary School 43.7%
———————————Opelika City Schools———————————
Opelika Learning Center 89.6%
West Forest Intermediate School 85.7%
Carver Primary School 86.2%
Morris Avenue Intermediate School 62.1%
Opelika Middle School 62.1%
Southview Primary School 59.9%
Jeter Primary School 52.1%
Opelika High School 52.1%
Northside School 51.3%

22 ALABAMA AGRICULTURAL EXPERIMENT STATION LEE COUNTY COMMUNITY FOOD SECURITY ASSESSMENT 23
dent when considering nutrient intake. Studies have shown that children from food insecure and marginally food secure households receive a larger portion of their daily food and nutrient intakes at school than do their peers from food secure households (Potamites and Gorden 2010). Additionally, participation in the NSLP is proven to reduce behavioral problems among children experiencing hunger (Dunifon and Kowaleski-Jones 2001). Th ese data support an observa-tion made by a guidance counselor at Carver Primary School who said that when children are hungry, they tend to require more attention and disciplinary action from teachers and administrators (Lowe 2012). Th ough the NSLP is proven to reduce incidence of hunger among food in-secure children, national debate over the quality of meals provided through the NSLP has become increasingly prevalent in recent years. With rapidly increasing rates of childhood obesity and diabetes, many are demanding that the nutri-tional requirements of the NSLP be reevaluated. Local school authorities (i.e. school lunchroom managers and school system nutrition coordinators) are responsible for meeting the nutritional guidelines es-tablished by the NSLP but have fl exibility to decide which foods are served and how they are prepared (FNS 2011). In Lee County, Auburn City, and Opelika City schools there are decentralized lunch menus. Th is means that every school in the county has a lunchroom manager. Lunchroom managers are responsible for constructing a weekly menu based on recipes provided by the USDA. Nutri-tion coordinators are asked to ensure that menus meet the nutritional guidelines of the NSLP (Page 2012). As suggested in Table 3, the overwhelming majority of food served to Lee County students is purchased by the State of Alabama from the USDA. Howev-er, this does not mean that school systems and individual schools are prohibited from purchasing food from other entities. In fact, at the national level there is a growing initiative that encourages school systems to purchase their fresh fruits and vegetables from local and regional farmers. Th is initiative is commonly re-ferred to as “farm-to-school.” In Alabama, there are very few school systems that have embraced the farm-to-school movement. However, Opelika City Schools are an exception. Under the direction of recently retired Nutrition Coordinator Melanie Paine, Opelika City Schools made a cohesive eff ort to bring better nutrition to Opelika stu-dents. In 1994 Paine “shut off all of the fryers” in the cafeterias and initiated a switch from traditional food-based menu planning to nutrient standard menu planning (Paine 2012). In simple terms, nutrient standard menu planning fo-
cuses on the nutritional quality of food served, whereas traditional food-based menu planning focuses on the quan-tity, or volume, of food served (USDA 2000). With the switch to nutrient stan-dard menu planning, Paine began incorporating more fresh fruits and vegetables into Opelika school lunch menus. During her tenure as Opelika City School Nutrition Director, Paine established a partnership with the New North Florida Cooperative to obtain fruits and vegetables from farmers lo-cal to the Southeast. Farmers affi liated with the New North Florida Coop-erative focus on harvesting fruits and vegetables strictly for school systems in the Southeast. For this reason, schools that purchase through the New North Florida Cooperative are assured that the products they purchase fulfi ll the safety and nutritional standards of the NSLP. For more information on the
Table 3: Decision-Making Scheme within the NSLP and Lee County School System
USDA Food and Nutrition Services establishes nutrional guidelines for the NSLP
↓The State of Alabama purchases food from the USDA. This food in-cludes frozen meat, canned and frozen vegetables, fresh and frozen fruit, cheese, and pasta
↓This food is distributed weekly to each school system. Nutrition coor-dinators divide food among school.
↓Lunchroom managers construct weekly menus based on available food items
↓Nutrition coordinators review menus for compliance and purchase any additional food items
New North Florida Cooperative visit http://www.farmtoschool.org/state-pro-grams.php?action=detail&pid=32. Many school systems, like Opelika City Schools, obtain their fresh and local produce from cooperative entities as opposed to independent local farmers. Th is is because maintaining a lasting relationship with an unaffi liated local farmer can be extremely diffi cult. Many small farmers do not possess the ability or desire to single-handedly produce suffi cient quantities of food for an entire school system. In Lee County there are no farmers that regularly provide fresh produce to any school despite the presence of high demand (Paine 2012). In attempting to bring more local fruits and vegetables into Opelika City Schools, Paine found that the majority of the farmers in Lee County and surrounding counties are willing to the sell only surplus produce to the school system. Due to safety restrictions,

24 ALABAMA AGRICULTURAL EXPERIMENT STATION LEE COUNTY COMMUNITY FOOD SECURITY ASSESSMENT 25
school systems are not able to serve such surplus produce to children. In this context, surplus produce refers to produce that was taken to market but could not sell for a price premium. Th e USDA, among other state, federal, and private organizations, recognizes that the farm-to-school initiative is mutually benefi cial for both local farmers and students. However, implementing a successful farm-to-school program re-quires complete commitment and cooperation from nutrition directors, school administrators, school boards, and lunchroom managers (Paine 2012). Accord-ing to Paine (2012), success is also dependent on allocation of work. Farm-to-school programs are more likely to succeed if the only job of the school lunch-room managers is to construct healthy menus. In some schools, including Lee County Schools, lunchroom managers have to commit a considerable amount of time to completing administrative paperwork. Sample lunch menus from Lee County, Auburn City, and Opelika City schools are shown in Table 4. Because these schools participate in the School Breakfast Program, daily breakfast menus are also listed. Breakfasts listed were served on the same day as the sample lunch. Sample schools and menus were selected at random. Th ese menus help illustrate the fl exibility that lunchroom managers and nu-trition coordinators have in constructing menus that meet the guidelines of the NSLP. Notice the diff erence in the types of food served in each school district. Th ese diff erences ultimately infl uence the health and well-being of students.
Food Pantries and Soup Kitchens in Lee County Food pantries and soup kitchens function as direct providers of emergency food assistance. Food pantries distribute unprepared food for off site use. Soup kitch-ens provide prepared food for consumption onsite. It comes without surprise that use of food pantries and soup kitchens is strongly correlated with food insecurity. Food insecure households are fi fteen times more likely to receive food from a food pantry than food secure households and nineteen times more likely to receive a prepared meal from a soup kitchen (Nord, Coleman-Jensen, An-drews, and Carlson 2009). In Lee County, there are approximately 50 known food pantries and 42 known soup kitchens. Eleven of the known food pantries also serve prepared food onsite. Th ese numbers are based on agencies (food pantries or soup kitch-ens) that are authorized to purchase food from the Food Bank of East Alabama.
Table 4. Sample Breakfast and Lunch Menus from Schools in Lee County
Lee County Schools(Lochapoka High School)
Auburn City Schools(J.F. Drake Middle School)
Opelika City Schools(Morris Avenue Intermediate School)
————————————Breakfast————————————
Sausage biscuit with jelly, or cereal crackerJuice or milk
Strawberry pancakesJuice or milk
Oatmeal, or cerealFruit pastry, orchoice of fruitJuice or milk
————————————Lunch—————————————
Hot dog with chiliBaked beansColeslaw FruitMilk
Chicken nuggetsTaters n’ gravyLima beansRollFresh fruitGram dots
Grilled chickenWhole wheat bunWhole kernel cornPineapple
Th e Food Bank of East Alabama is one of eight food banks in the Alabama Food Bank Association. In addition to Lee County, the Food Bank of East Alabama services Chambers, Russell, and Barbour counties as well as parts of Macon, Tal-lapoosa, and Bullock counties. Supermarkets and food companies provide the majority of food distributed by the Food Bank of East Alabama. Rather than wasting their surplus food prod-ucts, supermarkets and food companies donate it to the Food Bank. Th e Food Bank then distributes the food to member agencies. Agencies achieve and retain membership by fulfi lling fi ve criteria:
• Th e agency must provide food for needy people free of charge;• Th e agency must maintain a regular feeding program;• Th e agency must be a 501(c)(3) nonprofi t or a church;• Th e agency must participate in the shared maintenance fee for food received from the Food Bank; and• Th e agency must give Civil Rights Assurances to all clients served.
Agencies operating food pantries that purchase food from a food bank are required to interview and approve all households that seek food assistance. In order for a household to receive food aid from an agent authorized to purchase food the from Food Bank, the household must either (1) receive WIC or TANF, (2) receive SNAP benefi ts, (3) receive SSI, or (4) have an income that is below

26 ALABAMA AGRICULTURAL EXPERIMENT STATION LEE COUNTY COMMUNITY FOOD SECURITY ASSESSMENT 27
130 percent of the federal poverty level. Often households are referred to food pantries or soup kitchens by housing assistance agencies, health practitioners, WIC, elderly services, or the Department of Human Resources (Community Market 2012). Figure 11 shows locations of food pantries in Lee County administered by agencies registered with the Food Bank of East Alabama. Only the 24 food pan-tries that accept client referrals are indicated on the map. Th e other 26 food pan-tries distribute food only to individuals affi liated with the agency. Often times these agencies are churches and provide emergency food assistance only to their congregation. From this map we see that open food pantries are notably absent from a number of highly vulnerable block groups. Lee County food pantries range in the number of individuals and households they are capable of serving. Th e pantry serving the most individuals is the Com-munity Market of East Alabama. Located between Auburn and Opelika on Pep-perrell Parkway, the Community Market serves approximately 1,030 households per month. Lakeview Baptist Church and Christian Care Ministries operate the second and third largest pantries. Th ese pantries serve approximately 470 and 345 households per month, respectively. Of the food pantries that accept client referrals, the median number of households served is approximately 66. Exclud-ing the three largest pantries, the mean number of households served by the pantries that accept client referrals is approximately 89. It is important to note that many of the individuals accounted for in these statistics are receiving food from multiple food pantries. Particularly among the larger pantries, there is a limit to how many times each individual can receive food in a twelve-month period. For example, at the Auburn United Methodist Church food pantry, individuals can receive food only four times every twelve months. After people reach their maximum number of visits at one pantry, they must rely on the donations of other pantries. Each food pantry establishes its own fi gure for number of allowable visits per individual per twelve months. Each food pantry also distributes food a diff erent number of times per week or per month. While some pantries distribute one day each week, others dis-tribute only once or twice each month. With the variation between number of allowable visits, distribution days, and distribution times, it is extremely diffi cult for people needing emergency food assistance to determine the food pantry to which they should go. Th e Community Market of East Alabama, which is by far the largest food pantry in Lee County, is directly affi liated with the Food Bank of East Alabama
Figure 11. Location of food pantries that accept client referrals relative to number of households most vulnerable for experiencing food insecurity
and opened its doors in 2003. Th e Market is open six days a week, maintains regular business hours, has a full-time staff , and is “client choice,” which means that individuals receiving food from the Community Market are allowed to se-lect all of the items they place in their shopping carts. In 2011, the Community Market served 3,001 Lee County households and distributed 921,082 pounds of food. Compiling all client demographic infor-mation, we know that 41 percent of households were from Lee County, 39 percent were from Opelika, and 20 percent were from Auburn while 55 percent of households served were Caucasian, 40 percent were African-American, and 5 percent were classifi ed as “other.” According to the 2010 Census, Lee County’s population was 71 percent white and 23 percent African American. Several soup kitchens operate in Lee County, but very few are open to indi-viduals not associated with the administering agency. Only eight soup kitchens accept client referrals. Seven of these eight soup kitchens operate in conjunc-tion with a food pantry that accepts client referrals. Th e soup kitchen serving the largest number of people is that administered by Christian Care Ministries, which also operates the second largest food pantry in the county.

28 ALABAMA AGRICULTURAL EXPERIMENT STATION LEE COUNTY COMMUNITY FOOD SECURITY ASSESSMENT 29
Several groups in Lee County that operate food pantries or soup kitchens are not registered as agencies with the Food Bank of East Alabama. Because they are not registered agencies, these groups cannot purchase food from the Food Bank. With no parent organization monitoring these groups, there is no way of defi ni-tively identifying all of them and their distribution capacities. One example of these groups is Feeding God’s Children. Feeding God’s Children is built around a summer feeding program. Th e sum-mer feeding program operates for eleven weeks each summer and is designed to supplement the fi ve subsidized breakfasts and lunches that children receive during the school year through the School Breakfast Program and the National School Lunch Program. In the summer of 2009, Feeding God’s Children pro-vided approximately 23,000 meals to 240 children between the ages of 5 and 17. Th ese children all lived in residential districts administered by the Opelika Housing Authority.
Transportation and Food Security in Lee County Transportation has a powerful infl uence on food security in Lee County. In 2011, 51 percent of the 3,001 households served by the Community Market of East Alabama did not have access to a working vehicle (Community Market of East Alabama 2011). Th is fi gure stands in relation to the 1.9 percent of all Lee County households that do not have a vehicle (US Census Bureau American Community Survey 2010). Households that do not possess a vehicle must rely on alternative means of transportation, such as carpooling or public transportation to commute to work, to get food, and to carry out other important tasks. From the American Com-munity Survey (2010), we know that in Lee County more than 7,000 workers carpool to work and more than 500 workers use public transportation. Table 5 lists the 32 most vulnerable block groups within the county along with the num-ber of individuals in each block group that either carpool or take public trans-portation to work. Appendix C: Primary Means of Transportation of Employed Lee County Residents presents maps illustrating the countywide distribution of individuals who carpool and take public transportation to work. In Lee County there are only two public transportation systems. Th ese sys-tems are Tiger Transit, a service provided by Auburn University, and Lee-Russell Public Transit (LRPT). Th ough Tiger Transit is, in fact, not a public transporta-tion system and is intended for use only by Auburn University faculty, staff , and students, there is no mechanism in place for drivers to verify that passengers are
Table 5. Most Vulnerable Block Groups and Primary Means of Transportation by Employed Individuals
Rank Census Tract
Block Group
NumberCarpooling
Number Using Public Transportation
1 408 2 87 2
2 406.04 1 11 0
3 408 1 28 0
4 406.04 2 158 15
5 409.02 3 308 0
6 406.03 1 60 0
7 404 4 117 0
8 416 1 43 0
9 403 2 28 0
10 402 3 205 15
11 411 2 98 0
12 413 3 46 0
13 414 3 183 0
14 410 2 167 0
15 417 4 30 0
16 402 4 259 0
continued
employed by, or attend, Auburn University. Subsequently, individuals unaffi li-ated with the University take advantage of the free service. For more informa-tion on the Auburn areas serviced by Tiger Transit visit http://www.auburn.edu/administration/parking_transit/transit/index.php. Lee-Russell Public Transit services all of Lee County and Russell County. It is a curb-to-curb, dial-a-ride service that operates Monday through Friday between 8:00 a.m. and 2:00 p.m. Central Time. “Curb-to-curb” means that LRPT pas-sengers are responsible for getting themselves from their homes to the street curb for pick-up. Passengers with physical disabilities must make their own arrange-ments for assistance to the curb if necessary. “Dial-a-ride” means that LRPT is a demand response service. Passengers must schedule rides in advance. Rides are given on a fi rst-come, fi rst-served basis and are dependent on the availability of space. One-way fares range anywhere from $1.00 to $6.00.

30 ALABAMA AGRICULTURAL EXPERIMENT STATION LEE COUNTY COMMUNITY FOOD SECURITY ASSESSMENT 31
Th e limited service area of Tiger Transit and the various restrictions of the dial-a-ride, curb-to-curb LRPT make public transportation a less than desirable way to travel about the county for food insecure households lacking access to a reliable vehicle. From Table 5 we see that many individuals residing in Lee County’s most vulnerable block groups do not use the services provided by the available transportation systems. Observations made at local food pantries sug-gest that many food insecure individuals instead rely on family and friends for transportation when they must visit a food pantry or shop at a local food retailer. Th is dependency often adds considerable stress and uncertainty to the processes of obtaining food.
Table 5. Most Vulnerable Block Groups and Primary Means of Transportation by Employed Individuals (continued)
Rank Census Tract
Block Group
NumberCarpooling
Number Using Public Transportation
17 414 4 12 0
18 411 1 101 3
19 406.02 1 105 0
20 406.02 2 2 15
21 414 2 58 4
22 407 1 169 0
23 409.02 2 30 0
24 416 2 92 0
25 406.04 3 47 3
26 418 1 46 0
27 413 2 69 0
28 421.01 2 46 0
29 411 4 83 15
30 414 1 134 0
31 421.01 3 125 43
32 402 2 195 0
FOOD UTILIZATION
Food Utilization in the United StatesTh e Standard American Diet (SAD) is a diet pattern that is defi ned by excess con-sumption of calories from refi ned carbohydrates and fat-laden animal products and insuffi cient consumption of the nutrients found in whole grains, fruit, and vegetables. Improper utilization of available food by the majority of Americans has resulted in rapidly increasing rates of diet-related diseases and conditions. Such diseases and conditions include type 2 diabetes mellitus, hypertension, cer-tain cancers, metabolic dysfunctions, and heart disease (Grotto and Zied 2010). Consumption of calorically dense and nutrient-poor diets among Americans is largely the result of behavioral changes. Increased snacking among adults and children, increased participation in food-related activities, and increased con-sumption of food away from home all function as contributing factors. Accord-ing to a recent study, Americans spend on average nearly 45 percent of their food budget on dining way from home. Food purchased while dining out typically comes in larger portion sizes and is calorically dense (Grotto and Zied 2010).
Food Utilization in Lee CountyBecause there has been no assessment conducted to specifi cally evaluate food utilization among Lee County residents, we must assume that local food con-sumption patterns mimic the trends identifi ed at the national level. It is likely that a majority of Lee County residents maintain calorically high and nutrient-poor diets. Despite the absence of data on typical food consumption patterns in Lee County, we are able to quantify some of the diet-related health eff ects experi-enced by the local population. Th e U.S. Center for Disease Control and Preven-tion (CDC) monitors these health eff ects. In this section we will look closely at the diet-related health eff ect of diabetes and the two primary risk factors for diabetes: obesity and physical inactivity (CDC 2009). In 2009 the CDC estimated for each U.S. county the percentage and number of adults who are obese. In Lee County an estimated 29.8 percent of the adult population, amounting to approximately 29,282 individuals, is obese. In the same survey the CDC also estimated physical inactivity among the adult popu-lation. In Lee County approximately 27.4 percent of the adult population, or 26,745 individuals, is considered physically inactive.

32 ALABAMA AGRICULTURAL EXPERIMENT STATION LEE COUNTY COMMUNITY FOOD SECURITY ASSESSMENT 33
Obesity and physical inactivity are risk factors for diabetes. In 2009, 11.3 percent of the adult population in Lee County was diagnosed with diabetes (CDC 2009). In Alabama, the correlation between obesity and diabetes has grown stronger in the past fi fteen year. Today, 55.4 percent of Alabama adults diagnosed with diabetes are obese (CDC 2011). In 1995 that percentage was only 38.2 percent. Diabetes is a disease with life-altering and life-threatening complications. Fig-ure 12 illustrates the percentage of deaths caused by diabetes in Lee County. We see from this chart that incidence of death due to diabetes has increased in the past 20 years.
Health Consequences of Food InsecurityFood insecurity is a circumstance experienced by a signifi cant number of Lee County households. For this reason, it is necessary to consider the diet-related health eff ects that are unique to food insecure populations. Two notable conse-quences independently related to food insecurity include increased incidence of obesity among adult women, increased incidence of diabetes, and increased incidence of psychosocial problems among school-aged children (Olson 1999). SNAP participation possesses a positive correlation with obesity among non-elderly adult women. However, obesity among food insecure women is not de-pendent on SNAP participation. Household food insecurity—independent of socioeconomic status, poverty, or SNAP participation—is proven to directly relate to a higher body mass index (BMI) among women (Olson 1999). A 1999 study conducted by the Division of Nutritional Sciences at Cornell University (Olson 1999) revealed that women who live in food insecure households are shown to have an average BMI of 28.2 while women who live in food secure households are shown to have an average BMI of 25.6. BMI, as defi ned by the CDC (2011), “is a number calculated from a person’s height and weight…[that] provides a reliable indicator of body fatness for most people and is used to screen for weight categories that lead to health problems.” As such, a lower BMI is healthier than a higher BMI. Type 2 diabetes mellitus is another health consequence that displays an inde-pendent association with food insecurity (Sligman et al. 2007). An assessment of the 1999-2002 National Health Examination and Nutrition Examination Survey (Sligman et al. 2007) suggests that adults experiencing food insecurity are more likely to consume inexpensive foods that are often calorically dense and
1.42
2.78
3.4
2.66
5.23
0.00
1.00
2.00
3.00
4.00
5.00
6.00
1990 1995 2000 2005 2010
Pe
rce
nta
ge
Year
Figure 12. Percentage of deaths due to diabetes in Lee County, 1990-2010
nutritionally poor. Regular consumption of such foods has been associated with the development of both obesity diabetes. Another signifi cant health consequence of food insecurity is increased inci-dence of psychosocial problems among school-aged children. Again, this con-sequence is independent of socioeconomic status and poverty. Examples of psychosocial problems among school-aged children include fi ghting with other children, having trouble with a teacher, and taking things from other children that do not belong to him/her (Olson 1999).
NEXT STEPSTh e fi ndings of this report reveal that there are a number of food-related prob-lems in Lee County. Th e majority of these problems function as constraints to the ability of low-income households to access nutritious food on a regular and consistent basis. However, within these problems lie opportunities—opportuni-ties for collaborative action and positive change. Lee County residents, organi-zations, and policymakers have the ability to not only overcome the problems associated with household food insecurity but also expand upon a vibrant and viable local food system.

34 ALABAMA AGRICULTURAL EXPERIMENT STATION LEE COUNTY COMMUNITY FOOD SECURITY ASSESSMENT 35
Th is assessment is a fi rst step in identifying constraints and opportunities to community food security. A more comprehensive evaluation that involves a wide spectrum of stakeholders is the next step. Among stakeholders who should be involved are current and past clients of food pantries; religious, civic, and political leaders; health professionals; school nutrition directors; and university researchers familiar with local food systems. Th is more comprehensive evalua-tion should follow a collaborative and participatory methodology that ensures all local voices are heard. A comprehensive evaluation of Lee County’s food system is one that will re-quire both organization and leadership. Following the precedent established by numerous communities across the United States, the creation of a food policy council within Lee County is suggested. Such a council would facilitate an evalu-ation of Lee County’s food system and would work to implement resulting rec-ommendations. Creation of a food policy council with broad representation of stakeholders interested not only in food security but also in local food systems at large is a pressing need of our community. Understanding Food Policy CouncilsTh e North American Food Security Coalition (2012) has this to say about food policy councils:
Food Policy Councils (FPCs) bring together stakeholders from diverse food-related sectors to examine how the food system is operating and to develop recommendations on how to improve it. FPCs may take many forms, but are typically either commissioned by state or local govern-ment, or predominately a grassroots eff ort. Food policy councils have been successful at educating offi cials and the public, shaping public poli-cy, improving coordination between existing programs, and starting new programs.
Th e North American Food Policy Council is a service of the Community Food Security Coalition and functions to develop local food policy councils and provide support to those already in existence. More than 100 food policy councils nationwide are connected through this network and the services of the North American Food Policy Council. Th ough each of the more than 100 FPCs nationwide diff ers in its origin, structure, practices, and policies, they all are motivated by four primary objec-tives:
• to coordinate all elements of the local food system by bringing together stakeholders from diverse sectors on a regular and consistent basis, • to identify problems and opportunities within the local food system,• to work to educate and engage policy makers and citizens in food-related matters, and• to infl uence and develop food-related policy (Winne 2012).
With these objectives, FPCs across the country have achieved signifi cant re-sults. Here are just a few examples of the changes and contributions facilitated by FPCs.
•Th e City of Hartford Advisory Commission on Food Policy: Th is Advisory Commission is known for its consistent monitoring of local hunger and food insecurity via its Hunger Task Force. Th e Hunger Task Force conducts a quar-terly survey of participation in public and private assistance programs such as WIC, school meals, and emergency food agencies. Th e fi gures are then reported to city leaders, community leaders, and church groups (Biehler et al. 1998). • Th e Austin-Travis County Food Policy Council: Th is FPC has taken active measures to overcome transportation constraints contributing to household food insecurity. After assessing transportation demand in areas of high food insecurity, the FPC pushed for the addition of a bus route that circulates from public housing units to supermarkets and other community resources. Th is bus route is still in service today (Biehler et al. 1998). • Knoxville Food Policy Council: Created in 1977, the Knoxville Food Policy Council is known as the fi rst FPC in the United States. Since its establish-ment, this FPC has been particularly active in advocating for and facilitating nutrition education. More specifi cally, this FPC advocated for the addition of a nutrition educator to the Knoxville Public School Districts and created the Calorie Conscious Consumer award. Th e Calorie Conscious Consumer award is designed to honor and promote local food businesses that off er dis-plays or written material to assist consumers in making healthier food choices (Biehler et al. 1998). • St. Paul-Ramsey County Food and Nutrition Commission: Since 1985 this Commission has devoted considerable time and resources to disseminating information on the local food system and encouraging a public dialogue about local food-related issues. Th e Commission publishes an annual direc-tory of food-related agencies, promotes community gardens by publicizing

36 ALABAMA AGRICULTURAL EXPERIMENT STATION LEE COUNTY COMMUNITY FOOD SECURITY ASSESSMENT 37
relevant information, and organizes an annual Hunger Forum to stimulate public discussion about local issues of hunger and food insecurity (Biehler et al. 1998). • Berkeley Unifi ed School District Food Policy Collaborative: Th e objective of this Collaborative is to fully integrate the school district into the local food system. In pursuit of this objective the Collaborative has taken active mea-sures to develop self-sustaining networks between schools cafeterias, school gardens, and local growers and producers (Biehler et al. 1998).
All of the food policy councils named above serve as examples for the posi-tive change that can occur when people prioritize food. However, before taking action to promote and facilitate change, each of these food policy councils had to fully assess the food systems that they hoped to better. Conducting a com-prehensive community food security assessment is critical to the success of any food policy council. It is for this reason that we have recommended that the fi rst action of a local food policy council in Lee County be a collaborative and participatory evaluation of the food system and community food security. Appendix D: Literature and Resources on Food Policy Councils presents a lit-erature and resource guide on food policy councils. Th e items listed in this guide are broad in their consideration and, together, present an excellent overview of food policy councils, their purpose, and their various structures, practices, and policies. Th ough there are numerous publications and resources that address issues of food policy, the few items presented in this Appendix have been specifi -cally selected to assist in the creation of a food policy council that is appropriate for Lee County.
Moving Forward in Lee County Creation of a food policy council is the next logical step in the promotion of community food security in Lee County. A food policy council will provide a forum to address often overlooked problems and opportunities within our food system. Currently, no such forum exists though some individuals in Lee County have held several exploratory meetings and have interacted with food policy councils that have been established or are in the process of formation in Hunts-ville, Birmingham, and Montgomery. Developing a local food policy council demands the commitment of time, energy, and resources by a diverse body of stakeholders within Lee County’s food system. It is our hope that this assessment inspires readers and residents
of Lee County to understand the need for a food policy council and take active measures in creating one. Lee County has a well-educated population with a strong commitment to meeting the food needs of local residents. We have many organizations working to meet these needs, and we have the potential to expand production of local foods that would improve local diets and, thereby, health of Lee Countians, including those who are food insecure. We are poised for the next step.

38 ALABAMA AGRICULTURAL EXPERIMENT STATION LEE COUNTY COMMUNITY FOOD SECURITY ASSESSMENT 39
APPENDIX A. LEE COUNTY HOUSEHOLD CHARACTERISTICS
Figure A-1. Number of individuals over age 25 without a high school diploma or equivalent by census tract (U.S. Census Bureau 2010)
Figure A-2. Number of unemployed individuals by census tract (U.S. Census Bureau 2010)
Figure A-3. Number of single parent households with children under age 18 by census tract (U.S. Census Bureau 2010)
Figure A-4. Number of black, Hispanic, and Latino households by census tract (U.S. Census Bureau 2010)
40 ALABAMA AGRICULTURAL EXPERIMENT STATION LEE COUNTY COMMUNITY FOOD SECURITY ASSESSMENT 41
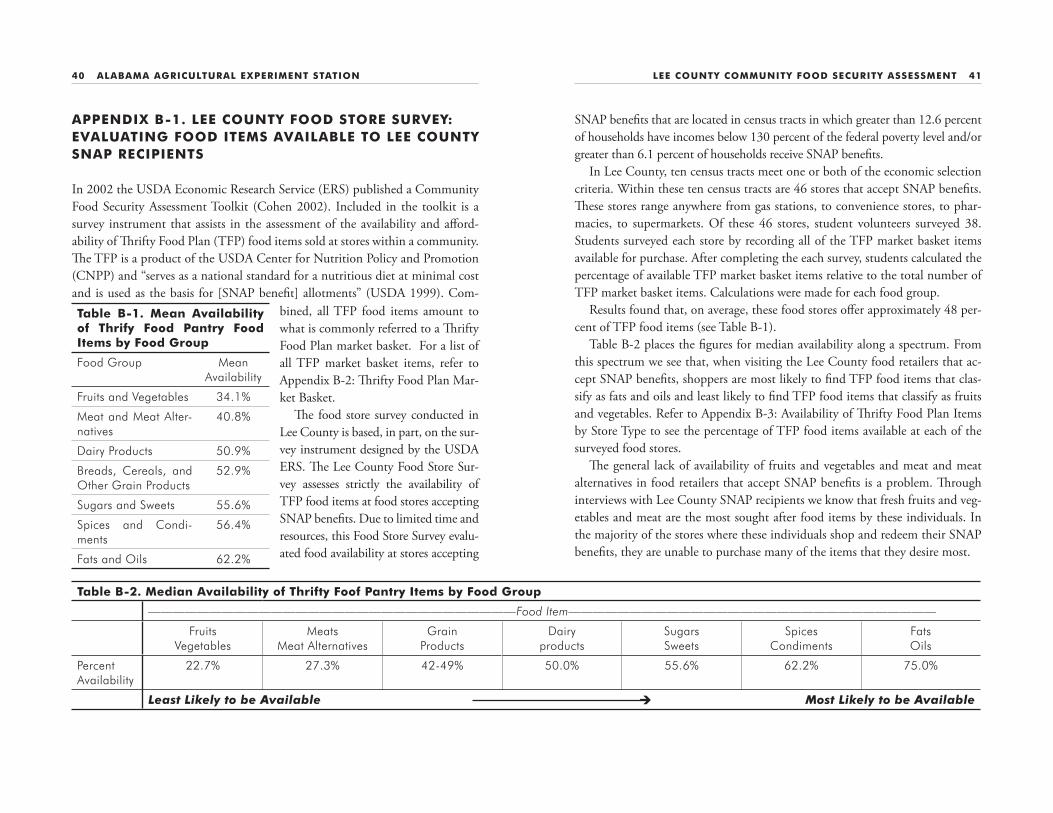
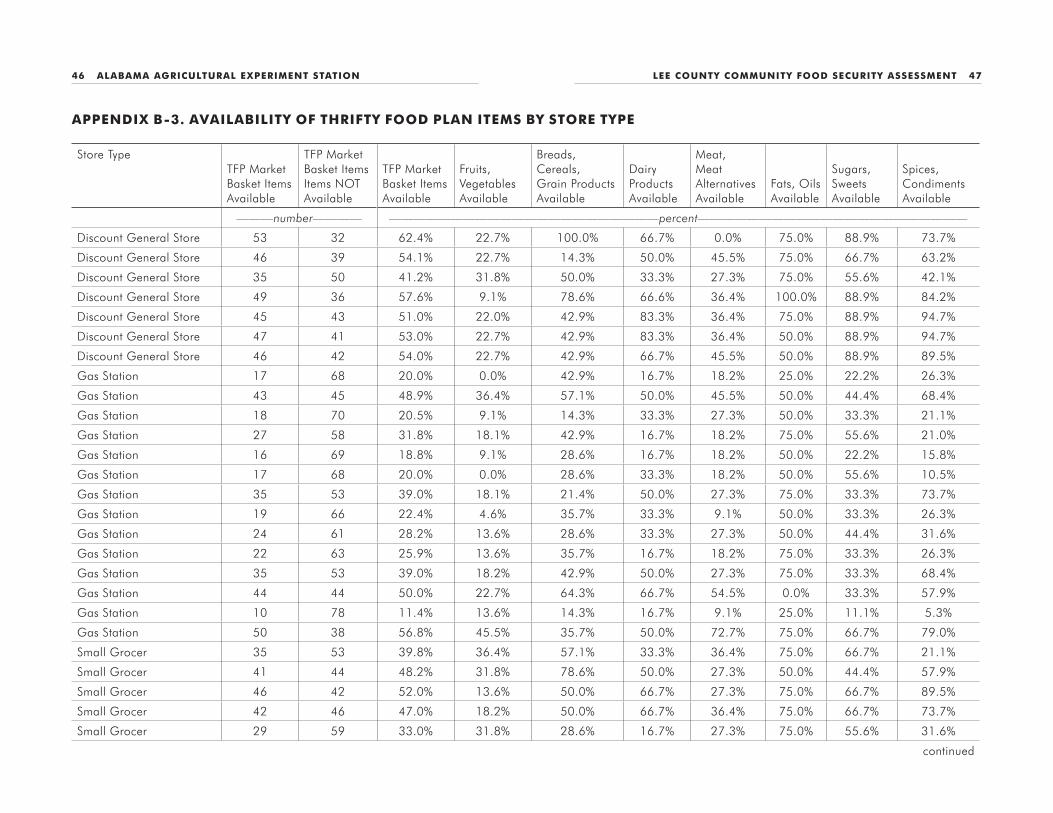
SNAP benefi ts that are located in census tracts in which greater than 12.6 percent of households have incomes below 130 percent of the federal poverty level and/or greater than 6.1 percent of households receive SNAP benefi ts. In Lee County, ten census tracts meet one or both of the economic selection criteria. Within these ten census tracts are 46 stores that accept SNAP benefi ts. Th ese stores range anywhere from gas stations, to convenience stores, to phar-macies, to supermarkets. Of these 46 stores, student volunteers surveyed 38. Students surveyed each store by recording all of the TFP market basket items available for purchase. After completing the each survey, students calculated the percentage of available TFP market basket items relative to the total number of TFP market basket items. Calculations were made for each food group. Results found that, on average, these food stores off er approximately 48 per-cent of TFP food items (see Table B-1). Table B-2 places the fi gures for median availability along a spectrum. From this spectrum we see that, when visiting the Lee County food retailers that ac-cept SNAP benefi ts, shoppers are most likely to fi nd TFP food items that clas-sify as fats and oils and least likely to fi nd TFP food items that classify as fruits and vegetables. Refer to Appendix B-3: Availability of Th rifty Food Plan Items by Store Type to see the percentage of TFP food items available at each of the surveyed food stores. Th e general lack of availability of fruits and vegetables and meat and meat alternatives in food retailers that accept SNAP benefi ts is a problem. Th rough interviews with Lee County SNAP recipients we know that fresh fruits and veg-etables and meat are the most sought after food items by these individuals. In the majority of the stores where these individuals shop and redeem their SNAP benefi ts, they are unable to purchase many of the items that they desire most.
APPENDIX B-1. LEE COUNTY FOOD STORE SURVEY: EVALUATING FOOD ITEMS AVAILABLE TO LEE COUNTY SNAP RECIPIENTS
In 2002 the USDA Economic Research Service (ERS) published a Community Food Security Assessment Toolkit (Cohen 2002). Included in the toolkit is a survey instrument that assists in the assessment of the availability and aff ord-ability of Th rifty Food Plan (TFP) food items sold at stores within a community. Th e TFP is a product of the USDA Center for Nutrition Policy and Promotion (CNPP) and “serves as a national standard for a nutritious diet at minimal cost and is used as the basis for [SNAP benefi t] allotments” (USDA 1999). Com-
bined, all TFP food items amount to what is commonly referred to a Th rifty Food Plan market basket. For a list of all TFP market basket items, refer to Appendix B-2: Th rifty Food Plan Mar-ket Basket. Th e food store survey conducted in Lee County is based, in part, on the sur-vey instrument designed by the USDA ERS. Th e Lee County Food Store Sur-vey assesses strictly the availability of TFP food items at food stores accepting SNAP benefi ts. Due to limited time and resources, this Food Store Survey evalu-ated food availability at stores accepting
Table B-1. Mean Availability of Thrify Food Pantry Food Items by Food Group
Food Group Mean Availability
Fruits and Vegetables 34.1%
Meat and Meat Alter-natives
40.8%
Dairy Products 50.9%
Breads, Cereals, and Other Grain Products
52.9%
Sugars and Sweets 55.6%
Spices and Condi-ments
56.4%
Fats and Oils 62.2%
Table B-2. Median Availability of Thrifty Foof Pantry Items by Food Group
——————————————————————————————Food Item——————————————————————————————
FruitsVegetables
MeatsMeat Alternatives
GrainProducts
Dairyproducts
Sugars Sweets
SpicesCondiments
FatsOils
PercentAvailability
22.7% 27.3% 42-49% 50.0% 55.6% 62.2% 75.0%
Least Likely to be Available Most Likely to be Available

42 ALABAMA AGRICULTURAL EXPERIMENT STATION LEE COUNTY COMMUNITY FOOD SECURITY ASSESSMENT 43
APPENDIX B-2. THRIFTY FOOD PLAN MARKET BASKET
————————Fresh Fruits and Vegetables————————
Apples, any variety
Bananas
Grapes (green/red)
Melon (canteloupe, honeydew, watermelon, other)
Oranges
Carrots
Celery
Green pepper
Lettuce, loose-leaf (green/red)
Onions, yellow
Potato, any variety
Tomatoes, any variety
————————Canned Fruits and Vegetables————————
Oranges, mandarin, juice or light syrup
Peaches, juice or light syrup
Mushrooms, pieces
Spaghetti sauce
Tomato sauce
————————Frozen Fruits and Vegetables ————————
Orange juice, concentrate
Broccoli, chopped
Green beans, any variety
Green peas, any variety
French fries, any variety
———————————Dairy Products———————————
Milk, 1% lowfat
Milk, whole
Cheese, cheddar, any variety
Cheese, cottage, lowfat
Cheese, mozzarella, part skim, not shredded
Evaporated whole milk
continued
Thrifty Food Plan Market Basket (continued)
——————Breads, Cereals, Other Grain Products——————
Bread, white, enriched
Bread, whole wheat, enriched
Hamburger buns, enriched
Dinner rolls, enriched
French or Italian-style bread,enriched
Bagels, plain, enriched
Bread crumbs, plain
Ready-to-eat cereal, corn flakes
Ready-to-eat cereal, toasted oats
Macaroni, elbow style, enriched
Noodles, yolk-free, enriched
Popcorn, microwave, unpopped
Rice, white, long grain, enriched
Spaghetti, any variety, enriched
———————Meat and Meat Alternatives, Fresh———————
Beef, ground, lean
Chicken fryer, cut-up or whole
Chicken thighs, boneless, skinless
Turkey, ground
Pork, ground
Turkey ham
————Meat and Meat Alternatives, Frozen or Canned————
Fish, flounder or cod, frozen
Tuna fish, chunk style, water packed, canned
Beans, garbanzo, chickpeas, canned
Beans, kidney, canned
Beans, baked, vegetarian, canned
continued

44 ALABAMA AGRICULTURAL EXPERIMENT STATION LEE COUNTY COMMUNITY FOOD SECURITY ASSESSMENT 45
Thrifty Food Plan Market Basket (continued)
——————————Sugars and Sweets——————————
Sugar, brown (dark or light)
Sugar, powdered
Sugar, white, granulated
Jelly, grape
Molasses, any type
Pancake syrup, any type
Chocolate chips, semi-sweet
Fruit drink, refrigerated, any flavor
Fudgesicles, ice milk
—————————Spices and Condiments—————————
Baking powder
Baking soda
Chili powder
Cinnamon
Cumin
Onion powder
Garlic powder
Italian herb seasoning
Oregano
Paprika
Black pepper, ground
Salt, any type
Vanilla, any type
Chicken bouillon, reduced sodium, cubes
Catsup, any type
Soy sauce, reduced sodium
Lemon juice, bottled
Gelatin, powdered, unflavored
Chocolate drink mix, powdered
continued
Thrifty Food Plan Market Basket (continued)
———————————Fats and Oils———————————
Margarine, stick style
Shortening, vegetable
Salad dressing, mayonnaise type
Vegetable oil, any type
46 ALABAMA AGRICULTURAL EXPERIMENT STATION LEE COUNTY COMMUNITY FOOD SECURITY ASSESSMENT 47
Store TypeTFP Market Basket Items Available
TFP Market Basket Items Items NOTAvailable
TFP Market Basket ItemsAvailable
Fruits,VegetablesAvailable
Breads, Cereals, Grain ProductsAvailable
Dairy ProductsAvailable
Meat, Meat AlternativesAvailable
Fats, OilsAvailable
Sugars, SweetsAvailable
Spices,CondimentsAvailable
———number———— ——————————————————————percent——————————————————————
Discount General Store 53 32 62.4% 22.7% 100.0% 66.7% 0.0% 75.0% 88.9% 73.7%
Discount General Store 46 39 54.1% 22.7% 14.3% 50.0% 45.5% 75.0% 66.7% 63.2%
Discount General Store 35 50 41.2% 31.8% 50.0% 33.3% 27.3% 75.0% 55.6% 42.1%
Discount General Store 49 36 57.6% 9.1% 78.6% 66.6% 36.4% 100.0% 88.9% 84.2%
Discount General Store 45 43 51.0% 22.0% 42.9% 83.3% 36.4% 75.0% 88.9% 94.7%
Discount General Store 47 41 53.0% 22.7% 42.9% 83.3% 36.4% 50.0% 88.9% 94.7%
Discount General Store 46 42 54.0% 22.7% 42.9% 66.7% 45.5% 50.0% 88.9% 89.5%
Gas Station 17 68 20.0% 0.0% 42.9% 16.7% 18.2% 25.0% 22.2% 26.3%
Gas Station 43 45 48.9% 36.4% 57.1% 50.0% 45.5% 50.0% 44.4% 68.4%
Gas Station 18 70 20.5% 9.1% 14.3% 33.3% 27.3% 50.0% 33.3% 21.1%
Gas Station 27 58 31.8% 18.1% 42.9% 16.7% 18.2% 75.0% 55.6% 21.0%
Gas Station 16 69 18.8% 9.1% 28.6% 16.7% 18.2% 50.0% 22.2% 15.8%
Gas Station 17 68 20.0% 0.0% 28.6% 33.3% 18.2% 50.0% 55.6% 10.5%
Gas Station 35 53 39.0% 18.1% 21.4% 50.0% 27.3% 75.0% 33.3% 73.7%
Gas Station 19 66 22.4% 4.6% 35.7% 33.3% 9.1% 50.0% 33.3% 26.3%
Gas Station 24 61 28.2% 13.6% 28.6% 33.3% 27.3% 50.0% 44.4% 31.6%
Gas Station 22 63 25.9% 13.6% 35.7% 16.7% 18.2% 75.0% 33.3% 26.3%
Gas Station 35 53 39.0% 18.2% 42.9% 50.0% 27.3% 75.0% 33.3% 68.4%
Gas Station 44 44 50.0% 22.7% 64.3% 66.7% 54.5% 0.0% 33.3% 57.9%
Gas Station 10 78 11.4% 13.6% 14.3% 16.7% 9.1% 25.0% 11.1% 5.3%
Gas Station 50 38 56.8% 45.5% 35.7% 50.0% 72.7% 75.0% 66.7% 79.0%
Small Grocer 35 53 39.8% 36.4% 57.1% 33.3% 36.4% 75.0% 66.7% 21.1%
Small Grocer 41 44 48.2% 31.8% 78.6% 50.0% 27.3% 50.0% 44.4% 57.9%
Small Grocer 46 42 52.0% 13.6% 50.0% 66.7% 27.3% 75.0% 66.7% 89.5%
Small Grocer 42 46 47.0% 18.2% 50.0% 66.7% 36.4% 75.0% 66.7% 73.7%
Small Grocer 29 59 33.0% 31.8% 28.6% 16.7% 27.3% 75.0% 55.6% 31.6%
continued
APPENDIX B-3. AVAILABILITY OF THRIFTY FOOD PLAN ITEMS BY STORE TYPE

48 ALABAMA AGRICULTURAL EXPERIMENT STATION LEE COUNTY COMMUNITY FOOD SECURITY ASSESSMENT 49
Availability of Thrifty Food Plan Market Basket Items by Store Type (continued) 1
Store TypeTFP Market Basket Items Available
TFP Market Basket Items Items NOTAvailable
TFP Market Basket ItemsAvailable
Fruits,VegetablesAvailable
Breads, Cereals, Grain ProductsAvailable
Dairy ProductsAvailable
Meat, Meat AlternativesAvailable
Fats, OilsAvailable
Sugars, SweetsAvailable
Spices,CondimentsAvailable
———number———— ——————————————————————percent——————————————————————
Specialty Store 35 50 41.2% 86.3% 14.3% 16.7% 27.3% 50.0% 33.3% 15.8%
Specialty Store 34 51 40.0% 13.6% 64.3% 33.3% 36.4% 50.0% 33.3% 57.9%
Specialty Store 16 72 18.0% 0.0% 0.0% 33.3% 90.9% 0.0% 0.0% 31.6%
Specialty Store 9 79 11.0% 4.6% 42.9% 0.0% 0.0% 0.0% 11.1% 5.3%
Specialty Store 18 67 20.5% 63.6% 100.0% 0.0% 0.0% 0.0% 0.0% 0.0%
Specialty Store 40 48 45.0% 22.7% 64.3% 50.0% 27.3% 50.0% 22.2% 79.0%
Supercenter 85 0 100.0% 100.0% 100.0% 100.0% 100.0% 100.0% 100.0% 100.0%
Supercenter 54 31 63.5% 41.0% 78.5% 83.3% 45.5% 100.0% 88.9% 68.4%
Supercenter 84 1 98.8% 100.0% 100.0% 100.0% 100.0% 100.0% 100.0% 94.7%
Supermarket 83 85 97.6% 91.0% 92.9% 100.0% 91.0% 100.0% 100.0% 100.0%
Supermarket 86 2 97.0% 100.0% 92.0% 100.0% 100.0% 100.0% 88.9% 100.0%
Supermarket 87 1 100.0% 100.0% 92.0% 100.0% 100.0% 100.0% 100.0% 100.0%1 See Appendix B-2 for a list of Thrifty Food Plan Market Basket items.

50 ALABAMA AGRICULTURAL EXPERIMENT STATION LEE COUNTY COMMUNITY FOOD SECURITY ASSESSMENT 51
APPENDIX C. PRIMARY MEANS OF TRANSPORTATION OF EMPLOYED LEE COUNTY RESIDENTS
Figure C-1. Number of people in workforce carpooling to work by block group (U.S. Census Bureau 2010)
Figure C-2. Number of people in workforce using public transportation to get to work by block group (U.S. Census Bureau 2010))
APPENDIX D. LITERATURE AND RESOURCES ON FOOD POLICY COUNCILS
LiteratureHarper, Althea, Annie Shattuck, Erik Holt-Gimenez, Alison Alkon, and
Frances Lambrick. 2009. “Food Policy Councils: Lessons Learned.” Oakland, CA: Food First: Institute for Food and Development.
Th is report presents tips and case studies for successful food policy councils and includes additional resources for individuals, organizations, and local gov-ernments interested in establishing a food policy council.
Biehler, Dawn, Andy Fisher, Kai Siedenberg, Mark Winne, and Jill Zach-ary. 1998. “Getting Food on the Table: An Action Guide to Local Food Policy.” Venice, CA: Community Food Security Coalition and Califor-nia Sustainable Agriculture Working Group.
Th is guidebook discusses how to conduct an inventory of existing food pol-icy, presents case studies on successful food policy councils, and provides guid-ance on organizing food policy councils.
Southern Sustainable Agriculture Working Group. 2005. “Chapter 4: How Food Policies Operate and Are Organized.” Fayetteville, AR: Southern Sustainable Agriculture Working Group.
Th is is a chapter in a handbook entitled Food Security Begins at Home: Creat-ing Community Food Coalitions in the South. It highlights the vital role of food policy councils.
Dahlberg, Kenneth, et al. 1997. “Strategies, Policy Approaches, and Re-sources, for Local Food System Planning and Organizing.” Minneapo-lis, MN: Minnesota Food Association.
Th is compilation provides analyses and discussion of the elements needed for organizing local food policy councils.
ResourcesTh e Alabama Sustainable Agriculture Network: Alabama Sustainable Agricul-ture Network (ASAN) is a network of farmers, consumers, and agriculture-related organizations in Alabama. Its membership consists of individuals and organizations
52 ALABAMA AGRICULTURAL EXPERIMENT STATION LEE COUNTY COMMUNITY FOOD SECURITY ASSESSMENT 53
committed to promoting sustainable agriculture in the state. ASAN has promoted and supported the creation of the Birmingham-Jeff erson Food Policy Council. More information about ASAN can be found on its webpage at http://asanonline.org/.
Greater Birmingham Community Food Partners: Greater Birmingham Com-munity Food Partners (GBCFP) is a grassroots organization with the mission of promoting community food security. GBCFP has helped establish the Birmingham-Jeff erson Food Policy Council, the fi rst food policy council in the state of Alabama. GBCFP has also conducted a number of smaller assessments of food security in the Greater Birmingham region. More information about GBCFP and the Birming-ham-Jeff erson Food Policy Council can be found at http://www.gbcfp.org/.
North American Food Policy Council: Th e North American Food Policy Coun-cil provides support, free of charge, in the development and operation of current and emerging food policy councils. It is a service of the Community Food Secu-rity Coalition. More information about the North American Food Policy Council can be found at http://www.foodsecurity.org/FPC/. Th is webpage includes sample documents from existing food policy councils, such as mission statements, by-laws, membership guidelines, and information on meetings and agendas.
P.L.A.C.E.: Promoting Local Agriculture & Cultural Experience, more com-monly known as P.L.A.C.E. is a non-profi t organization based in Athens, Ga. With the mission of promoting a strong, accessible food culture in Athens, P.L.A.C.E. serves as a fascinating model for how individuals can unite around food-related social, economic, and environmental opportunities. More informa-tion about P.L.A.C.E. can be found at http://localplace.org/.
Southern Sustainable Agriculture Working Group: Th e Southern Sustainable Agriculture Working Group (Southern SAWG) is a regional entity that advo-cates for a more sustainable farming and food system that is ecologically sound, economically viable, socially just, and humane. Southern SAWG works to build partnerships, share information, and conduct analyses in thirteen southern states. More information about Southern SAWG can be found at http://www.ssawg.org/.
BIBLIOGRAPHYAndrews, Margaret. 2010. “Food Security in the United States.” United States
Department of Agricultural Economic Research Service. Electronic. Ac-cessed 10 April 2012. http://www.ers.usda.gov/Briefi ng/FoodSecurity/community.htm.
Biehler, Dawn, Andy Fisher, Kai Siedenberg, Mark Winne, and Jill Zachary. 1998. “Getting Food on the Table: An Action Guide to Local Food Policy.” Venice, CA: Community Food Security Coalition and California Sustain-able Agriculture Working Group.
Brown, Charles. 2012. Personal interview. 26 March 2012.CDC. 2009. “County Level Estimates of Obesity, Diagnosed Diabetes, and
Physical Inactivity.” Centers for Disease Control and Prevention. Elec-tronic. Accessed 5 May 2012. http://apps.nccd.cdc.gov/DDT_STRS2/CountyPrevalenceData.aspx?mode=OBS.
CDC. 2011. “Body Mass Index.” Centers for Disease Control and Prevention. Electronic Accessed 5 May 2012. http://www.cdc.gov/healthyweight/as-sessing/bmi/.
Center for Sustainable Systems, University of Michigan. 2011. “U.S. Food Sys-tem Fact Sheet.” Pub. No. CSS01-06.
Cohen, Barbara. 2002. Community Food Security Assessment Toolkit (Eco-nomic Research Service Electronic Publication from the Food Assistance & Nutrition Research Program, E-FAN-02-013). Washington, DC: U.S. Dept. of Agriculture, ERS.
Community Food Security Coalition. 2012. “North American Food Policy Council Webpage.” Electronic. Accessed 5 May, 2012. http://www.food-security.org/FPC/
Dion, Robin and L. Pavetti. 2000. Access to and Participation in Medicaid and the Food Stamp Program: A Review of Recent Literature (U.S. Depart-ment of Health and Human Services). Washington, DC: Mathematica Policy Research Inc.
Dunifon, Rachel and Lori Kowaleski-Jones. 2001. “Associations between Par-ticipation in the National School Lunch Program, Food Insecurity, and Child Well-Being.” Washington, DC ERIC Clearinghouse: Joint Center for Poverty Research.
FAO. 1996, “Defi nition of Food Insecurity.” United Nations Food and Agricul-ture Organization. Electronic. Accessed 10 April 2012. http://www.fao.org/.
54 ALABAMA AGRICULTURAL EXPERIMENT STATION LEE COUNTY COMMUNITY FOOD SECURITY ASSESSMENT 55
Farrell, Mary, Michael Fishman, Matthew Langley, and David Stapleton. 2003. Th e Relationship of Earnings and Income to Food Stamp Participation: A Longitudinal Analysis (Economic Research Service Electronic Publication from the Food Assistance & Nutrition Research Program, E-FAN-03-011). Washington, DC: U.S. Dept. of Agriculture, ERS.
FNS. 2011. “National School Lunch Program.” U.S. Dept. of Agriculture Food and Nutrition Services. Electronic. Accessed 11 April 2012. http://www.fns.usda.gov/cnd/lunch/AboutLunch/NSLPFactSheet.pdf.
Hamm, M.W. and A.C. Bellows. 2003. “Community Food Security and Nu-trition Educators.” Journal of Nutrition Education and Behavior 35(1): 37-43.
Kortright, Robin and Sarah Wakefi eld. 2011. “Edible Backyards: A Qualitative Study of Household Food Growing and Its Contributions to Food Secu-rity.” Agriculture and Human Values 28:39-53.
Lowe, Shonte. 2012. Personal Interview. 7 March 2012.Meyerhoefer, Chad D. and Yuriy Pylypchuk. 2008. Does Participation in the
Food Stamp Program Increase the Prevalence of Obesity and Health Care Spending? American Journal of Agricultural Economics 90(2): 287-305.
Meyerhoefer, Chad D. and Muzhe Yang. 2011. Th e Relationship between Food Assistance and Health: A Review of the Literature and Empirical Strate-gies for Identifying Program Eff ects (Applied Economic Perspectives and Policy vol 22, num 3, pp. 304-344)
Nord, Mark. 2001. “Household Food Security in the Rural South: Assuring Access to Enough Food for Healthy Lives.” Washington DC ERIC Clear-inghouse: Southern Rural Development.
Nord, Mark. 2009. Food Insecurity in Households with Children: Prevalence, Severity, and Household Characteristics (Economic Research Service Eco-nomic Information Bulletin, no. 56). Washington, DC: U.S. Dept. of Ag-riculture, ERS.
Nord, Mark, Alisha Coleman-Jenson, Margaret Andrews, and Steven Carlson. 2009. Household Food Security in the United States, 2009. (Economic Research Service Economic Research Report, no 108). Washington, DC: U.S. Dept. of Agriculture, ERS.
Olson, Christine M. 1999. “Nutrition and Health Outcomes Associated with Food Insecurity and Hunger.” Th e Journal of Nutrition.
Page, Debbie. 2012. Personal Interview. 4 April 2012.
Paine, Melanie. 2012 Personal Interview. 27 April 2012.Potamites, Elizabeth and Anne Gorden. 2010. Children’s Food Security and
Intakes from School Meals (Economic Research Service Contractors and Cooperators Report, no. 61). Washington, DC ERIC Clearinghouse: U.S. Dept. of Agriculture, ERS.
Pothukuchi, Kami, Hugh Joseph, Hannah Burton, and Andy Fisher. 2002. “What’s Cooking in Your Food System?: A Guide to Community Food Assessment.” Venice, CA: Community Food Security Coalition.
Ratcliff e, Caroline and Signe-Mary McKernan. 2010. How Much Does SNAP Reduce Food Insecurity? (Economic Research Service Contractors and Cooperators Report, no. 60). Washington, DC Urban Institute: U.S. Dept. of Agriculture, ERS.
Rose, Donald, Craig Gunderson, and Victor J. Oliveira. 1998. Socio-economic Determinants of Food Insecurity in the United States from the SIPP and CSFII datasets (Economic Research Service Technical Bulletin, no. 1869). Washington, DC: U.S. Dept. of Agriculture, ERS.
Seligman, Hilary K., Andrew B. Bindman, Eric Vittinghoff , Alka M. Kanaya, and Margot B. Kushel. 2007. “Food Insecurity is Associated with Diabetes Mellitus: Results from the National Health Examination and Nutrition Examination Survey (NHANES) 1999-2002.” Society of General Internal Medicine 22:1018-1023.
Tribiano, Jeff ery J. 2012. Agency Information Collection Activities: Proposed Collection; Comment Request—Supplemental Nutrition Assistance Pro-gram, Administrative Review Requirements—Food Retailers and Whole-salers (Federal Register, vol. 77, no. 57). Washington, DC: U.S. Dept. of Agriculture, FNS.
U.S. Census Bureau American Community Survey. 2010. American Commu-nity Survey 5-Year Estimates (American Community Survey. Washington, DC: US Census Bureau, American Community Survey).
U.S. Census Bureau. 2000. “Census 2000 Geographic Defi nitions.” US Census Bureau. Electronic. Accessed 15 April 2012. http://www.census.gov/geo/www/ geo_defn.html.
U.S. Census Bureau. 2010. Census 2010 (US Census Bureau). Washington, DC: US Census Bureau.
USDA Census of Agriculture. 2007. United States: Summary and State Data (Census of Agriculture). Washington, DC: U.S. Dept. of Agriculture, Census of Agriculture.

56 ALABAMA AGRICULTURAL EXPERIMENT STATION LEE COUNTY COMMUNITY FOOD SECURITY ASSESSMENT 57
USDA Center for Nutrition Policy and Promotion. 1999. Th e Th rifty Food Plan, 1999: Administrative Report (Center for Nutrition Policy and Pro-motion, CNPP-7). Washington, DC: U.S. Dept. of Agriculture, CNPP.
USDA Economic Research Service. 2009. Data Sets: Nutrient Availability (Eco-nomic Research Service). Washington, DC: U.S. Dept. of Agriculture, ERS.
USDA Economic Research Service. 2010. Loss-Adjusted Food Availability. Data Sets (Economic Research Service). Washington, DC: U.S. Dept. of Agri-culture, ERS.
WHO. 2012. “Food Insecurity.” World Health Organization. Electronic. Ac-cessed 14 January 2012. http://www.who.int/trade/glossary/story028/en/.
Winne, Mark, Hugh Jospeh, and Andy Fisher. 1997. “Community Food Se-curity: A Guide to Concept, Design, and Implementation.” Venice, CA: Community Food Security Coalition.
Winne, Mark. 2012. Personal Interview. 23 January, 2012.
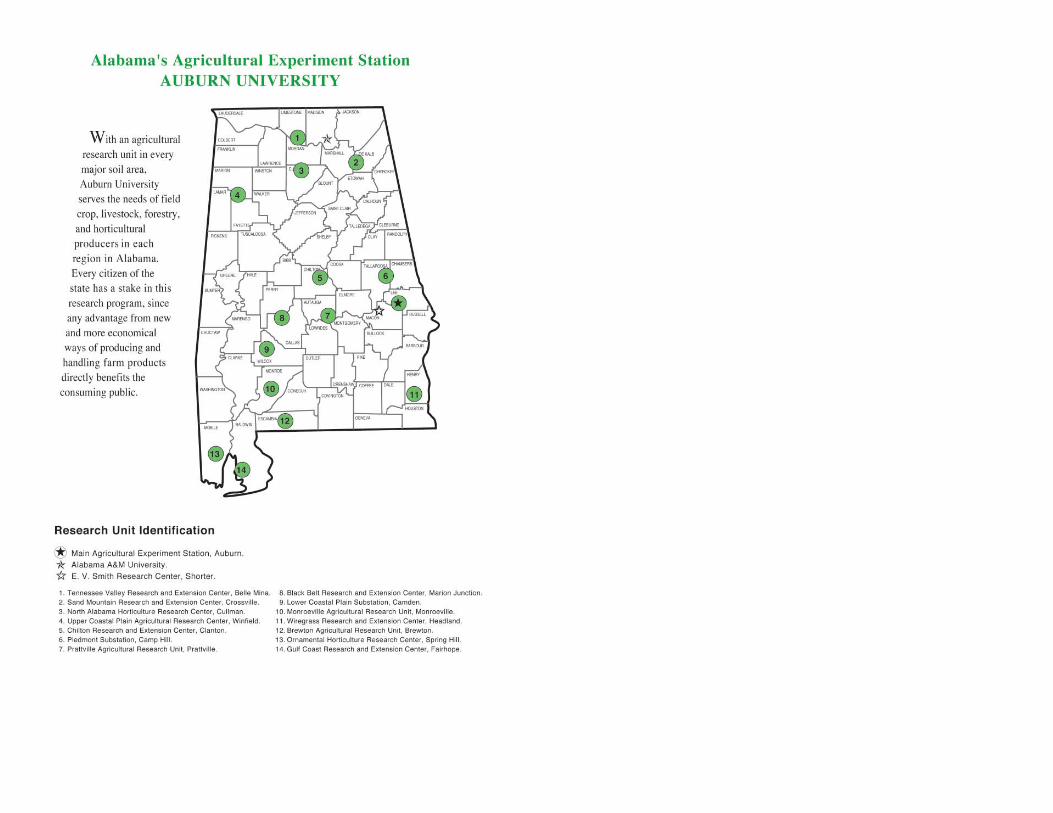
58 ALABAMA AGRICULTURAL EXPERIMENT STATION