LED TAXIWAY LIGHTING ASSESSMENT - ETCC … Runway...LED Taxiway Lighting Assessment ET10SCE1260 ......
35
Design & Engineering Services LED TAXIWAY LIGHTING ASSESSMENT ET10SCE1260 Report Prepared by: Design & Engineering Services Customer Service Business Unit Southern California Edison March 23, 2011
-
Upload
duonghuong -
Category
Documents
-
view
217 -
download
0
Transcript of LED TAXIWAY LIGHTING ASSESSMENT - ETCC … Runway...LED Taxiway Lighting Assessment ET10SCE1260 ......

Design & Engineering Services
LED TAXIWAY LIGHTING ASSESSMENT
ET10SCE1260 Report
Prepared by:
Design & Engineering Services
Customer Service Business Unit
Southern California Edison
March 23, 2011

LED Taxiway Lighting Assessment ET10SCE1260
Southern California Edison
Design & Engineering Services March 2011
Acknowledgements
Southern California Edison’s Design & Engineering Services (DES) group is responsible for
this project. It was developed as part of Southern California Edison’s Emerging Technology
program under internal project number ET10SCE1260. Jack Melnyk conducted this
technology evaluation with overall guidance and management from Juan Menendez. Bales
Engineering installed the measure. ADM Associates conducted energy monitoring and report
preparation. Integrated Lighting Concepts conducted onsite light level measurements. For
more information on this project, contact [email protected].
Disclaimer
This report was prepared by Southern California Edison (SCE) and funded by California
utility customers under the auspices of the California Public Utilities Commission.
Reproduction or distribution of the whole or any part of the contents of this document
without the express written permission of SCE is prohibited. This work was performed with
reasonable care and in accordance with professional standards. However, neither SCE nor
any entity performing the work pursuant to SCE’s authority make any warranty or
representation, expressed or implied, with regard to this report, the merchantability or
fitness for a particular purpose of the results of the work, or any analyses, or conclusions
contained in this report. The results reflected in the work are generally representative of
operating conditions; however, the results in any other situation may vary depending upon
particular operating conditions.

LED Taxiway Lighting Assessment ET10SCE1260
Southern California Edison Page i Design & Engineering Services March 2011
ABBREVIATIONS AND ACRONYMS
ETEL Elevated Taxiway Edge Light
fc Footcandle
kWh Kilowatt-hour
LED Light Emitting Diode
MIPAA March Inland Port Airport Authority
REIL Runway End Identifier Lights
RGL Runway Guard Lights
W Watt

LED Taxiway Lighting Assessment ET10SCE1260
Southern California Edison Page ii Design & Engineering Services March 2011
FIGURES Figure 1. Blue Lines Shows Taxiway Lighting Retrofit Area at DHL
Air Cargo Terminal ....................................................... 3
Figure 2. Conventional Taxiway Light Extracted From Ground
Mounting. .................................................................... 5
Figure 3. Elevated LED Taxiway Light. .......................................... 5
Figure 4. Independent Contractor Installs Test LED Taxiway
Luminaire on Existing Power Point, by Replacing
Existing Incandescent Luminaire .................................. 10
Figure 5. LED Taxiway Luminaire on Existing Power Point Ready
for Testing................................................................. 10
Figure 6. Most of the Existing Incandescent Luminaires are Near
End of Useful Life (40 year age). As a Result
Performance is Well Below Typical Performance for this
Style Luminaire. ......................................................... 10
Figure 7. A Luminaire with Reasonably Good Lens and Reflector was
Selected for Baseline Testing. The Luminaire was also
Cleaned Before Measurements were Recorded.................. 10
Figure 8. Power Recorder Mounted Below Electrical Panel ............. 11
Figure 9. Minolta T10 Illuminance Meter Used For Measurements ... 11
Figure 10. 2-foot X 3-foot Whiteboard Target For Illuminance
Readings ................................................................... 12
Figure 11. Canon 450D SLR ......................................................... 12
Figure 12. Canon EFS 17-85MM Lens ............................................. 12
Figure 13. Close In documentation .............................................. 13
Figure 14. Far Out Documentation ............................................... 13
Figure 15. Eight Month Profile of Taxiway Lighting Electric Load ...... 14
Figure 16. Average 24 Hour Profile for Baseline Taxiway Lights ....... 15
Figure 17. Annual Percent Time Taxiway Lights are at Various
Light Levels ............................................................... 16
Figure 18. Annual Energy Use for Baseline and LED Taxiway Lights . 17
Figure 19. Hourly Profile Showing Percent Time On in Each Mode
by Hour .................................................................... 17
Figure 20. Percent Time On in Each Mode Across Visibility Ranges ... 18
Figure 21. Percent Time Weather Conditions and Visibility Ranges
Exist for Monitoring Period ........................................... 18
Figure 22. Illuminance Measurements of Taxiway Lights ................. 19

LED Taxiway Lighting Assessment ET10SCE1260
Southern California Edison Page iii Design & Engineering Services March 2011
Figure 23. Point by Point Illuminance Measurements...................... 20
Figure 24. Incandescent Taxiway Luminaire “Close In” Shutter
Sped: 1/50 Second ..................................................... 21
Figure 25. LED Taxiway Luminaire “Close-In” Shutter Speed:
1/125 Second ............................................................ 21
Figure 26. Incandescent Taxiway Luminaire “Far Out” (25-30 ft.
From Source) Shutter Sped: 1/15 Second ..................... 21
Figure 27. LED Taxiway Luminaire “Far-Out” (25-30 ft. From
Source)Shutter Speed: 1/30 Second ............................. 21
Figure 28. Illuminance on 2 X 3 “White Board” Incandescent
Ground Mount Taxiway Luminaire................................. 22
Figure 29. Illuminance on 2 X 3 “White Board” LED Elevated
Taxiway Luminaire ..................................................... 22
Figure 30. LED Taxiway Luminaire (Right) Exhibits Significantly
Brighter Image Than Incandescent Luminaire (Left) .......... 23
Figure 31. LED Taxiway Luminaire (Far Right) Viewed from Distance
Along with Several Existing Incandescent Luminaires.
LED Luminaire Exhibits Superior Visual Identity ................ 23
Figure 32. LED Taxiway Luminaire Viewed on Night of Retrofit
Completion ................................................................ 24
TABLES Table 1. Taxiway Light Level Operation by Steps .......................... 4
Table 2. Percent Time Taxiway Lights Operate at Light Levels
and Power Readings ................................................... 16
Table 3. Annual and Accumulative Energy and Maintenance
Costs for Incandescent and LED Lights .......................... 25
Table 4. Performance Characteristic Comparisons ....................... 26
LED Taxiway Lighting Assessment ET10SCE1260
Southern California Edison Page iv
Design & Engineering Services March 2011
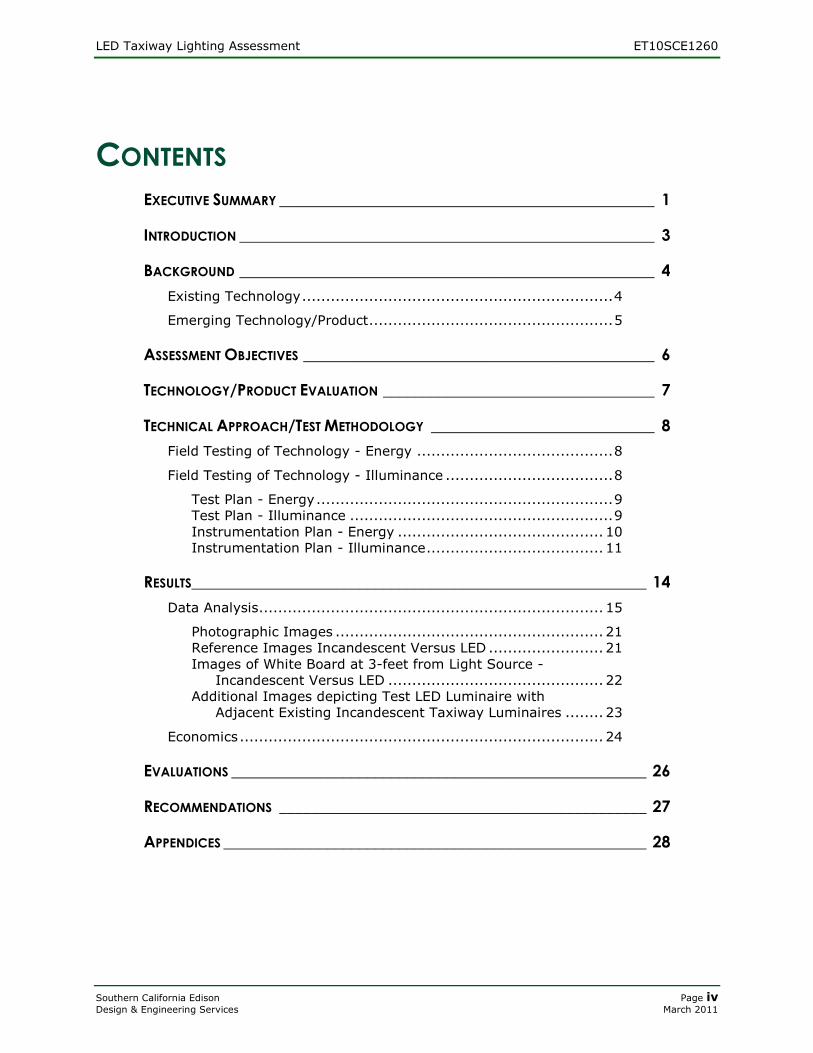
CONTENTS
EXECUTIVE SUMMARY _______________________________________________ 1
INTRODUCTION ____________________________________________________ 3
BACKGROUND ____________________________________________________ 4
Existing Technology ................................................................. 4
Emerging Technology/Product ................................................... 5
ASSESSMENT OBJECTIVES ____________________________________________ 6
TECHNOLOGY/PRODUCT EVALUATION __________________________________ 7
TECHNICAL APPROACH/TEST METHODOLOGY ____________________________ 8
Field Testing of Technology - Energy ......................................... 8
Field Testing of Technology - Illuminance ................................... 8
Test Plan - Energy .............................................................. 9 Test Plan - Illuminance ....................................................... 9 Instrumentation Plan - Energy ........................................... 10 Instrumentation Plan - Illuminance ..................................... 11
RESULTS_________________________________________________________ 14
Data Analysis ........................................................................ 15
Photographic Images ........................................................ 21 Reference Images Incandescent Versus LED ........................ 21 Images of White Board at 3-feet from Light Source -
Incandescent Versus LED ............................................. 22 Additional Images depicting Test LED Luminaire with
Adjacent Existing Incandescent Taxiway Luminaires ........ 23
Economics ............................................................................ 24
EVALUATIONS ____________________________________________________ 26
RECOMMENDATIONS ______________________________________________ 27
APPENDICES _____________________________________________________ 28

LED Taxiway Lighting Assessment ET10SCE1260
Southern California Edison Page 1
Design & Engineering Services March 2011
EXECUTIVE SUMMARY Southern California Edison’s (SCE) Emerging Technology Program assesses products that
have the potential to reduce electric energy use. One class of emerging technology is airport
taxiway lights that use light emitting diodes (LEDs), a new application of evolving LED
technology whose potential energy savings have not been quantified to date. The purpose of
this project is to evaluate the potential energy savings attributable to LED taxiway lighting.
The application is also evaluated to ensure no relative degradation in light output
performance between old and new technology occurs.
The main objectives of this project are to:
Measure the electric load profile of the existing incandescent baseline taxiway lights.
Measure the aggregate electric load for both the old incandescent (baseline) and the
LED (new measure) taxiway lighting at the three operating levels (Control tower
operators modulate the taxiway light levels based on site visibility-
fog/rain/daylight/dark/etc.-see details in Background section below).
Calculate energy savings for replacement of incandescent with LED taxiway lights.
Record by way of light meter illuminance readings the light output of an existing
incandescent LED taxiway luminaire versus the new LED replacement luminaire.
Document via use of reference photographic imagery visual comparisons of the
existing incandescent system versus the new LED replacement luminaires.
In 2006, SCE initiated a power measurement study of a sample of taxiway lights for March
Inland Port Airport Authority (MIPAA). An area of taxiway leading to the DHL air cargo
terminal was selected to perform a pilot study. The replacement of 76 incandescent lights
with LED lights is intended to save MIPAA energy and maintenance costs without sacrificing
performance. Taxiway lights are generally operated when it is dark or when daylight
visibility is reduced.
The energy use load profile of the existing taxiway lighting was monitored for eight months
from September 2006 through May 2007 to capture the variation in light level operation.
Data was collected from mid Sept through the end of May. June and July were projected
using May data, since daylight hours and visibility should be similar for these periods.
August and early Sept were projected based on late Sept and early Oct data. The annual
percent time at each of the lighting levels was based on a full year of data where 3.5
months were projections that leveraged available data.
The existing lights are 45W and the new LED lights are rated at 11.2 VA. The maintenance
costs should be significantly reduced since the rated life will go from 1,000 hours to 56,000
hours. Actual life will be longer since they are only operated at full intensity for a small
percentage of time. Lighting level measurements of both luminaire types were made after
dark. In late December 2010, the replacements were completed and power measurements
of the three operating light level settings were conducted.
The monitored data was leveraged to project annual percent time that the taxiway lights
were only operated at full intensity 1.4% of the time; mid-level 2.4% of the time, low level
32.7% of the time and off the remainder.

LED Taxiway Lighting Assessment ET10SCE1260
Southern California Edison Page 2
Design & Engineering Services March 2011
Photometric (footcandle) measurements were taken at three feet away since the light
illuminance was so low. No lab testing was possible because of the constant current power
supply system used for airport lighting.
The annual energy use of the existing luminaires was 10,431 kWh per year. The energy use
of the LEDs is will be 4,959 kWh per year projecting the same load profile. This is a savings
of 5,472 kWh per year or 72 kWh per year per light. The energy use is reduced by 52.5%.
No demand savings is expected since the lights are typically off during the noon to 6:00
p.m. summer peak period.
Data collected via field evaluation and performance measurements of the existing
incandescent taxiway luminaire versus the proposed LED taxiway luminaire at MIPAA were
as follows:
Illuminance readings, light output at three levels for existing incandescent LED
taxiway luminaire and a new LED replacement luminaire. The LED luminaire
produced between 25% to 35% higher illumination on the reference grid than did the
existing incandescent base lighting.
Reference photographic imagery ’visual comparisons’ of the existing incandescent
versus the proposed LED replacement luminaire both close-in (at 6-feet from
sources) and far-out (25-30 feet from sources) also indicated that the LED out-
performed the base incandescent visually.
The measure has a two-year payback - see Economics section including lifecycle costing.
The measure can only receive incentives using the statewide-customized offering
procedures.
The LED taxiway luminaire tested demonstrated its ability to provide superior way finding
illumination at significantly lower power consumption than conventional incandescent
taxiway luminaires. The substantially longer LED lamp life will also significantly reduce re-
lamping maintenance.
LED luminaire technology is well suited for taxiway illumination, and should be encouraged
based on the following:
The LED light source, rich in blue wavelength light, provides greater visual impact
than conventional incandescent lights with blue filters.
Power consumption is drastically reduced with the LED taxiway lighting system over
that of an incandescent system.
Maintenance is minimized with the LED taxiway systems extended lamp life.

LED Taxiway Lighting Assessment ET10SCE1260
Southern California Edison Page 3
Design & Engineering Services March 2011
INTRODUCTION Southern California Edison (SCE) has worked with the March Inland Port Airport Authority
(MIPAA) to provide assistance evaluating the replacement of incandescent taxiway lighting
with light-emitting diode (LED) lighting. A sample area of taxiway was selected to perform a
pilot study. The blue taxiway edge lighting area retrofit is highlighted with blue lines in
Figure 1. The DHL air cargo terminal is isolated from the main area of March Joint Air
Reserve Base.
FIGURE 1. BLUE LINES SHOWS TAXIWAY LIGHTING RETROFIT AREA AT DHL AIR CARGO TERMINAL
The replacement of incandescent lighting with LED lights is intended to save MIPAA energy
and maintenance costs without sacrificing performance. Successful implementation of this
project will likely expand to the rest of the taxiway lighting at this facility. This report will
provide a case study showing successful implementation of LEDs for taxiway lighting and
provide reassurance to prospective implementers to proceed with installation of LEDs.
Airfield lighting is a category of lighting that can benefit from energy saving LEDs. There are
many locations for application, including commercial airports, various types of military
fields, and small and private airfields. Savings by going to LED are not limited to taxiway
lights. Other developing LED applications are signs, Runway Guard Lights (RGL), windcones,
runway centerline, medium intensity runway, touchdown zone, Runway End Identifier Lights
(REIL), obstruction, and high-intensity runway edge lights.

LED Taxiway Lighting Assessment ET10SCE1260
Southern California Edison Page 4
Design & Engineering Services March 2011
BACKGROUND Airfield lighting is designed to produce a consistent level of light for a setting. There are
three light level settings in addition to off, full on (level 3), medium (level 2), and low (level
1). The operation of this 3-step system follows United States Air Force rules to assure
adequate visibility and displays in Table 1.
TABLE 1. TAXIWAY LIGHT LEVEL OPERATION BY STEPS
STEP VISIBILITY: DAY VISIBILITY: NIGHT
3 < 1 mile When Requested
2 When requested < 1 mile
1 When requested => 1 mile
Except:
a. Where a facility directive specifies other settings or times to meet local
conditions.
b. As requested by the pilot.
c. As tower operators deem necessary, if not contrary to pilot request.
The levels are manually set by the tower based on visibility conditions. The lights are off
during the day if visibility is greater than 1 mile (unless precluded by any of the exceptions
listed above). The lights are on at night (unless precluded by any of the exceptions listed
above).
The ground - mounted lighting along taxiways and runways are powered by constant
current regulating transformers. If a lamp burns out in a series loop circuit the transformer
provides a constant source of current which makes the other lamps brighten to make up for
the lost lamp.
Taxiway lights are blue in color to designate the type of area they define. Following are
descriptions of the incandescent and LED lighting that were part of this study.
EXISTING TECHNOLOGY The existing conventional technology uses incandescent lamps in a flush ground
mounted fixture. The lamp is General Electric model 23310, which is 45 Watts and a
PAR56 style. It is rated at 6.6 Amps, 700 lumens and 1,000-hour life. They are a
white light source so are mounted with a blue lens (see Figure 2) to filter the light
and provide distinctive blue light.

LED Taxiway Lighting Assessment ET10SCE1260
Southern California Edison Page 5
Design & Engineering Services March 2011
FIGURE 2. CONVENTIONAL TAXIWAY LIGHT EXTRACTED
FROM GROUND MOUNTING.
EMERGING TECHNOLOGY/PRODUCT LEDs have made rapid strides in recent years. The efficacy of LEDs has improved so
they can replace many types of light sources. LEDs have the advantage over some
technologies because they are also dimmable.
The product selected for use in this study is a Siemens Signature Series™ L-861T
LED Elevated Taxiway Edge Light (ETEL), see Figure 3. The ETEL models use a single
LED and are rated at 11.2 VA load using a 30/45 W isolation transformer. They are
ETL certified. The LED is rated for 56,000 hours in high mode and is expected to last
150,000 hours in typical taxiway operation. This product meets Federal Aviation
Administration, International Civil Aviation Organization and Federal Communications
Commission standards. It has an operating temperature range of -67 F to 131 F.
LEDs in this application have many advantages. They are fully dimmable. The lower
energy use will reduce energy costs. The lower wattage will allow airport staff to add
more lights without replacing the constant current transformer. LEDs can be used for
taxiways, centerline, runways and other airfield lighting. Long life will significantly
reduce maintenance costs historically high due to burnouts.
The elevated edge lights are more vulnerable to breakage from airfield vehicles
compared to the flush ground-mounted lights in Figure2.
FIGURE 3. ELEVATED LED TAXIWAY LIGHT.

LED Taxiway Lighting Assessment ET10SCE1260
Southern California Edison Page 6
Design & Engineering Services March 2011
ASSESSMENT OBJECTIVES The two main objectives for this study are to show energy savings and confirm quality of
light is not compromised.
Objectives for on-site field evaluation and performance measurements of a new LED taxiway
luminaire at MIPAA were as follows:
Measure the electric load profile of the existing lamps taxiway lighting.
Measure the aggregate electric load for both the old incandescent (baseline) and the
LED (new measure) taxiway lighting at three operating levels.
Calculate energy savings for replacement of incandescent with LED taxiway lights.
Record by way of light meter illuminance readings the light output of an existing
incandescent LED taxiway luminaire versus the new LED replacement luminaire.
Document via use of reference photographic imagery visual comparisons of the
existing incandescent system versus the new LED replacement luminaires
Document both light meter measurements as well as visual images with reference to
the incandescent and LED luminaires used in the evaluation.
Provide data analysis and evaluation of data collected as well as provide preliminary
recommendations based on findings gained via analysis and evaluation.

LED Taxiway Lighting Assessment ET10SCE1260
Southern California Edison Page 7
Design & Engineering Services March 2011
TECHNOLOGY/PRODUCT EVALUATION An active taxiway operated by MIPAA in Moreno Valley, CA was selected by Southern
California Edison as the test site location. The technology evaluation of taxiway lights was
conducted in field conditions at MIPAA. Replicating the constant current source transformer
power source in the laboratory was not practical.
The connection of the taxiway with a military and commercial airfield field meant restricted
access to the lighting circuits and taxiway lights. Security clearance and advance notice
were required before each site visit.
An early attempt to measure the light levels using conventional indoor meters was not
successful. The very low light level output by the luminaire-required instrumentation
specially designed for low illuminance.

LED Taxiway Lighting Assessment ET10SCE1260
Southern California Edison Page 8
Design & Engineering Services March 2011
TECHNICAL APPROACH/TEST METHODOLOGY The technical approach and test methodology is divided into two distinct categories. One is
the energy used by the old and new systems while the other focuses on the measured and
qualitative light outputs of the two systems.
FIELD TESTING OF TECHNOLOGY - ENERGY The following describe the field testing of the technology.
Energy use of the taxiway lighting circuits was measured and recorded using
a multi-channel meter recorder.
Two circuits were monitored which covered all 76 power points for the old
incandescent and the new LED’s. Circuit TL7 feed by breaker #9 in panel L-2
is for the alert taxiway north and circuit TL8 feed by breaker #5 in panel L-2
is for the alert taxiway south.
Each circuit has its own constant current regulating transformer for the series
operation of taxiway lights.
Initially data was recorded in 5-minute intervals providing the average
demand during the interval. After several months, the interval was changed
to 15-minutes to optimize logger memory and minimize trips to download
data.
The baseline incandescent fixture tested was two (2) years old. It was
deemed new enough and therefore not relamped. IESNA data (Fundamentals
Handbook-current 9th ed. Figure 6-20) indicates it can have lost about 7.5%
of its original light output since installed.
FIELD TESTING OF TECHNOLOGY - ILLUMINANCE The following describe the field testing of the technology.
Seventy-four (74) of the seventy-six (76) flush ground mounted current
incandescent taxiway lights are approximately forty (40) years old. Of the
remainder two (2) lights (each had only two (2) years in service) one (1) was
used as baseline for testing.
The current proposal for airport improvements call for up-grading the taxiway
lighting with a newer design which offers improved performance as well as
lower maintenance.
An LED taxiway luminaire has been proposed as the replacement luminaire for
taxiway illumination. An operational sample of the proposed LED taxiway
luminaire was installed within the taxiway illumination pattern adjacent to the
existing system.
Baseline incandescent and LED sources are virtually linear as to power and
light as they are dimmed.

LED Taxiway Lighting Assessment ET10SCE1260
Southern California Edison Page 9
Design & Engineering Services March 2011
Multi-level control of MIPAA taxiway lighting is currently in place. Three levels
of intensity, controlled from the tower, are available. The three levels are
defined as follows:
o LEVEL 3: Full (100%) light output from luminaire
o LEVEL 2: Medium (30%) light output from luminaire
o LEVEL 1: Low (10%) light output from luminaire
Both “base lighting” existing incandescent and “proposed” LED taxiway
luminaires were tested at all three control levels.
TEST PLAN - ENERGY
The test plan was to monitor the existing taxiway light circuits surrounding
the DHL terminal for several months. The typical operation of lighting levels
maintained for the 76 lights would be captured.
Interval data would be segregated into four categories: Off, Low (step 1),
Medium (step 2), and High (step 3). The percent time the taxiway lighting
was operated in each category would be calculated.
Data collection initially started in September 2006 with anticipation the
retrofits would occur in early 2007. After approximately eight months, the
monitoring equipment was removed at the end of May 2007. The project was
suspended for three years. Data collection was restarted in October 2010.
Post retrofit data collection was anticipated to collect at least a month of data.
Due to additional delays, some caused by weather, the post data collection
merely amounted to measuring the power at the three different level settings.
The monitoring equipment was in place for less than 24 hours after LED
retrofits were completed. The post period included two test periods, one
where the lights were operated for 35 minutes at each level and the other
where the lights were operated for one hour at each level.
TEST PLAN - ILLUMINANCE
The proposed LED luminaire was installed at an existing incandescent
luminaire location, which is currently part of the active taxiway lighting
system; see Figure 4 and Figure 5.
An existing incandescent luminaire was selected for baseline testing of the
existing system. Since the existing system is over 40 years old care was
taken to find an example of “best condition” luminaires with minimum
degrading and wear and tear. Note that the majority of luminaires in the
system are near end of useful life showing excessive wear and degrading due
to excessive age, see Figure 6 and Figure 7.

LED Taxiway Lighting Assessment ET10SCE1260
Southern California Edison Page 10
Design & Engineering Services March 2011
FIGURE 4. INDEPENDENT CONTRACTOR INSTALLS TEST LED
TAXIWAY LUMINAIRE ON EXISTING POWER POINT, BY
REPLACING EXISTING INCANDESCENT LUMINAIRE
FIGURE 5. LED TAXIWAY LUMINAIRE ON EXISTING POWER
POINT READY FOR TESTING
FIGURE 6. MOST OF THE EXISTING INCANDESCENT LUMINAIRES
ARE NEAR END OF USEFUL LIFE (40 YEAR AGE). AS
A RESULT PERFORMANCE IS WELL BELOW TYPICAL
PERFORMANCE FOR THIS STYLE LUMINAIRE.
FIGURE 7. A LUMINAIRE WITH REASONABLY GOOD LENS AND
REFLECTOR WAS SELECTED FOR BASELINE
TESTING. THE LUMINAIRE WAS ALSO CLEANED
BEFORE MEASUREMENTS WERE RECORDED
INSTRUMENTATION PLAN - ENERGY
To monitor power an Enernet K-20 multi-channel meter recorder was used. This
recorder can monitor electric energy, analog signals and digital pulses. It was used
to monitor true rms kW power of two transformers feeding the taxiway lights. The
logger accuracy for a power measurement is ±0.5% from 1 to 100% of full scale.
Current transformer accuracy is ± 1% from 10% to 100% of full scale, ± 3% at 5%
of full scale and ±5% at 2% of full scale. Split-core current transducers with 25 Amp
primary ratings were used. Two of the eight channels were used. The meter
samples the full 60 Hz waveform once every 5 to 9 seconds. The data samples are
averaged and recorded in 5-minute intervals. The meter recorder is the box mounted
below breaker panel L-2 shown in Figure 8.

LED Taxiway Lighting Assessment ET10SCE1260
Southern California Edison Page 11
Design & Engineering Services March 2011
FIGURE 8. POWER RECORDER MOUNTED BELOW ELECTRICAL PANEL
INSTRUMENTATION PLAN - ILLUMINANCE
Illuminance readings were obtained using a Minolta T10 illuminance meter
Performance specifications for the Minolta T10 are described with the image
of the meter, see Figure 9.
Illuminance readings were taken three feet (3-FT) from the incandescent
reference taxiway light and proposed LED taxiway light sources. A two foot
(2-FT) by three foot (3-FT) white board placed three feet from the light
source of each luminaire was used as the target reference plane for
measurements. Measurements taken were vertical footcandles (fc) see Figure
10.
FIGURE 9. MINOLTA T10 ILLUMINANCE METER USED FOR MEASUREMENTS
Minolta T-10 SPECIFICATIONS
Type: Digital illuminance meter with
detachable head and cable
Receptor: Silicon photocell
Range: 0.1 – 200,900 Lux
0.001 – 29,990 footcandles
Accuracy: +- 2% +-1 digital value displayed
Purchase & Calibration: August 14, 2010 (1876-242)

LED Taxiway Lighting Assessment ET10SCE1260
Southern California Edison Page 12
Design & Engineering Services March 2011
FIGURE 10. 2-FOOT X 3-FOOT WHITEBOARD TARGET FOR ILLUMINANCE READINGS
Single lens reflex camera and Canon 17mm to 85mm high resolution image
stabilized lens, see Figure 11 and Figure 12.
Reference images (nighttime operational) were taken with camera set at ISO
200 and manual mode with aperture at f 5.6 fixed. Shutter speed adjusted as
requires producing equivalent visual illumination in photographs between
incandescent base and LED proposed new lighting
Reference images of luminaires were rerecorded close-in (6-feet from
luminaire) and far-` out (25-30 feet from luminaires). Camera
was placed at eye level for both close-in and far-out images. All images were
recorded at luminaire Level 3 output and the camera at eye level; see Figure
13 and Figure 14. White board image recordings were taken in same plane as
each source, 3 ft. away endo to the board at its center; see Figure 10.
FIGURE 11. CANON 450D SLR FIGURE 12. CANON EFS 17-85MM LENS

LED Taxiway Lighting Assessment ET10SCE1260
Southern California Edison Page 13
Design & Engineering Services March 2011
FIGURE 13. CLOSE IN DOCUMENTATION
FIGURE 14. FAR OUT DOCUMENTATION

LED Taxiway Lighting Assessment ET10SCE1260
Southern California Edison Page 14
Design & Engineering Services March 2011
RESULTS The power was monitored for two taxiway circuits for eight months from September 2006 to May 2007. For presentation and analysis the data for the two circuits is combined and represent the 76 taxiway lights that are part of this study. Figure 15 shows that when the lights were on that they were in low mode (approx. 3 kW) most of the time. The few spikes showing operation in the medium and high level only occurs occasional when conditions require more illumination. Several taxiway lights were removed for approximately three months early in 2007.
0
1
2
3
4
5
6
7
9/2
2/2
00
6
9/2
9/2
00
6
10
/6/2
00
6
10
/13
/20
06
10
/20
/20
06
10
/27
/20
06
11
/3/2
00
6
11
/10
/20
06
11
/17
/20
06
11
/24
/20
06
12
/1/2
00
6
12
/8/2
00
6
12
/15
/20
06
1/5
/20
07
1/1
2/2
00
7
1/1
9/2
00
7
1/2
6/2
00
7
2/2
/20
07
2/9
/20
07
2/1
6/2
00
7
2/2
3/2
00
7
3/2
/20
07
3/9
/20
07
3/1
6/2
00
7
3/2
3/2
00
7
3/3
0/2
00
7
4/6
/20
07
4/1
3/2
00
7
4/2
0/2
00
7
4/2
7/2
00
7
5/4
/20
07
5/1
1/2
00
7
5/1
8/2
00
7
5/2
5/2
00
7
kW
FIGURE 15. EIGHT MONTH PROFILE OF TAXIWAY LIGHTING ELECTRIC LOAD
Taxiway lights are generally operated when it is dark or visibility is reduced. The average hourly profiles for all monitored baseline data (September 2006 through May 2007) and just for May 2007 are presented in Figure 16. May is expected to be similar to other summer months. The May average shows the lights are completely off during the afternoon so there is no peak demand impact.

LED Taxiway Lighting Assessment ET10SCE1260
Southern California Edison Page 15
Design & Engineering Services March 2011
0.0
0.5
1.0
1.5
2.0
2.5
3.0
0 1 2 3 4 5 6 7 8 9 10 11 12 13 14 15 16 17 18 19 20 21 22 23
kW
Hour of Day
All Baseline kW
May Baseline kW
FIGURE 16. AVERAGE 24 HOUR PROFILE FOR BASELINE TAXIWAY LIGHTS
Light quality data collected via field evaluation and performance measurements of the existing incandescent taxiway luminaire versus the proposed LED taxiway luminaire at MIPAA were as follows:
Illuminance readings, light output at three levels for existing incandescent LED taxiway luminaire and a proposed LED replacement luminaire. The LED luminaire produced between 25% to 35% higher illumination on the reference grid than did the existing incandescent base lighting.
Reference photographic imagery’ visual comparisons’ of the existing incandescent versus the proposed LED replacement luminaire both close-in (at 6-feet from sources) and far-out (25-30 feet from sources also indicated that the LED out preformed the base incandescent visually.
Additional photographic imagery’ visual comparisons’ of the existing incandescent versus the proposed LED replacement luminaire were collected and all imagery supports the superior performance of the LED taxiway luminaire over the base incandescent lighting.
DATA ANALYSIS The data interval power data was categorized into four level settings. Above 4.2 kW
was set as high, between 3.2 and 4.2 kW as medium, between 0.5 and 3.2 kW as
low and below 0.5 kW as off. The projected annual percent time in each level
category is shown in Table 2 and Figure 17. The lights were typically on week nights
and off most of the weekend nights. The post retrofit energy use was calculated
based on percent time at each level and average power readings at each level. The

LED Taxiway Lighting Assessment ET10SCE1260
Southern California Edison Page 16
Design & Engineering Services March 2011
average power readings for baseline and post lighting levels are also shown in Table
2. The annual energy use of the exiting luminaires was 10,431 kWh per year. The
energy use of the LEDs is calculated to be 4,959 kWh per year. This is a savings of
5,472 kWh per year or 72 kWh per year per light. The energy use is reduced by
52.5%. No demand savings is expected since the lights are typically off during the
noon to 6:00 p.m. summer peak period. The projected annual energy use for
baseline and LED luminaires is presented in Figure 18.
TABLE 2. PERCENT TIME TAXIWAY LIGHTS OPERATE AT LIGHT LEVELS AND POWER READINGS
LIGHT LEVEL ANNUAL PERCENT TIME IN
LEVEL MODE BASELINE KW POST KW
High (Level 3) 1.0% 6.45 2.647
Medium (Level 2) 2.4% 4.24 1.950
Low (Level 1) 32.4% 3.16 1.521
Off 64.2% 0 0
High, 1.0%Med, 2.4%
Low, 32.4%
Off, 64.2%
High
Med
Low
Off
FIGURE 17. ANNUAL PERCENT TIME TAXIWAY LIGHTS ARE AT VARIOUS LIGHT LEVELS

LED Taxiway Lighting Assessment ET10SCE1260
Southern California Edison Page 17
Design & Engineering Services March 2011
0
2,000
4,000
6,000
8,000
10,000
12,000
Pre, kWh Post, kWh
An
nu
al E
ne
rgy
Use
, kW
h HighMedLow
FIGURE 18. ANNUAL ENERGY USE FOR BASELINE AND LED TAXIWAY LIGHTS
The data was analyzed further to present average profiles for a 24-hour period. The
percent time the taxiway lights were in each mode of operation were tabulated by
hour of the day and are shown in the chart in Figure 19. The lights are off most of
the time during the day, but also most weekend nights. The highest rate of full on
operation occurs between 8 and 9. Typical flight activity includes eight arrivals week
nights between hours 21 and 2, and eight departures weeknights between hours of 2
and 4.
0%
10%
20%
30%
40%
50%
60%
70%
80%
90%
100%
0 1 2 3 4 5 6 7 8 9 10 11 12 13 14 15 16 17 18 19 20 21 22 23
Pe
rce
nt o
f Ho
ur
in M
od
e
Hour of Day
High
Med
Low
Off
FIGURE 19. HOURLY PROFILE SHOWING PERCENT TIME ON IN EACH MODE BY HOUR
Next, weather data was collected from the airport weather station (KRIV) located
near the runway coincident with the monitoring period. The weather data includes
visibility in miles and qualitative sky conditions. This data was merged with the

LED Taxiway Lighting Assessment ET10SCE1260
Southern California Edison Page 18
Design & Engineering Services March 2011
monitored data to investigate the correlation between visibility and mode of taxiway
lighting operation. All hours of the day and night are included in the analysis. Figure
20 shows the percent time across all visibility ranges the taxiway lights were in each
mode of operation. The taxiway lights operated in high mode under all ranges of
visibility and did not strictly follow the operating modes described in the background
section, unless the condition “when requested” to used significantly.
0%
10%
20%
30%
40%
50%
60%
0<1 1-2 2.1-3 3.1-5 5.1-10 11-20 20>60
Perc
en
t Ti
me
On
in M
od
e
Visibility (Miles)
OffLowMedHigh
FIGURE 20. PERCENT TIME ON IN EACH MODE ACROSS VISIBILITY RANGES
The weather data was cross correlated between sky conditions and visibility.
Although there were 22 different qualitative descriptions in the weather file we have
grouped them into four main categories: Clear, Rain, Clouds, and Fog/Mist. Figure
21 shows the percent time the conditions were in each category of sky condition and
range of visibility.
0%
5%
10%
15%
20%
25%
0<1 1-2 2.1-3 3.1-5 5.1-10 11-20 20>60
Perc
en
t Ti
me
, %
Visibility (Miles)
Clear
Rain
Clouds
Fog/Mist
FIGURE 21. PERCENT TIME WEATHER CONDITIONS AND VISIBILITY RANGES EXIST FOR MONITORING PERIOD

LED Taxiway Lighting Assessment ET10SCE1260
Southern California Edison Page 19
Design & Engineering Services March 2011
Illuminance measurements for incandescent and LED luminaires are compared in
Figure 22. The LED produces 25% more light in level 3 (high mode) and 35% more
light in level 1 & 2 than the incandescent luminaire. The power consumptions listed
in Figure 22 are rated values not measured values. Also in Figure 22, the max/min
uniformity ratio of the LED improves from 19% to 32% over the incandescent. The
detailed point by point illuminance measurements are presented in Figure 23.
FIGURE 22. ILLUMINANCE MEASUREMENTS OF TAXIWAY LIGHTS

LED Taxiway Lighting Assessment ET10SCE1260
Southern California Edison Page 20
Design & Engineering Services March 2011
FIGURE 23. POINT BY POINT ILLUMINANCE MEASUREMENTS

LED Taxiway Lighting Assessment ET10SCE1260
Southern California Edison Page 21
Design & Engineering Services March 2011
PHOTOGRAPHIC IMAGES
REFERENCE IMAGES INCANDESCENT VERSUS LED
All reference images were taken with fixed settings of ISO 200 (sensitivity), daylight
(white balance) and 5.6 F stop (aperture opening). Shutter speed was then adjusted
accordingly to recorded properly exposed images. The following photos were taken
with luminaires in Level 3 (full light output) mode.
Reference images close-in, see Figure 24 and Figure 25
Reference images far-out, see Figure 26 and Figure 27
FIGURE 24. INCANDESCENT TAXIWAY LUMINAIRE “CLOSE IN”
SHUTTER SPED: 1/50 SECOND
FIGURE 25. LED TAXIWAY LUMINAIRE “CLOSE-IN” SHUTTER
SPEED: 1/125 SECOND
FIGURE 26. INCANDESCENT TAXIWAY LUMINAIRE “FAR OUT”
(25-30 FT. FROM SOURCE) SHUTTER SPED: 1/15
SECOND
FIGURE 27. LED TAXIWAY LUMINAIRE “FAR-OUT” (25-30
FT. FROM SOURCE)SHUTTER SPEED: 1/30
SECOND

LED Taxiway Lighting Assessment ET10SCE1260
Southern California Edison Page 22
Design & Engineering Services March 2011
IMAGES OF WHITE BOARD AT 3-FEET FROM LIGHT SOURCE - INCANDESCENT
VERSUS LED
Illuminance on white board recorded with luminaires at Level 3 “full light output” mode.
Image of white board with illuminance from incandescent source luminaire is shown
in Figure 28. Image of white board with illuminance from LED source luminaire is
shown in Figure 29.
FIGURE 28. ILLUMINANCE ON 2 X 3 “WHITE BOARD” INCANDESCENT GROUND MOUNT TAXIWAY LUMINAIRE
FIGURE 29. ILLUMINANCE ON 2 X 3 “WHITE BOARD” LED ELEVATED TAXIWAY LUMINAIRE

LED Taxiway Lighting Assessment ET10SCE1260
Southern California Edison Page 23
Design & Engineering Services March 2011
ADDITIONAL IMAGES DEPICTING TEST LED LUMINAIRE WITH ADJACENT EXISTING
INCANDESCENT TAXIWAY LUMINAIRES
This section shows photos of luminaires taken at Level 3 “full light output” mode. A
baseline incandescent flush ground mount taxiway luminaire to the left of the test
elevated LED luminaire is shown in Figure 30. Figure 28 is a night view of a taxiway where
one (1) LED test luminaire (to the center right) was installed. The other 10 taxiway lights
visible in the shot are baseline incandescents. Also in the shot is a bright red/yellow with
white light visible to the center left-it is a taxiway identifier sign. The photo in Figure 31 is
taken from atop fuel storage tank adjacent to taxi strip.
FIGURE 30. LED TAXIWAY LUMINAIRE (RIGHT) EXHIBITS SIGNIFICANTLY BRIGHTER IMAGE THAN
INCANDESCENT LUMINAIRE (LEFT)
FIGURE 31. LED TAXIWAY LUMINAIRE (FAR RIGHT) VIEWED FROM DISTANCE ALONG WITH SEVERAL
EXISTING INCANDESCENT LUMINAIRES. LED LUMINAIRE EXHIBITS SUPERIOR VISUAL IDENTITY
LED Luminaire

LED Taxiway Lighting Assessment ET10SCE1260
Southern California Edison Page 24
Design & Engineering Services March 2011
The photo in Figure 32 was taken the night of December 28th after the retrofits were
complete and shows the LED taxiway luminaires in operation.
FIGURE 32. LED TAXIWAY LUMINAIRE VIEWED ON NIGHT OF RETROFIT COMPLETION
ECONOMICS To estimate the life cycle costs for the taxiway lights, the following technical and economic
considerations are applied. The taxiway lights were at the end of their life and would be
replaced by new fixtures, either direct replacement of like type incandescent or new LED
above ground fixtures.
The installed cost for the 76 LED fixtures was $42,500. Half of that cost was installation or
$279 per light. The installation costs for either fixture type are assumed to be $279 per
fixture. The material cost for the incandescent fixtures is assumed to be $180 each.
All lights are operated 3,200 hours per year at the levels previously described in Table 1.
The maintenance cost for the lights are $80 per year per light. Maintenance costs are
applied to all 76 incandescent lights, but only 5% (4) of the LED lights. Energy cost is
based on $0.15 per kWh.
A real discount rate of 3% (e.g., 5.0% investment interest rate minus 2.0% inflation) is
applied to costs associated with maintenance costs and energy costs. The life of the
fixtures is 25 years.
The life cycle costs are presented in Table 3. This table lists the net present value of
the annual expenditures associated with the Incandescent and LED lights. The

LED Taxiway Lighting Assessment ET10SCE1260
Southern California Edison Page 25
Design & Engineering Services March 2011
break-even point is at the end of the second year, so the LED lights have a 2 year
payback.
TABLE 3. ANNUAL AND ACCUMULATIVE ENERGY AND MAINTENANCE COSTS FOR INCANDESCENT AND LED LIGHTS
ANNUAL ENERGY COSTS ANNUAL INSTALLATION &
MAINTENANCE COSTS ACCUMULATIVE COSTS FOR ENERGY,
INSTALLATION & MAINTENANCE
YEAR INCANDESCENT LED INCANDESCENT LED INCANDESCENT LED
1 $1,564.67 $743.86 $34,884 $42,500 $36,449 $43,244
2 $1,519.10 $722.20 $5,903 $311 $43,871 $44,277
3 $1,474.85 $701.16 $5,731 $302 $51,077 $45,280
4 $1,431.89 $680.74 $5,564 $293 $58,072 $46,253
5 $1,390.19 $660.91 $5,402 $284 $64,865 $47,198
6 $1,349.70 $641.66 $5,245 $276 $71,459 $48,116
7 $1,310.39 $622.97 $5,092 $268 $77,861 $49,007
8 $1,272.22 $604.83 $4,944 $260 $84,077 $49,872
9 $1,235.16 $587.21 $4,800 $253 $90,112 $50,712
10 $1,199.19 $570.11 $4,660 $245 $95,971 $51,527
11 $1,164.26 $553.50 $4,524 $238 $101,659 $52,319
12 $1,130.35 $537.38 $4,392 $231 $107,182 $53,087
13 $1,097.43 $521.73 $4,264 $224 $112,544 $53,834
14 $1,065.46 $506.54 $4,140 $218 $117,749 $54,558
15 $1,034.43 $491.78 $4,020 $212 $122,803 $55,261
16 $1,004.30 $477.46 $3,903 $205 $127,710 $55,944
17 $975.05 $463.55 $3,789 $199 $132,474 $56,607
18 $946.65 $450.05 $3,678 $194 $137,099 $57,251
19 $919.08 $436.94 $3,571 $188 $141,590 $57,876
20 $892.31 $424.22 $3,467 $182 $145,949 $58,482
21 $866.32 $411.86 $3,366 $177 $150,182 $59,071
22 $841.09 $399.86 $3,268 $172 $154,291 $59,643
23 $816.59 $388.22 $3,173 $167 $158,281 $60,199
24 $792.80 $376.91 $3,081 $162 $162,155 $60,738
25 $769.71 $365.93 $2,991 $157 $165,915 $61,261

LED Taxiway Lighting Assessment ET10SCE1260
Southern California Edison Page 26
Design & Engineering Services March 2011
EVALUATIONS Data collected from illumination measurements as well as visual observation (documented
with photo imagery) verified that the LED taxiway luminaire tested provided substantially
better performance than the base existing incandescent taxiway luminaires. The LED
provided higher illumination as measured by illuminance readings. More importantly
however, visual brightness of the LED test luminaire was superior to that of the incandescent
base. This characteristic is especially important with wayfarer lighting such as that used for
airport taxiways. It is also important to note that the increased visual performance of the LED
was achieved by a luminaire with significantly lower power consumption than the
incandescent lighting. The more intense blue color of the LED luminaires also contributes to
the visual impact and perception of the LED luminaires versus the incandescent base
luminaires.
Superior performance characteristics of the LED taxiway luminaire tested are itemized as
follows in Table 4.
TABLE 4. PERFORMANCE CHARACTERISTIC COMPARISONS
PERFORMANCE FACTOR INCANDESCENT (BASE LUMINAIRE)
LED (TEST MODEL)
LED PERFORMANCE IMPROVEMENT *1
Light output (avg.
Illuminance) *2
0.112 fc 0.139 fc 25% higher at Level 3
Uniformity (min. to max.) *3 7.2 : 1 5.2 : 1 Improved 28% at Level 3
Visual acuity (visual brightness) *4
Close In: 1/15 Far Out: 1/50
Close In 1/30 Far Out: 1/50
Brightness of LED allowed for three stops faster shutter
Rated power density of luminaire
45W 10W 35W less power per luminaire
(78% reduction)
Rated lamp life 1,000 hrs 50,000 hrs 50 times longer lamp life
*1: Performance improvements shown on this chart based on Level 3 full light output operation *2: Illuminance as measured off 2-foot X 3-foot white board test surface *3: As calculated from minimum and maximum illuminance recorded on white board test surface *4: As observed and recorded by digital images. LED’s significantly higher surface brightness Allowed for capture of equally bright images with three stops faster shutter speed than incandescent on reference photos

LED Taxiway Lighting Assessment ET10SCE1260
Southern California Edison Page 27
Design & Engineering Services March 2011
RECOMMENDATIONS The LED taxiway luminaire tested demonstrated its ability to provide superior way finding
illumination at significantly lower power consumption than conventional incandescent
taxiway luminaires. The substantially longer LED lamp life will also significantly reduce re-
lamping maintenance.
LED luminaire technology is well suited for and should be encouraged for taxiway
illumination:
The LED light source, rich in blue wavelength light, provides greater visual impact
than conventional incandescent lights with blue filters.
Power consumption is drastically reduced (52.5%) with the LED taxiway lighting
system over that of an incandescent system.
Maintenance is minimized with the extended lamp life of the LED taxiway system.
Luminaire dirt depreciation is claimed by the manufacturer to be much less than
incandescent. The lower temperature of the LED luminaire lens prevents the “baking
effect” that causes contaminants to stick to the surface of the lens. The
manufacturer’s estimate is about 400 F for the glass of the incandescent and about
100 F for the LED.

LED Taxiway Lighting Assessment ET10SCE1260
Southern California Edison Page 28
Design & Engineering Services March 2011
APPENDICES Additional pictures
Minolta T10 light meter measuring illuminance Close-up of PAR 56 lamp and blue lens
Incandescent taxiway lamp being removed Visual impact comparison - LED taxiway
luminaire with two adjacent incandescent luminaires

LED Taxiway Lighting Assessment ET10SCE1260
Southern California Edison Page 29
Design & Engineering Services March 2011
Airport Tower Electric Building housing airfield lighting panels