LED STRATEGY - makana.gov.za€¦ · 2.1.2 White Paper on Local Government 7 2.1.3 ... Source:...
113
M M A A K K A A N N A A M M U U N N I I C C I I P P A A L L I I T T Y Y L L E E D D S S T T R R A A T T E E G G Y Y PART I: S S I I T T U U A A T T I I O O N N A A N N A A L L Y Y S S I I S S NOVEMBER 2009 Urban‐Econ (Eastern Cape) – 49 Parliament Street – Central – Port Elizabeth – 6000 – Tel: 041 585 6640
Transcript of LED STRATEGY - makana.gov.za€¦ · 2.1.2 White Paper on Local Government 7 2.1.3 ... Source:...
MMAAKKAANNAA MMUUNNIICCIIPPAALLIITTYY
LLEEDD SSTTRRAATTEEGGYY
PPAARRTT II::
SSIITTUUAATTIIOONN AANNAALLYYSSIISS
NNOOVVEEMMBBEERR 22000099
Urban‐Econ (Eastern Cape) – 49 Parliament Street – Central – Port Elizabeth – 6000 – Tel: 041 585 6640

Local Economic Development Strategy Makana Municipality
© 2009 Urban-Econ Eastern Cape: Development Economists +27 41 585 6640 [email protected]
i
TTAABBLLEE OOFF CCOONNTTEENNTTSS CHAPTER 1: Introduction 1.1 Purpose of Project 1 1.2 Location of Makana Municipality 2 1.3 Methodology/Approach 3 1.4 Purpose of Situation Analysis 4 1.5 Report Outline 5 CHAPTER 2: Policy Framework 2.1 National Planning Framework 6 2.1.1 Accelerated and Shared Growth Initiative of South Africa (ASGISA) 6 2.1.2 White Paper on Local Government 7 2.1.3 National Framework for Local Economic Development in South Africa 8 2.1.4 Regional Industrial Development Strategy (RIDS) 9 2.1.5 Joint Initiative on Priority Skills Acquisition (JIPSA) 9 2.1.6 National Spatial Development Perspective (NSDP) 10 2.1.7 Local Government: Municipal Structures Act (No. 117 of 1998) 10 2.1.8 Local Government: Municipal Systems Act (No. 32 of 2000) 11 2.1.9 Relevance of National Policies to Makana Municipality 11 2.2 Provincial Planning Framework 12 2.2.1 Eastern Cape Provincial Growth & Development Plan 2004 – 2014 12 2.2.2 Eastern Cape Spatial Development Plan 13 2.2.3 Eastern Cape Tourism Master Plan 14 2.2.4 Eastern Cape Industrial Strategy 15 2.2.5 Relevance of Provincial Policies to Makana Municipality 16 2.3 District Planning Framework 16 2.3.1 Cacadu District Municipality Development Plan 16 2.3.2 District Wide Economic Growth & Development Strategy 17 2.3.3 District Wide Economic Growth & Development Summit Agreement 18 2.3.4 Cacadu Spatial Development Framework 19 2.3.5 Relevance of District Policies to Makana Municipality 19 2.4 Local Planning Framework 20 2.4.1 Makana IDP 20 2.4.2 Makana Spatial Development Framework (SDF) 21 2.4.3 Makana Municipality Tourism Sector Plan 21 2.4.4 Makana LED Tourism Report 22 2.4.5 Makana LED Mining Report 23 2.4.6 Makana LED Agriculture Report 24 2.4.7 Relevance of Local Policies to the LED Strategy 25
Local Economic Development Strategy Makana Municipality
© 2009 Urban-Econ Eastern Cape: Development Economists +27 41 585 6640 [email protected]
ii
CHAPTER 3: Socio‐Economic Profile 3.1 Population Profile 27 3.1.1 Age and Gender Structure 28 3.2 Education Profile 29 3.3 Employment Profile 30 3.3.1 Employment Status 30 3.3.2 Employment by Occupation 31 3.4 Household Income 32 3.5 Access to Basic Services 33 3.6 Synthesis 34 CHAPTER 4: Local Economic Profile 4.1 Overall Economic Preference 36 4.2 Sector Contribution to R‐GDP 38 4.2.1 Standard Industrial Classification 38 4.2.2 Economic Structure 38 4.2.3 Sectoral Employment 40 4.2.4 Relative Importance of Sectors 41 4.2.5 Comparative Advantage 42 4.2.6 Comparative Sectoral Performance 43 4.3 Sector Profiles 45 4.3.1 Agriculture 45 4.3.2 Mining 49 4.3.3 Manufacturing 51 4.3.4 Construction 55 4.3.5 Trade 58 4.3.6 Transport & Communication 62 4.3.7 Finance and Business Services 65 4.3.8 Government, Social and Community Services 66 4.3.9 Tourism 71 4.4 Synthesis 74 CHAPTER 5: Infrastructure Profile 5.1 Transport 75 5.1.1 Roads 75 5.1.2 Rail 76 5.1.3 Air 76 5.1.4 Implications for LED 76 5.2 Water and Sanitary Services 77 5.2.1 Water 77 5.2.2 Sanitation 78 5.2.3 Waste Management 78 5.2.4 Implications for LED 79
Local Economic Development Strategy Makana Municipality
© 2009 Urban-Econ Eastern Cape: Development Economists +27 41 585 6640 [email protected]
iii
5.3 Electricity and Telecommunications 79 5.3.1 Electricity 79 5.3.2 Telecommunications 80 5.3.3 Implication for LED 81 5.4 Land Availability and Reform 81 5.4.1 Land Availability 81 5.4.2 Land Reform 81 5.4.3 Housing 83 5.4.4 Implications for LED 83 5.5 Synthesis 83 CHAPTER 6: Environmental Profile 6.1 Climate 85 6.2 Topography 87 6.3 Hydrology 88 6.4 Land Capacity and Soil Types 89 6.5 Vegetation Types and Biodiversity 90 6.6 Synthesis 91 CHAPTER 7: Institutional Profile 7.1 Makana Political Structure 92 7.2 Municipal Powers and Functions 92 7.3 Institutional Structure 93 7.3.1 Staffing Capacity 93 7.3.2 LED in Makana 96 7.4 Intergovernmental Relations 96 7.4.1 Cooperative Governance Mandate 96 7.4.2 National & Provincial Departments & Governmental Agencies within Makana 97 7.4.3 Institutional Structure of the CACADU District Municipality 97 7.5 Synthesis 98 CHAPTER 8: Opportunities & Constraints Analysis 8.1 General Opportunities & Constraints 99 8.2 Agriculture 101 8.3 Mining 102 8.4 Manufacturing 102 8.5 Construction 102 8.6 Trade and Business Services 103 8.7 Tourism 104 8.8 Synthesis 104 Figures 1.1 Makana in the Cacadu District 2

Local Economic Development Strategy Makana Municipality
© 2009 Urban-Econ Eastern Cape: Development Economists +27 41 585 6640 [email protected]
iv
1.2 Makana Municipality in the Eastern Cape 3 3.1 Age and Gender Structure 28 3.2 Level of Education 29 3.3 Employment Status 30 3.4 Employment by Occupation 32 3.5 Average Household Income 33 3.6 Access to Basic Services 34 4.1 R‐GDP per Capita in the Eastern Cape 37 4.2 Sector Contribution to R‐GDP 1995‐2007 39 4.3 Formal Employment per Sector: 1995 – 2007 40 4.4 Importance of each Economic Sector 41 4.5 Agricultural Output: 1995 – 2007 (R’000 at Constant 2000 Prices) 45 4.6 Agricultural Employment 1995 – 2007 46 4.7 Mining Output from 1995 – 2007 (R’000 at Constant 2000 Prices) 50 4.8 Manufacturing Output from 1995 – 2007 (R’000 at Constant 2000 Prices) 52 4.9 Manufacturing Employment 52 4.10 Contributors to Makana Manufacturing Output 53 4.11 Construction Output from 1995 – 2007 (R’000 at Constant 2000 Prices) 56 4.12 Construction Employment 56 4.13 Trade Output from 1995 – 2007 (R’000 at Constant 2000 Prices) 59 4.14 Trade Employment 60 4.15 Income Allocations by Makana Residents 61 4.16 Transport & Communications Output (R’000 at Constant 2000 Prices) 63 4.17 Transport & Communications Employment 63 4.18 Contribution of Transport & Communication to the Sector 65 4.19 Finance & Business Service Output (R’000 at Constant 2000 Prices) 66 4.20 Finance & Business Service Employment 67 4.21 Contribution of Business Service & Finance and Insurance of the Sector 67 4.22 Government Output (R’000 at Constant 2000 Prices) 69 4.23 Government Employment 69 6.1 Eastern Cape Average Annual Rainfall 86 7.1 Makana Organogram 95 Tables 3.1 Overview of Makana Municipality 27 3.2 Population Estimates: 2001‐2007 27 3.3 Synthesis of Socio‐Economic Profile 34 4.1 Makana Municipality Overall Economic Performance 36 4.2 Average Annual R‐GDP Growth Rate 36 4.3 Location Quotient 43 4.4 Comparative Sectoral Performance 44 4.5 Environmental Tourism 72 4.6 Educational Tourism 73 4.7 Cultural Tourism 73 5.1 Makana Water Provision and Sewerage Purification Levels 77 5.2 Status of Land Reform in Makana 82

Local Economic Development Strategy Makana Municipality
© 2009 Urban-Econ Eastern Cape: Development Economists +27 41 585 6640 [email protected]
v
5.3 State of Land Restitution in Makana 82 6.1 Land Use Options per Land Capability Class 89 6.2 Land Capability in Makana 89 7.1 Powers and Functions of the Makana Municipality 92 7.2 Makana Staffing Composition 94 8.1 General Opportunities for Development 99 8.2 General Constraints to Development 100
Local Economic Development Strategy Makana Municipality
© 2009 Urban-Econ Eastern Cape: Development Economists +27 41 585 6640 [email protected]
1
CHAPTER 1: INTRODUCTION
Makana is a relatively large municipality located in the Cacadu district in the Eastern Cape. It has a partly urbanized population that encompasses Grahamstown, Alicedale, Fort Brown, Sidbury, Riebeek East, Salem and Seven Fountains. Makana has a developed economy characterised by tourist activity and large service and trade sectors in the urban node of Grahamstown. In addition to this, agriculture, game farming and conservancy reserves can be found throughout the municipality’s less developed areas. The municipality is also dominated by the presence of Rhodes University, an internationally renowned institute of higher learning. The local municipal vision is that “Makana Municipality shall strive to ensure sustainable, affordable, equitable and quality services in a just, friendly, secure and healthy environment which promotes social and economic growth for all.” (IDP, 2008). This strategy forms an integral part of the Makana municipality’s efforts to develop a municipality‐wide local economic and development strategy and bring coherence to economic planning. In terms of the National LED Framework a LED Strategy is needed to: • Provide direction to the LED directorate • Emphasize the role of the entire municipality in terms of LED • Set LED targets that are aligned to national and provincial priorities • Coordinate efforts of private and public sector stakeholders in LED • Inform the municipality’s IDP (as the LED strategy is a sector plan of the IDP) The Municipality boasts a range of leading and potential products including game, beef and goats, as well as local mining products (kaolin) with associated value‐adding opportunities in meat, wool, mohair and ceramics. Tourism forms an integral part of local activity, centred on the internationally renowned National Arts Festival, while other attractions include public nature reserves, private game reserves and outdoor adventure activities, such as sky‐diving, hunting and hiking. There is also potential for further development of cultural and heritage tourism products. 1.1 PURPOSE OF PROJECT The context and the direction for the role of municipalities in economic development is provided in the White Paper on Local Government. It states that “Local government is not directly responsible for creating jobs. Rather, it is responsible for taking active steps to ensure that the overall economic and social conditions of the locality are conducive to the creation of employment opportunities.”. Its role is therefore to create a conducive environment for economic development and growth. This project serves as the Makana municipality’s response to this responsibility. The region faces a number of challenges to local economic development. Unemployment is high, as is poverty. Economic growth has in the recent past been slow, as the area’s development potential has not been exploited fully.
Local Economic Development Strategy Makana Municipality
© 2009 Urban-Econ Eastern Cape: Development Economists +27 41 585 6640 [email protected]
2
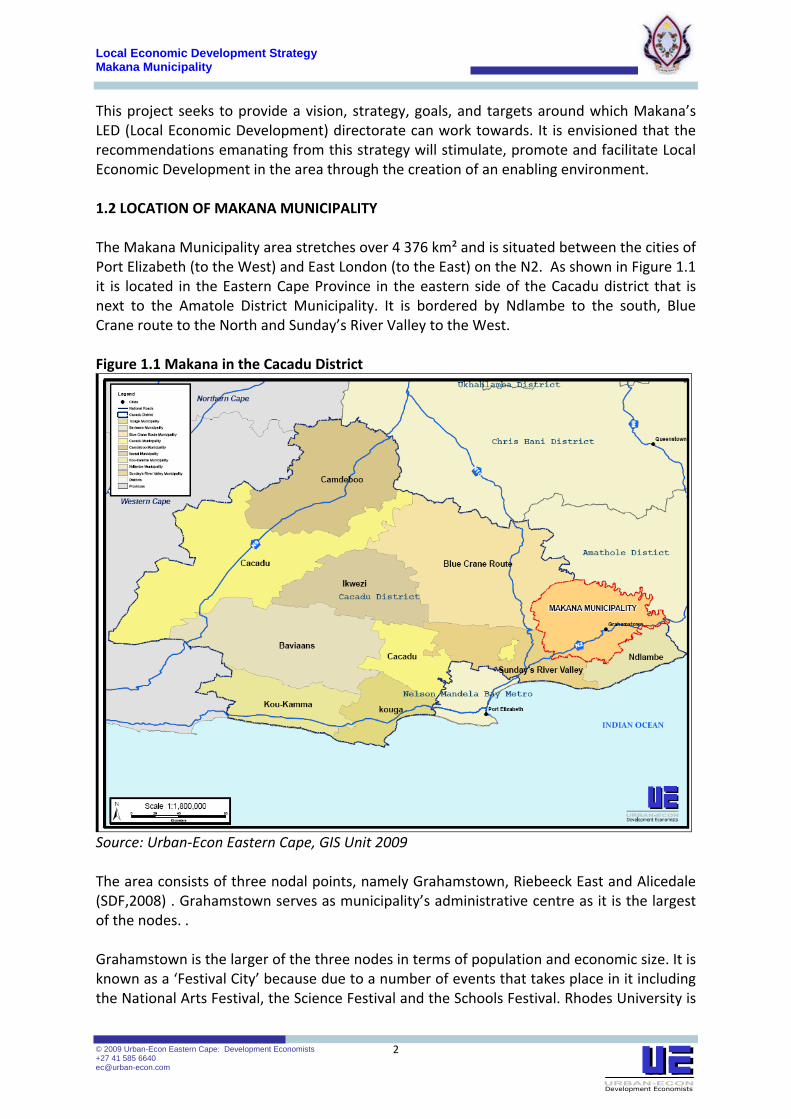
This project seeks to provide a vision, strategy, goals, and targets around which Makana’s LED (Local Economic Development) directorate can work towards. It is envisioned that the recommendations emanating from this strategy will stimulate, promote and facilitate Local Economic Development in the area through the creation of an enabling environment. 1.2 LOCATION OF MAKANA MUNICIPALITY The Makana Municipality area stretches over 4 376 km² and is situated between the cities of Port Elizabeth (to the West) and East London (to the East) on the N2. As shown in Figure 1.1 it is located in the Eastern Cape Province in the eastern side of the Cacadu district that is next to the Amatole District Municipality. It is bordered by Ndlambe to the south, Blue Crane route to the North and Sunday’s River Valley to the West. Figure 1.1 Makana in the Cacadu District
Source: Urban‐Econ Eastern Cape, GIS Unit 2009 The area consists of three nodal points, namely Grahamstown, Riebeeck East and Alicedale (SDF,2008) . Grahamstown serves as municipality’s administrative centre as it is the largest of the nodes. . Grahamstown is the larger of the three nodes in terms of population and economic size. It is known as a ‘Festival City’ because due to a number of events that takes place in it including the National Arts Festival, the Science Festival and the Schools Festival. Rhodes University is

Local Economic Development Strategy Makana Municipality
© 2009 Urban-Econ Eastern Cape: Development Economists +27 41 585 6640 [email protected]
3
a major feature in the physical, social and economic landscape of Grahamstown, and the Makana municipality at large. Rhodes University has thus influenced how the city of Grahamstown has developed. This can be seen in the nature of businesses that are located in Grahamstown, as well as in residential accommodation patterns and other features. Alicedale on the other hand is a small town that in the past served as an important national railway juncture. Currently the Bushman’s Sands Hotel dominates economic activity in Alicedale. The other nodal point in Makana is Riebeeck East an agricultural‐based community founded on NGK property . Figure 1.2 Makana Municipality in the Eastern Cape
Source: Urban‐Econ Eastern Cape, GIS Unit 2009 1.3 METHODOLOGY/APPROACH Figure 1.3 shows the project methodology that was be used in developing the Makana Municipality Local Economic Development Strategy. The various elements of the methodology are discussed further in the inception report. (Refer to annexure)

Local Economic Development Strategy Makana Municipality
© 2009 Urban-Econ Eastern Cape: Development Economists +27 41 585 6640 [email protected]
4
Figure 1.3: Project Methodology
1.4 PURPOSE OF SITUATION ANALYSIS The situation analysis is comprised of several components namely: policy, socio‐economic , economic , infrastructural, environmental and institutional profiles, as well as an opportunity and constraints analysis. The Makana LED Strategy must be aligned to other national and provincial strategic documents and therefore the purpose of the policy component of the policy and institutional profile is to assess national, provincial and local planning documents such as ASGISA, the National Framework for LED in South Africa, the Eastern Cape Provincial Growth and Development Plan and the Cacadu IDP and SDF. The institutional component investigates the existing LED structures in terms of their capacity, human resources and budget.

Local Economic Development Strategy Makana Municipality
© 2009 Urban-Econ Eastern Cape: Development Economists +27 41 585 6640 [email protected]
5
The socio‐economic profile provides an overview of the population living within Makana. The indicators in this profile provide input into identifying specific focus areas that could result in economic growth within the Local Municipality. Indicators that form part of this profile include:
• Population statistics • Education level • Occupation types • Household income • Provision of basic services
Data will be obtained from a number of databases developed by Quantec Research (Pty) Ltd. These databases have compiled data from several surveys conducted by StatsSA including the 2001 Census and the annual Labour Force surveys. The 2007 Community Survey is used as the primary source of data. However it is recognised that due to the smaller sample size used in the survey, figures presented may be under/over stated. The economic profile provides a detailed analysis of the Makana Local Municipality’s economy in its current state. As part of this profile a detailed assessment of each of the economic sectors is conducted. The infrastructural, environmental and institutional profiles provide an overview of the status quo in these sub‐fields. This is done to supplement and contextualize information from the economic and socio‐economic profiles. From such an integrated approach, it will be possible to develop a holistic understanding of the Makana area’s key opportunities and constraints, as are relevant to LED. 1.5 REPORT OUTLINE The structure of the Situation Analysis report is as follows: Chapter Title Purpose 2 Policy
Framework This chapter provides an overview of the national, provincial, district and local municipal planning initiatives that provide the framework in which the LED strategy will be developed.
3 Socio‐economic Profile
The socio‐economic profile provides a demographic overview of the population residing in the project area and considers indicators such as population growth, education ,income and access to basic services
4 Economic Profile
The economic profile considers various economic indicators such as R‐GDP size and growth, and provides a profile of the each of the productive economic sectors in the project area.
5 Infrastructural Profile
This chapter assesses the level of economic infrastructure available in Makana in terms of roads electricity network, water, sanitation and telecommunications so as to better understand the resources available.
6 Environmental Profile
The environmental profile provides a background to the biophysical and environmental characteristics of the area, with reference to topography, climate, vegetation, hydrology and

Local Economic Development Strategy Makana Municipality
© 2009 Urban-Econ Eastern Cape: Development Economists +27 41 585 6640 [email protected]
6
biodiversity. 7 Institutional
Profile This chapter provides an overview of the institutional structure and capacity of the Makana Local Municipality.
8 Economic Potential Analysis
The potential analysis incorporates an opportunity and constraints assessment, which assists in creating an understanding with regard to the sectoral competitive advantages of the local economy and is used to determine the development potential within the Makana area. Key factors that may be inhibiting growth are also identified as part of this process.

Local Economic Development Strategy Makana Municipality
© 2009 Urban-Econ Eastern Cape: Development Economists +27 41 585 6640 [email protected]
6
CHAPTER 2: POLICY FRAMEWORK This chapter shall provide an overview of the policy context from which the Makana LED strategy will be developed. This provides an understanding of the planning paradigm that will inform the LED strategy. A key outcome of this exercise will be the gaining of a better understanding of strategic imperatives from different tiers of government that will have an impact on the development and implementation of the Makana LED strategy This chapter will then provide a brief review of national, provincial, district and local strategic policies that are deemed to be pertinent and instructive. Their relevance to Makana will be interrogated, to ensure that the Makana LED strategy aligns with them. 2.1 NATIONAL PLANNING FRAMEWORK The following national planning initiatives will be reviewed in this section:
• Accelerated and Shared Growth Initiative for South Africa (ASGISA) • White Paper on Local Government • National Framework for Local Economic Development in South Africa • Regional Industrial Development Strategy • Joint Initiative on Priority Skills Acquisition (JIPSA) • National Spatial Development Perspective • Local Government: Municipal Structures Act (No.117 of 1998) • Local Government: Municipal Systems Act (No. 32 of 2000)
2.1.1 ACCELERATED AND SHARED GROWTH INITIATIVE OF SOUTH AFRICA (ASGISA) AsgiSA is the economic development strategy guiding the actions of the South African government since 2006. It focuses on removing the “binding constraints” to higher economic growth in SA in order to increase economic growth beyond 6% per annum by 2014 and half poverty and unemployment by 2014. The main binding constraints and policy aims are summarised below: Area Binding constraint Aim Infrastructure investment
The high cost and poor efficiency and capacity of the national logistics System
Reduce the infrastructure backlog and increase public sector investment in telecoms, electricity, rail, roads, ports and many more, hurried by the preparations for the 2010 World Cup
National industrial policy and sector strategies
Barriers to entry, limits to competition and limited new investment opportunities
Address crosscutting industrial policy challenges (e.g.competition), increase international trade, investment into Africa, increase private R&D, encourage transformation and broad‐based BEE, and develop sector strategies to increase private sector investment in the following key sectors: • Business process outsourcing (BPO) • Tourism

Local Economic Development Strategy Makana Municipality
© 2009 Urban-Econ Eastern Cape: Development Economists +27 41 585 6640 [email protected]
7
• Agriculture • Agro‐processing, including bio‐fuels • Chemicals • Metals beneficiations • Creative Industries (arts, crafts, film, TV & music) • Clothing and textiles • Durable consumer goods • Wood, pulp and paper
Education and skills development
Shortage of suitably skilled labour, and spatial distribution of labour which increasethe cost of labour
Address the shortage of skills, incl. large investments in FET colleges, boost maths and science at schools, support development of graduate unemployment database and retired experts database, foreign skills acquisition through the JIPSA, and many more.
Eliminating the Second Economy
Regulatory environment and the burden on small and medium businesses;
Strengthen the links between the 1st and 2nd economies through: public investment, supporting SMME development, preferential procurement policies, improving access to finance, reviewing existing labour laws, and extending the EPWP.
Macroeconomic issues
Volatility and level of the currency
Reduce the volatility and overvaluation of the currency, integrate and coordinate monetary and fiscal policy, and improve budgeting and expenditure management in government, especially in capital investment.
Governance and institutional interventions
Deficiencies in state organisation, capacityand leadership
Minimise institutional interventions in the market, speed up implementation of key issues from the Growth and Development Summit of 2002, improve local government service delivery, coordinating and integrating the functioning of the various public finance institutions, and so on
(Asgisa, 2006) 2.1.2 WHITE PAPER ON LOCAL GOVERNMENT The white paper on local government states that the powers and functions of local government should be exercised in such a way that it has maximum impact on the development of communities, to meet the basic needs of the poor and to grow the local economy. The white paper recognises that the traditional role of local government exerts a great influence over the economic and social well‐being of communities. Due to its influence on local economies local government needs a clear vision for the local economy and needs to work in partnership with local business to maximise job creation and investment. Local

Local Economic Development Strategy Makana Municipality
© 2009 Urban-Econ Eastern Cape: Development Economists +27 41 585 6640 [email protected]
8
government is not directly responsible for job creation however it is responsible for taking steps to ensure the overall economic and social conditions of the locality are conducive to the creation of employment opportunities. This includes core functions such as the provision of essential reticulated services and promotion of private sector activity. The constitution states that local government is responsible for promoting social and economic development of communities. This provides municipalities with a mandate to provide special economic services or to assist other agencies with the provision of such services. Marketing and investment support can be provided in order to attract and secure potential investors. Other services include small business support and training and placement services. The white paper does acknowledge that limited resources of municipalities may prevent them getting involved in these specialized areas. However it could be possible for municipalities to support or contribute to the activities of other agencies. (Local Government, 1998) 2.1.3 NATIONAL FRAMEWORK FOR LOCAL ECONOMIC DEVELOPMENT IN SOUTH AFRICA The National Framework for LED in SA aims to support the development of “sustainable, robust and inclusive local economies exploiting local opportunities, real potential and competitive advantages, addressing local needs and contributing to national development objectives.” It views LED as the outcome of actions and interventions resulting from local good governance and the improved integration and coordination between national, provincial and local government programmes and projects. Locally owned appropriate solutions and strategies must emerge for local areas to promote sustainable development and sustainable human settlements. Local initiative, energy, creativity, assertive leadership and skills will ultimately unlock the latent potential in local economies. The National Framework for LED in South Africa seeks to mobilise local people and local resources, within the framework of the PGDP and NSDP, to become competitive in the economic marketplace, both domestically and internationally. Strategies to implement these outcomes include: • Improving good governance, service delivery, public and market confidence in municipalities through an alignment of national, provincial and local programmes ‐ is a critical first step in attracting investment • Identifying and exploiting competitive advantage a better understanding of the opportunities and constraints in local economies should inform a more balanced development path. • Instituting Sustainable Developmental Community Investment Programming ‐ suggests building community, and thus using a powerful cultural dynamic, as the main vehicle and partner for LED together with the resourcing of organised communities to become important productive units. • Intensify enterprise support – the Small Enterprise Development Agency (SEDA) should be the key vehicle for localised enterprise support. (LED, 2006)

Local Economic Development Strategy Makana Municipality
© 2009 Urban-Econ Eastern Cape: Development Economists +27 41 585 6640 [email protected]
9
2.1.4 REGIONAL INDUSTRIAL DEVELOPMENT STRATEGY (RIDS) The RIDS provides guidelines for the implementation of policy and the targeting of regions to reduce the regional disparities in SA and promote sustainable economic and employment growth. It accepts it is impossible to achieve a spatially uniform distribution of economic activity, and encourages industrial development at a relatively limited number of locations which are able to develop a competitive edge in regional and international markets. Specific support measures that will be introduced through the RIDS include: Pillar Key Lever Regional agglomeration and infrastructure investment
Acceleration of productive infrastructure provision ‐Spatial Development Initiatives
Addressing economic decline
Direct support to district municipalities to mitigate the impact of capital flight and industrial migration
Institutional framework Creation of a predictable investment & business climate to attract, retain and expand private sector involvement
Regional Finance ‐Public Policy Funding for Regional Industrial Development ‐Mitigation of financial risk ‐Enhancement of financial returns for private capital investments into projects with high Social Returns on Investment
(RIDS, 2006) 2.1.5 JOINT INITIATIVE ON PRIORITY SKILLS ACQUISITION (JIPSA) As part of ASGISA, a new national stakeholder body was launched in March 2006 with an immediate focus on skills identified by ASGISA. These include skills needed for infrastructure development in government, private sector, state‐owned enterprises and social services delivery, with a view to skills development benefiting SMMEs within the sectors identified. Beyond the urgent scarce skills, JIPSA will consider long‐term fundamentals for the supply of skills needed for sustained shared economic growth. Established educational institutions such as universities, FETs and schools, will form the training backbone of JIPSA. The following working areas for JIPSA have been identified based on the ASGISA priorities:
• City, urban and regional planning and engineering skills for municipalities; • Artisan and technical skills, with priority attention on the needs for infrastructure
development; • Management and planning skills in education, health and in municipalities; • Mathematics, science, language and ICT teachers; • Specific skills needed by the Priority ASGISA sectors such as Tourism and BPO, along
with finance, project management and management skills. • Skills relevant to local economic development needs of municipalities, especially
developmental economists.

Local Economic Development Strategy Makana Municipality
© 2009 Urban-Econ Eastern Cape: Development Economists +27 41 585 6640 [email protected]
10
JIPSA plans to achieve these goals by putting a system in place to: • Bring in volunteers, retirees and other people with needed skills to assist with training • Absorb the growing number of unemployed graduates into the economy whilst addressing the mismatch in relation to the type of training offered to these students as compared to skills needed by the job market.
• Address further retraining on the job and elsewhere to ensure the employment of unemployed graduates.
• Maintain a database of skills needs in the economy, including providing an understanding of patterns, trends and key indicators of priority skills demand and supply.
(JIPSA, 2006) JIPSA will concentrate on providing opportunities for historically marginalized members of society, and especially women. 2.1.6 NATIONAL SPATIAL DEVELOPMENT PERSPECTIVE (NSDP) For the government to achieve its broad national developmental targets, interventions undertaken will have to consider spatial differences that could inhibit or promote growth. An appreciation of spatial challenges and how these affect development potential must be recognised if the righting of past wrongs is to be possible. The NSDP provides guiding principles on how to overcome spatial challenges through the application of limited resources in areas with scope for profound impact. The NSDP recommends that the government: • Promote improved service delivery and essential social transfers;
• Focus public investment on human capital development;
• Use land and agrarian reform as key thrusts to implement sound rural development policies and programmes ;
• Establish service node networks designed to facilitate access to vital development services i.e. health, education, welfare, financial and other relevant social services;
• Work on expanding functional linkages between rural areas and major centres to improve market access, skills availability and financial capital.
(NSDP, 2006) 2.1.7 LOCAL GOVERNMENT: MUNICIPAL STRUCTURES ACT (NO.117 OF 1998) According to the Section 83 (3) of the Municipal Structures Act, a district municipality must seek to achieve the integrated, sustainable and equitable social and economic development of its area as a whole by: • Ensuring integrated development planning for the district as a whole:
• Promoting bulk infrastructural development and services for the district as a whole;

Local Economic Development Strategy Makana Municipality
© 2009 Urban-Econ Eastern Cape: Development Economists +27 41 585 6640 [email protected]
11
• Building the capacity of local municipalities in its area to perform their functions and exercise their powers where such capacity is lacking; and
• Promoting the equitable distribution of resources between the local municipalities in its area to ensure appropriate levels of municipal services within the area.
2.1.8 LOCAL GOVERNMENT: MUNICIPAL SYSTEMS ACT (NO. 32 OF 2000) The Municipal Systems Act, promulgated in 2000, enshrines in law the principal planning tool of local government, namely, the IDP. The Municipal Systems Act lists the duties of a municipal council, within its financial and administrative capacity, as follows in Section 4(2), including, but not limited to: • Encourage the involvement of the local community;
• Strive to ensure that municipal services are provided to the local community in a financially and environmentally sustainable manner;
• Consult the local community about (i) the level, quality, range and impact of municipal services provided by the municipality, either directly or through another service provider; and (ii) the available options for service delivery.
• Give members of the local community equitable access to the municipal services to which they are entitled;
• Promote and undertake development in the municipality;
Chapter Five of the Municipal Systems Act describes the IDP as a single, inclusive and strategic plan for the development of a municipality that will be the principal strategic planning instrument which guides and informs all planning and development, and all decisions with regard to planning, management and development in the municipality. The key aspect of the Act is the requirement that every IDP include a ‘spatial development framework, which must include provision of basic guidelines for a land use management system for the municipality’. Section 26(c) of the Municipal Systems Act further specifies that the Integrated Development Plan of a Local Municipality must contain its Local Economic Development aims. LED Strategies are considered to be a Sector Plan that every IDP must take cognisance of and the Makana Local Municipality will be in a better position to adhere to the credible IDP guidelines through the development of an LED Strategy. 2.1.9 RELEVANCE OF NATIONAL POLICIES TO MAKANA MUNICIPALITY The planning initiatives from the national level provide high‐level guidance and direction for the municipality. With regard to the development, and implementation of Makana’s LED strategy: • The core thrusts of ASGISA, RIDS and JIPSA will reduce the cost of doing business in
Makana, and directly tackle the binding constraints identified.

Local Economic Development Strategy Makana Municipality
© 2009 Urban-Econ Eastern Cape: Development Economists +27 41 585 6640 [email protected]
12
• The Local Government White Paper and municipal acts reviewed guide LED as they advocate support services and leadership in the field of economic development, and provides a mandate for LED to create an enabling environment for economic growth
• The principles enshrined in the LED strategy and the will be adhered to in the development of the led strategy. Of particular relevance to Makana is the recommendation in the led framework that there should be a move away from an ‘isolated’ project‐based approach towards a focus on supporting productive activities that are linked into broader support initiatives.
• National Government policies are clearly encouraging more efficient government planning, budgeting, and services which will increase local competitiveness and standards of living for local residents and also increase the reliability and availability of public services.
2.2 PROVINCIAL PLANNING FRAMEWORK The following provincial planning initiatives will be reviewed in this section:
• Eastern Cape Provincial Growth and Development Plan 2004‐2014 • Eastern Cape Spatial Development Plan • Eastern Cape Tourism Master Plan • Eastern Cape Industrial Strategy
2.2.1 EASTERN CAPE PROVINCIAL GROWTH AND DEVELOPMENT PLAN 2004‐2014 The Provincial Growth and Development Plan (PGDP) is designed to deal with the spread and incidence of poverty and unemployment in the Eastern Cape, as well as the spatial inequality between different regions. The PGDP provides the strategic framework, sectoral strategies and programmes aimed at a rapid improvement in the quality of life for the poorest people within the Eastern Cape Province. The objectives for growth and development set in the PGDP must guide development objectives of any economic development strategy within the province. The PGDP’s vision is: “To make the Eastern Cape a compelling place to live, work and invest in”. Its core objectives and targets for growth and development in the Eastern Cape, for the period 2004 – 2014, are listed in the table below: PGDP Objectives and Targets Core Objectives Targets: 2004 to 2014 • Systematic poverty eradication, which focuses on eradicating poverty in rural areas and underdeveloped townships in the province through a holistic, integrated and multi‐dimensional approach to pro‐poor
• To maintain an economic growth rate of between 5% and 8% per annum
• To halve the unemployment rate by 2014
• To reduce, by between 60% and 80%, the number of households living below the poverty line by 2014

Local Economic Development Strategy Makana Municipality
© 2009 Urban-Econ Eastern Cape: Development Economists +27 41 585 6640 [email protected]
13
programming;
• Agrarian transformation and strengthening household food security, which focuses on stimulating growth in the agricultural sectors, specifically in the rural areas through targeting factors and activities that are related to agriculture, including land use and ownership, development of agricultural skills, etc.;
• Consolidation, development and diversification of the manufacturing base and tourism potential, which seeks to use appropriate technology and the development of entrepreneurial skills in the manufacturing and tourism industries to create jobs and raise the level of income in the Eastern Cape.
• To reduce, by between 60% and 80%, the proportion of people suffering from hunger by 2014
• To establish food self‐sufficiency in the province by 2014
• To ensure universal primary education by 2014, with all children proceeding to the first exit point in a secondary education
• To improve the literacy rate in the province by 50% by 2014
• To eliminate gender disparity in education and employment by 2014
• To reduce, by two‐thirds, the under‐five mortality rate by 2014
• To reduce, by three‐quarters, the maternal mortality rate by 2014
• To halt and begin to reverse the spread of HIV‐AIDS by 2014
• To halt and begin to reverse the spread of tuberculosis by 2014
• To provide clean water to all in the province by 2014
• To eliminate sanitation problems by 2014
(PGDP, 2003) 2.2.2 EASTERN CAPE SPATIAL DEVELOPMENT PLAN The Spatial Development Plan (SDP) is intended as a co‐ordinating document that sets out a broad framework for the investment of public funding and management of development in the Eastern Cape towards achievement of a common vision and set of objectives. The objectives of the SDP are to: • Provide a co‐ordinating Provincial spatial framework to dovetail public sector investment towards a common vision and set of objectives
Local Economic Development Strategy Makana Municipality
© 2009 Urban-Econ Eastern Cape: Development Economists +27 41 585 6640 [email protected]
14
• Provide a policy framework to give direction to all other development agencies in the Province regarding the priorities of government • Make public investment programmes more efficient •Provide opportunities for creating an environment within which communities and the private sector can operate more effectively to achieve sustainable economic growth in the Province • Protect natural systems • Make efficient use of resources at a Provincial level • Avoid duplication of effort by different departments and spheres of government • Enable District and Local Municipalities to work within a broad policy framework when preparing Integrated Development Plans This is to be achieved through the application of investment and management policies at three levels: • Fulfilment of basic human rights in the provision of free basic services to both urban and
rural areas at a minimum level in terms of available resources, guided by backlogs in these areas, the proximity of existing bulk services and priorities in terms of local and district IDPs.
• Managed investment of public sector funding in urban and rural areas in order to strengthen local capacity, build on the strengths and opportunities which exist and to maximize potential from the existing infrastructure and settlement system. Capacity building would also include institution building, training, skills transfer and community empowerment.
• Provision of adequate funding to strategically targeted development zones that have development potential. These will represent areas, nodes or areas of opportunity, where a special focus of effort and investment will attract interest from the private sector to invest, either in joint ventures with Government or independently, in order to develop economic growth opportunities and potential which already exists.
The approach to investment and management outlined in the Provincial Spatial Development Plan provides a framework for the development of the Spatial Development Frameworks at local government level. 2.2.3 EASTERN CAPE TOURISM MASTER PLAN The Eastern Cape Tourism Master Plan was commissioned by the Eastern Cape Tourism Board with the intention of developing a Tourism policy for the province. Included in this policy would be a tourism spatial development plan and a growth and development strategy to deal with wide ranging issues in the province. The master plan seeks to aggressively boost the role and image of tourism in the province based on sustainable principles. An envisioned outcome was the growth of tourist markets in the province through interventions to mitigate the following issues:
• Community‐based tourism development
• Infrastructure and enterprise development

Local Economic Development Strategy Makana Municipality
© 2009 Urban-Econ Eastern Cape: Development Economists +27 41 585 6640 [email protected]
15
• Training and skills development
• Political will
• Education and awareness
Differences in the province’s district municipalities are recognised and attended to in the tourism spatial development plan. This is done through prioritisation of certain areas in terms of infrastructure investment, route development and product promotion. The growth and development strategy tackles the need for research, access, capacity building and safety and security. Through a series of actions plans, goals and targets for tourism growth are set to be achieved. The master plan is based on the following policy directives: • Expanding the tourism product base
• Ensuring responsible and sustainable tourism development
• Refining the marketing and branding approaches to respond to New Tourism
• Strengthening inter‐sectoral linkages
These and other more general directives are seen as critical success factors for the tourism policy. (Tourism Master Plan, 2003) 2.2.4 EASTERN CAPE INDUSTRIAL STRATEGY The Eastern Cape Industrial Strategy (ECIS) is a strategy that was developed to guide industrial development in the province and is based on the national and provincial policy strategies that deal with: • Regional growth • Industrial development • The manufacturing sector • Inclusive community development
ECIS is therefore a means of articulating the national and provincial developmental policy framework. It is intended to help contribute towards the achievement of the ASGISA’s and PGDP’s targets of 6% growth and halving unemployment by 2014. The industrial strategy was also developed to counter the uneven development which had resulted from growth being concentrated in a few areas in the province such as Amathole and Nelson Mandela Bay Metro. The ECIS targets specific sectors in the Eastern Cape economy particularly: • Agro‐processing (especially biofuels) • Forestry and timber industries, • Tourism and cultural industries • Business process outsourcing (BPO) • Construction • Chemicals • Metals processing

Local Economic Development Strategy Makana Municipality
© 2009 Urban-Econ Eastern Cape: Development Economists +27 41 585 6640 [email protected]
16
• Auto sector • Clothing and textiles
Strategies (in the form of Industry Action Plans) are then devised to help these sectors drive industrial growth in the Eastern Cape. In addition to these industry action plans, the ECIS includes supply and demand side interventions to the provincial investment environment. Supply side interventions include: • Prioritisation of sectors • Infrastructure • Skills acquisition • Institutional transformation Demand side interventions include: • Investment provision • Access to finance • Public private partnerships 2.2.5 RELEVANCE OF PROVINCIAL POLICIES TO MAKANA MUNICIPALITY It is important that the LED strategy align with and take congisance of the provincial policies identified. • The Eastern Cape PGDP and SDP support national development priorities and act as
guidelines for provincial government programmes in Cacadu and the Makana municipality
• The planning initiatives discuss the need for autonomy and accountability at a local level as a means of achieving decentralised economic development
• The Tourism Master Plan provides an action plan for tourism initiatives, indicating strategic priorities that should be pursued
2.3 DISTRICT PLANNING FRAMEWORK The following district level planning initiatives will be reviewed in this section
• Cacadu District Integrated Development Plan
• District Wide Economic Growth and Development Strategy
• District Wide Economic Growth and Development Summit Agreement
• Cacadu Spatial Development Framework
2.3.1 CACADU DISTRICT INTEGRATED DEVELOPMENT PLAN The Cacadu District Municipality’s vision of a “growing and diversified economy optimising all available resources to enhance the quality of life in all its communities”, can be further described by its aim to: build an integrated, transformed and socio‐economically sustainable district, which is people‐orientated, safe and healthy environment, equitable distribution of resources and free of discrimination. Furthermore the district aims to be an area where all
Local Economic Development Strategy Makana Municipality
© 2009 Urban-Econ Eastern Cape: Development Economists +27 41 585 6640 [email protected]
17
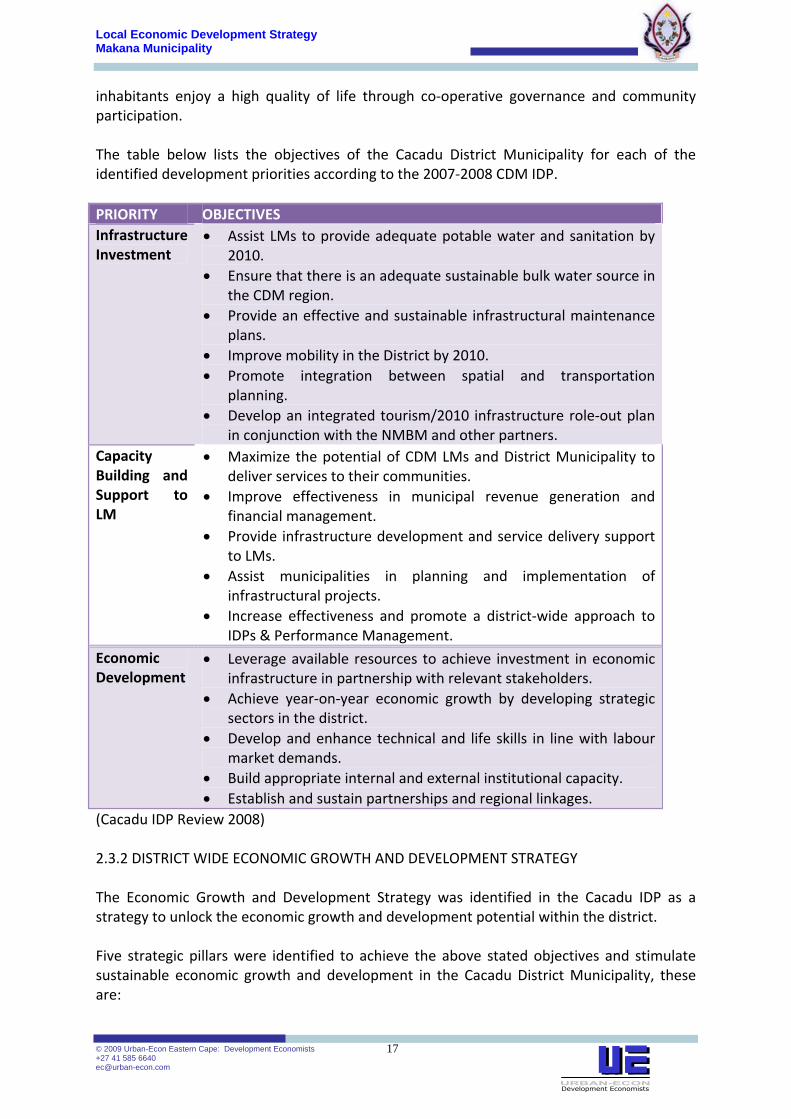
inhabitants enjoy a high quality of life through co‐operative governance and community participation. The table below lists the objectives of the Cacadu District Municipality for each of the identified development priorities according to the 2007‐2008 CDM IDP. PRIORITY OBJECTIVES Infrastructure Investment
• Assist LMs to provide adequate potable water and sanitation by 2010.
• Ensure that there is an adequate sustainable bulk water source in the CDM region.
• Provide an effective and sustainable infrastructural maintenance plans.
• Improve mobility in the District by 2010. • Promote integration between spatial and transportation
planning. • Develop an integrated tourism/2010 infrastructure role‐out plan
in conjunction with the NMBM and other partners. Capacity Building and Support to LM
• Maximize the potential of CDM LMs and District Municipality to deliver services to their communities.
• Improve effectiveness in municipal revenue generation and financial management.
• Provide infrastructure development and service delivery support to LMs.
• Assist municipalities in planning and implementation of infrastructural projects.
• Increase effectiveness and promote a district‐wide approach to IDPs & Performance Management.
Economic Development
• Leverage available resources to achieve investment in economic infrastructure in partnership with relevant stakeholders.
• Achieve year‐on‐year economic growth by developing strategic sectors in the district.
• Develop and enhance technical and life skills in line with labour market demands.
• Build appropriate internal and external institutional capacity. • Establish and sustain partnerships and regional linkages.
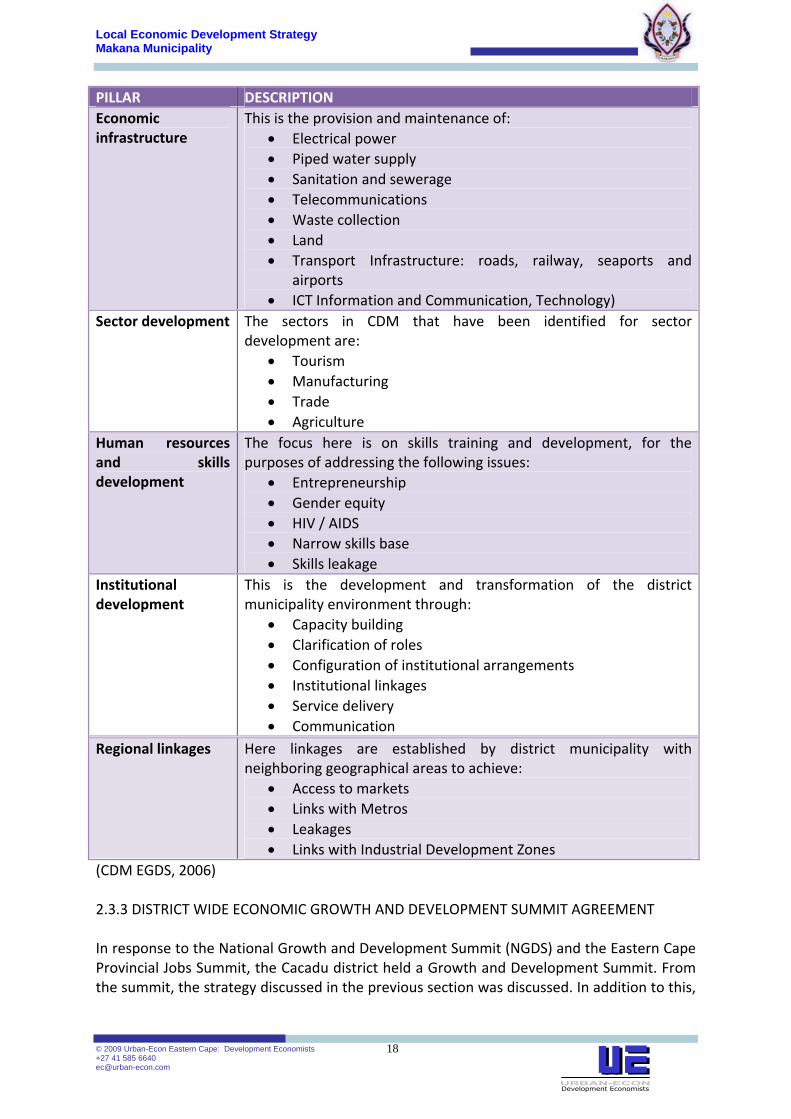
(Cacadu IDP Review 2008) 2.3.2 DISTRICT WIDE ECONOMIC GROWTH AND DEVELOPMENT STRATEGY The Economic Growth and Development Strategy was identified in the Cacadu IDP as a strategy to unlock the economic growth and development potential within the district. Five strategic pillars were identified to achieve the above stated objectives and stimulate sustainable economic growth and development in the Cacadu District Municipality, these are:
Local Economic Development Strategy Makana Municipality
© 2009 Urban-Econ Eastern Cape: Development Economists +27 41 585 6640 [email protected]
18
PILLAR DESCRIPTION Economic infrastructure
This is the provision and maintenance of: • Electrical power • Piped water supply • Sanitation and sewerage • Telecommunications • Waste collection • Land • Transport Infrastructure: roads, railway, seaports and
airports • ICT Information and Communication, Technology)
Sector development
The sectors in CDM that have been identified for sector development are:
• Tourism • Manufacturing • Trade • Agriculture
Human resources and skills development
The focus here is on skills training and development, for the purposes of addressing the following issues:
• Entrepreneurship • Gender equity • HIV / AIDS • Narrow skills base • Skills leakage
Institutional development
This is the development and transformation of the district municipality environment through:
• Capacity building • Clarification of roles • Configuration of institutional arrangements • Institutional linkages • Service delivery • Communication
Regional linkages
Here linkages are established by district municipality with neighboring geographical areas to achieve:
• Access to markets • Links with Metros • Leakages • Links with Industrial Development Zones
(CDM EGDS, 2006) 2.3.3 DISTRICT WIDE ECONOMIC GROWTH AND DEVELOPMENT SUMMIT AGREEMENT In response to the National Growth and Development Summit (NGDS) and the Eastern Cape Provincial Jobs Summit, the Cacadu district held a Growth and Development Summit. From the summit, the strategy discussed in the previous section was discussed. In addition to this,

Local Economic Development Strategy Makana Municipality
© 2009 Urban-Econ Eastern Cape: Development Economists +27 41 585 6640 [email protected]
19
the following objectives were reached, as part of the Growth and Development Summit agreement. Objectives of the Economic Growth and Development Strategy To grow the district economy to achieve a 3% year‐on‐year growth rate between 2006 and 2009 and a 5% year‐on‐year growth rate from 2010 onwards. To reduce the existing number of unemployed persons in the district to 15%, by 2014, through the creation of new and expanded job opportunities. To halve the number of households living below the poverty line to 22%, by 2014. To grow the agricultural sector to achieve a 1% year‐on‐year growth rate between 2006 and 2009 and a 1.6% year‐on‐year growth rate from 2010 onwards. To transform the agricultural sector, thereby ensuring that 35% of agricultural enterprises are black‐owned, by 2014. To grow the contribution of tourism to the district overall economy and employment creation. To transform the tourism sector, thereby ensuring that 35% of tourism enterprises are black‐owned by 2014. (CDM EGDS, 2007 2.3.4 CACADU SPATIAL DEVELOPMENT FRAMEWORK The role of the Cacadu Spatial Development Framework SDF is to enhance the district municipality’s role as a development facilitator from a spatial perspective. This involves making sure adequate mechanisms to ensure cohesive planning in and prioritisation of key development areas are in place. The spatial development framework is the part of the integrated development plan that guides municipalities in the areas of land use, land management and spatial imperatives in future development. The SDF looks at issues surrounding development in a context specific to the region. This is done whilst being informed on higher‐level directives from policy documents such as the National Spatial Development Perspective (NSDP), the White Paper on Spatial Planning and Land Use Management and the Eastern Cape Provincial Growth and Development Plan (2004 – 2014). The framework then looks at means to intervene in the economy, by guiding the location of development in a systematic manner, taking cognisance of the district’s vision as set out in the IDP The Cacadu SDF contains directives which are strategies that target primary areas of intervention in the district . These cover the following areas: • Sustainable Settlement forms
• Housing development policy
• Environmental guidelines
• Transportation guidelines
• Backlogs in water and sanitation
• Infrastructural development needs
Through these it is hoped the SDF will help create a sustainable urban and rural environment and ensure optimal accessibility to potential developmental opportunities. (CDM SDF,2009)

Local Economic Development Strategy Makana Municipality
© 2009 Urban-Econ Eastern Cape: Development Economists +27 41 585 6640 [email protected]
20
2.3.5 RELEVANCE OF DISTRICT POLICIES TO MAKANA MUNICIPALITY • The Makana Local Municipality should benefit from the implementation of various
initiatives identified in the Cacadu IDP.
• LED in the Makana area must address issues identified in the district policies reviewed, and work towards the achievement of the district’s vision, goals and objectives
• The LED strategy will need to be aligned with the Cacadu EGDS and the sectors that were targeted in the EGDS.
2.4 LOCAL PLANNING FRAMEWORK The following planning initiatives will be reviewed in this section:
• Makana IDP
• Makana SDF
• Makana Municipality Tourism Sector Plan
• Makana LED Tourism Report
• Makana LED Mining Report
• Makana LED Agriculture Report
2.4.1 MAKANA IDP The Makana municipality IDP provides a strategic development plan for the five year period from 2007‐2012. It is the principal strategic planning instrument which guides and informs all planning, budgeting, investment, development, management and implementation in the medium‐term decision‐making of the municipality. The IDP identifies a range of developmental constraints which fall under the following categories:
• Institutional
• Infrastructural
• Social
• Economic
• Spatial
• Environmental
In order to tackle these developmental issues the Makana IDP identifies the following areas as developmental priorities:
• Local Economic Development
• Social development
• Education and skills support
• Corporate and co‐operative governance
• Safe and secure environment
• Sports and recreation
• Municipal Infrastructure
• Housing and Land
• HIV and AIDS
• Accessibility and Transport
Local Economic Development Strategy Makana Municipality
© 2009 Urban-Econ Eastern Cape: Development Economists +27 41 585 6640 [email protected]
21
Relevant strategies, programs and projects are thus contained in the IDP, targeting the priority issues identified above. (Makana IDP, 2008) 2.4.2 MAKANA SPATIAL DEVELOPMENT FRAMEWORK (SDF) The primary purpose of the Makana spatial development framework is to represent the spatial development goals of the municipality. It adopts an integrated approach in viewing the spatial implications of different sectoral issues, through the form of a broad framework The Makana SDF first describes the locality of the municipality to provide a status quo of settlement patterns. The SDF is then contextualized through review of various binding legislative and policy documents . Guidelines for the desired spatial form for Makana are then presented, based on optimal land use management combinations the guidelines are then articulated through nodal development plans, and expressed through the Capital investment framework. In order to achieve Makana’s spatial objectives, the SDF includes strategies that cover the following aspects:
• Nodal investment hierarchy (which relates to Grahamstown, Alicedale and Riebeeck East)
• Urban development • Sustainable settlements (which deals with housing , commercial and social facilities) • Tourism and recreation • Transportation policy
The Makana SDF also contains a land use management package, which seeks to guide land use based on:
• Housing need • Land ownership • The existing broad land use pattern
(Makana SDF, 2008) 2.4.3 MAKANA MUNICIPALITY TOURISM SECTOR PLAN Makana municipality’s tourism sector plan profiles the area’s tourism sector, and provides a framework that guides the sector’s development from 2003‐2013. The profile is made up of an analysis of the area’s supply of tourism services, and also examines trends in the demand for the area’s tourism offerings. It then seeks to reconcile demand and supply, through the development of a strategic framework that indicates necessary actions in this regard. The tourism growth and development strategy is based on principles of spatial balance, sustainable activity and responsible community engagement. The sector plan recommends that a shared vision, mission and set of objectives be conceptualised for Makana, under the identity of the Frontier Country brand.

Local Economic Development Strategy Makana Municipality
© 2009 Urban-Econ Eastern Cape: Development Economists +27 41 585 6640 [email protected]
22
The sector plan also includes several guidelines that provide a framework for the responsible development of tourism in Makana. These are:
• Tourism development should proceed on a controlled, systematic basis, according to a staged program of allocating development resources to specified places; the pace of tourism development should be kept in balance with the number and type of tourist arrivals, the development of infrastructure and with Makana’s economic and social capability of absorbing tourism growth.
• Tourism should be developed so that it will serve as a catalyst for increased development of related economic activities such as handicraft production, agriculture, and other related industries, especially favouring HDE and PDI entrance into the industry, and help in supporting improvements of transportation facilities and service sand other infrastructure.
• Tourism should be planned and developed so that it makes maximum use of existing infrastructure, and that improved and new infrastructure should serve general purposes to benefit the local communities, as well as tourism.
• Tourism accommodation and other facilities should be designed to reflect and represent Makana’s distinctive architectural styles, the natural environment, and maximum use should be made of renovating existing buildings which have architectural and historical significance for tourist facilities.
• Tourism should be developed and operated so that it promotes conservation and revitalization of the desirable aspects of traditional cultural patterns, arts and handicrafts, and the maintenance of the essence of religious beliefs and practices, all of which represent the historic and cultural heritage of the Makana district, and should be planned, developed and organized so that it does not result in serious social problems or cultural disruptions.
• Tourism development should be integrated into the overall development policy of Makana as reflected in the LED and IDP, and receive appropriate priority and its necessary share of development resources
• International tourism should also be developed to provide additional employment, job creation, income and foreign exchange
• Domestic tourism should be developed as an important means of recreation, increasing understanding of South Africans from all cultural backgrounds of their own historical, cultural and environmental heritage.
(Responsible Tourism Sector Plan, 2009)
2.4.4 MAKANA LED TOURISM REPORT The tourism report provides an overview of the different forms of tourism that are found in Makana. The report’s objective is to provide a better understanding of the nature and characteristics of tourism, and thus feed into the LED development process. Present tourism activities, as well as potential future activities are profiled, with accompanying recommendations on how the sector can be best positioned to advance the goals of LED in Makana.
Local Economic Development Strategy Makana Municipality
© 2009 Urban-Econ Eastern Cape: Development Economists +27 41 585 6640 [email protected]
23
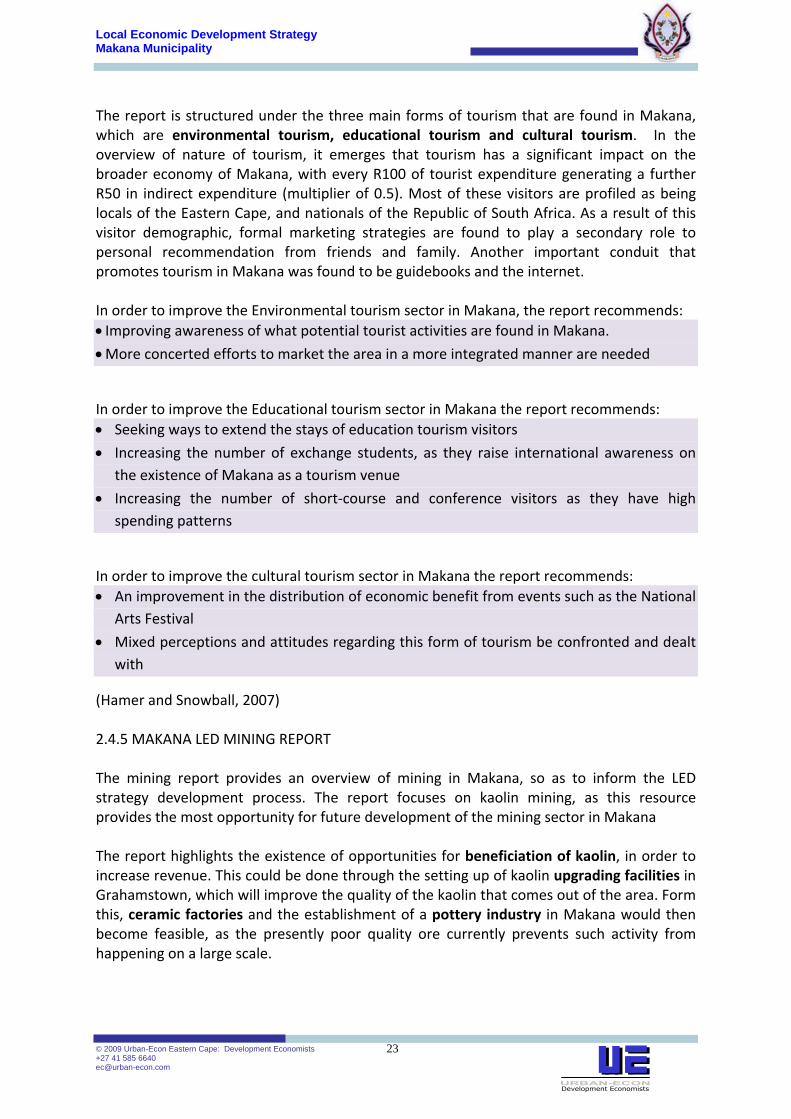
The report is structured under the three main forms of tourism that are found in Makana, which are environmental tourism, educational tourism and cultural tourism. In the overview of nature of tourism, it emerges that tourism has a significant impact on the broader economy of Makana, with every R100 of tourist expenditure generating a further R50 in indirect expenditure (multiplier of 0.5). Most of these visitors are profiled as being locals of the Eastern Cape, and nationals of the Republic of South Africa. As a result of this visitor demographic, formal marketing strategies are found to play a secondary role to personal recommendation from friends and family. Another important conduit that promotes tourism in Makana was found to be guidebooks and the internet. In order to improve the Environmental tourism sector in Makana, the report recommends: • Improving awareness of what potential tourist activities are found in Makana.
• More concerted efforts to market the area in a more integrated manner are needed
In order to improve the Educational tourism sector in Makana the report recommends: • Seeking ways to extend the stays of education tourism visitors
• Increasing the number of exchange students, as they raise international awareness on the existence of Makana as a tourism venue
• Increasing the number of short‐course and conference visitors as they have high spending patterns
In order to improve the cultural tourism sector in Makana the report recommends: • An improvement in the distribution of economic benefit from events such as the National
Arts Festival
• Mixed perceptions and attitudes regarding this form of tourism be confronted and dealt with
(Hamer and Snowball, 2007) 2.4.5 MAKANA LED MINING REPORT The mining report provides an overview of mining in Makana, so as to inform the LED strategy development process. The report focuses on kaolin mining, as this resource provides the most opportunity for future development of the mining sector in Makana The report highlights the existence of opportunities for beneficiation of kaolin, in order to increase revenue. This could be done through the setting up of kaolin upgrading facilities in Grahamstown, which will improve the quality of the kaolin that comes out of the area. Form this, ceramic factories and the establishment of a pottery industry in Makana would then become feasible, as the presently poor quality ore currently prevents such activity from happening on a large scale.

Local Economic Development Strategy Makana Municipality
© 2009 Urban-Econ Eastern Cape: Development Economists +27 41 585 6640 [email protected]
24
The report indicates that greater inroads in terms of community participation and ownership (perhaps through SMMEs) will allow locals of Makana to benefit from this abundant resource. Key recommendations contained in the report are the
• Rezoning of land
• Application for mineral rights
• Purchase of land
This is in order to secure kaolin deposits, as much of the reserves are found in the urban periphery, which means urban development threatens the exploitation of some of the deposits found in Makana. (Horan, 2007). 2.4.6 MAKANA LED AGRICULTURE REPORT The agricultural report was commissioned by the Makana municipality to undertake preliminary research in the area of agriculture as a pillar for LED. The report thus investigates challenges and opportunities for agriculture to function as a vehicle for LED in Makana. The report also looks at obstacles to the agricultural sector’s development, and provides recommendation on means to mitigate against these, and on areas of further research. The report thus provides an overview of agriculture on the municipal, provincial and national levels, as it relates to LED. The report shows how the agricultural sector has been declining in Makana and is presently confronted by the following sets of challenges: Category Challenge Emerging farmers Land reform and tenure rights
Coordination failure as a group Lack of business management skills Poor access to marketing channels No public good such as education and health services provision
Commercial farmers
Inadequate Social infrastructure Technical support and assistance Crime Absence of a supportive environment from the municipality
The report makes several recommendations on how the agricultural sector may be better poised to advance LED in Makana:
• Any agricultural projects identified in the LED strategy must be backed by thorough and comprehensive research to determine feasibility, projects scopes and other operational variables. This will prevent wastage of resources and white elephants .

Local Economic Development Strategy Makana Municipality
© 2009 Urban-Econ Eastern Cape: Development Economists +27 41 585 6640 [email protected]
25
• Subsistence Agriculture as a means of poverty alleviation and income augmentation must be promoted in urban areas. This recommendation would include training and support for home gardens and the growing of fruit trees.
(Antrobus and Antrobus, 2008)
2.4.7 RELEVANCE OF LOCAL POLICIES TO THE LED STRATEGY The local strategies reviewed will inform the Makana LED strategy more directly than those found at the national, provincial and district level. This is because local strategies and policies taken cognisance and are developed in the context of the other higher levels, but at the same time consider Makana specific factors that will directly affect the region’s growth and development. • The Makana IDP identifies impediments to development in the area, as faced by
different stakeholders. The LED strategy will seek to directly and indirectly mitigate the effects of these impediments to development
• This will be done through aligning the LED strategy with the development priorities found in the IDP
• The SDF provides guidance in terms of the spatial nature of growth in Makana. The LED strategy will need to consider the dominance of grahams town in the Makana area, as well as the relative marginalisation of other areas in the Makana area.
• The sector specific research into the tourism, mining and agriculture sector was commissioned to form a foundation for the LED development process
• The sector specific research profiles the nature of activity in Makana’s pillars and identifies opportunities for growth as well as constraints on development
• The tourism sector plan provides guidelines on the sustainable, balanced and responsible management and development of tourism initiatives in the area

Local Economic DevelopmentStrategy Makana Municipality
© 2009 Urban-Econ Eastern Cape: Development Economists +27 41 585 6640 [email protected]
26
CHAPTER 3: SOCIO‐ECONOMIC PROFILE The overall development and performance of the Makana municipality will be determined by its fundamental socio‐economic characteristics. These have an impact on the economic performance of the area, as well as its social and community development. In addition, the Makana LED is about improving the livelihoods of all residents in the area, and for this to be achieved, a clear understanding of the current situation is required. This section will thus provide an overview of and discuss various indicators that have a bearing on the quality of life in Makana including:
• Demographics • Education • Employment • Occupation profile • Income levels • Access to amenities
In order to maintain internal consistency throughout the situational analysis and the strategic framework, the primary source of statistics will be databases complied by Quantec Research. These databases make use of reports including
• 2001 and 1996 censuses • 2007 community survey • Quarterly labour force survey • Income and Expenditure survey
The statistics although sourced from available secondary data and recognised to have limitations in accuracy, provide a basis from which various analyses can be undertaken and are useful insofar as they reveal:
• Baseline information indicative of the status quo • Disaggregated information that is specific to the Makana area • Trends over time • Various planning scenarios • Structural changes and dynamic shifts
Where appropriate, other sources of information (both primary and secondary) will be consulted in this and subsequent chapters of the LED strategy. These include municipal and district level IDPs and SDFs, which will provide refined levels of information. The Makana municipality as set out in its current boundaries was established in 2000 when the magisterial and municipal boundaries were realigned. Therefore, all references to the Makana municipal area from before 2000 are based on disaggregated trend estimations, which is a statistical technique used to predict and interpret data. This process is informed by the Municipal Demarcation Board’s Municipal Profiles and allows reliable comparison of statistics for the Makana area before and after 2000
Local Economic DevelopmentStrategy Makana Municipality
© 2009 Urban-Econ Eastern Cape: Development Economists +27 41 585 6640 [email protected]
27
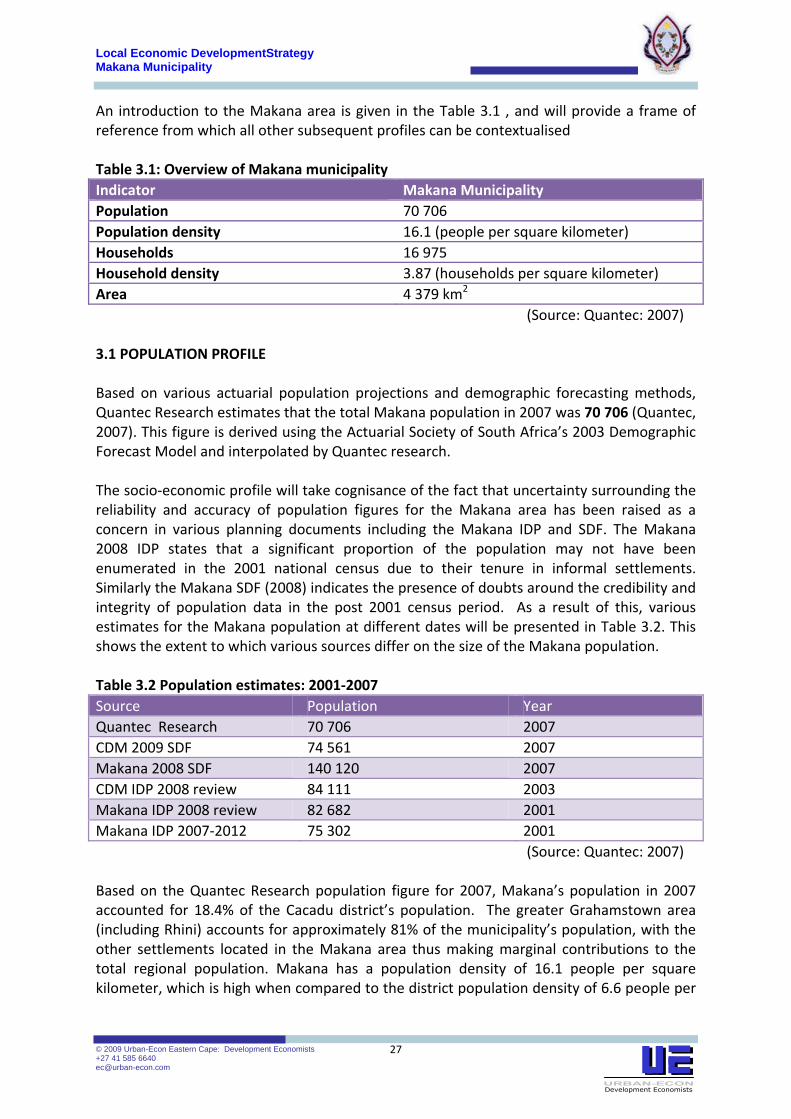
An introduction to the Makana area is given in the Table 3.1 , and will provide a frame of reference from which all other subsequent profiles can be contextualised Table 3.1: Overview of Makana municipality Indicator Makana Municipality Population 70 706 Population density 16.1 (people per square kilometer) Households 16 975 Household density 3.87 (households per square kilometer) Area 4 379 km2
(Source: Quantec: 2007) 3.1 POPULATION PROFILE Based on various actuarial population projections and demographic forecasting methods, Quantec Research estimates that the total Makana population in 2007 was 70 706 (Quantec, 2007). This figure is derived using the Actuarial Society of South Africa’s 2003 Demographic Forecast Model and interpolated by Quantec research. The socio‐economic profile will take cognisance of the fact that uncertainty surrounding the reliability and accuracy of population figures for the Makana area has been raised as a concern in various planning documents including the Makana IDP and SDF. The Makana 2008 IDP states that a significant proportion of the population may not have been enumerated in the 2001 national census due to their tenure in informal settlements. Similarly the Makana SDF (2008) indicates the presence of doubts around the credibility and integrity of population data in the post 2001 census period. As a result of this, various estimates for the Makana population at different dates will be presented in Table 3.2. This shows the extent to which various sources differ on the size of the Makana population. Table 3.2 Population estimates: 2001‐2007 Source Population Year Quantec Research 70 706 2007 CDM 2009 SDF 74 561 2007 Makana 2008 SDF 140 120 2007 CDM IDP 2008 review 84 111 2003 Makana IDP 2008 review 82 682 2001 Makana IDP 2007‐2012 75 302 2001 (Source: Quantec: 2007) Based on the Quantec Research population figure for 2007, Makana’s population in 2007 accounted for 18.4% of the Cacadu district’s population. The greater Grahamstown area (including Rhini) accounts for approximately 81% of the municipality’s population, with the other settlements located in the Makana area thus making marginal contributions to the total regional population. Makana has a population density of 16.1 people per square kilometer, which is high when compared to the district population density of 6.6 people per

Local Economic DevelopmentStrategy Makana Municipality
© 2009 Urban-Econ Eastern Cape: Development Economists +27 41 585 6640 [email protected]
28
square kilometer. This indicates a high level of urbanization in the LM, which puts pressure on the municipality to provide essential services. Based on various estimates, the Makana population stabilised and peaked in the late 1900s, and has been slowly declining until and including 2007. This means that it has shrunk by approximately 5.5% from 1995’s 74 618. This is in line with the stabilization of the Cacadu district’s and the Eastern Cape’s provincial population around the same period, which have also marginally shrunk from their 1995 values. Despite the overall plateau in population growth, informal settlement populations increased. This may indicate migration from farms and areas in the Grahamstown periphery to the core, in the search for economic opportunities and improved service provision. 3.1.1 AGE AND GENDER STRUCTURE In terms of the age and gender structure in Makana, Figure 3.1 shows an aggregated population pyramid for the municipality. Population pyramids are visual representations of an area’s age and gender structure, helping to establish the potential size of the economically active labour force. Figure 3.1: Age and Gender structure
(Source: Quantec: 2007) 66% of the population falls within the economically active age of 15‐64, which leads to a healthy dependency ratio of 0.51. A dependency ratio of 0.51 means that every economically active person supports an average of 0.51 people, made up of youth and the elderly. This may be compared with the provincial dependency ratio of 1.81, which is much higher. The 15‐34 age group constitutes 38.8% of the total population. This is a result of the Makana municipality hosting a range of education facilities including Rhodes University, which attract people within the 15‐34 age group. The implication of this relatively young

Local Economic DevelopmentStrategy Makana Municipality
© 2009 Urban-Econ Eastern Cape: Development Economists +27 41 585 6640 [email protected]
29
population is that extra pressure on the need for employment creation opportunities is placed on the municipality. 3.2 EDUCATION PROFILE Education levels have a direct impact on economic development and the quality of life enjoyed by residents of an area. This is because it influences the skills profile and thus the employability of a population. Education affects the potential that workers have, their productive efficiency and also their ultimate income levels. Education is therefore acknowledged as being inextricably linked to the economic development of an area. Figure 3.2 shows the levels of education in the Makana municipality. Figure 3.2 Level of Education
(Source: Quantec: 2007) 6.19% of the Makana population has received no schooling, which is below the provincial level of 9.4% and the district level of 12.3%. With regards to basic literacy, 36.11% of the Makana population have only been educated up to primary level, which is better than the provincial level. The Makana area excels in terms of the proportion of the population that has completed matric, and attained tertiary levels of education. 22.07% of Makana residents have an education level of matric or higher, which is almost twice the provincial level of 13.33%. The implication of this is that a large proportion of the population is able to (has the potential to) become fully economic active members of society as their employability is higher than those of uneducated people. This means that the Makana area has a high ability to attract and retain highly educated individuals. This is because of the presence of Rhodes University in Grahamstown, and the numerous primary and secondary schools also found in Grahamstown which draw in ‘educational migrants’ into the area, both from outside the province and outside the country. This is because a large proportion of those with high education levels, and those in the 15‐34 age band represent scholars and students who come from outside the municipality. This also has implications on the levels of employed and not economically active people as discussed in section 3.3, as it may artificially inflate municipal unemployment levels. (Whisson, 2009)
Local Economic DevelopmentStrategy Makana Municipality
© 2009 Urban-Econ Eastern Cape: Development Economists +27 41 585 6640 [email protected]
30
3.3 EMPLOYMENT PROFILE As was indicated in the education profile, education levels have an impact on employment levels in an area. Employment in turn has an impact on household income levels and the overall economic structure of an area. 3.3.1 EMPLOYMENT STATUS
• For the purposes of this section, people’s employment status may be categorized as employed, unemployment and not economically active. These statuses may be defined as:
• Employed have within the last seven days performed work for pay. • Unemployed (i.e. Those people within the economically active population who: did
not work during the seven days prior to the interview; want to work and are available to start work within two weeks of the interview; and have taken active steps to look for work or to start some form of self‐employment in the four weeks prior to the interview.)
• Not economically active (i.e. A person who is not working and not seeking work or not available for work)
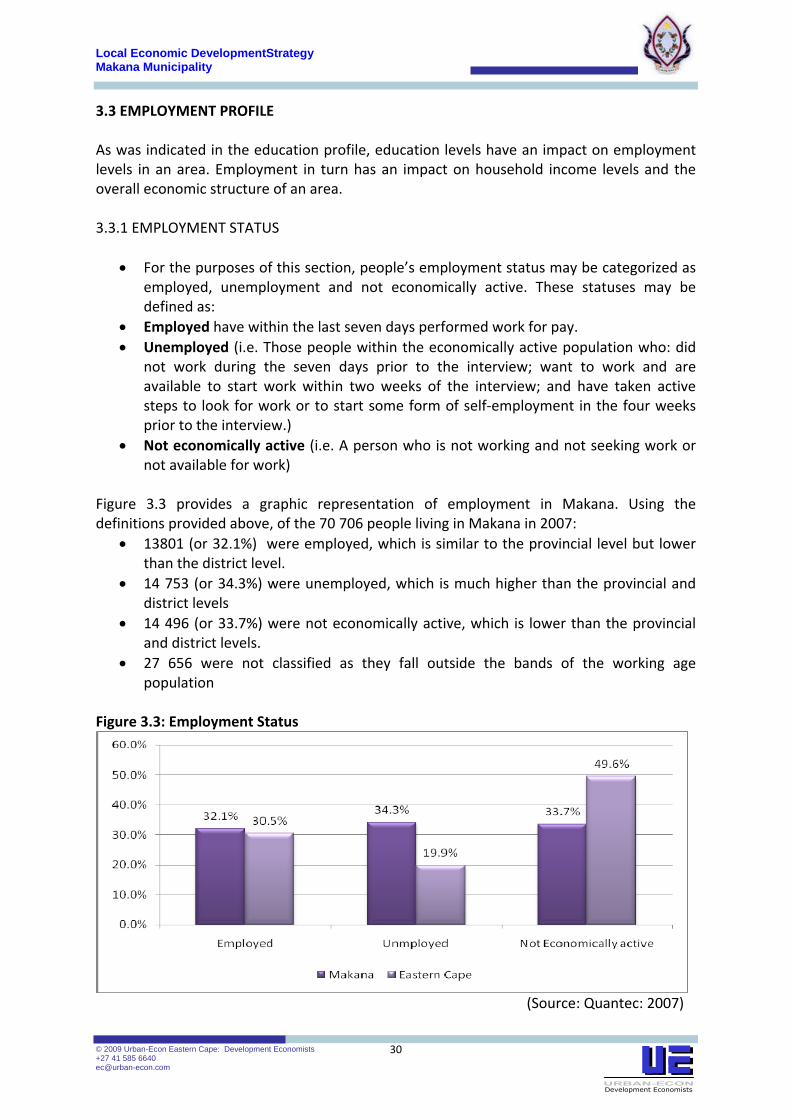
Figure 3.3 provides a graphic representation of employment in Makana. Using the definitions provided above, of the 70 706 people living in Makana in 2007:
• 13801 (or 32.1%) were employed, which is similar to the provincial level but lower than the district level.
• 14 753 (or 34.3%) were unemployed, which is much higher than the provincial and district levels
• 14 496 (or 33.7%) were not economically active, which is lower than the provincial and district levels.
• 27 656 were not classified as they fall outside the bands of the working age population
Figure 3.3: Employment Status
(Source: Quantec: 2007)

Local Economic DevelopmentStrategy Makana Municipality
© 2009 Urban-Econ Eastern Cape: Development Economists +27 41 585 6640 [email protected]
31
The high level of unemployed as opposed to not economically active means that the percentage of people in Makana actively looking for work that have not yet been discouraged by long term unemployment is higher than the provincial and district level. This means that there is a perception of there being employment opportunities present in the area that drives people to continue in their search for employment. This is comparable with the provincial and district scenarios in which a higher number of people are no longer seeking work even though they are not employed (discouraged workers), which is an indicator of limited opportunities. The breakdown of people between unemployed and not economically active statuses may also be indicative of the temporary nature of jobs (rather than permanent) that avail themselves in the Makana area. This is in line with the dominant activities in Makana which are:
• Tourism – Events such as the national arts festival support temporary employment much more than permanent employment
• Community Services‐ In the form of Rhodes University and the schools situated within Makana
• Trade and Agriculture – which can be cyclical and seasonal in nature. 3.3.2 EMPLOYMENT BY OCCUPATION 81.5% of those employed in Makana were employed in formal sector, while 18.5% of total employment was in the informal sector. This is a reflection of its educational profile, as a more educated community generally finds employment in the formal sector. The formal‐ informal sector representation is identical to the provincial trend (18.3%) but lower than the district level of 25.5%. the high level of formal sector employment in Makana provides some insight into the nature and character of its economy, and the employment opportunities created within it. It may be deduced that the scope for small and micro‐scale entrepreneurial ventures can be mostly found in the formal, mainstream sphere of economic activity. With regards to the period between 1995 and 2007, job growth has been erratic. The number of people employed in Makana declined at an average rate of 0.91% per year, but employment levels have rebounded since 2003. Though, Makana’s employment levels have fallen at a faster rate than that of the district and the province, it must be noted that this fall was off a relatively smaller base, which magnifies the effects of small changes. Of concern is the fact that informal employment in Makana has fallen at an approximated rate of 2.6% a year. This has happened while the skills profile has remained largely static, with:
• 13% of workers being highly skilled • 44% of workers being skilled • 43% or workers being unskilled
The skills profile which is line with the education profile provided is reflected in Figure 3.4

Local Economic DevelopmentStrategy Makana Municipality
© 2009 Urban-Econ Eastern Cape: Development Economists +27 41 585 6640 [email protected]
32
Figure 3.4: Employment by occupation
(Source: Quantec: 2007)
21% of the workforce is made up of professionals and senior officials, which is a result of the significant impact that Rhodes University has. The percentage of people employed as technicians and other allied activity is low when consideration of those in elementary occupations (17%) is made. 3.4 HOUSEHOLD INCOME The demographic make‐up of an area, coupled with its educational characteristics and employment trends all have an impact of household incomes. Household income is defined as the combined income of all members of a household. The determination of the income includes: • Labour remuneration • Income from property • Transfers from government (including pensions) • Transfers from incorporated businesses • Transfers from other sources As household income translates into buying power, it is thus also a determinant of the standard of living enjoyed by residents of Makana. 23% of households in Makana subsist on an income below the poverty line (of R800 a month or R9 600 a year), while 18% and 29% of district and provincial households respectively face a similar plight. The Makana municipality has a higher percentage of people in the high income brackets than the Eastern Cape which means that on average, household incomes in Makana approximate to R8 417.63 per month. This places Makana among the higher income ranges in the Eastern Cape.

Local Economic DevelopmentStrategy Makana Municipality
© 2009 Urban-Econ Eastern Cape: Development Economists +27 41 585 6640 [email protected]
33
Figure 3.5: Average Household Income
(Source: Quantec: 2007)
3.5 ACCESS TO BASIC SERVICES In the introduction to the socio‐economic profile, it was revealed that indicators of general well‐being would be reviewed. In line with this, the provision of certain basic services has a direct and immediate effect on the quality of lives experienced by residents of an area. These services include but are not limited to: • Water supply • Refuse collection and disposal • Electricity • Sanitation The link between such basic services and the quality of life can be seen in how if the water that is provided is of a poor quality or refuse is not collected regularly, it will contribute to the creation of unhealthy and unsafe living environments. Similarly poor service delivery in the form of electricity shortages can also make it difficult to attract business or industry to an area and therefore limits job opportunities for residents. The Makana Municipality generally fares well in terms of service provision in comparison to the Cacadu District and the Eastern Cape Province. This is presented in Figure 3.6. Water provision relates to piped water inside the household dwelling and sanitation refers to flush and chemical toilets that are communally accessible. Provision of these services is low, in line with provincial and district standards, whilst the Makana Municipality does perform

Local Economic DevelopmentStrategy Makana Municipality
© 2009 Urban-Econ Eastern Cape: Development Economists +27 41 585 6640 [email protected]
34
well in terms of provision of electricity for lighting and refuse removal. However, when broader measures of basic service provision are used (e.g. other forms of sanitation services and piped water beyond individual yards), the performance of the municipality is found to improve. Further analysis of service provision will be provided in the infrastructure profile. Figure 3.6: Access to Basic Services
(Source: Quantec: 2007)
3.6 SYNTHESIS An overview of some of the development indicators profiled in this chapter are shown in Table 3.3 Table 3.3: Synthesis of Socio‐Economic Profile Variable Description Population 70 706 Population Density 16.1 persons per square kilometre Age Profile 38.9% of population are in the 15‐34 age bracket Education 6% have no schooling
22% have matric or higher Employment 34% unemployed Monthly household income
Average weighted household income: R8 417.63 23% of households live below poverty line of R800 per month
From this chapter it is evident that households in the Makana Municipality are on average better off than those in the rest of the Cacadu district and the Eastern Cape. In comparison to the Eastern Cape Province, the municipality has a higher percentage of people with Matric level education, and a lower level of people without any form of education. Poverty levels are also lower in Makana than in the rest of the district and the province. Makana has a higher unemployment rate than the provincial level. It is apparent that the local economy is currently not generating enough employment opportunities. This is a

Local Economic DevelopmentStrategy Makana Municipality
© 2009 Urban-Econ Eastern Cape: Development Economists +27 41 585 6640 [email protected]
35
situation that arises despite the population being relatively well educated, and average household income levels being high. The need for the Makana Municipality to create an enabling environment that is conducive to growth and development thus arises, and will be confronted throughout the rest of the document. The provision of some basic services does ease the requirements for social infrastructure, which can allow the municipality to focus on providing economic infrastructure and promoting economic development.

Local Economic Development Strategy Makana Municipality
© 2009 Urban-Econ Eastern Cape: Development Economists +27 41 585 6640 [email protected]
36
CHAPTER 4: LOCAL ECONOMIC PROFILE The previous chapter provided insights into the socio‐economic characteristics of the Makana region. This chapter will look at the Makana economy from a historic perspective in order to gain an understanding of what trends have shaped its development. The present state of the various sectors that comprise the Makana economy will also be discussed in order to understand the dominant features it can be currently characterised by. The local economic profile will provide an overview of the Makana economy, with its outcomes becoming the inputs for the economic potential assessment. This chapter will be made up of the following sections:
• Overall economic performance • Sector contribution to Regional Gross Domestic Product (R‐GDP) • Sector Profiles
4.1 OVERALL ECONOMIC PERFORMANCE Regional Gross Geographic Product (R‐GDP) is an important indicator of economic activity and comprises the value of all final goods and services, produced during one year, within the boundaries of a specific region and is commonly used to measure the level of economic activity in a specific area e.g. local municipality. Table 4.1 shows the overall historic performance of the Makana economy, and Table 4.2 compares the Makana growth rate with that of the district and the province. Table 4.1 Makana Municipality Overall Economic Performance Year R‐GDP (R’000 at 2000
prices Contribution to Cacadu
R‐GDP Contribution to Eastern
Cape R‐GDP 1995 1 215 095 23.5% 1.92% 2001 1 219 496 21.2% 1.73% 2007 1 327 491 19.7% 1.51% (Source: Quantec, 2007) Table 4.2: Average Annual R‐GDP Growth Rate Period Makana Cacadu Eastern Cape Province
1995‐2001 0.06 1.83 2.60 2001‐2007 1.47 2.82 4.21 (Source: Quantec, 2007) The Makana R‐GDP in 2007 (at year 2000 constant prices) was approximately R1,3 billion, which accounted for 19.7% of the Cacadu R‐GDP and 1.51% of the provincial R‐GDP. Grahamstown makes the largest contribution to the Makana economy, mainly in the form of educational services and tourism related activities. Looking at it from a historical perspective the Makana economy grew at a slow rate between 1995 and 2007, lagging behind district and provincial trends. The Makana economy performed below par from 1995 to 2001, as seen through a decline in agricultural incomes

Local Economic Development Strategy Makana Municipality
© 2009 Urban-Econ Eastern Cape: Development Economists +27 41 585 6640 [email protected]
37
and changes in government and community service expenditures. From 2001 to 2007 the Makana economy grew at a faster rate than before (average of 1.47 a year), as tourism and agriculture recovered in the form of Private game reserves. Despite this, throughout the period 1995‐2007, the Makana economy grew at a much slower pace than the Cacadu district and the Eastern Cape. There was thus a matching fall in the Makana area’s contribution to district and provincial output. Figure 4.1 R‐GDP per Capita in the Eastern Cape
(Source: Quantec, 2007 Figure 4.1 shows R‐GDP per capita for the entire Eastern Cape. The map reveals an approximate value of the goods and services produced per person in the Eastern Cape, and is based on the output and populations of each Local Municipality in the province. The map shows that Makana’s GDP per capita is in line with the provincial average. Makana’s R‐GDP per capita of R18.77 falls within the median range. This is in comparison to the former Transkei areas in the Eastern part of the province that typically have underdeveloped economies and industrial hubs such as Nelson Mandela Bay and East London. The Makana R‐GDP per capita can be explained by how the economy is characterised by service trade, with little industrial manufacturing or resource based activity.
Local Economic Development Strategy Makana Municipality
© 2009 Urban-Econ Eastern Cape: Development Economists +27 41 585 6640 [email protected]
38
The sluggish performance of the Makana economy from 1995 to 2007 may undermine the fight against poverty, unemployment and crime in the area. Slow growth means that the economy may not generate enough permanent jobs to reduce unemployment. Low growth may also lead to more houses holds falling into poverty, becoming exposed to social ills such as crime and poor health. It is worth noting at this point that the slow economic growth experienced may be partly attributed to outward migration by skilled people seeking employment and economic opportunities elsewhere. 4.2 SECTOR CONTRIBUTION TO R‐GDP This section will consider each of the different economic sectors individually .This will be done in order to see which sectors are most active and dominant in the Makana area, and to gain a better understanding of how each sector functions . 4.2.1 STANDARD INDUSTRIAL CLASSIFICATION Classification of economic activity in this report shall be based on the South African Standard Classification of all Economic Activities (SIC) approach. Under this approach, similar forms of economic activity are organised and distinguishable under the following nine major sectors which are discussed further in Annexure 1: 1. Agriculture, hunting, forestry and fishing 2. Mining and quarrying 3. Manufacturing 4. Electricity, gas and water supply 5. Construction 6. Wholesale and retail trade; 7. Transport, storage and communication 8. Financial intermediation, insurance, real estate and business services 9. Government and Community services As is evident, these sectors are made up of combinations of diverse forms of activity. Under the SIC approach, it is possible to disaggregate economic activity to sub‐sectoral level, as well as into lower levels of greater detail. 4.2.2 ECONOMIC STRUCTURE The relative contribution of each economic sector to R‐GDP shows how important each is to the overall functioning of the Makana economy. Figure 4.2 shows historic trends of how much each economic sector has contributed over the period 1995 to 2007. It must be noted that official statistics only show activity in the formal economy, and do not reveal the full extent of activity in the informal economy. Of Makana’s entire R‐GDP of approximately R1.3 billion, R684,046 million was generated in the Government and Community Services sector. This sector is made up of government spending in the form of municipal activities, and community services in the form of education facilities and services. The reason for the large size of this sector in Makana is the
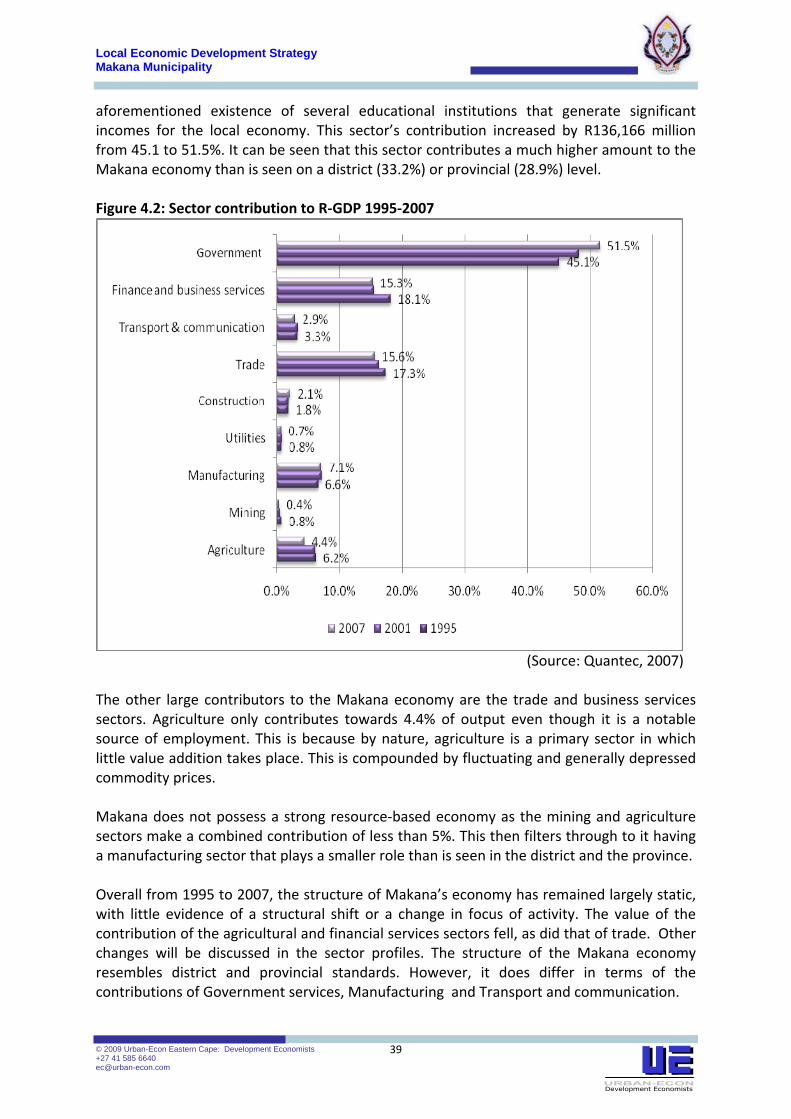
Local Economic Development Strategy Makana Municipality
© 2009 Urban-Econ Eastern Cape: Development Economists +27 41 585 6640 [email protected]
39
aforementioned existence of several educational institutions that generate significant incomes for the local economy. This sector’s contribution increased by R136,166 million from 45.1 to 51.5%. It can be seen that this sector contributes a much higher amount to the Makana economy than is seen on a district (33.2%) or provincial (28.9%) level. Figure 4.2: Sector contribution to R‐GDP 1995‐2007
(Source: Quantec, 2007)
The other large contributors to the Makana economy are the trade and business services sectors. Agriculture only contributes towards 4.4% of output even though it is a notable source of employment. This is because by nature, agriculture is a primary sector in which little value addition takes place. This is compounded by fluctuating and generally depressed commodity prices. Makana does not possess a strong resource‐based economy as the mining and agriculture sectors make a combined contribution of less than 5%. This then filters through to it having a manufacturing sector that plays a smaller role than is seen in the district and the province. Overall from 1995 to 2007, the structure of Makana’s economy has remained largely static, with little evidence of a structural shift or a change in focus of activity. The value of the contribution of the agricultural and financial services sectors fell, as did that of trade. Other changes will be discussed in the sector profiles. The structure of the Makana economy resembles district and provincial standards. However, it does differ in terms of the contributions of Government services, Manufacturing and Transport and communication.

Local Economic Development Strategy Makana Municipality
© 2009 Urban-Econ Eastern Cape: Development Economists +27 41 585 6640 [email protected]
40
4.2.3 SECTORAL EMPLOYMENT It is prudent to consider how sectoral employment compares with sectoral output. This will allow identification of those sectors that are capital or labour intensive and thus driving potentially driving job creation in Makana. Figure 4.3 shows employment contributions per sector, with associated changes from 1995 to 2007. Figure 4.3: Formal employment per sector: 1995‐2007
(Source: Quantec, 2007)
Employment created by the government and community services sector (50%) matches its R‐GDP contribution of 51%. Employment in this sector has increased as the sector’s output has also increased. A large proportion of this is from Rhodes University, which directly employs approximately 10% (+‐1500 workers) of the entire Makana labour force, and indirectly creates employment in other sectors as well. Employment in the finance and business services sector doubled between 1995 and 2007 from 767 to 1558 people. This saw a rise in its contribution from 5% to 11% even though this growth came off a relatively small base to start of with. The increase in employment in this sector also came about as the sector’s contribution to R‐GDP declined. Other notable changes were seen in agricultural employment, where employment fell by 47% from 3 277 people in 1995 to 1 740 in 2007. This means that agriculture which in 1995 accounted for 20% of all employment in Makana declined in its contribution to 12.3%. Despite this fall in employment, as well as falling agricultural output, the sector still employs a high proportion of people compared to its R‐GDP contribution (12% employment for a 4.4% contribution to output. It thus emerges that it is an important economic sector in the region given that it is labour intensive and provides low skilled employment. However it is a low contributor to GGP and also provides largely low paying jobs.

Local Economic Development Strategy Makana Municipality
© 2009 Urban-Econ Eastern Cape: Development Economists +27 41 585 6640 [email protected]
41
Agricultural employment in Makana is less than half of the district level of 27.4%. Possible environmental and climatic causes for this will be discussed in the environmental and sector profiles. Makana generally mirrors district and provincial employment patterns. It does however, differ in terms of the employment contributions of the manufacturing sector, and government and community services. 4.2.4 RELATIVE IMPORTANCE OF SECTORS Figure 4.4 reveals the relative importance of different economic sector in Makana as seen through their:
• Average R‐GDP Growth rates from 1995 to 2007 • Average contribution to R‐GDP from 1995 ‐2007 • Average employment contribution
Figure 4.4: Importance of each economic sector
(Source: Quantec, 2007)
Of Makana’s entire R‐GDP of approximately R1.3 billion, R684,046 million was generated in the Government and Community Services sector. This sector is made up of government spending in the form of municipal activities, and community services in the form of education facilities and services. The reason for the large size of this sector in Makana is the aforementioned existence of several educational institutions that generate significant incomes for the local economy. This sector’s contribution increased by R136,166 million

Local Economic Development Strategy Makana Municipality
© 2009 Urban-Econ Eastern Cape: Development Economists +27 41 585 6640 [email protected]
42
from 45.1 to 51.5%. It can be seen that this sector contributes a much higher amount to the Makana economy than is seen on a district (33.2%) or provincial (28.9%) level. From Figure 4.4 it is clear that Government and community services dominate the Makana economy is terms of R‐GDP and employment contribution. Though they currently do not contribute sizeable amounts to the R‐GDP, construction and manufacturing grew faster than other sectors, albeit still at a slow pace. During that same period agriculture was declining. Three sectors (community services, trade and finance) make up approximately 82.4% of Makana’s output, and this is visually represented in Figure 4.4. A commonly used measure that indicates the level of concentration or diversification of the economy is the Tress index. The Tress index will allow the importance of the sectors shown in Figure 4.4 to be quantified, so as to show how mixed the range of activity in Makana is. A Tress index of 0 (zero) indicates a totally diversified economy, while a number closer to 100 indicates a high level of concentration in the economy. Makana’s Tress index for 2007 was 67.14, which shows a high level of concentration and confirms the dominance of the government sector revealed in Figure 4.4. Makana’s Tress index has gone up from its value in 1995 of 63.83, which indicates that the economy is becoming less diversified with time. 4.2.5 COMPARATIVE ADVANTAGE Comparative advantage refers to a local economy’s ability to produce a particular good or render a service at a lower opportunity cost and more efficiently than another local economy. The comparative advantage that a specific sector has in the economy may be measured through the calculation of a location quotient. The location quotient compares the relative contribution of a sector in the local economy, with the contribution of the sector to the regional economy. By interpretation, a location quotient of more than one (1) would indicate that the local economy enjoys a comparative advantage in that particular sector, and vice versa. A location quotient, as a tool, does not take into consideration external factors, such as government policies, investment incentives and proximity to markets etc., which can influence the comparative advantages of an area. The location quotient can be interpreted as follows:
• A Location Quotient greater than 5 is very high and suggests a high level of local dependence on this sector.
• If the location quotient is greater than 1.25, than that sector is serving the needs that extend beyond the boundaries of the local area. This sector is therefore likely to be ‘exporting’ goods and services.
• If the location quotient is between 0.75 and 1.25, the community is self‐sufficient in this sector. A Location Quotient of 1 occurs when local percentage employment is equal to provincial percentage employment.
• If the location quotient is less than 0.75, local needs are not being met by the sector and the municipality is ‘importing’ goods and services in that sector.

Local Economic Development Strategy Makana Municipality
© 2009 Urban-Econ Eastern Cape: Development Economists +27 41 585 6640 [email protected]
43
Table 4.3 presents the location quotients (LQ) of employment for each economic sector in the Makana municipality for 2001 and 2007. Table 4.3: Location Quotient Sector 2001 2007 Agriculture 1.80 1.73 Mining 0.84 1.03 Manufacturing 0.43 0.44 Utilities 0.74 0.74 Construction 0.92 1.02 Trade 0.86 0.81 Transport & communication 0.45 0.40 Finance and business services 0.69 0.74 Government 1.25 1.30 Based on the results presented in Table 4.3, it can be seen that: Makana has a strong comparative advantage in agriculture and government services. This is in line with its role as one of the larger small towns in the province.
• The area was historically strong in terms of agriculture, but is losing its advantage within the province.
• The municipality’s strength in government and community services is improving, as a result of the expansion of education facilities found in Grahamstown between 2001 and 2007
Compared to the provincial average, Makana performs poorly in terms of manufacturing, transport and communication, utilities and business services
• Because Grahamstown is a small town, there is a smaller emphasis on the provision of business services, utilities and transport and communication infrastructure
• Makana does not have a comparative advantage in manufacturing, as most major industry in the province is located in East London and Port Elizabeth. This means that per capita, less manufacturing activity takes place in Makana than in the rest of the Eastern Cape.
Other sectors registered median location quotients, which indicate that the municipality engages in those activities in an intensity similar to that of the province. 4.2.6 COMPARATIVE SECTORAL PERFORMANCE This section will analyse the performance of the economic sectors using several standards. These will be shown in Table 4.6. The analysis will examine the different economic sectors’ employment growth relative to the growth in the overall economy at the provincial level.
• The Provincial Sector Relative Growth ( Prov. SRG) indicates if a sector’s growth at the provincial level was higher or lower than the provincial growth overall.

Local Economic Development Strategy Makana Municipality
© 2009 Urban-Econ Eastern Cape: Development Economists +27 41 585 6640 [email protected]
44
• The Local Sector Relative Growth ( Local SRG) indicates if the selected sector’s growth at the local level was higher or lower than the provincial employment growth in the same sector.
For both of these indicators, the three possible values that may result are for a sector to be found to be leading, lagging or even with regards to its growth.
• The Carvalho Classification is a system of evaluating an economies performance, verbally, based on three indicators namely: employment specialization (location quotient), the industrial effect and regional/local effect from shift share analysis.
• The Industry Targeting Classification system is similar to the Carvalho model in that it is based on a combination of the LQ, PSRG and LSRG values and is expressed verbally not numerically. It however classifies sectors in terms of phrases so as to suggest what kind of growth prospects one could expect from that sector.
Table 4.4: Comparative Sectoral Performance Sector Prov.
SRG Local SRG
Carvalho Industry Targeting Classification
Agriculture Lagging Lagging Promising High Priority Retention Target Mining Leading Leading Accelerating Current Strengths Manufacturing Lagging Lagging Marginal Prospects Limited Overall Utilities Leading Lagging Yielding High Priority Retention Target Construction Leading Leading Yielding High Priority Retention Target Trade Leading Lagging Yielding High Priority Retention Target Transport & communication
Leading Lagging Modest Prospects Limited By Weak Base and Declining Competitiveness
Finance & business services
Leading Leading Modest Prospects Limited By Weak Base and Declining Competitiveness
Government Lagging Lagging Challenging Prospects Limited By External trends and Declining Competitiveness
From this analysis it emerges that Makana’s growth in employment lagged behind the provincial growth rates in several sectors, as shown through the result of the Local Sector Relative Growth. The only sector’s that employed labour at faster rate than the provincial average were mining (which is very small in the Eastern Cape) and finance and business services. Agriculture can be identified as a priority identification sector when using the industry targeting classification. This is because it employs a high number of people in the region, as seen by the fact that it has the highest location quotient of all the sectors. Another noteworthy high priority retention target sector is trade, which to some degree represents activities linked to tourism.

Local Economic Development Strategy Makana Municipality
© 2009 Urban-Econ Eastern Cape: Development Economists +27 41 585 6640 [email protected]
45
4.3 SECTOR PROFILES This section provides an overview of all the economic sectors in Makana, profiling the nature and extent of activity to be found as well as their defining traits. 4.3.1 AGRICULTURE The agricultural sector includes all activities related to growing of crops, gardening and horticulture, farming with animals, agricultural husbandry services, hunting, trapping and game propagation, forestry and logging, fishing and operation of fish hatcheries . In Makana the distinct types of activity to be found in this sector are:
• Commercial Agriculture • Emerging and Subsistence Agriculture • Hunting and Private Game Reserves
4.3.1.1 PERFORMANCE OF AGRICULTURE IN MAKANA The contribution of the agricultural sector to the total R‐GDP of the Makana area and the number of people employed in the sector from 1995 to 2007 are presented in Figures 4.5 and 4.6 respectively. Figure 4.5: Agricultural Output: 1995 to 2007 (R’000 at constant 2000 Prices)
(Source: Quantec, 2007)
Commercial agriculture is historically important in the Makana economy, having in the past made a significant contribution to employment and R‐GDP output. Commercial agriculture has however, been declining since 1995, with its contributions to employment having fallen from 20.7% to 12.3% in 2007. This is largely a result of liberalisation of agriculture in the post‐apartheid era, which resulted in a collapse of controlled marketing in the form of prices floors and subsidies. The value of output fell at an average rate of 0.02% per year between 1995 and 2007, from R75.5 million to R58.3 million.

Local Economic Development Strategy Makana Municipality
© 2009 Urban-Econ Eastern Cape: Development Economists +27 41 585 6640 [email protected]
46
Figure 4.6: Agricultural Employment 1995 to 2007
(Source: Quantec, 2007)
Between 1995 and 2007, the number of people employed in agriculture fell by 1537 jobs from 3277 to 1740. This is almost half the number of people that were employed in the sector in 1995, which underscores how severe the decline of agriculture in Makana has been. The collapse of agriculture has been cushioned by the growth of private game reserves in Makana which have reduced the otherwise significant decline. This has meant that the fall in employment, and increase in poverty in Makana from 1995 to 2007 has been less intense 4.3.1.2 COMMERCIAL AGRICULTURE Commercial agriculture focuses on stock farming to the north of Grahamstown and mixed farming to the South of Grahamstown. This is a reflection of the different climatic conditions experienced and varying patterns of farm size between the northern and southern parts of Makana. The area to the north of Grahamstown is known as Upper Albany, and accounts for approximately two thirds of the municipality. As was revealed in the environmental profile, Albany North receives mean annual precipitation of less than 400mm, which makes it unsuitable for crop farming except under irrigation. Livestock and game farming thus dominate in Upper Albany. Lower Albany receives mean annual precipitation of over 600mm, which makes the land well suited to rain‐fed cropping (Agriculture in Makana, 2008). Stock farming is concentrated in Cattle (for beef), Goats (for meat and mohair), Horses (for stud breeding), Sheep (for wool) and rearing of Ostriches (for meat, hides and feathers). Farmers target local and regional markets in Grahamstown, East London and Port Elizabeth, depending on the specific form of Livestock, and the prevailing market conditions. Marketing channels used include local and regional abattoirs, brokers, agents and local produce markets and fairs. Average livestock farm sizes are between 1 000 and 3 000 hectares.
Local Economic Development Strategy Makana Municipality
© 2009 Urban-Econ Eastern Cape: Development Economists +27 41 585 6640 [email protected]
47
Mixed farming concentrates on livestock and crop products such as Pineapples, Olives, Pepperdews and Chicory. Makana agriculture focuses on these crop products because growing traditional crops such as Maize and cotton are no longer recognised as profitable in the area, due to the rainfall patterns and other climatic variables, and market conditions. The rain shadow that runs to the north of Grahamstown reduces the scope of land that can be used for crop farming. In addition to this, the water quality in areas such as Salem and Fort Brown is not conducive for growing most crops, due to its salinity and tendency to oxidise. Irrigation is undertaken on some farms, so as to supplement the low rainfall. The average size of mixed farms is between 100‐500 hectares, as these need less land for livestock grazing. The main source of income for commercial farmers (78%) is from livestock farming and animal products. This is largely made up of dairy farming (41%). With regards to field crops, the majority of income comes from maize and chicory (a combined contribution of 74%). Most value addition of commercial agricultural produce (packaging, canning, manufacturing, processing, etc) occurs outside the Makana Municipality. There is however, some value addition that takes place, which will be discussed in the manufacturing sector profile. (Agriculture in Makana, 2008). In the Census of Commercial Agriculture conducted in 2002 it was reported that there were 165 commercial farms in the Makana area. Between 2002 and 2009 that figure has probably reduced as a result of some farms being converted to game reserves and others lying fallow. Commercial agriculture in Makana is organised around several geographically based farmers associations, which are all syndicated into the Albany‐Bathurst Farmers League. Other farmers associations in the area include:
• Eastern Border Farmers’ Association • Belton‐Salem Farmers’ Association • Carlisle Bridge Farmers Association • Bathurst West Farmers Association • Koenaap Farmers Association (Agriculture in Makana, 2008).
Challenges Faced by Commercial Farmers in Makana include:
• Water shortages, and inadequate infrastructure (irrigation, boreholes etc) to mitigate resultant effects.
• Problem animals that are introduced through Private Game Reserves. These kill livestock and introduce diseases to the area
• Crime in the form of stock theft (Agriculture in Makana, 2008).
4.3.1.3 EMERGING AND SUBSISTENCE AGRICULTURE Emerging and subsistence agriculture in Makana follows patterns found throughout most of the Eastern Cape.

Local Economic Development Strategy Makana Municipality
© 2009 Urban-Econ Eastern Cape: Development Economists +27 41 585 6640 [email protected]
48
Emerging farmers in Makana are PDIs that are engaging in agriculture of a commercial orientation, often on farms that were previously farmed by commercial farmers. Emerging farmers typically operate on plots of land that are less than 20ha in size which are often in the form of commonages leased out from the Makana Municipality or the Department of Agriculture. Group and cooperative activity dominates as the most common form of organisation due to limited resources (such as land and equipment) and skills. Emerging farmers are principally involved in the rearing of livestock, piggeries and poultry. Subsistence agriculture in Makana is made up of people residing in villages and townships that use agriculture as a means to supplement their food and income requirements. This form of agriculture is impeded by the availability of arable and grazing land, which reduces the potential for increased maize and livestock production going into the future. Because Makana is a largely urbanised area (with most settlements being in townships rather than rural villages) subsistence agriculture is not spatially spread out, which further diminishes the availability of land. Emerging and small scale farmers are organised under the Makana Farmers Association and the Grahamstown Stockowners Association, which have a combined membership of approximately 100 farmers. Some of the challenges they face include:
• Lack of skills, training and education • Inadequate land, which leads to problems such as stray animals, theft, land
degradation, etc. • Insufficient support from the Department of Agriculture in the form of mentorship,
extension officers, dipping facilities etc. • Low profit margins because of low market prices and small scope of operations • Inadequate working capital for day‐today operations (chemicals, seed, fuel, etc) • Access to markets
(Makana Farmers Association, 2009) 4.3.1.4 HUNTING AND PRIVATE GAME RESERVES The third distinct type of activity found in Makana’s agricultural sector is hunting and private game reserves. This is a form of activity that has grown immensely in Makana from 1995 in terms of market players, hectarage covered and revenue. Though now somewhat saturated, the market for Private game reserves and Hunting is now a notable contributor to agricultural sector output in Makana. Game reserves are mainly made up of land that was traditionally previously used as farms, but has been integrated and agglomerated into a larger entity. Private game reserves target international tourists that have high purchasing power during peak seasons as their main customers, and local tourist during low seasons. Not all the income generated by Game reserves and hunting activity is reflected under the agricultural sector, as their activities also fall under the SIC classification of Trade. The scope of activity that fall under the agricultural classification includes revenues directly sourced from:
• Rearing of animals
Local Economic Development Strategy Makana Municipality
© 2009 Urban-Econ Eastern Cape: Development Economists +27 41 585 6640 [email protected]
49
• Game propagation • Hunting and trapping
The transformation of land from pastoral farming to use as hunting and game reserves has yielded mixed fortunes throughout the Makana area. Average employee wages on game reserves and hunting operations are typically higher than those on traditional farms. However, these operations are often less labour intensive than traditional agriculture and thus employ fewer people than farms. This means that total community welfare and income (as expressed through wages earned and other benefits such as rations, housing subsidies, etc.) may not necessarily rise in every instance in which farmland has been converted into a hunting and game reserve (Whisson, 2009). 4.3.1.5 WHAT THIS MEANS FOR LED Agriculture has traditionally been significant in the development of Makana, because of the historic importance of commercial agriculture, and its ability to provide for community livelihoods. However, given the demise of traditional agriculture, Local Economic Development in Makana through agriculture will only be achievable through a change in the mindset of farmers. The success of changing orientations is seen in the growth of private game reserves and the emergence of niche operations that focus on products such as pepperdews and ostriches. Opportunities such as bee‐keeping, tunnel farming and aquaponics will need to be explored as mainstream activities such as sheep farming are no longer within the range of profitable agriculture in Makana. 4.3.2 MINING This sector includes the extraction and beneficiation of minerals occurring naturally through underground and surface mines, quarries and all supplemental activities for dressing and beneficiating for ores and other crude materials. 4.3.2.1 PERFORMANCE OF MINING IN MAKANA Based on the above definition, mining in Makana takes the form of surface mining of Kaolin and sand quarrying. As was revealed in section 4.2 of this chapter, mining makes the smallest contribution of all the sectors in Makana. Figure 4.7 shows the performance of the mining sector, in terms of the value of its output from 1995 to 2007. The value of mining output fell from R9.51m to R4.65m in 2007, having peaked in 1998.

Local Economic Development Strategy Makana Municipality
© 2009 Urban-Econ Eastern Cape: Development Economists +27 41 585 6640 [email protected]
50
Figure 4.7: Mining Output from 1995 to 2007 (R’000 at constant 2000 Prices)
(Source: Quantec, 2007)
With regards to employment, between 1995 and 2007 the number of people employed in the Makana mining sector has gone up from 66 to 78. Although increasing, this represents only 0.6% of all the people employed in Makana. As employment grew by a marginal amount from 1995 to 2007, the value of Makana’s mining output fell by 51%. From this it emerges that mining makes a negligible contribution to the Makana economy in terms of both employment and R‐GDP. 4.3.2.2 AVAILABILITY OF RESOURCES AND THEIR ECONOMIC LINKAGES The geological profile of Makana indicates that the main resource that is available for extraction is Kaolin. Kaolin is a clay mineral that is used in the production of ceramics, bricks, tiles, paper, paints, pharmaceuticals and industrial minerals. Grahamstown boasts large untapped and underutilised deposits of Kaolin, but much of these reserves are of a low quality grade. Kaolin from Makana accounts for about 25% of national production, which shows how substantial and economically important its kaolin reserves are. Makana has approximately 100m tonnes of kaolin reserves, which is enough to supply the national market for over a hundred years based on current demand. (Mining in Makana, 2007). Apart from mining of Kaolin, rock aggregates are extracted from quarries and borrow pits. The material extracted from these excavations is used as sand, gravel, crushed stones and crushed aggregates that are used in road and general construction. (Mining in Makana, 2007) 4.3.2.3 MARKET AND TECHNOLOGY TRENDS Nationally, the kaolin industry was worth R118 million in 2005, with production having peaked in the mid 1990s. Since then demand for South African Kaolin has declined, which has led to the fall in production and thus the value of output as reflected in Figure 4.7. The
Local Economic Development Strategy Makana Municipality
© 2009 Urban-Econ Eastern Cape: Development Economists +27 41 585 6640 [email protected]
51
falling demand is a result of the creation of synthetic substitutes, and competition from suppliers such as China. Within South Africa, demand for Kaolin from the Makana region has further shrunk as the result of competition from deposits found in the Western Cape that are of a superior quality and are closer to the market (Mining in Makana, 2007). This has meant that several mines have closed down since 1995, which further explains the fall in the value of mining output shown in Figure 4.7. The bulk of all mining activity is undertaken by East Cape Quarries at Mayfield Mine, GW Base at Strowan Mine and Makana Brick at Beaconsfield Mine. Quarrying is undertaken throughout the region, with the larger operations being run at Kingston Sand Mine, Glen Craig Quarry and Keeton Sand Mine. Emerging PDI small scale miners that wish to pursue interests in the kaolin value chain form an interest group in the Makana mining sector. The material does not need to be processed before delivery so it is loaded onto transportation trucks as soon as it is excavated. This means that mining operations in Makana do not employ high numbers of people, the implication being that technology and labour inputs are low. This means that as much as there is a large pool of labour available, its services are not required. Kaolin that is mined in Makana is beneficiated outside the municipality (mainly in Gauteng and the Western Cape). This further reduces the scope for employment creation through value‐adding activities subsequent to the extraction of Kaolin. 4.3.2.4 WHAT THIS MEANS FOR LED As much as Makana possesses large reserves of Kaolin, this does not directly translate into significant potential for economic growth and development. Due to extrinsic matters (locality of Makana in relation to major industrial hubs, market factors, waning global demand, etc) the scope for an expansion of mining activity or even that of improved sectoral linkage is very limited. 4.3.3 MANUFACTURING This sector is broadly defined as the physical or chemical transformation of materials or compounds into new products and can be classified into 10 sub‐groups namely: 1. Food, beverages and tobacco 2. Textiles, clothing and leather goods 3. Wood and paper; publishing and printing 4. Petroleum products, chemicals, rubber and plastic 5. Other non‐metal mineral products 6. Metals, metal products, machinery and equipment 7. Electrical machinery and apparatus 8. Radio, TV, instruments, watches and clocks 9. Transport equipment 10. Furniture and other manufacturing

Local Economic Development Strategy Makana Municipality
© 2009 Urban-Econ Eastern Cape: Development Economists +27 41 585 6640 [email protected]
52
The Manufacturing sector is thus the sector where natural resources and other intermediate goods are converted through value adding processes into final products for the Trade sector. 4.3.3.1 PERFORMANCE OF THE MANUFACTURING SECTOR The size of the manufacturing sector in an economy is often taken as representative of its state of development. Makana has a small manufacturing sector, which contributed towards 7.1% of the regional R‐GDP and 6.5% of formal employment. As shown in Figure 4.8, the value of Makana’s manufacturing output increased from 79,958m in 1995 to 93,950m in 2007. This represents an average year on year growth rate of 1.45%. A small increase in the value of Makana’s manufacturing output occurred while the number of people employed in the sector fell from 1325 in 1995 to 922 in 2007. This is shown in Figure 4.9. This represents an average year on year decline of 2.5% in manufacturing employment levels. The fall in employment may be attributed to the effects of unionisation experienced in South Africa in the period just after 1995. Figure 4.8: Manufacturing Output from 1995 to 2007 (R’000 at constant 2000 Prices)
(Source: Quantec, 2007)
Figure 4.9: Manufacturing employment
(Source: Quantec, 2007)

Local Economic Development Strategy Makana Municipality
© 2009 Urban-Econ Eastern Cape: Development Economists +27 41 585 6640 [email protected]
53
Another contributing cause for the fall in employment would be the decline in output associated with the manufacture of food and beverage products. The value of products in the food and beverages subsector fell from approximately R14.1m in 1995 to R9.2m in 2007, as a result of the general decline in agricultural activity that the Makana area experienced Figure 4.10 breaks down the manufacturing sector’s output into its constituent activities, as previously listed. Figure 4.10 also shows changes in the composition of the manufacturing sector from 1995to 2007. The largest contributor to manufacturing in Makana is in the form of Makana Brick and Tile, which falls under the manufacture of petroleum products, chemicals, rubber and plastic. This constitutes 24% of the total value of Makana’s manufacturing output. The contribution of the Textiles, clothing and leather goods subsector went up from 11% in 1995 to 18% in 2007 as the value of its output more than doubled. This may be attributed to specialist operations such as the Phillipe leather tannery and Mohair processors and manufacturers such as Jan Paul Barnard. Figure 4.10: Contributors to Makana Manufacturing Output
(Source: Quantec, 2007)
An interesting observation is that while the value of this subsector’s output increased from 1995 to 2007, employment within this subsector actually fell. This may mark a departure from labour intensive activity towards high‐value added production. Between 1995 and 2007 the contribution of the Food, beverages and tobaccos subsector, which is generally labour intensive fell from 17% to 10%. This can be seen as a result of the decline in agriculture experienced over the same period. The fall in this subsector’s output

Local Economic Development Strategy Makana Municipality
© 2009 Urban-Econ Eastern Cape: Development Economists +27 41 585 6640 [email protected]
54
contributed significantly to the overall fall in manufacturing employment in Makana. This would have seen the amount of dairy processing and other such activities go down. 4.3.3.2 AVAILABILITY OF RESOURCES AND THEIR ECONOMIC LINKAGES Manufacturing is traditionally dependent on the primary activity that occurs within a locality and its immediate vicinity. This normally means drawing on raw materials such as mining agricultural and agricultural produce as input in the manufacturing process. However, with agriculture and mining making a combined contribution of less than 5% towards the Makana economy, there is little scope for resource based local value addition. This is underscored by the fact that agriculture has been on the decline in Makana since 1995, and that processing of Kaolin (the primary output of mining in Makana) occurs outside the Makana area. Manufacturing in Makana is based on its latent and historical strengths, which promotes economic linkages. This can be seen through examples such as:
• Makana Brick and Tile which has linkages with mining and construction • Processing of Pepperdews, mohair and ostrich meat, that is based on agricultural
activity • The Makana Meadery, that takes advantage of the presence of Rhodes University
(Government services) • Small scale manufacturing such as bakeries (e.g. Oatlands Bakery), furniture
manufacturers (e.g. Pine Craft Manufacturers) and mechanics and vehicle repair shops (e.g. Makana engineering) that are typically found to exist in small towns such as Grahamstown
4.3.3.3 MARKET AND TECHNOLOGY TRENDS The most dominant firm in Makana manufacturing is Makana Brick and tile, which employs approximately 200 people and is the third largest employer in the area after Rhodes University and the Makana municipality (Makana Brick, 2009). It recently increased its production capacity, which limits scope for future expansion. Despite this, it serves the immediate local market (Grahamstown) as well as a large proportion of the entire Eastern Cape Province. Other manufacturing operations in Makana are significantly smaller and thus employ fewer people. These operations service niche markets, which limits scope for further future expansion. Improved marketing of niche products such as Ostrich leather could improve the prospects of the local manufacturing sector, both locally and globally. The geographical distances from suppliers and to final markets make the local manufacturing operations sensitive to changes in market conditions. These could include fuel price changes, given the high use road freight. Reliance on road freight is set to increase in the future as a result of recent and planned changes in operations of rail linkages to and from the Makana area. This acts as a deterrent against the establishment of large manufacturing enterprise in the locality. This coupled with the dominance of East London

Local Economic Development Strategy Makana Municipality
© 2009 Urban-Econ Eastern Cape: Development Economists +27 41 585 6640 [email protected]
55
and Port Elizabeth as industrial powerhouses in the Eastern Cape and Grahamstown’s spatial location mean there is limited room for growth of Makana’s manufacturing sector. 4.3.3.4 What this means for LED Manufacturing in Makana is described under the Industry Targeting Classification in Table 4.4 as having ‘limited prospects overall’ and under the Carvalho classification as making a ‘marginal’ contribution to the municipality’s economy. Despite this forecast, there is scope for specialist/niche manufacturing activity such as deboning of ostrich meat. As a result of Makana’s industrial profile, such operations will not typically employ large amounts of labour. They can however, generate much needed income into the area and will often have linkages with other economic sectors. 4.3.4 CONSTRUCTION The construction sector includes activities related to site preparation, construction of buildings, building installations, building completion and the renting of construction equipment. The range of activity contained within the construction sector thus includes shop fitting, plumbing, electrical contracting, painting and decoration. 4.3.4.1 PERFORMANCE OF THE CONSTRUCTION SECTOR The performance of the Makana construction sector is shown in Figure 4.11. It must be noted that the construction sector has a ‘derived productivity’. This means that it depends on the amount of development taking place. For example, an Agro‐processing Hub will require the necessary infrastructure, stimulating the Construction sector, in turn, a need for a residential area close to the hub may be necessary, also stimulating the Construction sector. The performance of the construction sector can thus be taken to be an indicator of the general amount of developmental activity taking place within an economy

Local Economic Development Strategy Makana Municipality
© 2009 Urban-Econ Eastern Cape: Development Economists +27 41 585 6640 [email protected]
56
Figure 4.11: Construction Output from 1995 to 2007 (R’000 at constant 2000 Prices)
(Source: Quantec, 2007)
The total value of output of the construction sector rose from R 21,95m in 1995 to R 27,72m in 2007. This represents a year on year average growth rate of 2.16%. The construction sector thus grew at a moderate rate, albeit from a small base. Despite the economic downturn experienced from 2007 onwards, it is expected that construction activity will not significantly decline as Rhodes university still plans to increase its size. Table 4.5 shows employment trends in Makana’s construction sector. It can be seen that employment changes mirrored output changes. It must be noted that the statistics provided only reflect official form employment, and do not reveal the full extent of informal employment in the construction industry. This means that they may not reflect the output and employment of a home‐owner modifying their house into a Bed and Breakfast, and other such activity. Table 4.12: Construction Employment
(Source: Quantec, 2007)
Local Economic Development Strategy Makana Municipality
© 2009 Urban-Econ Eastern Cape: Development Economists +27 41 585 6640 [email protected]
57
4.3.4.2 AVAILABILITY OF RESOURCES AND THEIR ECONOMIC LINKAGES Labour and physical inputs are the main resources needed in the construction sector. There is a significant shortage of skilled labour in Makana that can be used for construction services. Scarce skills in the construction sector include but are not limited to:
• Management skills, more specifically project management skills are required to effectively operate and manage the business as a contractor
• Linked to management skills but crucial to the survival of any business is financial management skills
• Technical skills such as bricklaying, plumbing, electrical wiring etc. This means that there are a few large and accredited building contractors in Makana that are able to undertake large, high value projects. Such contractors are typically associated with the Master Builder’s Association. Large construction sector organisations in the Makana area include CM Heunis Building contractors and Strydom and Kroqwana Construction. In order to remain accredited, they often have to bring in skilled and certified labourers from outside the Makana area, which represents an income and employment leakage out of the Makana area. A leakage in this context refers to a flow of resources out of the local economy. Building contractors are thus often brought in from outside the Makana area in order to oversee building projects. The contractors who are from outside the LM do however provide jobs for the locals but often bring in their own labour, and for this reason local job creation is not as high as it could be in the construction sector. In addition to this, limited institutional support for apprenticeship, mentorships and other forms of training propagate continued leakage of incomes from the area. There are several emerging building contractors located within the Makana region. However, they are often plagued with a lack of experienced and skilled staff, which limits their growth. Other problems faced by emerging contractors include project management capacity constraints that ultimately affect project completion and quality. As a result of no accreditation, emerging contractors are often bypassed when it comes to opportunities to tender for high value construction projects such as government funded infrastructure provision. This then reinforces a cycle in which emerging contractors remain too small, inexperienced and undercapitalised to grow their businesses. (Lisa Trading, 2009) Physical inputs are widely available throughout the Makana area, as there are a wide range of suppliers or equipment, tools, machinery, etc. though falling under the Trade sector; these include large (MBA associated) organisations such as Pennypinchers, PG Glass and D&A Timbers. Small emerging businesses such as Grahamstown Block and Quarry also contribute. 4.3.4.3 MARKET AND TECHNOLOGY TRENDS The construction sector’s growth over the period from 1995 to 2007 was largely driven by
Local Economic Development Strategy Makana Municipality
© 2009 Urban-Econ Eastern Cape: Development Economists +27 41 585 6640 [email protected]
58
demand directly emanating from Rhodes University, and secondary activities linked to the Rhodes University’s expansion. There increased was demand for construction services from Rhodes University as is expanded its residential offerings and increased the number of its lecture halls and allied facilities. Related to this, as Rhodes University expanded its enrolment from 1995 to 2007, there was demand for residential housing space to cater to its increased student and staff numbers. This combined with an already existing shortage of housing in Grahamstown (across all income bands) to have the effect of pushing up property prices. Housing prices are pushed up by a high demand for student accommodation and a low supply of such accommodation. This created an investor’s market in which non‐locals sought to buy property in Grahamstown, while local residents were not willing to sell their property. As a result of the increased revenues resulting from the expansion of Rhodes University, there was also a marked increase in demand for commercial office space in Grahamstown. As an offshoot of this, property development has emerged in Makana as a new trend in the construction industry where contractors and business people purchase property and develop it for resale. In a pattern similar to other localities in the Eastern Cape, government funded projects such as the construction of RDP houses and infrastructure projects also play an important role in driving growth in the construction sector. This means that many opportunities in the construction industry emerge as a result of construction projects being released to tender by municipality so that companies in the private sector may be able to participate. One challenge that is faced in the construction sector is the low pace at which skills transfer from large established companies to emerging contractors is taking place in Makana. (Lisa Trading, 2009) Other driving forces in the Makana construction sector during this period would have been from farms being converted into Private Game Reserves. Demand for industrial allotments was largely stagnant during this period, as most of the industrial space in Makana is largely underutilised at present. 4.3.4.4 What this means for LED There is a general lack of construction skills in the area that must be addressed in order for the construction industry in the area to exploit opportunities. This skills constraint affects emerging contractors the most as it leads to the continued marginalisation and underdevelopment. The skills shortage also means that income and employment often results in leakages outside of the Makana Municipality. 4.3.5 TRADE The trade sector is defined as the resale (sale without transformation) of new and used goods to the general public for personal or household consumption or use by shops, department stores, stalls, hawkers etc.
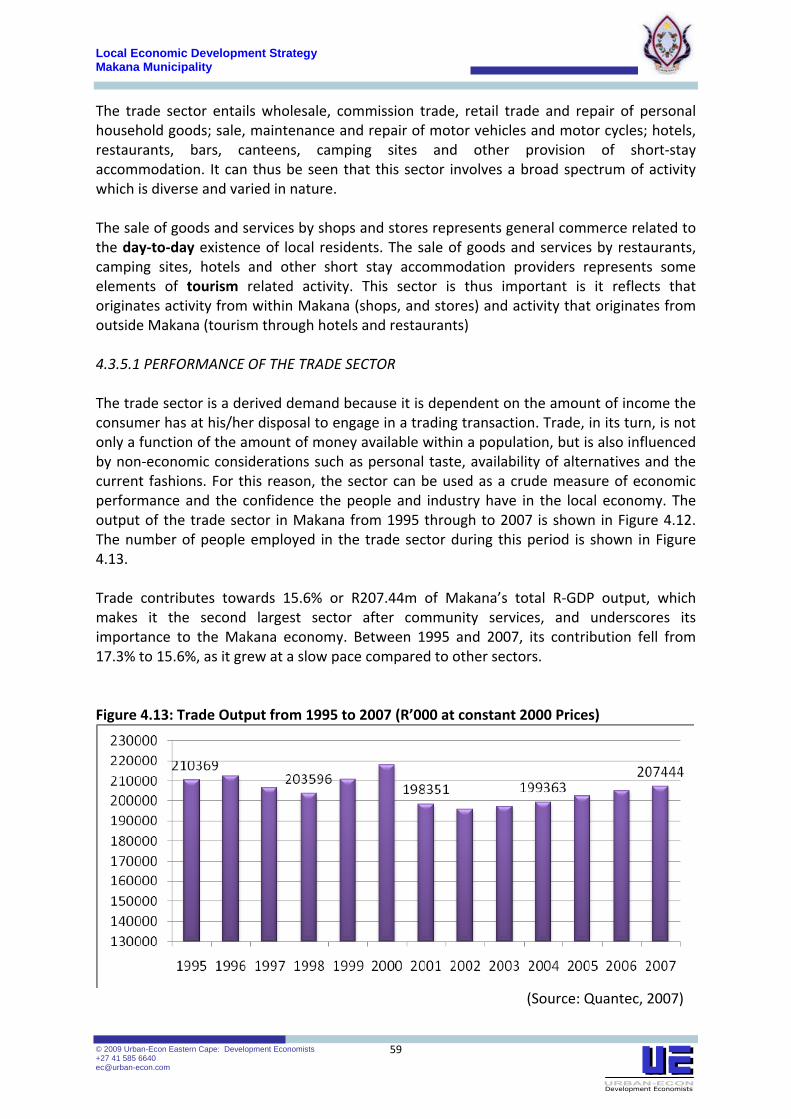
Local Economic Development Strategy Makana Municipality
© 2009 Urban-Econ Eastern Cape: Development Economists +27 41 585 6640 [email protected]
59
The trade sector entails wholesale, commission trade, retail trade and repair of personal household goods; sale, maintenance and repair of motor vehicles and motor cycles; hotels, restaurants, bars, canteens, camping sites and other provision of short‐stay accommodation. It can thus be seen that this sector involves a broad spectrum of activity which is diverse and varied in nature. The sale of goods and services by shops and stores represents general commerce related to the day‐to‐day existence of local residents. The sale of goods and services by restaurants, camping sites, hotels and other short stay accommodation providers represents some elements of tourism related activity. This sector is thus important is it reflects that originates activity from within Makana (shops, and stores) and activity that originates from outside Makana (tourism through hotels and restaurants) 4.3.5.1 PERFORMANCE OF THE TRADE SECTOR The trade sector is a derived demand because it is dependent on the amount of income the consumer has at his/her disposal to engage in a trading transaction. Trade, in its turn, is not only a function of the amount of money available within a population, but is also influenced by non‐economic considerations such as personal taste, availability of alternatives and the current fashions. For this reason, the sector can be used as a crude measure of economic performance and the confidence the people and industry have in the local economy. The output of the trade sector in Makana from 1995 through to 2007 is shown in Figure 4.12. The number of people employed in the trade sector during this period is shown in Figure 4.13. Trade contributes towards 15.6% or R207.44m of Makana’s total R‐GDP output, which makes it the second largest sector after community services, and underscores its importance to the Makana economy. Between 1995 and 2007, its contribution fell from 17.3% to 15.6%, as it grew at a slow pace compared to other sectors. Figure 4.13: Trade Output from 1995 to 2007 (R’000 at constant 2000 Prices)
(Source: Quantec, 2007)

Local Economic Development Strategy Makana Municipality
© 2009 Urban-Econ Eastern Cape: Development Economists +27 41 585 6640 [email protected]
60
Figure 4.14: Trade Employment
(Source: Quantec, 2007)
The trade sector is also the second largest sector in terms of employment contribution, generating jobs for 13% of Makana’s workforce. It is worth mentioning that as the growth of Trade output went up and down, employment generally followed an upward trend. This may indicate a high level of job retention and labour absorption in the trade sector. Furthermore, the trade sectors of economy tend to make large contributions toward informal employment creation. The actual employment levels for the trade sector are thus higher than official statistics may indicate which further underscores the importance of this sector. The value of trade output experienced mild fluctuations between 1995 and 2007, in a pattern representative of national and global economic business cycles. These fluctuations would have arisen as changing economic situations and outlooks prompt modifications in consumer spending levels. The extent of the fluctuations can be seen in how the change in output between its peak in 2000 and its trough in 2002 was a decline of 10.2%. A fall in the value of this sector’s output, and its contribution to the Makana economy’s total R‐GDP is expected as the effects of the global downturn in economic activity fully filter through. Despite changes in consumption levels, consumption patterns remained largely the same in Makana between 1995 and 2007. This can be seen in Figure 4.15 which shows income allocation by consumers between different classifications of goods.

Local Economic Development Strategy Makana Municipality
© 2009 Urban-Econ Eastern Cape: Development Economists +27 41 585 6640 [email protected]
61
Figure 4.15: Income allocation by Makana Residents
(Source: Quantec, 2007)
4.3.5.2 THE NATURE OF TRADE IN MAKANA There are several national chains and franchises located in Grahamstown, including Pick n Pay, Shoprite, Edgars and Pep Stores. There are two main shopping centres – the 6 876m2 Peppergrove Mall which targets the middle to high income band and the 6 130 m2 Market Square Mall which targets the lower to middle income band. In addition to these, there is a variety of shops in the Grahamstown town centre (mainly in High street, Beaufort Street and Hill Street), and several informal spaza traders located in the townships.(Mallguide, 2009) Despite the wide array of options (in comparison to other similarly sized towns), there is a significant amount of expenditure leakage to other towns such as Port Elizabeth for goods such as speciality products, luxury items, electronic equipment and clothing. This is a result of Makana’s demographic profile, which is made up of young, upwardly mobile consumers that seek variety. High income earners thus often travel outside the Makana locality to buy goods and services. (Ranchhod, 2009) As a result of the relatively small population in Makana, there is little wholesale activity, as demand levels are insufficient to reach the necessary critical mass. In the tourism trade there are several restaurants (including take‐away, convenience food and fast food outlets) short term accommodation facilities (including hotels, guest houses and camp sites) in Grahamstown. These will be expanded upon in the tourism sector profile. It must be noted that these serve both tourism demand, and demand from local residents as well. Facilities situated in the township (such as homestays and taverns) are underprovided, when consideration of the actual size and population of the townships in Makana is made. In the other areas in Makana (Riebeek East and Alicedale), owner managed enterprise dominates the trade sector. This applies to both the retail and tourism sides of the trade sector. This is because it is not profitable for large businesses to establish themselves in these areas due to their small populations and low income levels. The smaller settlements in

Local Economic Development Strategy Makana Municipality
© 2009 Urban-Econ Eastern Cape: Development Economists +27 41 585 6640 [email protected]
62
Makana are thus dominated by general dealers, liquor stores and mini‐markets that serve the needs of local resident. 4.3.5.3 MARKET TRENDS The trade sector in Makana experiences some level of seasonality in that business activity tends to peak in relation to educational calendars (Rhodes University O‐Week, Independent schools’ balloon week, etc) and major tourism events (Grahamstown Arts Festival, Science Festival, etc.). this however, is mitigated by the presence of smaller tourism events, and the existence of some consumer markets that are not directly derived from the presence of Rhodes university. The retail aspect of trade has been largely stagnant with slow growth defining the market. However, there are sentiments that opportunities within the trade sector are not fully exploited which could signal potential future growth. Such opportunities exist in the townships, where low‐income clients that are mostly dependent on government social grants are underserviced. (Ranchhod, 2009) With regards to accommodation for tourism, growth in the establishment of Bed and breakfast has also slowed, as the market has approached saturation. It is envisioned that the effects of the global recession will impose a heavy impact on the future growth and profitability of these establishments. 4.3.5.4 WHAT THIS MEANS FOR LED As the second largest sector in the Makana economy, its growth and performance has a significant impact on the overall development of the Makana economy. A threat that is inherent to the trade sector is its cyclical nature due to fluctuations in business cycles. Growth in the township and increased diversification may improve the overall performance of this sector. 4.3.6 TRANSPORT & COMMUNICATION Transport and communications as an economic sector refers to activities concerned with land transport, railway transport, water transport, transport via pipelines, air transport. It also includes the activities of travel agencies, post and telecommunications organisations, courier activities, as well as storage and warehousing activities. 4.3.6.1 Performance of the transport sector The performance of the transport and communications sector is presented in Figure 4.16. Related employment statistics are then presented in Figure 4.17. It can be seen that the output of this sector was largely static, declining by a small amount from R40,49m in 1995 to R38,45m in 2007. Makana has a small transport sector, as it contributed towards only 2,9% of Makana’s total R‐GDP. This is however, in line with other economies in the Eastern Cape
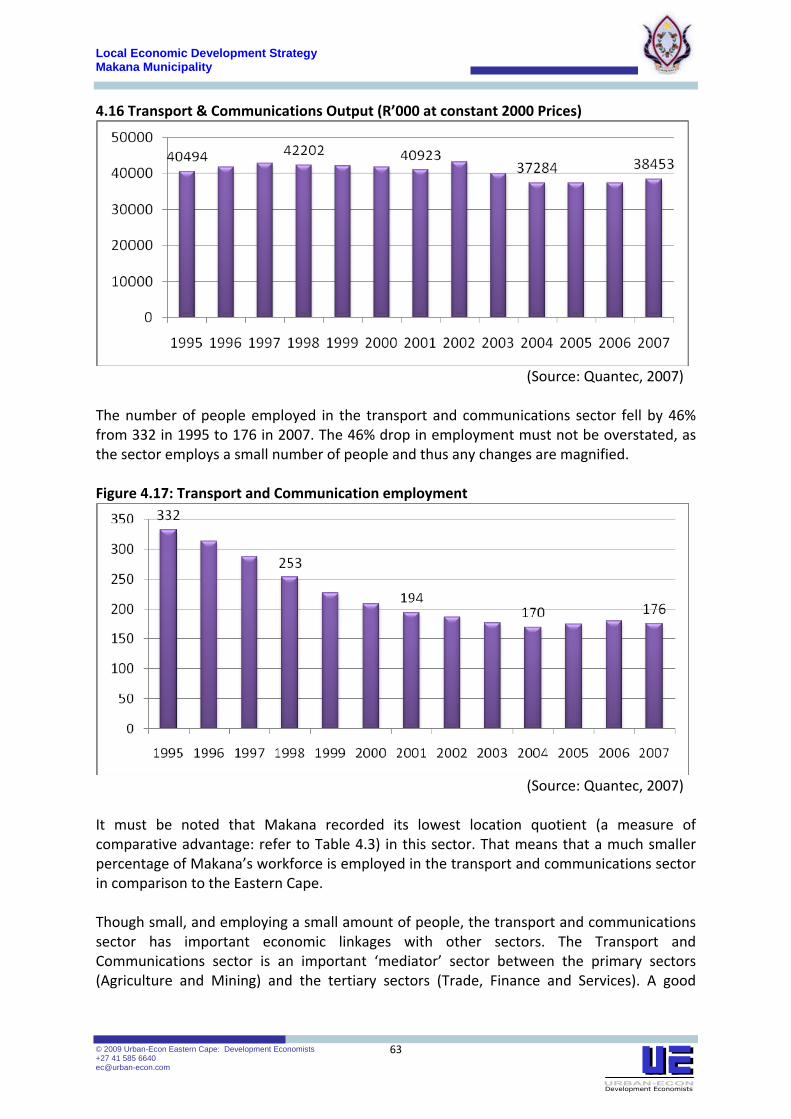
Local Economic Development Strategy Makana Municipality
© 2009 Urban-Econ Eastern Cape: Development Economists +27 41 585 6640 [email protected]
63
4.16 Transport & Communications Output (R’000 at constant 2000 Prices)
(Source: Quantec, 2007)
The number of people employed in the transport and communications sector fell by 46% from 332 in 1995 to 176 in 2007. The 46% drop in employment must not be overstated, as the sector employs a small number of people and thus any changes are magnified. Figure 4.17: Transport and Communication employment
(Source: Quantec, 2007)
It must be noted that Makana recorded its lowest location quotient (a measure of comparative advantage: refer to Table 4.3) in this sector. That means that a much smaller percentage of Makana’s workforce is employed in the transport and communications sector in comparison to the Eastern Cape.
Though small, and employing a small amount of people, the transport and communications sector has important economic linkages with other sectors. The Transport and Communications sector is an important ‘mediator’ sector between the primary sectors (Agriculture and Mining) and the tertiary sectors (Trade, Finance and Services). A good

Local Economic Development Strategy Makana Municipality
© 2009 Urban-Econ Eastern Cape: Development Economists +27 41 585 6640 [email protected]
64
Information and Communication Technology (ICT) enables businesses to access markets across time and space. 4.3.6.2 THE NATURE OF TRANSPORT AND COMMUNICATIONS IN MAKANA In terms of transport services in Makana, there is no water transport, regularly scheduled air transport or transport by pipeline. Rail transport used to be important in the region, but has been significantly reduced in recent years. This then means that the bulk of transport services in the municipality may be classified under road transport. There are several operators of road transport within Makana that provide transport within the municipality, and to other regions as well. The following forms of transport activity are found within the Makana area:
• Bus and Coach passenger lines (such as Greyhound and Intercape) operate in the area, even though they do not have base offices in Makana.
• Mass Commuter transport (in the form of minibuses/ taxis, associated with Uncedo, the taxi organisation)
• Taxis services (such JCs shuttle service and Rhode Trip) • Flights from the Grahamstown airstrip for entertainment purposes (such as E.P.
skydiving and guests to game reserves such as Kwandwe) • Occasional sightseeing rail tours (such as the Alicedale adventure)
These activities are supported by enabling infrastructure and service including:
• Grahamstown’s proximity to the N2 highway and linkages with other major roads as shown in the infrastructure profile
• A taxi rank facility that serves a hub for transport within and outside Makana • Several petrol stations ( garages) that trade on local and transient demand • Travel agents (such as Sure‐go travel)
In terms of communications , Makana is relatively well linked. Postal services are provided by Postnet (Private) and The Post Office (Public). In addition to these, several courier companies such as speed services and UTI sun operate within the Makana area, as do several internet cafes. Rhodes University also has comprehensive information and communication technology (ICT) infrastructure. In fact, South Africa’s first internet link was based at Rhodes University in 1988. This led to the establishment of UNINET, which was a gateway that provided internet access for South African universities. In recognition of this, a Centre of Excellence in Distributed Media was established at Rhodes University in 1997, in association with Telkom SA and other partners. 4.3.6.3 MARKET TRENDS Figure 4.18 provides a break down the contributions of the two subsectors in this sector (Transport and communication). In 1995 the transport sector was worth R17,09m and

Local Economic Development Strategy Makana Municipality
© 2009 Urban-Econ Eastern Cape: Development Economists +27 41 585 6640 [email protected]
65
made a contribution of 42.21% to the sector. By 2007 those figures had gone down to an output of R9,19m and a contribution of 23%. On the other hand the output and contribution of the communications subsector went up from R23,39m at 57% in 1995 to R29,26m in 2007. The transport industry shrank in Makana as a result of challenges including fuel price hikes, poor linkages with tourism and the decline of rail transport. Another challenge facing the local transport industry is inadequate taxi and bus rank facilities with amenities such as toilets and shelter for commuters. Figure 4.18: Contributions of Transport and Communication to the sector
(Source: Quantec, 2007)
4.3.6.4 What this means for LED The transport sector in Makana has limited opportunities for growth, partly as a result of its small and stable population. The communications sector grew while the transport sector declined between 1995 and 2007. With linkages to the trade and service sectors, a growing communication sector can allow business growth and the establishment of a knowledge economy. 4.3.7 FINANCE AND BUSINESS SERVICES The finance and business services sector includes activities related to obtaining and redistributing funds, including for the purpose of insurance, real estate or commercial and business services. Some of the activities that fall under this sector include financial intermediation; insurance and pension funding; real estate activities; renting or transport equipment; computer and related activities; research and development; legal; accounting; bookkeeping and auditing activities; architectural, engineering and other technical activities; and business activities not classified elsewhere.
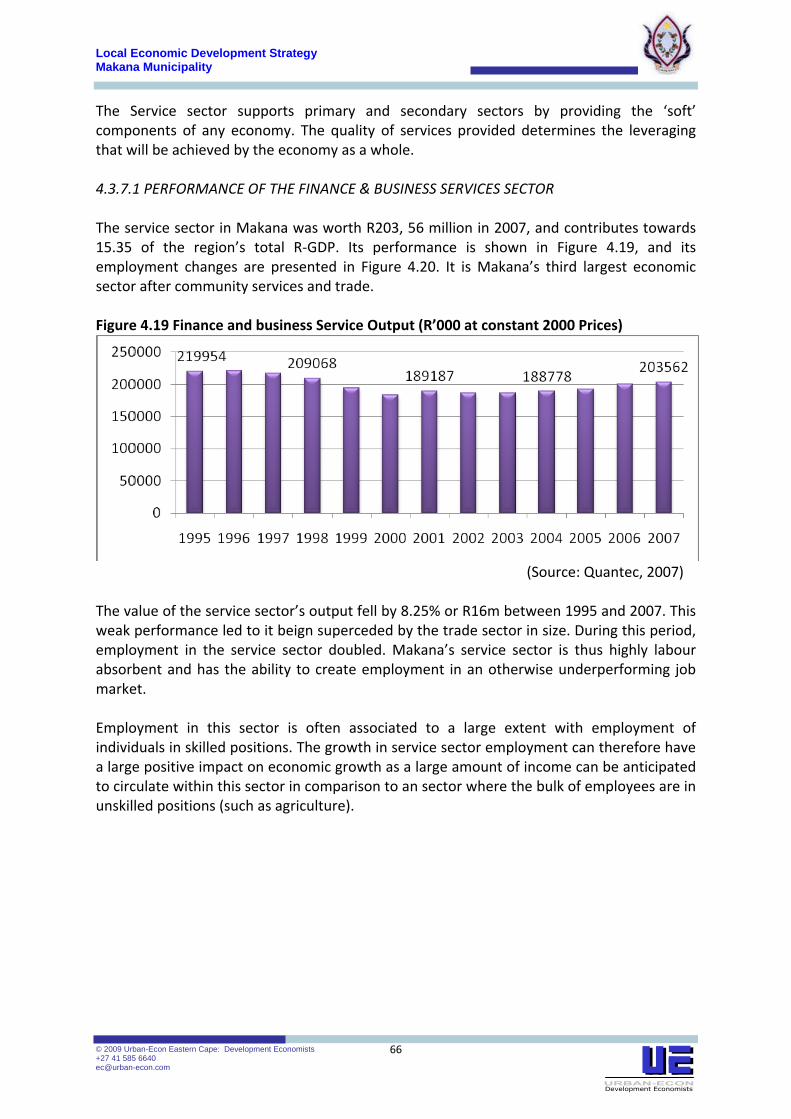
Local Economic Development Strategy Makana Municipality
© 2009 Urban-Econ Eastern Cape: Development Economists +27 41 585 6640 [email protected]
66
The Service sector supports primary and secondary sectors by providing the ‘soft’ components of any economy. The quality of services provided determines the leveraging that will be achieved by the economy as a whole. 4.3.7.1 PERFORMANCE OF THE FINANCE & BUSINESS SERVICES SECTOR The service sector in Makana was worth R203, 56 million in 2007, and contributes towards 15.35 of the region’s total R‐GDP. Its performance is shown in Figure 4.19, and its employment changes are presented in Figure 4.20. It is Makana’s third largest economic sector after community services and trade. Figure 4.19 Finance and business Service Output (R’000 at constant 2000 Prices)
(Source: Quantec, 2007)
The value of the service sector’s output fell by 8.25% or R16m between 1995 and 2007. This weak performance led to it beign superceded by the trade sector in size. During this period, employment in the service sector doubled. Makana’s service sector is thus highly labour absorbent and has the ability to create employment in an otherwise underperforming job market. Employment in this sector is often associated to a large extent with employment of individuals in skilled positions. The growth in service sector employment can therefore have a large positive impact on economic growth as a large amount of income can be anticipated to circulate within this sector in comparison to an sector where the bulk of employees are in unskilled positions (such as agriculture).

Local Economic Development Strategy Makana Municipality
© 2009 Urban-Econ Eastern Cape: Development Economists +27 41 585 6640 [email protected]
67
Figure 4.20: Finance and Business Service employment
(Source: Quantec, 2007)
Figure 4.21 breaks down the performance of the service sector into its two sub‐sectors: Business Services, and Finance and Insurance. It emerges that the poor performance of the services sector can be attributed to the business services subsector, the output of which declined from R183,5m in 1995 to R104,7m in 2007. During the same period, the output of the financial services subsector rose from R36,44m to R98,84m in 2007. The growth of financial services may be a result of increased incomes in Makana, both in the townships and as a result of Rhodes University’s expansion. Figure 4.21: Contributions of business services and finance and insurance of the sector
(Source: Quantec, 2007)
4.3.7.2 THE NATURE OF FINANCE & BUSINESS SERVICES IN MAKANA In terms of finance and insurance, all the major banks are found in Grahamstown (ABSA, FNB, Standard Bank, Nedbank, Capitec Bank, Old Mutual Bank and GBS Mutual Bank. These largely service the banking requirements of local businesses and farmers in the area. A range of mortgage providers, micro‐lenders and investment facilitators such as Wesbank and Louhen financial Services are also present. Insurance brokers such as Sanlam life

Local Economic Development Strategy Makana Municipality
© 2009 Urban-Econ Eastern Cape: Development Economists +27 41 585 6640 [email protected]
68
assurance, and McCallum Brokers also operate in the Makana area. These target personal financial services. A full range of business services are also available in Grahamstown These include accounting (Neill Pike), real estate agents (Pam Golding) , attorneys (Nettletons), IT services (Albany Computers), engineers (MBB consulting) and other forms of activity. It us apparent that a broad spectrum oaf activity in the business services sector is covered in Makana. It is prudent to point out that some of the business services located in Makana are directly linked to the existence of Rhodes University, and may not have been established in Makana if it were not for the presence of the university. These include:
• Hairy Fairy Flies (linked to ichthyology and the south African Institute of Biodiversity) • Birch’s (Robe making for university gowns) • CES (linked to Environmental Science department) • Grocott’s Mail (Department of Journalism) • Geodatec (Geography and Information Systems Departments) • NISC (Department of linguistics, Rhodes library, research office) • Private consultancies run by Rhodes university faculty members and alumni • The number of real estate agents is high compared to other towns of a similar size.
This is a result of the demand for accommodation that results from the student population studying at Rhodes University.
In a pattern that resembles the other sectors, provision of business and financial services is mainly centred in the Grahamstown area, with few businesses in other towns such as Salem, Riebeek East and Alicedale. This means that residents of these towns often have to commute to Grahamstown in order to have access to these services. 4.3.7.3 WHAT THIS MEANS FOR LED This sector will have a role in economic development through its ability to attract and its ability to absorb local semi‐skilled and skilled labour. One of this sector’s roles in economic development is that of improving the quality of financial and businesses services rendered to economic development stakeholders and beneficiaries. The performance of this sector also has an impact on the true ‘cost of doing business’ in Makana as it represents the bulk of the tertiary sector of the economy. 4.3.8 GOVERNMENT, SOCIAL AND COMMUNITY SERVICES The government services sector includes community, personal and social services rendered by private and public institutions. Activities classified within this sector include public administration and defence activities, activities of government, government departments and agencies; education, public and private; health and social work; sewage and refuge disposal, sanitation and similar activities; activities of membership organisations; recreational, cultural and sporting activities;

Local Economic Development Strategy Makana Municipality
© 2009 Urban-Econ Eastern Cape: Development Economists +27 41 585 6640 [email protected]
69
washing and dry‐cleaning of textiles and fur products, hairdressing and other beauty treatments, funeral and related activities. 4.3.8.1 PERFORMANCE OF THE GOVERNMENT SECTOR With an R‐GDP contribution of 51.5% and overall output of R684,04m Government in the form of community, personal and social services in the largest economic sector in Makana. The size of the government sector grew at an average annual rate of 2% a year from R547,88m in 1995 to R684,04m. The dominance of the government sector in Makana was thus entrenched between 1995 and 2007 and its R‐GDP contribution increased, as did its contribution to employment (despite its actual employment levels falling). The government sector in Makana presented the second highest location quotient of all the sectors. That means that in engages in this form of activity more than the provincial and district averages. The growth of the sector was primarily driven by the expansion of Rhodes University in terms of student enrolment and facilities provision. Increases in national, provincial and local government budgets as seen in the MTEFs also contributed toward the increase in size of the government sector. Figure 4.22: Government output (R’000 at constant 2000 Prices)
(Source: Quantec, 2007)
Figure 4.23: Government employment
(Source: Quantec, 2007)

Local Economic Development Strategy Makana Municipality
© 2009 Urban-Econ Eastern Cape: Development Economists +27 41 585 6640 [email protected]
70
Employment in the government sector declined by 6% between 1995 and 2007. In terms of average output per worker (sector output divided by the number of people employed within it) the government sector lags behind most of the large sectors. At an average output per worker of R97 000 a year, the government sector’s productivity falls behind that of Financial and Business Services (R130 000), Trade (112 000) and Manufacturing (R101 000) and only outperforms Agriculture (R33 000). Labour productivity in relation to R‐GDP output in the government sector is thus behind that of the other large economic sectors in Makana. 4.3.8.2 THE NATURE OF GOVERNMENT SERVICES IN MAKANA Based on their annual reports and financial statements publicly available online, it emerges that the two main entities in Makana’s government sector are Rhodes University and the Makana Municipality (Rhodes University Annual Report, 2007; Makana Municipality IDP, 2007). Rhodes University which provides educational services is responsible for approximately 71% of the government sector’s output in Makana, and approximately 21% of the sector’s permanent employment. Of its entire workforce 26% are employed in academic instruction and research, 43% are employed in administrative support and 31% are employed in support service positions. The Makana municipality which provides local governance and public administration is responsible for approximately 19.4% of the government sector’s output, and 8% of its employment creation. That means that Rhodes University and the Makana Municipality make a combined contribution of 90% of the government sector’s output. Other organisations and forms of activity in the Makana government sector include
• Government departments (such as Home Affairs, Roads and Transport, Agriculture, Education, Labour, Water Affairs and Forestry, amongst others)
• Defence activities (such as the SANDF Grahamstown military base, Midlands Command and the SAPS)
• Government agencies (such as SEDA, ECARP) • Justice services including the department of Public Prosecutions, High court,
Magistrates court and Small Claims Court • Education (The EastCape Midlands College and Schools such as Nombulelo High
School, Mary Waters School, St Andrews, DSG, Victoria Girls, amongst others) • Health facilities (such as Settler’s hospital)
It can thus be seen that the majority of activity classified under the government sector within Makana is undertaken in Grahamstown.

Local Economic Development Strategy Makana Municipality
© 2009 Urban-Econ Eastern Cape: Development Economists +27 41 585 6640 [email protected]
71
4.3.8.3 What this means for LED Makana has a comparative advantage in government services. As a result of the sector’s sheer in size in Makana, it will be a key determinant in driving and directing Local Economic Development in Makana. As the anchor of economic activity in Makana, its future growth, sustainability and efficiency will have a significant in shaping the local economy and community at large. 4.3.9 TOURISM The Standard Industrial Classification (SIC) used to classify economic sectors in the South Africa economy does not recognise tourism as a separate sector. This is because the tourism industry is a consumption based service industry that does not produce a tangible product. It does however, utilise the products and services of other classified industries including Trade, Transport and Business Services. Due to its increasing importance as an income and employment creator in South Africa, this report will discuss Tourism separately from the other sectors. Tourism can be defined as related to all the goods and services linked to a person staying and travelling outside of their area of residence. This is difficult as it includes many different sources of goods and services. Despite these challenges, gaining an understanding of its salient features will ensure that the LED strategy capitalises on economic opportunities within the municipal area. The principal sources of information that will be used in this section are the recently completed Responsible Tourism Sector Plan 2009 Review Report and the report on Tourism as a Pillar of the Makana Local Economic Development Strategy (2007). 4.3.9.1 PERFORMANCE OF THE TOURISM SECTOR In order to gauge the performance of the tourism, an approximation of its economic value to the Makana must be made. This involves analysis of:
• The amount of money spent directly by tourists (through Willingness to Pay) • Income generated from jobs supported by tourism (With and Without Analysis) • Changes in tourist visits through total bed nights sold in the area
Based on these factors, the Responsible Tourism Sector Plan 2009 Review Report estimates that in 2007:
• The average daily spend by tourists in Makana was R438.09 per bednight. • Total Direct Expenditure by Tourists in Makana was worth R42,43m • The Total economic activity generated by tourism in Makana was worth R160,6m
(or 12.1% of total R‐GDP) • Tourism is directly responsible for creating 307 jobs, and indirectly support a total of
700 jobs in Makana (or 4.9% of total employment) • Tourism has helped create, and support the equivalent of 47 SMMEs

Local Economic Development Strategy Makana Municipality
© 2009 Urban-Econ Eastern Cape: Development Economists +27 41 585 6640 [email protected]
72
From these results it can be seen that Tourism is an important sector in the Makana economy, contributing towards 12.1% of the R‐GDP. When one compares its employment contribution and its R‐GDP it becomes clear that there is a significant amount of value addition and a high level of output per worker in comparison to other sectors. This is to be expected as tourism is a tertiary sector where high value intangible goods and services are produced. In addition, the Responsible Tourism Sector Plan 2009 Review Report states that the cost of creating a job in the tourism sector is 30% cheaper in Makana than the national average. If direct tourism expenditure (R42,43m) and its total economic impact (R160,6m) are viewed against each other, it becomes apparent that tourism in Makana leads to a high level of indirect and induced effects on the overall economy. This is because of its aforementioned linkages with all the other sectors in the economy. 4.3.9.2 NATURE OF TOURISM As was indicated in section 2.4.4, the main forms of Tourism in Makana are environmental, educational and cultural tourism. This section will not repeat previously stated facts, but profile these forms of tourism in further detail. Tables 4.5 to 4.7 will list some of the activities, attractions and products that constitute Makana’s tourism offering as listed in the Responsible Tourism Sector Plan 2009 Review Report. Table 4.5: Environmental Tourism Amakhala Private Game Reserve Beggars Bush State Forest Hunts Hoek Safaris, Fish River Lalibela Private Game Reserve Idwala / Kichaka Lodge, Assegaai Lanka Safaris Aylesby Assegaai Hiking Trails, Kenton Rd Blaauwkrantz Reserve, Bathurst Rd Assegaai Sport Horse Stud, Riding School, Lezulu Game Reserve ‐ Salisbury Plains Kwandwe Private Game Reserve Burchell Game Farm, Alicedale Aylesby Nature Reserve, Riebeeck East New Year.s Dam, Alicedale Kwantu Game Reserve, Sidbury Bushman Sands Game Reserve, Alicedale Oldenburgia Hiking Trail, Grahamstown Coleridge Game Reserve, Grahamstown SouthCoombsview Reserve, Governor’s Kop Pumba Game Reserve, Grahamstown Rochdale Game Ranches, Alicedale Rd Rabbit Bush Reserve, Governor.s Kop Diepkloof Private Reserve East Cape Game Farm Shamwari Private Game Reserve Settlers Dam, Thomas Baines Ecca Nature Reserve, Ecca Pass Fish River Nature Reserve Complex Springvale Olive Farm, SE of Alicedale Signal Hill, Grahamstown Grahamstown Botanical Gardens Fourie Safaris Game Farm, Ndlambe border Thomas Baines Nature Reserve Tenuta Spring Grove Nature Reserve Great Fish River Reserve Hellspoort Valley Game Farm Woodlands Game Reserve Trumpeter.s Drift Game Farm, Gt Fish River Belton Hiking Trails, Kenton Rd Highland road
Source: Responsible Tourism Sector Plan 2009 Review Report

Local Economic Development Strategy Makana Municipality
© 2009 Urban-Econ Eastern Cape: Development Economists +27 41 585 6640 [email protected]
73
Table 4.6: Educational Tourism International Library of African Music, Grahamstown
44 Air School & Grahamstown Military Base, Grahamstown
Albany Museum, Grahamstown National English Library Museum, Grahamstown
Observatory Museum, Grahamstown Natural Science Museum, Grahamstown Cory Library for historical research, Grahamstown
History Museum, Grahamstown
Source: Responsible Tourism Sector Plan 2009 Review Report Table 4.7: Cultural Tourism National Arts Festival National Schools Festival SciFest Africa Makana Freedom Festival 1820 Settlers National Monument, Grahamstown
Methodist Church, Grahamstown
Methodist Church, Salem Baptist Church, Grahamstown Artificer’s Square: the old artisans quarter, Grahamstown
Bannerman House, Grahamstown
Bible Monument, Grahamstown Settler’s Express Steam Train, Grahamstown Catheral of St. Michael & St. George Old Drosty City Hall Settlers Memorial Tower Clock Tower Grahamstown Rhodes University Theatre Commemoration Church, Grahamstown Salem Historic Church, Grahamstown East Star Gallery Grahamstown Historic Church on Hilton House Table Farm,
on the banks of the New Year’s River Fort Selwyn St Peter’s Chapel Grahamstown The Oldest Official Letterbox in South Africa, Grahamstown
The Provost Prison, Grahamstown
High Street Façade, Grahamstown Source: Responsible Tourism Sector Plan 2009 Review Report
In addition to the above, there are a total of 121 providers of accommodation, that can be classified under Hotels, guest and country houses, lodges, caravan parks and camping sites, self‐catering, backpackers, hostels, and B&Bs. From Table 4.5 to 4.7 it becomes clear that unlike most other activity in Makana (with the exception of agriculture), tourism occurs throughout the entire municipality and is not just concentrated in Grahamstown. Tourism thus has the capacity and capability to improve the spatial spread of activity in Makana. Tourism is currently marketed by Makana tourism. It has approximately 120‐130 members that engage in the different forms of tourism profiled. In addition to Makana tourism, the following associations and organisations are involved with tourism activity:
• The Grahamstown Foundation, which in involved with the various Festivals that take place in Makana
• Indalo, which an association for Private Game and Nature Reserves

Local Economic Development Strategy Makana Municipality
© 2009 Urban-Econ Eastern Cape: Development Economists +27 41 585 6640 [email protected]
74
• The Grahamstown Hospitality Guild, which is involved with grading of accommodation facilities
• Makana EduTourism Project, which is involved with EduTourism 4.3.9.3 MARKET TRENDS In terms of changes over time, it was found that between 2004 and 2007, the amount of tourism visits as measured through the number of bed nights sold declined by 11.44% from 128 993 bed nights to 114 178 bed nights. This decline was headlined by 68.6% fall in hotel stays from 30 529 to 9 614. The effects of this decline were however mitigated by an 87.1% increase in bed nights spent at lodges, private game reserve and farm stays. This signals a shift in the profile of visitors to the Makana area, and the nature of their visit. The number of private and public game reserves has grown by a significant amount between 1995 and 2007, with the area devoted to game and nature conservation now 118 653 of the municipality’s 437 562 hectares. This is a profitable market segment that has exhibited growth in Makana. Interest in Edutourism and Education related tourism has also increased in recent years, which has also brought about a change in the profile of visitors to the area. The number of Bed and Breakfast and related facilities (Guesthouses, Country houses and self catering accommodation) also grew significantly between 2004 and 2009. This was in response to increasing demand for such accommodation, and declining demand for hotel accommodation. 4.3.9.4 WHAT THIS MEANS FOR LED There is an adequate supply of accommodation to match the wide range of tourism activities, facilities and products on offer in Makana. Tourism has the potential to create employment and generate income throughout various sectors of the Makana economy. In order for this potential to be realised and maximised, there is a need for marketing of Makana’s tourism offerings to be coordinated and intensified for cooperative synergies to be experienced. 4.4 SYNTHESIS The Makana economy has been growing at a slow rate between 1995 and 2007, when compared to the Cacadu district and the Eastern Cape Province. Grahamstown dominates the Makana economy, with most activity taking place there. Within the Makana economy, Government services in the form of Rhodes University and the Makana Municipality is the largest sector. Other significant sectors are the trade and service sectors, which are linked to tourism activity within Makana. Where some sectors such as agriculture have been declining, the overall economy is based on solid foundations and has potential for future growth and expansion. This potential for growth and expansion must be tapped, in order to reduce unemployment levels and limited diversification that characterise the Makana economy.

Local Economic DevelopmentStrategy Makana Municipality
© 2009 Urban-Econ Eastern Cape: Development Economists +27 41 585 6640 [email protected]
75
CHAPTER 5: INFRASTRUCTURE PROFILE Infrastructure is one of the most vital requirements for social and economic development. As a result of this important link between infrastructure and development this chapter profiles the current situation regarding infrastructure in the Makana Local Municipality. This chapter briefly assesses the economic infrastructure available in the region in terms of
• Transport (including Roads, Rail and Air) • Water and sanitary services (including Sanitation and Waste Management ) • Electricity and Telecommunications • Land availability, Land reform and Housing
Infrastructure provision in Makana is the responsibility of the Directorate of Technical and Infrastructure Services. In the 2008 Makana annual report, some of the directorate’s key objectives are presented as:
• Eradication of bucket system by December 2007 • Provision of water to all by December 2008 • Provision of sanitation to all by December 2010 • Provision of electricity by December 2012 • Provision of all basic services by 2014
5.1 TRANSPORT Transport networks serve the function of critical economic infrastructure as goods and services cannot be moved if there is inadequate transport infrastructure. 5.1.1 ROADS In terms of major routes that traverse Makana’s locality, the following roads exist: National Roads:
• The N2 lies adjacent to Grahamstown and links it up with East London to the East and Port Elizabeth to the West.
Main Roads: • The R400 links up Grahamstown to Riebeeck East and the N10 • The R343 links up Salem with Kenton‐on‐Sea • The R350 links up Grahamstown to Bedford • The R344 links up Grahamstown to Adelaide
Arterial Roads: • The R67 links up Grahamstown to Port Alfred in the South and Fort Beaufort to the
North
Makana has a road network totalling 757.4km, of which 588km are gravel and 169km are tarred (CDM SDF, 2009) . Maintenance of the N2 highway falls under the jurisdiction of the South African National Roads Agency Limited (SANRAL). Maintenance of the other roads is the responsibility of the Makana Municipality, with contracted assistance from the District from time to time.
Local Economic DevelopmentStrategy Makana Municipality
© 2009 Urban-Econ Eastern Cape: Development Economists +27 41 585 6640 [email protected]
76
Compared to municipalities in the Cacadu district, Makana has a good road network. However because of underfunding and growth experienced especially in the townships and informal settlements of Makana, there is now a significant backlog in terms of road provision and maintenance. According to the Makana IDP review of 2008, when quantified these backlogs amount to:
• R107m of tarred road • R340m of gravel road • R277m of pavements
Because of underfunding, improper maintenance has led to some of the roads being in a poor condition. According to the Makana IDP (2008), only 47.7% of the roads in Makana were in good condition, which though higher than the district and provincial levels, is still low. Such a state of affairs could hamper the expansion and development of the transport, agricultural and tourism sectors. This scenario applies to the route linking Alicedale with the N2, which is not tarred. This serves as an example of how inferior road provision may be perceived as constraining future development, especially that of Tourism. 5.1.2 RAIL There are rail routes that link Grahamstown to Port Alfred, Alicedale, Cradock and Port Elizabeth (SDF, 2008. The rail infrastructure in place links up the Makana municipality with all the major national rail routes. This is because historically, a major railway junction was located in Alicedale. However, due to rising operational costs and declining profitability most of the rail routes within Makana are now disused. This has put an increased strain on the municipality’s road networks as freight deliveries are now done using road rather than rail transport. 5.1.3 AIR A municipal owned airfield is situated just outside Grahamstown. This airstrip is leased to and operated by private organisations. It has a short tarred runway of only 1.2km, which limits the ability of large aircraft to land. It is thus predominantly used by charter aircraft that fly within the province. The small size of the airstrip and nature of demand also means that no regularly scheduled flights to other towns and cities are undertaken by commercial carriers. However, there are plans for an expansion of the airstrip’s refuelling capacity, which could allow increased traffic volumes in the future. Several private landing strips are located throughout the Makana locality. These are a result of the farming legacy of the municipality, and its current orientation towards private game and nature reserves. 5.1.4 IMPLICATIONS FOR LED Transport networks have an indirect cost on the cost of doing business within an area. Furthermore, road rehabilitation costs increase exponentially the less regular sufficient maintenance is done, increasing the overall long run cost to the municipality to maintain the

Local Economic DevelopmentStrategy Makana Municipality
© 2009 Urban-Econ Eastern Cape: Development Economists +27 41 585 6640 [email protected]
77
existing road network. Limited resources must thus be allocated and used in a manner that will maximise economic growth and development areas throughout the municipality. Improving the road conditions in the townships will improve the economic and social environments in these areas. 5.2 WATER AND SANITARY SERVICES 5.2.1 WATER Management of and planning for water resource needs of the Makana municipality are governed by the Water Services Development Plan of 2007. This document provides a status quo of water resources in the area and planned infrastructure development regarding bulk water supply, reticulation and allied activities. It also outlines roles and responsibilities in municipal functions that relate to provision, maintenance and expansion of bulk water infrastructure in the Makana municipality. In the major urban settlements, surface water supplies are sourced from the following dams and reservoirs:
• Grahamstown: Glen Melville, Settlers, Howieson, Jameson and Milner dams • Alicedale: New Year’s Dam • Riebeeck East : Municipal boreholes • Grahamstown uses 8.6 Mm3/a of water per year and at present there is adequate
supply from the dams mentioned above. • Riebeek East use 0.02856 Mm3/a of water per year and although there is presently
adequate supply, there is need for increased storage capacity. (Makana IDP Review, 2008; State of the Cacadu Environment, 2005)
Table 5.1 shows the Makana municipality’s provision levels of potable water and sewerage purification from 2005 to 2008. Table 5.1: Makana Water Provision and Sewerage Purification levels Service Provided Period 2005/2006 2006/2007 2007/2008 Total Volume drinking Water (Kl) 3 273 130 4 036 906 4 019 399 Total Volume Sewerage Treated (Kl) 2 532 125 2 596 788 2 307 964
(Source, Makana Annual Report 2006/2007; 2007/2008) In the 2007/2008 financial year period, the Makana municipality was able to provide 4 019 399Kl of water. This translates into over 90% of the households in the municipality being served with individually metered ERF connections, according to the 2007 annual report. The amount of water provided by the municipality has steadily grown as shown in Table 5.1. This is a result of growth in demand for water, as well as an increase in the municipality’s capacity to supply water. The majority of households without water connections in their individual residential units are found in informal townships that have grown in the last fifteen years. This means that the majority of households in the Makana area have access to bulk water supplies.

Local Economic DevelopmentStrategy Makana Municipality
© 2009 Urban-Econ Eastern Cape: Development Economists +27 41 585 6640 [email protected]
78
Despite most households having access to water, water provision is not without its own set of challenges in Makana. These include:
• Challenges brought by perennial drought • Poor quality of water (which at times does not reach set standards) because of aging
remediation plants. This is typified by the Waainek Water Treatment Works which are very old and operating at their maximum output levels (when equipment breakdowns do not interfere with remediation).
• Inconsistent water pressure and intermittent water supplies as a result of old infrastructure, particularly reticulation pumps and piping. In addition to this, there is a labour shortage within the municipality which inhibits cost effective and timeous pump servicing and motor maintenance. The cumulative effect of this state of affairs is evidenced by how there were 2058 water complaints in 2007 from Makana’s 16 120 connected erven.
• The lack of adequate water supplies also has a negative impact on the agricultural sector especially in Salem and areas where irrigation is necessary
• A backlog in the provision of storm water infrastructure equivalent to R233m (Makana IDP Review, 2008)
5.2.2 SANITATION In terms of the access to toilet facilities in Makana, of all the households in 2007 it was found that:
• 35% had access to flush or chemical toilets • 23% relied on pit latrines • 29% used bucket latrines (Source: Quantec, 2007)
This indicates a high level of provision of sanitation. However, new housing development in the townships and the expansion of Rhodes University is placing additional strain on old and over utilised infrastructure. Furthermore, demand for sanitation under the Free Basic Services scheme has increased since 1995, with increases in the indigent population, and the influx of former farm workers into urban areas. According to the 2008 IDP review, there exists a backlog in bulk water supply and sanitation services equivalent to 35% of the desired RDP level, the eradication of which will cost at least R100m. 5.2.3 WASTE MANAGEMENT Waste Management consists of the collection, transportation and disposal of waste. An Integrated Waste Management Plan is in the process of being drafted by the Makana municipality to guide activity and policies. 87% of households have refuse removed by the local municipality at least once a week which is significantly the provincial and district averages of 37% and 71% respectively. (Quantec, 2007). Makana thus has a high level of waste collection and disposal infrastructure.

Local Economic DevelopmentStrategy Makana Municipality
© 2009 Urban-Econ Eastern Cape: Development Economists +27 41 585 6640 [email protected]
79
In Grahamstown there is a solid waste disposal site which has adequate capacity for the next 20 years. In Riebeeck East refuse is burnt at a waste disposal site located at Mooimeisiesfontein while in Alicedale solid waste is collected at a disused Quarry (Makana SDF, 2008). The Municipality is currently offering very limited recycling incentives to private people or businesses, which could result in income generation and employment creation opportunities. There is room for expansion of the Masihule project that promotes recycling in partnership with the Department of Social Development. With regards to sewerage, Grahamstown has two sewage purification works and two water treatment plants. Alicedale has water purification works and sewerage ponds. Sewage works in Riebeeck East are non‐functional, which poses health hazards, especially because of downstream seepage into water sources. Waste management of sewage and organic material could provide opportunities for SMMEs such as renewable energy (e.g. biomass extractors and digesters) and the production of organic fertiliser. The Belmont Valley and Mayfield Sewage Treatment Works are currently operating sub‐optimally and require significant capital injections to allow them to meet the municipality’s water‐based sanitation needs. The cumulative effect of this state of affairs is evidenced by how there were 1240 waste management related complaints in 2007 from Makana’s 12 139 connected erven. Whilst some of these complaints have their nascence in the state of the old infrastructure,this high number is also partly attributable to poor education of local residents on propoer maintenance nad upkeep of sanitary services. In addition to this, there is inadequate capacity at the municipal sewerage works in Grahamstown to cater for large, wet and heavy water polluting industries such as leather tanneries and abattoirs, to name but a few 5.2.4 IMPLICATIONS FOR LED The Provision of water, sanitation services and proper waste management have an impact on overall community wellbeing, which in turn affect the realisation of economic potential. Their provision or lack thereof has an impact on community health, worker productivity, the general quality of life and the attractiveness of Makana as a place to live and work in. 5.3 ELECTRICITY AND TELECOMMUNICATIONS 5.3.1 ELECTRICITY Reliable, uninterrupted electricity supply is vital to advance economic development in the region. Power cuts can impact negatively on both small and large scale businesses by cutting into their productive capacity. This is applies to all businesses across the spectrum, from manufacturing enterprises such as Makana Brick and Tile to service organisations such Rhodes University.

Local Economic DevelopmentStrategy Makana Municipality
© 2009 Urban-Econ Eastern Cape: Development Economists +27 41 585 6640 [email protected]
80
The Makana municipality is responsible for electricity reticulation, distribution, resale and plant maintenance (Cacadu Municipal Capacity Report, 2008). Electricity generation and the provision of major infrastructure is the responsibility of Eskom, as is management of a substantial part of the municipal erven (Whisson, 2009). In 2008 the Makana municipality had a backlog in electricity provision amounting to 3500 households, or equivalent to 27.17% of the desired RDP level. This backlog primarily takes the form of provision of energy for cooking and lighting that households make use of. With regards to eradication of this backlog, it should be noted that Eskom, the national supplier, has severe electricity generation capacity constraints to meet the demand for electricity in South Africa, which are expected to continue at least until 2014. This limits the additional supply local municipalities are able to offer in their localities. The implication of this is that as much the scope for increased supply may be limited, the municipality may still facilitate the provision of infrastructure that will allow eventual connection of households to the national grid. 5.3.2 TELECOMMUNICATIONS Given the critical role that modern communication technology plays in the contemporary commercial environment, a well established telecommunication network can improve both the competiveness and efficiency of local business while at the same time encouraging the introduction of new business ventures. A study of employment and unemployment in South Africa by Kingdon and Knight (2000) found strong and significant correlations between the provision of telecommunications services and the ability to find employment In recognition of this, development and improvement of telecommunications networks is identified as an LED (rather than being classified under general infrastructure) objective in the Makana IDP Review of 2008. Rhodes University has an established Centre of Excellence in partnership with Telkom. This is in recognition of the well developed ICT (information and Communication Technology) and telecommunications infrastructure that is in place at Rhodes University. This includes a high speed internet link that has enough bandwidth for large amounts of data. Rhodes University thus operates as a hub that links internet communications of several educational institutions. In 2007 more than 71% of the Makana population had access to either a private telephone or one nearby. (Quantec, 2007).in fact, only 3% of the population were recorded as not having access to a public or private phone at all. However, most of these people used mobile phones, and did not have access to fixed landlines. Mobile phones are associated with higher initial capital costs and have more expensive running costs than fixed landlines. This then means that the effective cost of communication for most of Makana’s residents is higher than optimal. In addition to this, there are very few phone shops that offer voice telephony or data services such as internet access or facsimiles.

Local Economic DevelopmentStrategy Makana Municipality
© 2009 Urban-Econ Eastern Cape: Development Economists +27 41 585 6640 [email protected]
81
5.3.3 IMPLICATION FOR LED Access to electricity and telecommunication services is of prime importance in the townships, where most of the backlogs in infrastructure provision are experienced. Improved Access to electricity in the townships increases activity periods of the day (beyond sunset), which will allow a reduction in crime, improvement in educational performance, and encourage new and expanded business activity. Access to reliable and affordable telecommunication can assist small business by enhancing the number of opportunities for small business to partake in. 5.4 LAND AVAILABILITY, LAND REFORM AND HOUSING 5.4.1 LAND AVAILABILITY Land is identified in the realm of economics as one of the critical factors of production. Availability of prime land thus has an impact on the nature of growth and development that occurs within an area. Similar to other parts of the country, Makana municipality faces a number of challenges pertaining to land availability and reform. The Makana spatial development plan, in conjunction with the land use management package shows the status quo of land availability and how this informs planned future spatial development within the area. According to the Makana SDF (2009) most of the land in the municipality is privately owned. The majority of publicly owned land takes the form of the SANDF army base and private game reserves, with some clusters also located in the urban settlements of Grahamstown, Alicedale and Riebeeck East. In Riebeeck East and Alicedale most of the privately owned land, which is concentrated in and around the urban centre, is unutilised, vacant and undeveloped. Private land in Grahamstown is largely developed, while state owned land to the north and municipal commonages to the south and east of Grahamstown is less developed. Strategic land parcels that are currently under mixed ownership (private and public) have been identified for future commercial, residential, agricultural and industrial use. Unfortunately, there is little land for development in the core of Grahamstown’s urban centre, which leads to superficially high land prices. 5.4.2 LAND REFORM Currently there are three parallel land reform policies being implemented by the South African National Government, these include Land Restitution, Land Redistribution and Land Tenure Reform. Land restitution is a legal process whereby people who can prove that they were dispossessed of their land after 1913 can regain their land or receive appropriate financial compensation for it. Land redistribution aims to address the racial imbalances in the ownership of commercial agricultural land while land tenure reform aims to address insecure tenure in the former homeland areas. In terms of the land redistribution process, the national government has set a target black people owning 30% of commercial agricultural land by 2014 (CDE, 2008).

Local Economic DevelopmentStrategy Makana Municipality
© 2009 Urban-Econ Eastern Cape: Development Economists +27 41 585 6640 [email protected]
82
There is a need to ensure that land reform creates socioeconomic opportunities that are sustainable, and enough to benefit the majority of the populace. It must also be coupled with adequate provision of supporting infrastructure including education and training, hospitals, schools and residential settlements. In Makana, land reform is undertaken through the Land and Agrarian Land Reform Project and Land Rights Awareness Campaign, which is a provincial initiative administered by the Department of Land Affairs, with assistance of the Department of Agriculture. Table 5.2 provides some indicators of the status of land reform in Makana. Table 5.3 provides a status quo of land restitution in Makana. Table 5.2 Status of Land Reform in Makana Beneficiaries Distribut
ed 1994‐2008
Progress towards target
Hectares still to be distribute to meet target
Average land price per hectare
Average Grant approved per beneficiary
710 13 113ha 18.62% 70 428 R3 596 R9 211 (Source: CDM Area Based Plan and Land Availability Report, 2008)
Table 5.3 : State of Land restitution in Makana Urban Rural Total Results
Claims Area Ha) Claims
Area (Ha) Claims Area ((Ha) Settled Gazetted
45 15.28 59 25 240.29 104 25 285.57 14 53 (Source: CDM Area Based Plan and Land Availability Report, 2008)
As shown in Table 5.2, land reform has benefited a large amount of beneficiaries (710). In terms of achieving the national target of 30% land redistribution the district progressed towards 18.62% of this target, which is higher than the district average of 6.31%. The average grant approved per beneficiary was the lowest in the Cacadu district. Most of the land transferred under land reform is located in parcels to the east of Grahamstown and to the North‐west of Riebeeck East. The costs of land reform is presented in Table 5.2 however, do not include the opportunity cost associated with unproductive land, and other costs such as water and input provision (Whisson, 2009) Out of the 104 land claims submitted, 14 restitution cases have been settled throughout the municipality by the Regional Land Commissioner, with a further 53 having been gazetted, 12 being validated, 21 under research and 3 under research. Makana had the second highest number of total claims in the Cacadu district after the Kouga Local Municipality . There is however still a number of outstanding claims that still require adjudication by the Regional Land Commissioner. One reason for the slow progress in dealing with outstanding restitution claims is the absence of a Department of Land Affairs office in the area. Farmers from the area recognise the need to restructure the ownership of land and support the development of successful black farmers and sustainable farming operations as critical to the future of the farming communities. This has been exhibited through several instances

Local Economic DevelopmentStrategy Makana Municipality
© 2009 Urban-Econ Eastern Cape: Development Economists +27 41 585 6640 [email protected]
83
of farmers facilitating land redistribution through the willing‐buyer willing seller model. However, the high number of land restitution claims have led to insecurity amongst farmers, which in turn has led to low capital investment rates and a reluctance to expand the scope and scale of their current activity. 5.4.3 HOUSING Closely related to land reform, land availability, and the other forms of infrastructure discussed in this chapter is the issue of housing. The infrastructural backlogs and land reform issues highlighted in this chapter are inextricably related to the provision of adequate housing. As has previously been alluded to in this report, there has been significant growth in urban dwellings in Makana townships. This is partly a result of former farm workers and their families moving into the urban areas seeking economic opportunities. According to the Makana 2008 IDP, the Makana municipality had
• The highest level of informal housing in the Cacadu District • The highest growth in informal housing for the period 2001 – 2006 • The biggest backlog in housing in the district of 12 900 units.
(IDP, 2008) It is evident that the district has a significant backlog in the provision of adequate housing that meets RDP standards. In response to this backlog, recent housing developments at Tantyi Housing Development , Newtown Housing Development ,Extension 6 , Vukani, Victoria Road Extension and Farmerfield have led to the construction of over 1500 houses . Key areas that have been prioritised in the 2008 IDP as priority areas for housing development include Seven Fountains, Fort Brown, Mayfield, Transit Camp and Fingo Village. 5.4.4 IMPLICATIONS FOR LED Failed land reform programs negatively impact on agricultural production as well as threatening the livelihoods of emerging farmers. Without adequate land reform black and emerging farmers are prevented from engaging in productive activities in their area and are forced to seek work elsewhere, particularly in urban areas. Housing provision improves the quality of life of residents, and fosters civic pride. Housing provision is as essential as other forms of infrastructure as it directly impacts on community, social and economic development. 5.5 SYNTHESIS The infrastructure in Makana is relatively well developed, in comparison to district and provincial averages. However as shown through the backlogs that exist in the different forms of infrastructure profiled, a number of challenges still exist both in terms of the provision of basic services and investment in infrastructure for the creation of an environment conducive for local economic development.

Local Economic DevelopmentStrategy Makana Municipality
© 2009 Urban-Econ Eastern Cape: Development Economists +27 41 585 6640 [email protected]
84
Where overall provision of most classes of infrastructure is adequate for business operation, its general quality was found to be below the expectations of stakeholders in Makana. A dichotomy in infrastructure provision exists between Grahamstown and the other urban areas in the local municipality. Within Grahamstown provision of enabling infrastructure ot the townships and Grahamstown east was found to be below the standard that exists in the rest of Grahamstown. The continual extension, upgrade and maintenance of infrastructure throughout the municipality are critical to improving Makana’s competitiveness and its ability to encourage the introduction of new business. The provision of basic services and investment in infrastructure will play a critical role in the long run creation of an environment which is conducive for local economic development.

Local Economic Development Strategy Makana Municipality
© 2009 Urban-Econ Eastern Cape: Development Economists +27 41 585 6640 [email protected]
85
CHAPTER 6: ENVIRONMENTAL PROFILE This Environmental profile provides an overview of the environmental characteristics of the Makana area. Development associated with primary activities such as mining and agriculture, as well as tertiary activity such as tourism is often based on an area’s physical attributes. The environmental profile will thus feed into the developmental potential that can be based on Makana’s inherent physical characteristics The environmental characteristics of Makana are discussed under the following sub‐sections: • Climate • Topography • Hydrology • Land capacity and Soil types • Vegetation types and Biodiversity 6.1 CLIMATE Makana lies in a subtropical climatic zone, meaning that the area is characterized by warm summers and cool winters and fairly evenly distributed rainfall throughout the year. Makana’s rainfall levels are compared to the rest of the Eastern Cape’s average annual precipitation levels in Figure 6.1. The spatial representation is based on data from the South African National Biodiversity institute and is useful in providing high level comparison of the Makana locality to the rest of the province’s rainfall patterns. In Figure 6.1 it can be seen that Makana’s rainfall lies in the median range. The climate becomes more dry as one moves towards the north‐Western half of the municipality. Because Makana is largely urbanized, with marginal rural populations, the climate will be profiled based on the major settlements located within it. The Grahamstown area experiences moderate weather conditions in relation to mean precipitation , wind speed and direction, temperatures . Rain falls throughout the year with mean precipitation averaging 680mm. Summer temperatures (January) vary from an average maximum of 26⁰ to a minimum of 15⁰. In winter (July) temperatures vary from an average maximum of 18⁰ to an average minimum of 4⁰. The prevailing wind direction is from the west and southwest. (Makana SDF, 2009) In Alicedale, rainfall is approximately 555mm per year. Temperatures in Alicedale range from 40⁰ to 15⁰ in summer, and 18⁰ to ‐8⁰ in the winter months. Rainfall in Riebeeck east area is approximately 865mm per year, with identical average winter and summer temperatures to those experienced Grahamstown. (Makana SDF, 2009)
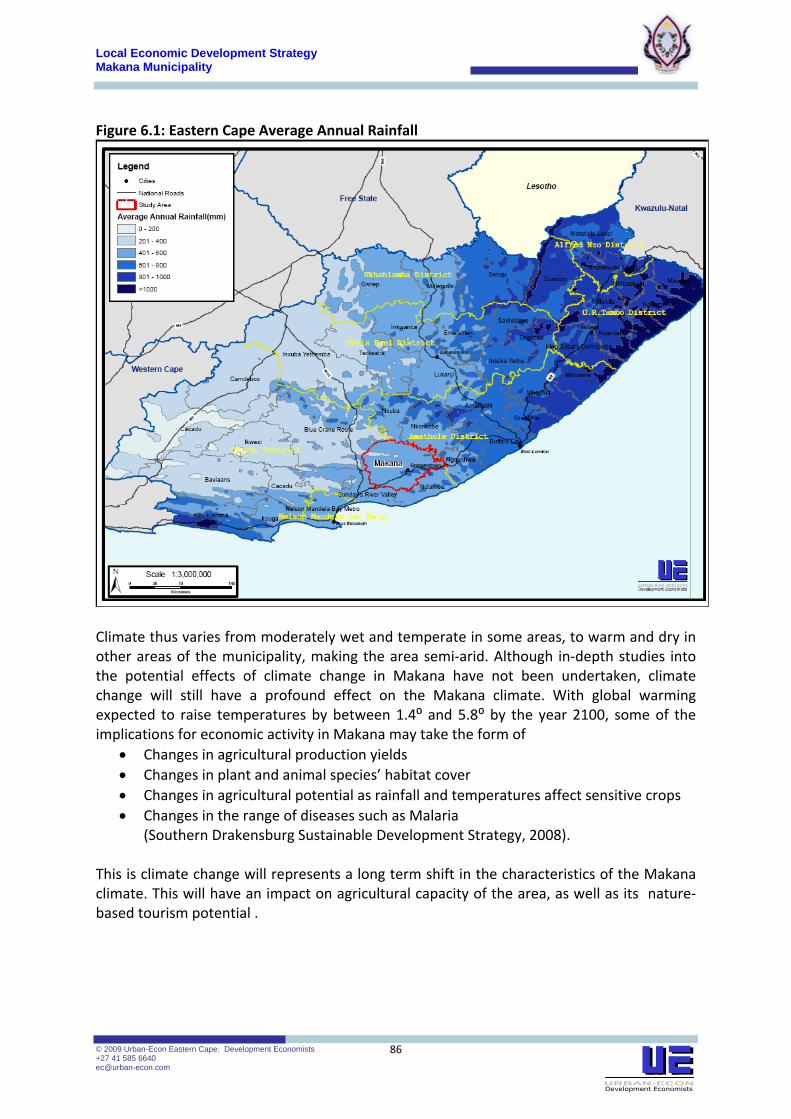
Local Economic Development Strategy Makana Municipality
© 2009 Urban-Econ Eastern Cape: Development Economists +27 41 585 6640 [email protected]
86
Figure 6.1: Eastern Cape Average Annual Rainfall
Climate thus varies from moderately wet and temperate in some areas, to warm and dry in other areas of the municipality, making the area semi‐arid. Although in‐depth studies into the potential effects of climate change in Makana have not been undertaken, climate change will still have a profound effect on the Makana climate. With global warming expected to raise temperatures by between 1.4⁰ and 5.8⁰ by the year 2100, some of the implications for economic activity in Makana may take the form of
• Changes in agricultural production yields • Changes in plant and animal species’ habitat cover • Changes in agricultural potential as rainfall and temperatures affect sensitive crops • Changes in the range of diseases such as Malaria
(Southern Drakensburg Sustainable Development Strategy, 2008). This is climate change will represents a long term shift in the characteristics of the Makana climate. This will have an impact on agricultural capacity of the area, as well as its nature‐based tourism potential .

Local Economic Development Strategy Makana Municipality
© 2009 Urban-Econ Eastern Cape: Development Economists +27 41 585 6640 [email protected]
87
Implications for LED:
• Climate has an impact on agricultural and tourism activity that takes place • The identification of potential agricultural activity will need to take cognizance of
rainfall and temperature patterns in the Makana area. This is most pertinent in the rearing and cultivation of sensitive animals and crops
• Climatic conditions also have an impact on the nature‐based tourism that can take place within the Makana area
6.2 TOPOGRAPHY Topography relates to land forms and land elevations that are found within an area A region’s topography influences the type of activities that can occur within it. To illustrate this point, general land planning conventions stipulate that:
• Slopes of 0⁰ – 50⁰ are suitable for most types of development. • On slopes of 50⁰– 180⁰ limited development might be appropriate, should an EIA
indicate that impacts are acceptable. • Development should not be permitted in areas with slopes greater than 180⁰.
The eastern part of the municipality can be classified as lowlands, with contours generally lying below 300m above sea level. The western part of the locality in which Alicedale is situated can be classified as being of a moderate elevation, lying between 300m and 600m above sea level. The central part of the municipality that contains Grahamstown and Riebeeck East has the highest elevation of between 600m and 900m above sea level. With regard to slope, most of the land in Makana has a slope of either between 3‐8⁰ or 8‐20⁰ (State of the Cacadu Environment, 2005). The area is characterised by a combination of plains, lowlands and undulating hills. The Makana municipality has large pockets of open flat areas that allow for agriculture to take place. The central part of the municipality has more elevated and sloped terrain, which limit the scope for cultivation of some agricultural crops, even though much of the land can still be used for grazing. Flat topped hills that have been shaped by dolerite dykes, sills and chemical weathering are found throughout the region. With regards to the particular topographical characteristics of the towns: Grahamstown is situated in a valley that cuts into a plateau. The highest point on the plateau is 770m above sea level and the lowest point in the valley is 490m above seal level. (Makana SDF, 2009) Alicedale is located about 360m above sea level in a flood plain created by the confluence of the Bushmans river and the New Years river (Makana SDF, 2009) Riebeeck East is located 630m above sea level on a piece of high ground. (Makana SDF, 2009) Implications for LED

Local Economic Development Strategy Makana Municipality
© 2009 Urban-Econ Eastern Cape: Development Economists +27 41 585 6640 [email protected]
88
• Makana is made up of land with a low to moderate elevation • The landscape is punctuated by low hills • The absence of high elevation land or land with steep slopes means most of the
land can be used for various agricultural purposes 6.3 HYDROLOGY The major water related driver in the municipal area is the Orange‐Fish‐Sundays Water Supply System which ensures continuous sustainable water supply for economic activity and is essential for community well‐being and socio‐economic prosperity in the area. The whole municipality is classified as a primary catchment area, with a mean quartenary runoff of between 12m3 and 40m3. (State of the Cacadu Environment (2005) Surface water is largely provided by dams and reservoir that are linked to perennial and non perennial rivers. Ground water is provided by boreholes and springs that are evenly distributed throughout the municipality. In terms of water sources in the towns it is found that: Grahamstown’s water is from local dams and sources transferred from the Orange River. There is adequate supply to cater for the 8.6Mm3/a that is used, but also a need for more groundwater development. Riebeeck East’s water is sourced from local boreholes. It also has adequate supplies of water to cater for the 0.0285 Mm3/a that it uses. A planned water scheme for Riebeeck East is an increase in storage capacity in the form of tanks and a reservoir. Alicedale’s water is sourced from a local dam (State of the Cacadu Environment, 2005) With regards to the quality of water resources in the area, the State of the Cacadu Environment report of 2005 states that water quality is ‘good, or even natural (or example the New Years Dam and Bushmans River sites) even though it is naturally saline and not suitable for certain uses” Implications for LED
• Studying the hydrological profile of an area is important as it has an impact on the availability and quality of water.
• The availability of water is important in agricultural activities, especially where the need for irrigation and boreholes to supplement rain water is high, as is the case in Makana.
• Water quality impacts on the amount of water available for human usage and the associated costs of water purification incurred to make water safe for use.
• High water demand set against limited supply possibilities put forth the possibility of water recycling.

Local Economic Development Strategy Makana Municipality
© 2009 Urban-Econ Eastern Cape: Development Economists +27 41 585 6640 [email protected]
89
6.4 LAND CAPACITY AND SOIL TYPES Land capacity is determined by the collective effects of soil, topography, hydrology and climate features. It indicates the most intensive long‐term and sustainable use of land for rain‐fed agriculture and at the same time highlights the permanent limitations associated with different land use classes. Table 6.1 shows the classifications with which land is classified. It also shows different land usages that go in line with the different levels of land capability.. This shows the nature of agricultural activity that can be feasibly undertaken throughout the municipality. Table 6.1 Land use options per land capability class Land Capability Intensity of use for rain‐fed agriculture Grazing and Forestry Crop Production
Classes Forestry Veld Pastures Limited Moderate Intensive Very Intensive
I x x x x x x x II x x x x x x III x x x x x
Arable
IV x x x x V x x x VI x x VII x x
Non
‐arable
VIII x Source: Directorate Agriculture Land Resource Management, 2002
Table 6.2 Land Capability in Makana Land capability class Area (ha) Percentage 1 0.00 0.00% 2 0.00 0.00% 3 0.00 0.00% 4 31789.20 7.27% 5 20456.20 4.68% 6 300661.00 68.71% 7 46331.70 10.59% 8 38072.30 8.70%
Source: Cacadu ABP & LAA, 2008 Most of the land (68.71%) in Makana is classified under class 6. This means that the majority of land in Makana is only suitable for grazing of animals and non‐arable. Based on the results presented in Table 6.2 and Figure 6.2, the Makana Area Based Plan (2008) states that land in the Makana area has suitable potential to for
• Large areas of irrigation, should water be available • Rain‐fed cropping of Wheat, chicory, pecan nuts and aloe
Local Economic Development Strategy Makana Municipality
© 2009 Urban-Econ Eastern Cape: Development Economists +27 41 585 6640 [email protected]
90
• Irrigation‐fed cropping of stone fruit, olives, cotton, vegetable, sugar beet and oranges
• Livestock including game farming and ostrich farming Soils in the Makana area are generally shallow and weakly developed, with depths typically not exceeding 600mm. This is because the municipality’s geology is based on Beaufort group sandstones and shales which dominate the landscape. The shallow and weakly developed soils limit the types of crops that may be planted throughout the municipality as this affects root development, nutrient retention and moisture drainage. There are some rich alluvial and colluvial soils close to rivers, which support intensive agricultural cultivation. Topsoil textures vary from loamy sand to sandy clay loam (Makana ABP & LAA, 2008). Some of the soils are also expansive, which has implications on building and construction methods used in the municipality’s development. Expansive soils absorb moisture, which has implications for the decision‐making processes followed land planners, property developers and building contractors. Land capacity and soil types also have an impact on soil quality, and land degradation. Land degradation may be caused by overstocking of livestock and the use of inappropriate grazing methods and field burning regimes. Land degradation could result in a deterioration of livestock feeds, irreparable damage of natural resources, and loss of biodiversity. Effect on economic development:
• The soil type and quality has a major impact on the intensity and type of farming that can occur in the area.
• Livestock grazing must be in line with the land’s capability, in order to prevent land degradation and maximise land potential based on its inherent qualities.
6.5 VEGETATION TYPES AND BIODIVERSITY The vegetation in an area represents an integration of climate, soil and a number of other biological factors. Physical factors including geomorphology and geology also act as variables that determine vegetation types and biodiversity. The Makana District has richly diverse and unique vegetation, comprising ten vegetation types, representing six of the seven major southern African biomes (namely forest, grassland, succulent karoo, fynbos, savannah grasslands and the thicket vegetation). The Makana municipality is situated in the Albany Centre of Endemism and has 27 endemic plant species of which 17 (62%) are cited as being vulnerable and 5 (32%) are cited as being endangered. Significant portions of land in the Makana municipality are classified as “Critical Biodiversity Areas”. This means that they are to be managed for biodiversity and conservation, with only limited development in the form of small scale tourism amenities recommended. Critical Biodiversity Areas also have guidelines on the form a agriculture that may take place (State of the Cacadu Environment, 2005; Makana ABP and LAA,2008)
Local Economic Development Strategy Makana Municipality
© 2009 Urban-Econ Eastern Cape: Development Economists +27 41 585 6640 [email protected]
91
The biodiversity of the thicket within Makana is threatened by several factors, including:
• Urbanisation • Transformation of land for agricultural purposes • Overgrazing by livestock • Habitat loss through preparation of cultivated land for products such as cash crops • Overpopulation of alien species introduced through agriculture and game reserves • Unsustainable resource use • Collection of plant species for medicinal and ornamental uses • Land degradation because of the use of irrigation in areas with poor soils
Effect on economic development:
• Agriculture, mining, manufacturing activity and tourism all have the potential to affect Makana’s vegetation and overall biodiversity
• The high level of biodiversity makes it essential for conservation efforts to be stepped up. This becomes more important when the level of endangered and vulnerable species is presented.
• Land use planning must reflect the need for protection of native vegetation. In rural areas this must be implemented in the form of sustainable agricultural practices .
• Private game reserves and agri‐villages may be used as conduits for the conservation of natural resources in Makana as the prevalence of rich vegetation cover could be used as a tourist draw card.
6.6 SYNTHESIS All economic activity and production is at some level predicated by the natural environment on which it is based and in which it operates. An understanding of environmental characteristics of an area is vital in evaluating development potential that exists in an area. Understanding trends in environmental change is also crucial in ensuring that future development supports and is supported by natural resources available within an area.
Local Economic Development Strategy Makana Municipality
© 2009 Urban-Econ Eastern Cape: Development Economists +27 41 585 6640 [email protected]
92
CHAPTER 7: INSTITUTIONAL PROFILE This chapter provides a profile of the Makana Local Municipality, in terms of its institutional structure, human resources and financial resources dedicated to local economic development. It is important to understand the structure and capacity of the municipality to implement local economic development, so as to determine optimal future institutional arrangement for the facilitation of local economic development in Makana This chapter is presented according to the following sections:
• Makana Political Structure • Municipal power and functions • Makana Institutional Structure • Intergovernmental Relations
7.1 MAKANA POLITICAL STRUCTURE The Makana Local Municipality was established in terms of Section 12 of the Local Government Municipal Structures Act (Act No. 177 of 1998). The municipality operates an Executive Mayoral Committee system with an Executive Mayor and five Portfolio Chairpersons being members of the Mayoral Committee The Makana Council comprises 24 councillors (including the Mayor), 12 of whom are proportional councilors. The Makana Council also has the following five portfolio committees:
• Social Services, Community Empowerment and Protection Services • Corporate Services • Land, Housing & Infrastructural Development and Disaster Management • Economic Development, Tourism and Heritage • Budget, Treasury & IDP
The operation of portfolio committees is seen as a crucial means of ensuring the successful implementation of community based planning. 7.2 MUNICIPAL POWERS AND FUNCTIONS The Makana LM currently has 39 different functions, based on the Municipal Systems Act, No 32 of 2000 and Act 117 of 1998.These are listed in Table 7.1 Table 7.1: Powers and functions of the Makana Municipality Air pollution Markets Child care facilities Municipal abattoirs Fire fighting incl. DM function Municipal parks and recreation Municipal airports Municipal roads Municipal Health services Noise pollution Pontoons and ferries Pound

Local Economic Development Strategy Makana Municipality
© 2009 Urban-Econ Eastern Cape: Development Economists +27 41 585 6640 [email protected]
93
Trading regulations Public places Sanitation Refuse removal, refuse dumps and solid
waste disposal Building regulations Control of undertakings that sell liquor to
the public Electricity reticulation Fencing and fences Local tourism Street trading Municipal planning Street lighting Municipal public transport Traffic and parking Storm water Control of public nuisance Water (potable) Fencing and fences Beaches and amusement facilities Licensing of dogs Billboards and the display of advertisements in public places
Licensing and control of undertakings that sell food to the public
Facilities for the accommodation, care and burial of animals
Cleansing
Local sport facilities Local amenities Cemeteries, funeral parlours and crematoria
Source: Makana IDP, 2008 Most of these functions are based in Grahamstown, but the municipality does also have well capacitated offices in Alicedale and Riebeeck East. It must be noted that this list is largely indicative of the power devolved to the local municipal level, but does not necessarily imply that the municipality is currently providing all the above stated services. 7.3 INSTITUTIONAL STRUCTURE The institutional structure is administratively headed by the municipal manager. The current organizational structure for the Makana Local Municipality makes provision for five directorates namely:
• Corporate Services • Community and Social Services • Finance • Technical and Infrastructural Services (including housing and land) • Local Economic Development
Figure 7.1 provides the high level operational institutional organogram, with associated mandates for each directorate. 7.3.1 STAFFING CAPACITY The Makana municipality had a staff complement of 547 permanent workers in 2008, excluding contract workers (Makana Annual report, 2008). According to the Cacadu District Municipal Capacity Report of 2009, the Makana municipality had a staff per capita ratio of 1:131 in 2007, with 39.39% of the Total operational expenditure (OPEX) dedicated to the staffing budget. This is within the national norm of 34% of municipality’s OPEX budget being

Local Economic Development Strategy Makana Municipality
© 2009 Urban-Econ Eastern Cape: Development Economists +27 41 585 6640 [email protected]
94
dedicated to staffing requirements. The Makana staffing composition is provided in Table 7.2. Discrepancies in employment figures throughout this profile may be explained by the fact that some records are for permanently employed workers, while others are for workers employed on a contractual basis. Table 7.2 Makana Staffing composition Directorate Number of people employed Offices of the Mayor and the Municipal Manager
9
Corporate Services 24 Community and Social Services 295 Finance 33 Technical and Infrastructural Services 191 Local Economic Development 4
Source: Makana Annual Report, 2008 The majority of municipal employees are employed in the community services and technical and infrastructural directorates. Within these respective directorates, the departments of parks & recreation, roads employed the most people. Labour turnover was 20% in the 2007‐2008 periods, with the most affected categories being technical and professional staff. The departments that are most affected by staff capacity shortages are: • Fire department; • Water and sanitation; and • Electricity department • Primary health (Makana Annual report, 2008)

Local Economic Development Strategy Makana Municipality
© 2009 Urban-Econ Eastern Cape: Development Economists +27 41 585 6640 [email protected]
95
Figure 7.1: Makana Organogram
Local Economic Development Strategy Makana Municipality
© 2009 Urban-Econ Eastern Cape: Development Economists +27 41 585 6640 [email protected]
96
7.3.2 LED in Makana There is a fully fledged directorate dedicated to LED, as mentioned earlier on in this profile. This represents an elevated status for the LED function in comparison to other similarly sized municipalities which often have an LED unit situated within other larger directorates and departments in their organisational structures. The presence of a fully fledged LED directorate in Makana creates scope for institutional capacity in terms of human capital and financial resources, as well as departmental focus and independence. The mandate of the LED directorate are presented in the organogram, Figure 7.1. This LED Strategy document forms part of the Makana municipality’s vision 2016. The LED directorate was allocated a budget of R4 269 730m for the 2008/2009 MTREF budget year (IDP, 2008). This is equal to 2.4% of the total municipal budget. This allocation is in line with the size of the LED directorate, which employs the smallest number of people of all the directorates. In terms of the LED directorate’s capacity, staffing is made up of:
• A Director • A Manager for Trade, Tourism and Investment • A Project Manager for Kaolin and mining • A Project manager for agriculture • An administrative officer • A secretary
There is no LED forum currently operating in the Makana Municipality. Attempts have previously been made to establish such a forum. There is a business chamber and a business forum which serve as interface platform between the Makana business sector and the Makana Municipality. However, these organizations are largely inactive and dormant. 7.4 INTERGOVERNMENTAL RELATIONS 7.4.1 COOPERATIVE GOVERNANCE MANDATE Cooperative governance in South Africa is a constitutional imperative as the Constitution explicitly makes provision for this mechanism. Chapter 3 of the National Constitution deals with cooperative governance. Government departments and agencies should co‐operate with one another in mutual trust and good faith by:
• Fostering friendly relations. • Assisting and supporting one another. • Informing one another of/ and consulting one another on matters of common interest. • Coordinating their actions and legislation with one another. • Adhere to agreed procedures; and • Avoiding legal proceedings against one another.
The South African cabinet approved a Draft Intergovernmental Relations Framework Bill on 15 November 2004. The aim of the bill is to provide an institutional framework for the different

Local Economic Development Strategy Makana Municipality
© 2009 Urban-Econ Eastern Cape: Development Economists +27 41 585 6640 [email protected]
97
spheres of government to facilitate coherent government, co‐ordination in the implementation of policy and legislation, effective provision of services and the monitoring of the implementation of policy and legislation. The Bill creates various structures on national, provincial and local level as well as on interdepartmental and inter‐sphere level to give effect to cooperative governance. In addition to the above statutes, there are a number of other policies and legislation which also provide for cooperative governance, but will not be covered here. Intergovernmental relations in the Makana Local Municipality consist of representation from different spheres of government. Examples of this are seen in the:
• IDP sector formation • The Makana Safety Forum • The IDP representative forum
7.4.2 NATIONAL AND PROVINCIAL DEPARTMENTS AND GOVERNMENTAL AGENCIES WITHIN MAKANA The following government departments or agencies have offices in Makana
• Agriculture • Correctional Affairs • Defence • Education • Labour • Home Affairs • Justice • Health • SEDA
Furthermore, the following institutions have developmental projects running in Makana:
• Department of Provincial and Local Government (DPLG) • Thina Sinako
7.4.3 INSTITUTIONAL STRUCTURE OF THE CACADU DISTRICT MUNICIPALITY According to the Cacadu District Municipality IDP 2008/09, the municipality currently has currently four departments all reporting to the Municipal Manager, which are:
• Infrastructure Services Department. • Economic Development Department. • Finance and Administration Department. • Community Services Department.
The Cacadu Economic Development Department is well staffed and can provide the Makana municipality with support in terms of LED and tourism.

Local Economic Development Strategy Makana Municipality
© 2009 Urban-Econ Eastern Cape: Development Economists +27 41 585 6640 [email protected]
98
7.5 SYNTHESIS This chapter has set out the institutional framework that is in place in Makana Local Municipality. This includes the all structures that deal with economic planning and development. The institutional structures and relations that exist in Makana have a direct impact on the area’s development. Municipal capacity, staffing levels and budgeting are all factors that determine the municipality’s growth trajectory. Intergovernmental relations between the Makana municipality, the Cacadu district municipality, and various tiers of government and public agencies are as vital in setting the local development agenda, as is the internal institutional structure of the Makana municipality. Municipal strengths and intergovernmental relations need to be leveraged in order for LED to be maximised. The LED strategy will take cognisance of the prevailing institutional profile to ensure that its implementation is not throttled.

Local Economic Development Strategy Makana Municipality
© 2009 Urban-Econ Eastern Cape: Development Economists +27 41 585 6640 [email protected]
99
CHAPTER 8: ECONOMIC POTENTIAL ANALYSIS The purpose of this section is to identify potential local economic development opportunities in Makana, based on the economic status quo within the municipality as presented in the preceding chapters. An opportunity and constraints assessment will help in identifying key opportunities and constraints unique to the local economy and this will be used to determine the development potential within Makana as a whole. This chapter will look at gaps between the current reality, and future potential on a general level, and on a sectoral level as well. The results of primary and secondary research undertaken will form the basis of the analysis made in this chapter. The economic potential analysis will serve as an initial source of input in the identification of projects could have a significant impact on the economy whilst ensuring future economic upliftment and growth. 8.1 GENERAL OPPORTUNITIES AND CONSTRAINTS This section provides some of the general opportunities and constraints that exist play a role in the development of the Makana municipality Table 8.1: General Opportunities For Development Opportunity Description Private Public Partnerships With the high level of government activity in the area,
PPPs may provide opportunities for private sector growth. The model of Settlers Hospital may be used as a successful case study on which to base such developments.
Expansion of academic facility offerings and improvement of academic institutional quality
This would entail the up‐scaling of academic facilities in the region to make Makana a centre of academic excellence. Diversification of the focus of educational facilities (to technical skills and vocational and improved township high schools) so as to appeal to a broader spectrum of needs and the establishment of various partnerships make up ways in which this opportunity may be exploited.
Improving links between current economic activity and presence of Rhodes University
This could be in the form of research institutes, enterprise and businesses that can leverage off the resource base and intellectual capital provided by Rhodes university through practical applications of research activity. Service sector activities such as business consulting could be explored in this regard.
Local Procurement Local procurement entails obtaining personnel, services, supplies, and equipment from local or indigenous sources. Local procurement could raise local skills levels, reduce the amount of income

Local Economic Development Strategy Makana Municipality
© 2009 Urban-Econ Eastern Cape: Development Economists +27 41 585 6640 [email protected]
100
leakage from the area and increase growth of local enterprise.
Shift towards a ‘Green Economy’ Since the local economy is relatively small in size, the cost of becoming more environmentally conscious is low in Makana, and provides opportunities for activity such as recycling, wind farms, etc.
Cultural products Cultural products in the form of arts and craft activities are linked with income generation, employment creation, tourism attraction , experiential education and improvements in the general quality of life of local residents.
Public works programs Given the high level of unemployment and poverty, and the need for basic infrastructure upgrading public works could provide periodic respite for local residents.
Linkages with private game reserves
Private game reserves present opportunities that transcend economic sectors (not just tourism) and could play a central role in the municipality’s spatial development. Private game reserves have links with the trade, agriculture and service sectors and promote expenditure in smaller settlements.
Formalisation of residents’ forum Due to its socio‐economic characteristics, Makana has a high resident participation level. Through a residents’ forum, this civic pride and involvement may be harnessed and channelled into pro‐development community based activity
Business growth through shift in focus to townships (Grahamstown East).
There exist vast opportunities for big businesses and SMMEs alike that will lead to economic and social upliftment and a realisation of township potential.
Table 8.2 General Constraints to Development Constraint Description Infrastructure Inadequate infrastructure provision acts as a deterrent
to business retention and attraction, and hinders balanced spatial development.
High level of poverty This leads to social exclusion and marginalisation Unemployment The inability of the economy to absorb labour and
create employment opportunities has the effect of eroding human capital and diminishing the scope for personal and communal development
High crime rate Makana experiences 97.02 crimes per 1000 people, which is a high level of crime such a small area. Furthermore, the crime rate has been growing over time. This may deter tourist arrivals and tarnish its good image,
Technical skills This means that many economic opportunities bypass

Local Economic Development Strategy Makana Municipality
© 2009 Urban-Econ Eastern Cape: Development Economists +27 41 585 6640 [email protected]
101
the majority of the population, further entrenching unemployment and poverty
Insufficient institutional capacity This cripples the municipality’s ability to create an environment that is conducive to growth
Dependence on non‐productive sectors
The largest contributor (49.8%) to the formal economy in Makana is the government sector, which is essentially a non productive sector of the economy (Quantec, 2009). This is undesirable from an economic point of view as the private sector (and not the public sector) should be the driver of the economy
Politicisation of economic matters This constraint afflicts both the public and private sector, and reduces overall transparency, efficiency and optimality of decision making and resource allocation.
Separation of the first and second economy
The second economy in Makana is isolated from the first economy (little interaction), which reduces its level of development produces low levels of growth
Brain drain There is a net outflow of educated people that could contribute immensely to the region’s development. Attraction and retention of skilled and critical human resources is a constraint to be tackled.
Institutional Fragmentation The low levels of interdepartmental interaction within the municipality limits scope for adoption of a holistic and integrated approach to development planning
8.2 AGRICULTURE Opportunities that could be explored include:
• The leveraging of emerging farmers. Emerging farmers have an organised presence in the area, which increases their capability to face challenges in a coordinated and coherent approach.
• Improved interaction, networking, mentorship and partnerships between commercial farmers and emerging farmers
• Training of emerging farmers in order for their mindset to shift to a more sustainable and profit‐driven orientation
• Increased land reform, redistribution and restitution, especially in the peri‐urban area where there is pressure on agricultural land because of limited land availability
• Expanded community based ostrich rearing and pepperdew cultivation • Niche activity such as stud horse farming • Exploration of alternate high value crops such as kikuyu, lucerne, pecan nuts, stone
fruit, pomegranates and aloe plants • Vegetables such as green pepper, cabbage, watermelons, grown intensively • Intensive rearing of animals such as rabbits, chickens and pigs
Constraints that presently inhibit agricultural development include:
• Mindset of some emerging farmers

Local Economic Development Strategy Makana Municipality
© 2009 Urban-Econ Eastern Cape: Development Economists +27 41 585 6640 [email protected]
102
• Limited availability of land, especially around urban areas • Limited support from the Department of Agriculture in comparison to levels of
support previously experienced. • Lack of agricultural extension officers, which reduced rate of skills transference and
learning‐by‐doing. • High running costs involved with inputs of things such as fuel and medicine for
livestock • Problems with water supply (droughts, low rainfall in some areas, water quality,
ground water resources, limited damming, borehole maintenance, etc) 8.3 MINING Opportunities that could be explored include:
• Increased production of quarry materials e.g. Crusher aggregate sand • Aggressive marketing campaign of kaolin from Makana (based on its latent
attributes) Constraints that presently inhibit mining development include:
• Low demand levels • Low resource prices (global and national Kaolin prices) • Competition from Western Cape based mines, and kaolin sources from other
countries • Environmental sensitivity of some of the areas where deposits are found • Reservations surrounding effect of mining of aesthetic appeal of Makana and
potential pollution produced. 8.4 MANUFACTURING Opportunities that could be explored include:
• Agri‐processing‐ there is currently very little agri‐processing activity that takes place in the area, despite agriculture having been historically important. This opportunity will see local value addition help reduce income leakage that arises from raw material being exported out of the area
• Small scale market driven manufacture of ceramic products and pottery based on kaolin production
• Niche industries based on local latent potential such as leather tanneries , chemical extraction of pineapple fibre and mohair processing
• Small manufacturing ventures such as bakeries, feedmills and brick making Constraints that presently inhibit manufacturing development include:
• Skill levels (especially for Makana Brick) • Absence of any large industrial activity • Small size of the Makana primary sector (agriculture and mining) limits the scope for
manufacturing activity • Location of Makana in relation to major industrial hubs

Local Economic Development Strategy Makana Municipality
© 2009 Urban-Econ Eastern Cape: Development Economists +27 41 585 6640 [email protected]
103
8.5 CONSTRUCTION Opportunities that could be explored include:
• Provision of retirement housing • Development of cluster accommodation for middle class market • Training of emerging construction contractors • More direct application of empowerment policies • Merger of small construction firms into consortiums to tender and apply for large,
high value construction projects. This will allow sharing of resources, and increase the available skills pool at the disposal of emerging building contractors.
• Capitalising on planned expansion of Rhodes University and the general construction market linked to Rhodes university (student and staff accommodation, etc)
Constraints that presently inhibit construction development include: • Difficulties is getting land zoned for development • Lack of municipal capacity and efficiency with regard to Technical and Infrastructural
services • Lack of available land for development in Grahamstown • High start‐up costs for emerging construction firms • Perceived limited prioritisation of emerging construction firms in terms of
procurement and purchasing policies of Rhodes University, government departments and the Makana municipality.
8.6 TRADE AND BUSINESS SERVICES Opportunities that could be explored include:
• Developing facilities for the secondary economy such as informal trading stands • Use of an investment attraction strategy to facilitate dissemination of information on
business opportunities and market information. • Improving transport linkages to Alicedale through road tarring could open up the
area to development • Expansion of business services into the township • Revitalisation of the Grahamstown CBD • Spin‐off businesses from Rhodes University such as those as that could piggy‐back of
the ICT infrastructure at Rhodes. Constraints that presently inhibit trade and business service development include:
• Limited market size in areas outside Grahamstown means there is no critical mass for business establishment and growth
• Decline in the revenue generating capability of the Grahamstown CBD • Lack of access to finance for potential SMMEs • Inadequate entrepreneurial business support from organisations such as SEDA • Poor state of some of the roads and other infrastructure, which increases the
effective cost of doing business in Makana • Small entrepreneurial base which means that only a few individuals own businesses.
This introduces inertia and reduces innovation and diversity of activity.

Local Economic Development Strategy Makana Municipality
© 2009 Urban-Econ Eastern Cape: Development Economists +27 41 585 6640 [email protected]
104
• Lack of awareness of potential business opportunities in Makana leads to low diversity and high concentration in a few forms of activity.
8.7 TOURISM Opportunities that could be explored include:
• Formalisation of Edu‐tourism • Nature based tourism based on diverse flora and fauna that is endemic to the
Makana region, and the fact that Makana is in a malaria free zone – these factors would appeal to international tourists
• Improving connections between different towns • Expansion of the Kwam e Makana and homestay concepts as a model for inclusive
community based involvement in tourism • Repackaging of Private Game Reserve product and marketing offerings to target local
tourists • Improved and coordinated external marketing of tourism packages • Bundling and clustering of activity to provide a varied experience, and increase
average stay lengths of visitors. • Increasing the long term sustained impact that festivals have on the local economy • Expansion of conferencing capability and capacity of Rhodes University based on
educational and other events • Railway based tourism targeting locomotive enthusiasts and linking up with heritage
tourism • Improved linkages between tourism sector and other economic sectors (e.g.
transport and agriculture) • Beautification of the Makana area through township greening, provision of sign
posts, ablutions, etc. • Increased partnership opportunities with the local municipality to provide better
access to resource, and allow for a more integrative approach to tourism development and management .
• Maximisation of business opportunities that come with seasonal booms in tourism demand (as experienced during Festival periods)
Constraints that presently inhibit tourism development include:
• Lack of support from district and provincial government • Challenges brought on by seasonality of tourist demand (sustainability of varying
occupancy levels) 8.8 SYNTHESIS This chapter provided a very broad and general outline of some of the opportunities and constraints to development that prevail in the Makana area. The economic potential analysis presented in this section will be used to identify strategic programmes and projects
Local Economic Development Strategy Makana Municipality
© 2009 Urban-Econ Eastern Cape: Development Economists +27 41 585 6640 [email protected]
105
that can drive economic growth and development in the future through the strategic framework for the LED strategy, which will be presented in the following sections.

Annexure 1: Expansions and explanation of SIC Sectors 1 Agriculture The agriculture sector incorporates establishments and activities that are primarily engaged in farming activities, but also includes establishments focusing on commercial hunting and game propagation and forestry, logging and fishing 2 Mining This sector includes the extracting, beneficiating of minerals occurring naturally, including solids, liquids and crude petroleum and gases. It also includes underground and surface mines, quarries and the operation of oil and gas wells and all supplemental activities for dressing and beneficiating for ores and other crude materials 3 Manufacturing This sector is broadly defined as the physical or chemical transformation of materials or compounds into new products and can be classified into 10 sub‐groups 4 Electricity and Water This sector includes the supply of electricity, gas and of water, the production, collection and distribution of electricity, the manufacture of gas and distribution of gaseous fuels through mains, supply of steam and hot water, and the collection, purification and distribution of water 5 Construction This sector includes the site preparation, building of complete constructions or parts thereof, civil engineering, building installation, building completion and the renting of construction or demolition equipment with operators 6 Trade The trade sector entails wholesale and commission trade; retail trade; repair of personal household goods; sale, maintenance and repair of motor vehicles and motor cycles; hotels, restaurant, bars, canteens, camping sites and other provision of short‐stay accommodation 7 Transport, storage and communication Transport as an economic sector refers to activities concerned with land transport, railway transport, water transport, transport via pipelines, air transport, activities of travel agencies, post and telecommunications, courier activities, as well as storage and warehousing activities 8 Financial and business services This sector includes inter alia financial intermediation; insurance and pension funding; real estate activities; renting or transport equipment; computer and related activities; research and development; legal; accounting; bookkeeping and auditing activities; architectural, engineering and other technical activities; and business activities not classification elsewhere 9 Government and community services This sector includes public administration and defence activities, activities of government, government departments and agencies, education, public and private; health and social work; sewerage and refuge disposal, sanitation and similar activities; activities of membership organisations; recreational, cultural and sporting activities; washing and dry‐cleaning of textiles and fur products, hairdressing and other beauty treatment, funeral and related activities
(Source: SIC, 2005)
![Gillimberg Farm, Part I: A Pilot Struggles to Take · PDF file2.1 StateLand 2.1.1 500,000ha+[thiswaspresumablyintended tobe50,000ha]6 2.1.2 LebowaDevelopmentCorporation 2.1.3 Statefarming](https://static.fdocuments.in/doc/165x107/5ab889207f8b9aa6018cc579/gillimberg-farm-part-i-a-pilot-struggles-to-take-stateland-211-500000hathiswaspresumablyintended.jpg)