LED LIGHTING TECHNOLOGY TRIAL Product Performance Result ... · TECHNOLOGY TRIAL Product...
28
LED LIGHTING TECHNOLOGY TRIAL Product Performance Result Report March 2012 Prepared for: Prepared by: ADM Associates, Inc. 3239 Ramos Circle Sacramento, CA 95827 916-363-8383
-
Upload
hoangquynh -
Category
Documents
-
view
213 -
download
0
Transcript of LED LIGHTING TECHNOLOGY TRIAL Product Performance Result ... · TECHNOLOGY TRIAL Product...

LED LIGHTING TECHNOLOGY TRIAL
Product Performance Result Report
March 2012
Prepared for:
Prepared by:
ADM Associates, Inc.
3239 Ramos Circle
Sacramento, CA 95827
916-363-8383

i
TABLE OF CONTENTS
Section Title Page
1. Executive Summary .....................................................................................2
2. Project Background ......................................................................................3
3. M&V Methodology .....................................................................................6
4. Impact Evaluation Findings .......................................................................12
5. Discussion of Key Findings .......................................................................14
6. Recommendations ......................................................................................15
7. Appendix A: LED Spec Sheets ..................................................................16

Executive Summary 2
1. EXECUTIVE SUMMARY
This report provides the results of a LED lighting technology trial. Conventional lighting was
replaced with LED lighting in a small sample of fixtures around State of Nevada facilities. The
primary location in the technology trial was the Legislative Building in Carson City, Nevada.
The study included replacement of linear fluorescent lights, compact fluorescent lights (CFL),
recessed metal halide (MH), and exterior high intensity discharge (HID) as baseline lighting. All
were replaced with LED lighting that was designed for the appropriate application of the original
fixtures.
A total of 67 fixtures were part of the trial. Some fixtures were retrofitted and others were
replaced. The total baseline connected capacity of the lighting was 6.90 kW while the installed
LED lighting capacity was 1.59 kW. The technology trial started in September 2010 and ended
in December 2011. Implementation occurred at various times but was primarily conducted in
September 2010, November 2010, and September 2011. The state legislature was in-session
from February 2011 to June 2011, during which no trial-related activity could be conducted on
site.
The lighting was monitored to document the hours of operation and energy usage. Monitoring
equipment was in place for over a year. Monitoring occurred during legislative in-session
periods and out-of-session periods. Light levels were measured in a sample of locations.
The savings analysis was based on the monitored data and rated watts of the baseline and newly
installed lighting. The total savings for the LED lighting technology trial is 12,439 kWh per year
when the legislature is in-session and about 1,000 kWh less for years when it is not in-session.
This represents 79% energy savings. The maximum critical peak demand savings is 2.53 kW
and occurs in March, which is a shoulder month during which the legislature is in-session. As a
comparison the critical peak demand savings in July is 1.14 kW. Table 1-1 summarizes the
energy impacts for the program for a year that the legislature is in-session. Lighting levels were
reduced as result of the installation of LEDs but still within recommended levels.
Table 1-1. Summary of Energy Impacts for the LED Lighting Technology Trial
Area Type
Pre Energy Use,
kWh/yr
Post Energy Use,
kWh/yr
Energy Savings,
kWh/yr
Percent Energy
Savings, %
Exterior 7,824 1,400 6,424 82.1%
Interior 7,541 1,811 5,729 76.0%
Office 415 130 286 68.8%
Total 15,780 3,341 12,439 78.8%
ADM’s recommendation is to conduct trials in locations that have typical schedules of operation
for a majority of potential applications of the measure.

Project Background 3
2. PROJECT BACKGROUND
This project provides a public display of LED lighting technology supported by NV Energy. The
Nevada State Legislative Building shown in Figure 1 is an appropriate setting to demonstrate the
state’s commitment to energy conservation. Most of the project was implemented near the West
entrance of the building; the floor plan is shown in Figure 2. International Energy Conservation
and Deco Lights, Inc. were instrumental in the implementation of the lighting measures for this
project.
Figure 1. Nevada State Legislative Building. Figure 2. Legislative Building Floor Plan.
The original (left) and new exterior lighting (right) for the flagpole and building dome are shown
in Figure Figure 3.
Figure 3. Original (left) HID and New (right) LED Flagpole and Dome Lighting.
N

LED Lighting Technology Trial Report – NV Energy March 2012
Project Background 4
Lighting over the foyer stairway, as shown in Figure 4, was one of the areas chosen as part of the
lighting trials. Figure 5 shows the old and new lighting for the ceiling above the stairway.
Figure 4. Foyer Stairway Lighting.
Figure 5. Original (left) MH and New (right) LED Stairway Lighting.
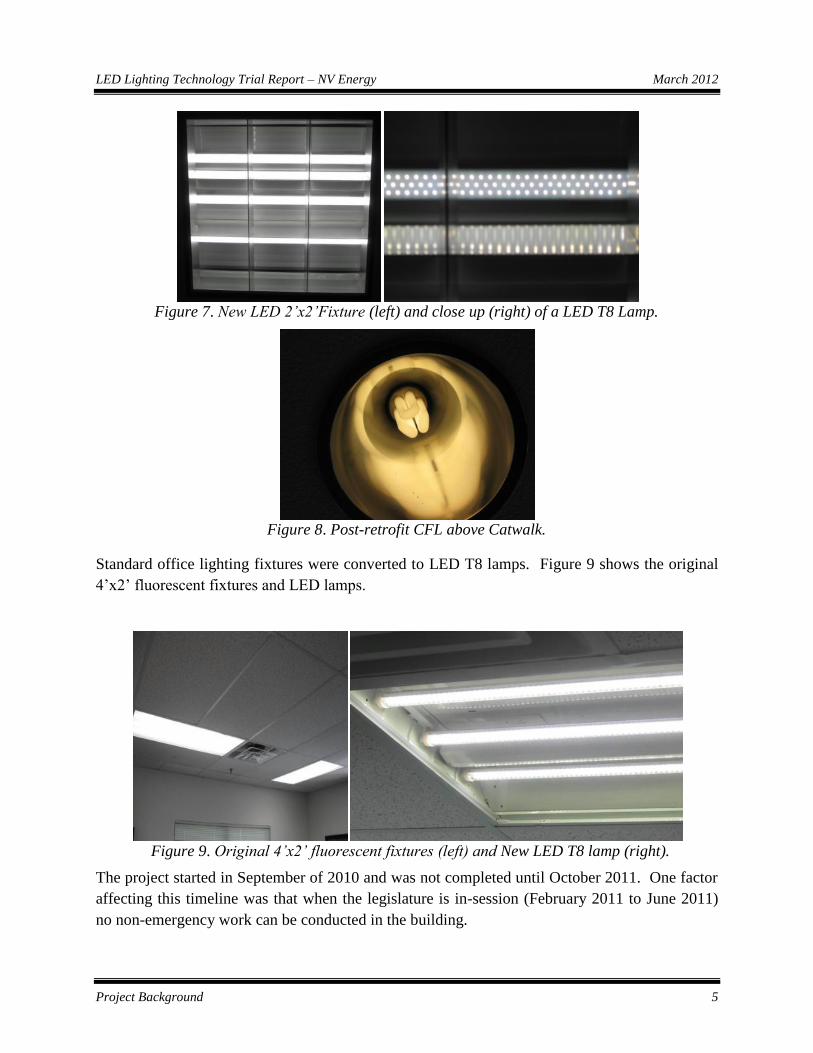
Lighting in the back of the foyer on the first floor shown in Figure 6 was also included in the
lighting trials. Figure 7 shows the new LED lighting for the 2’x2’ fixtures and a close up of the
LEDs. Figure 8 shows another pre-retrofit ceiling mounted recessed can fixture with a CFL.
Figure 6. Original 2’ x 2’ fluorescent fixtures at back of Foyer (left) and up close (right).
LED Lighting Technology Trial Report – NV Energy March 2012
Project Background 5
Figure 7. New LED 2’x2’Fixture (left) and close up (right) of a LED T8 Lamp.
Figure 8. Post-retrofit CFL above Catwalk.
Standard office lighting fixtures were converted to LED T8 lamps. Figure 9 shows the original
4’x2’ fluorescent fixtures and LED lamps.
Figure 9. Original 4’x2’ fluorescent fixtures (left) and New LED T8 lamp (right).
The project started in September of 2010 and was not completed until October 2011. One factor
affecting this timeline was that when the legislature is in-session (February 2011 to June 2011)
no non-emergency work can be conducted in the building.
M&V Methodology 6
3. M&V METHODOLOGY
This chapter provides a description of the M&V methodologies applied by ADM in the
evaluation of the LED performance. The M&V approach for the project is aimed at the
following:
Site Selection
Monitoring Equipment
Summary of Data and Analysis Approach
In August 2010, ADM investigated an M&V approach that would measure the trial savings.
3.1 SITE SELECTION
The site was selected to provide a showcase as well as a demonstration site of new LED lighting.
The main building selected is the Nevada Legislative Building at 401 South Carson Street in
Carson City. Exterior lighting, foyer and atrium areas open to the public were targeted.
In addition, an office for the Director of the Nevada State Office of Energy was also included in
the demonstration. That office is located near to the Nevada Legislative Building at 755 North
Roop Street, Suite 202 in Carson City.
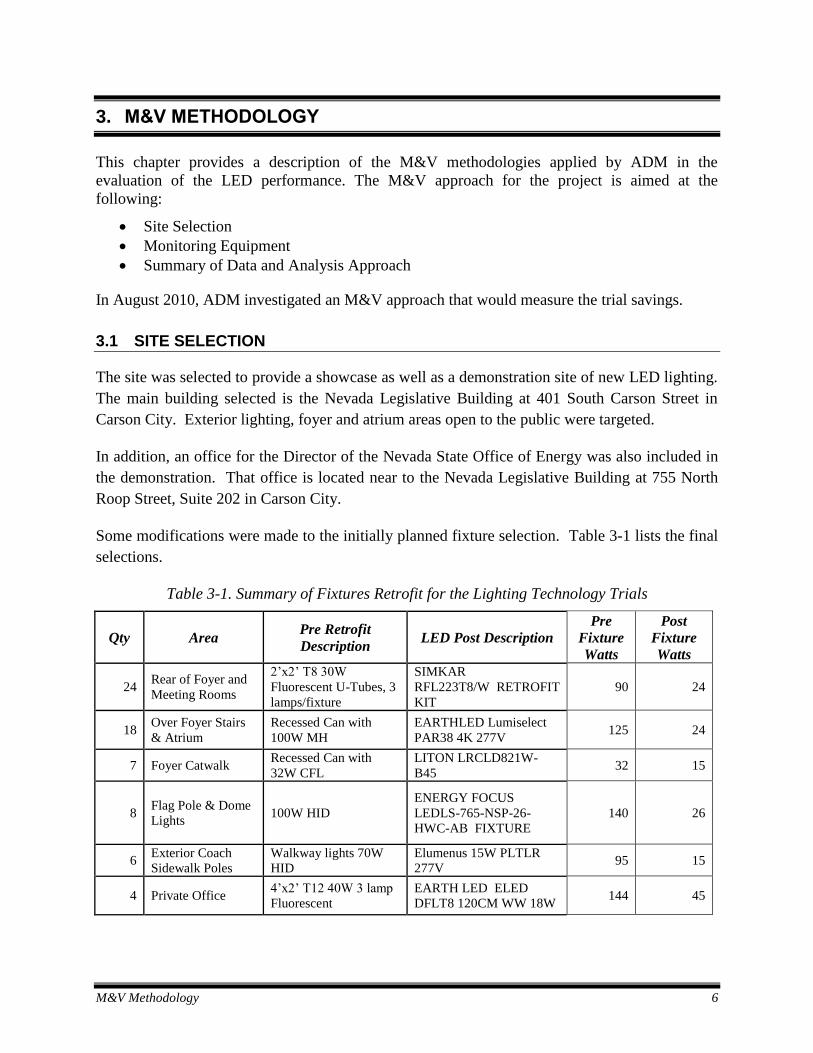
Some modifications were made to the initially planned fixture selection. Table 3-1 lists the final
selections.
Table 3-1. Summary of Fixtures Retrofit for the Lighting Technology Trials
Qty Area Pre Retrofit
Description LED Post Description
Pre
Fixture
Watts
Post
Fixture
Watts
24 Rear of Foyer and
Meeting Rooms
2’x2’ T8 30W
Fluorescent U-Tubes, 3
lamps/fixture
SIMKAR
RFL223T8/W RETROFIT
KIT
90 24
18 Over Foyer Stairs
& Atrium
Recessed Can with
100W MH
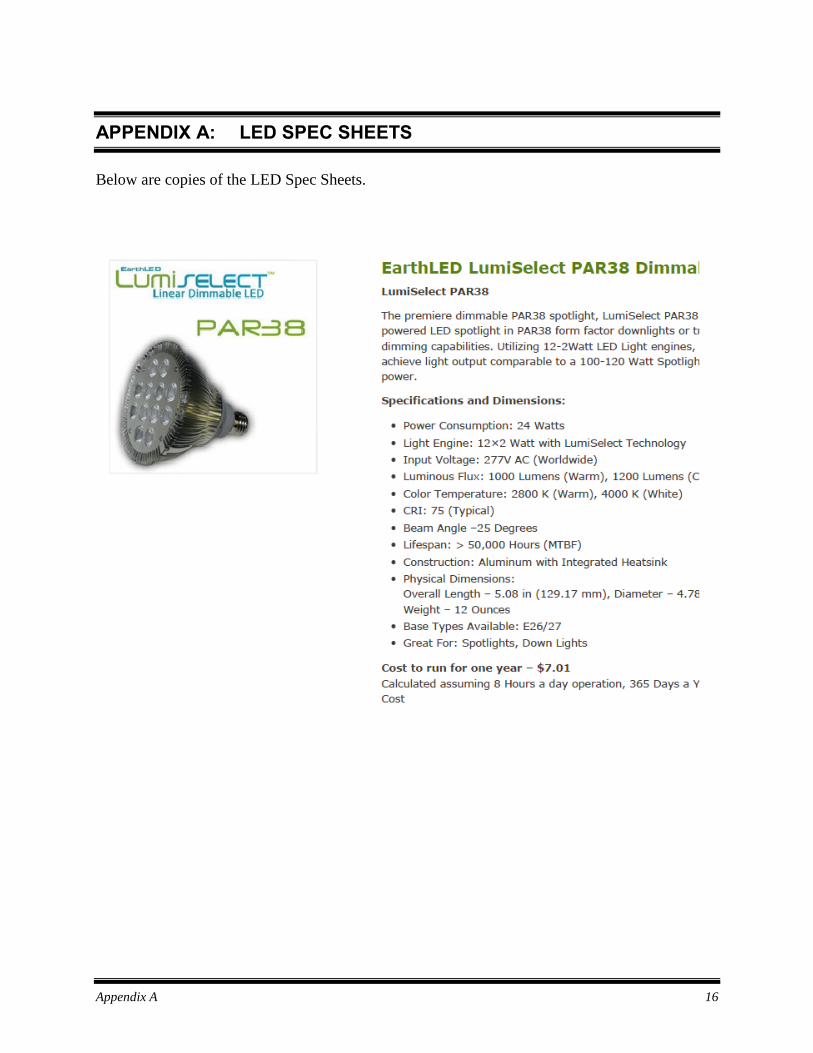
EARTHLED Lumiselect
PAR38 4K 277V 125 24
7 Foyer Catwalk Recessed Can with
32W CFL
LITON LRCLD821W-
B45 32 15
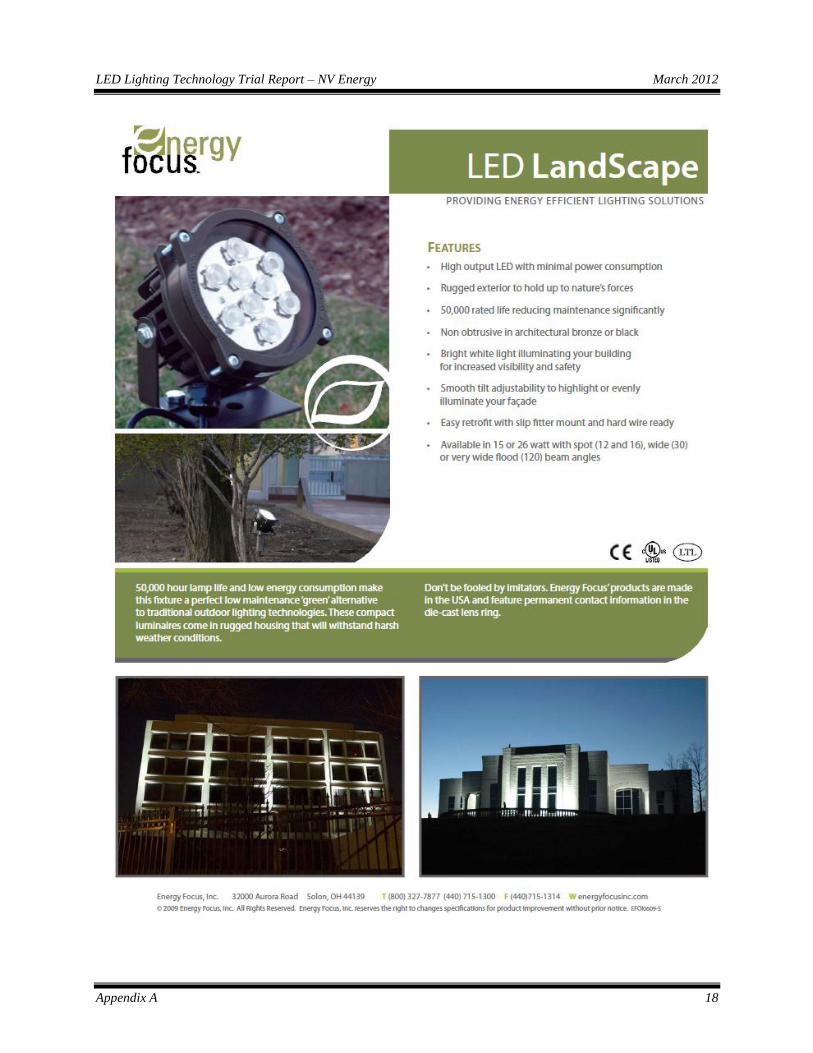
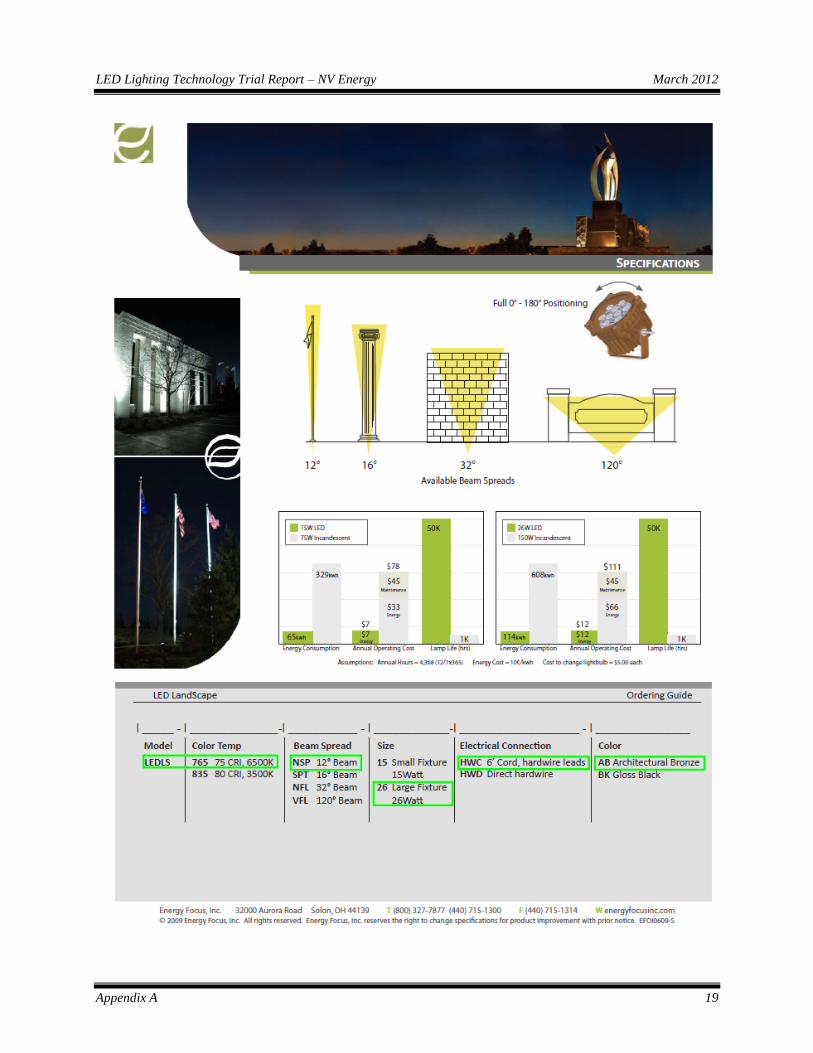
8 Flag Pole & Dome
Lights 100W HID
ENERGY FOCUS
LEDLS-765-NSP-26-
HWC-AB FIXTURE
140 26
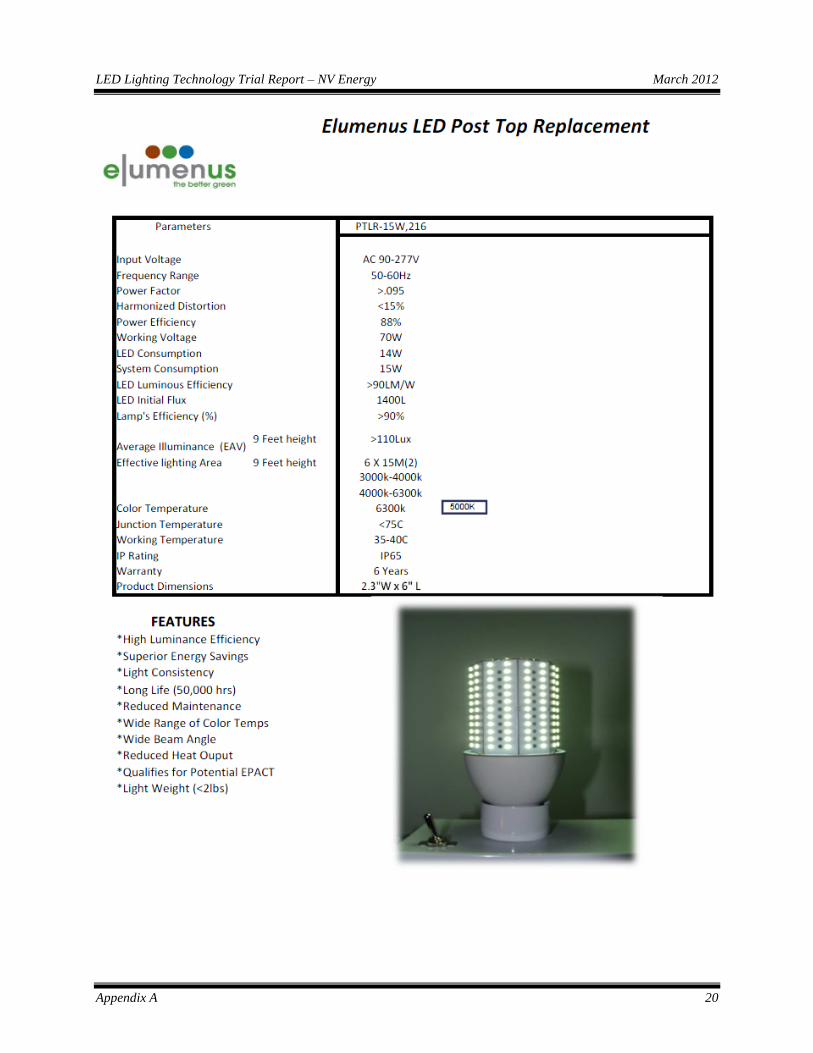
6 Exterior Coach
Sidewalk Poles
Walkway lights 70W
HID
Elumenus 15W PLTLR
277V 95 15
4 Private Office 4’x2’ T12 40W 3 lamp
Fluorescent
EARTH LED ELED
DFLT8 120CM WW 18W 144 45

LED Lighting Technology Trial Report – NV Energy March 2012
M&V Methodology 7
The total baseline connected lighting capacity is 6.90 kW, inclusive of 4.63 kW for foyer and
related lighting, 1.69 kW for exterior lighting and 0.58 kW for the office lighting. The total LED
connected lighting capacity for these fixtures is 1.59 kW, inclusive of 1.11 kW for foyer and
related lighting, 0.30 kW for exterior lighting and 0.18 kW for the office lighting. The reduction
in total connected capacity is 5.31 kW. Appendix A contains manufacturer’s specification sheets
for the LED lighting used for this project.
3.2 MONITORING EQUIPMENT
ADM used two types of data loggers for this project: Hobo external channel loggers, used to
record lighting circuit breaker current, and Hobo light On/Off loggers. Current transformers
(CT) were used to measure lighting circuit breaker current as input to the Hobo U12-006 loggers.
The CTs have an accuracy of ± 1% from 10% to 100% of full scale, ± 3% at 5% of full scale,
and ±5% at 2% of full scale. For the baseline period, three 30 Amp rated CTs were installed in
the Legislative Building and 5 and 20 Amp CTs were used for the post-retrofit period. They
monitored circuit breakers 4, 8, & 10 in Panel 1HB. The logger was initially set to record data
on 5-minute intervals. The interval was increased to 15-minutes during a follow-up visit so that
the logger would have memory to last through the majority of the legislative in-session period
during which logger access was not permitted. One-time power measurements were made using
an AEMC 3910 True rms power meter. One-time readings of Volts, Amps, power and power
factor were made on several lighting circuits.
In the Energy Office two Hobo U9-002 Lighting Loggers were used. These loggers record date
and time stamps when lighting fixtures are turned on or off. In the monitored office there were
two wall switches for bi-level control. One switch controlled two fluorescent four foot fixtures
and the other switch controlled two separate fixtures, one of which had already been retrofitted
with LED lamps.
Additionally, light level measurements were made using a Davis Light Meter with capability of
foot-candle and Lux scales.
3.3 SUMMARY OF DATA AND ANALYSIS APPROACH
The current recording Hobo logger was installed on September 9, 2010 and removed on
December 27, 2011. Data were downloaded multiple times. Although the lighting circuits that
were monitored contained the fixtures originally planned for retrofit, they did not necessarily
cover all of the fixtures that were ultimately retrofitted with LED lighting. From the data it was
determined that circuit breaker 10 exclusively monitored the eight flag pole and dome lights. As
the data was for exterior lights, the profile was also used to represent the exterior walkway pole
lights. The data from the other two circuits were combined to represent the profile of other

LED Lighting Technology Trial Report – NV Energy March 2012
M&V Methodology 8
interior lighting for the Legislative Building. The maximum monitored kW of the combined
circuits was normalized to the capacity of the lighting listed in the first three rows of Table 3-1.
The exterior lighting (representing the fourth and fifth rows of other Table 3-1) was charted
together as a combined profile. The profile was found not to vary by weekday or weekend or by
in-session versus out-of-session for the legislature, but it did have a seasonal dependence.
Figure 10. Average Exterior Lighting Profiles for the Original Baseline and New LED Lighting.
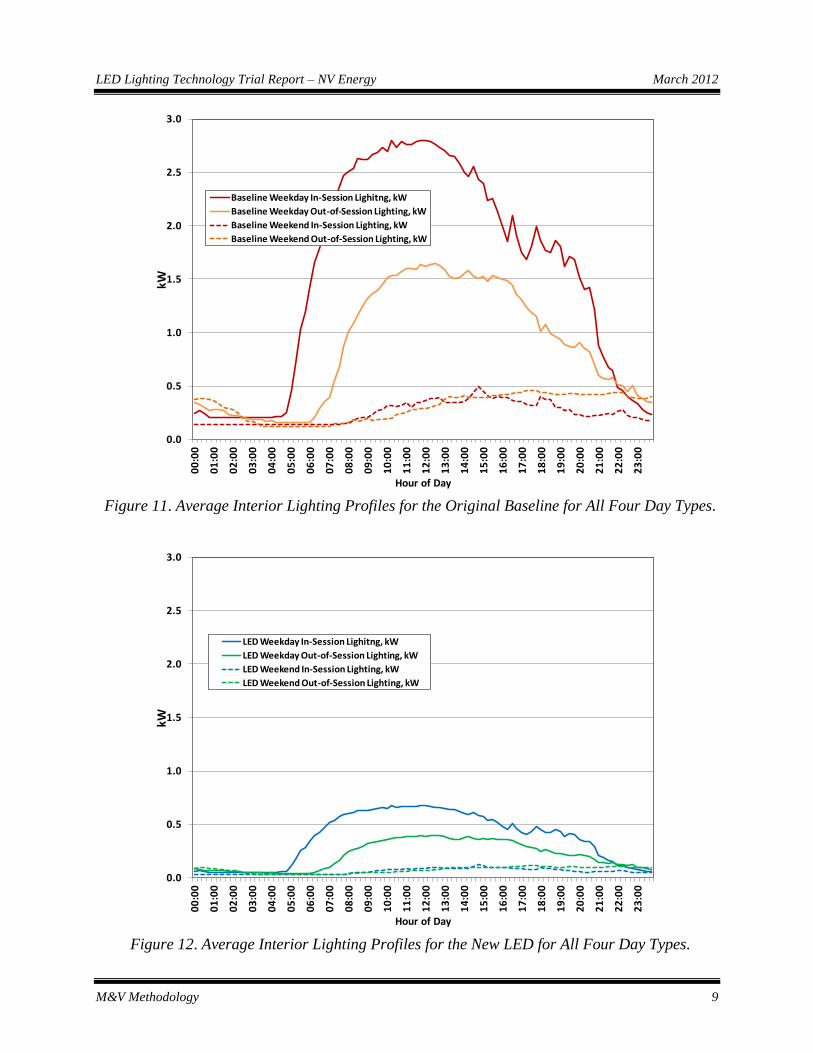
The interior lighting profiles were separated and averaged into four day type profiles: weekday
in-session, weekday out-of-session, weekend in-session, and weekend out-of-session. In-session
for the legislature ran from February 7, 2011 to June 7, 2011. The legislature is only in-session
during odd years from the first Monday in February and runs for a maximum of 120 days except
when a special session is called. Only baseline data for the interior lighting in-session period
were monitored. The in-session baseline data was used to generate in-session LED lighting
profiles by scaling the rated capacity of the new to the old fixture watts. The baseline and new
lighting average profiles are presented in Figure 11 and Figure 12 and respectively. The annual
savings analysis is based on a year when the legislature is in-session. Savings will be less on
even years. The average lighting profiles for the original baseline and new were developed using
data from September 2010 through June 2011.
0.0
0.2
0.4
0.6
0.8
1.0
1.2
1.4
1.6
1.8
2.0
00
:00
01
:00
02
:00
03
:00
04
:00
05
:00
06
:00
07
:00
08
:00
09
:00
10
:00
11
:00
12
:00
13
:00
14
:00
15
:00
16
:00
17
:00
18
:00
19
:00
20
:00
21
:00
22
:00
23
:00
kW
Hour of Day
Baseline Exterior Lighting, kW
LED Exterior Lighting, kW
LED Lighting Technology Trial Report – NV Energy March 2012
M&V Methodology 9
Figure 11. Average Interior Lighting Profiles for the Original Baseline for All Four Day Types.
Figure 12. Average Interior Lighting Profiles for the New LED for All Four Day Types.
0.0
0.5
1.0
1.5
2.0
2.5
3.0
00
:00
01
:00
02
:00
03
:00
04
:00
05
:00
06
:00
07
:00
08
:00
09
:00
10
:00
11
:00
12
:00
13
:00
14
:00
15
:00
16
:00
17
:00
18
:00
19
:00
20
:00
21
:00
22
:00
23
:00
kW
Hour of Day
Baseline Weekday In-Session Lighitng, kW
Baseline Weekday Out-of-Session Lighting, kW
Baseline Weekend In-Session Lighting, kW
Baseline Weekend Out-of-Session Lighting, kW
0.0
0.5
1.0
1.5
2.0
2.5
3.0
00
:00
01
:00
02
:00
03
:00
04
:00
05
:00
06
:00
07
:00
08
:00
09
:00
10
:00
11
:00
12
:00
13
:00
14
:00
15
:00
16
:00
17
:00
18
:00
19
:00
20
:00
21
:00
22
:00
23
:00
kW
Hour of Day
LED Weekday In-Session Lighitng, kW
LED Weekday Out-of-Session Lighting, kW
LED Weekend In-Session Lighting, kW
LED Weekend Out-of-Session Lighting, kW

LED Lighting Technology Trial Report – NV Energy March 2012
M&V Methodology 10
The last row of Table 3-1 is for the Director’s office of the Nevada State Office of Energy. This
office has two wall switches and is considered bi-level lighting which is an energy conservation
feature. This office is not in the legislature building and is in operation like a typical office, year
round. The initial monitoring of this office was conducted after only one fixture was retrofitted
with LED lighting. The savings was based on all four fixtures being retrofitted with LED
lighting. On/Off lighting loggers were used to monitor the fixtures, one on each switch. The
data are then used to illustrate profiles as percent time on as shown in Figure 13. These data
suggest that the occupant of the office was energy conscious as he or she generally only turned
one switch on and would turn the lights off when leaving the room. Switch 1 is used for 1,333
hours per year and switch 2 is used for 110 hours per year. This conserves energy but actually
reduces the savings when factoring in the installation of low wattage light fixtures.
Figure 13. Average Office Lighting Percent Time On Profiles for Two Day Types and Switches.
Lighting level measurements in footcandles were taken for baseline and post retrofit in the foyer
areas. The lighting measurements for the areas involved were compromised by ambient daylight
coming in through the windows. Additionally the season and sun angles were also different and
added to the discrepancies. The back of the foyer lighting levels fell from 45 footcandles to 20
footcandles and near the front corner of the foyer lighting levels fell from 66 to 25 footcandles.
0
10
20
30
40
50
60
70
80
90
100
00
:00
01
:00
02
:00
03
:00
04
:00
05
:00
06
:00
07
:00
08
:00
09
:00
10
:00
11
:00
12
:00
13
:00
14
:00
15
:00
16
:00
17
:00
18
:00
19
:00
20
:00
21
:00
22
:00
23
:00
Per
cen
t Tim
e O
n, %
Hour of Day
Switch 1, Weekdays
Switch 2, Weekdays
Switch 1, Weekends
Switch 2, Weekends

LED Lighting Technology Trial Report – NV Energy March 2012
M&V Methodology 11
Twenty footcandles is an acceptable lighting level for lobbies based on Illuminating Engineering
Society (IES) recommendations1.
1 http://www.facilities.rochester.edu/ppm/designstandards/pdf/16500_new.pdf
Impact Evaluation Findings 12
4. IMPACT EVALUATION FINDINGS
This chapter provides detailed results pertaining to the energy and demand impacts during a
legislative session year.
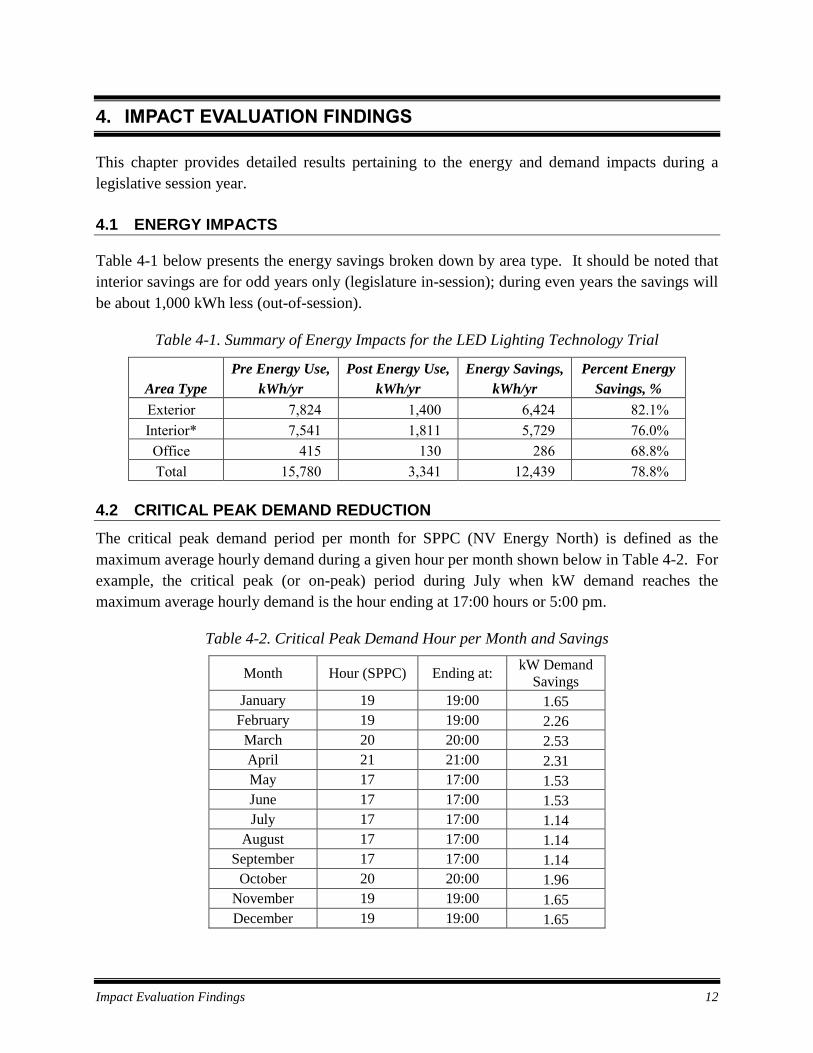
4.1 ENERGY IMPACTS
Table 4-1 below presents the energy savings broken down by area type. It should be noted that
interior savings are for odd years only (legislature in-session); during even years the savings will
be about 1,000 kWh less (out-of-session).
Table 4-1. Summary of Energy Impacts for the LED Lighting Technology Trial
Area Type
Pre Energy Use,
kWh/yr
Post Energy Use,
kWh/yr
Energy Savings,
kWh/yr
Percent Energy
Savings, %
Exterior 7,824 1,400 6,424 82.1%
Interior* 7,541 1,811 5,729 76.0%
Office 415 130 286 68.8%
Total 15,780 3,341 12,439 78.8%
4.2 CRITICAL PEAK DEMAND REDUCTION
The critical peak demand period per month for SPPC (NV Energy North) is defined as the
maximum average hourly demand during a given hour per month shown below in Table 4-2. For
example, the critical peak (or on-peak) period during July when kW demand reaches the
maximum average hourly demand is the hour ending at 17:00 hours or 5:00 pm.
Table 4-2. Critical Peak Demand Hour per Month and Savings
Month Hour (SPPC) Ending at: kW Demand
Savings
January 19 19:00 1.65
February 19 19:00 2.26
March 20 20:00 2.53
April 21 21:00 2.31
May 17 17:00 1.53
June 17 17:00 1.53
July 17 17:00 1.14
August 17 17:00 1.14
September 17 17:00 1.14
October 20 20:00 1.96
November 19 19:00 1.65
December 19 19:00 1.65

LED Lighting Technology Trial Report – NV Energy March 2012
Impact Evaluation Findings 13
Critical peak demand savings (kW savings) are calculated by month, utilizing study savings
determinations and appropriate measure-level, 8760-hour load shapes. The result is savings per
hour for all 8760 hours of the typical calendar year. The results are then inspected for each
month to identify the maximum average hourly demand by hour per month, as shown in Table
4-2.
Key Findings 14
5. DISCUSSION OF KEY FINDINGS
This technology trial found that there were 12,439 kWh energy savings per year when the
legislature is in-session. This is a 79% energy savings. The savings during a year the legislature
is out-of-session will be about 1,000 kWh less. The critical peak demand savings in July is 1.14
kW. The maximum critical peak demand savings in a legislative year is 2.53 kW and occurs in
March which is a shoulder month.
Inconclusive results for the lighting levels indicate that the lighting level will satisfy IES
standards. The lighting level was reduced, but to quantify the level a more rigorous approach
would be needed for this application where abundant daylighting is available. This approach
would require access during night hours and the ability to control the lights in the space during
the testing period.

Recommendations 15
6. RECOMMENDATIONS
The implementation of LED lighting can provide significant savings. Both energy and demand
savings are easily generated. One recommendation is to ensure that the replacement LED
lighting will not reduce lighting below acceptable levels. The cost of LED lighting is higher than
traditional lighting but the cost is rapidly declining. Incentives for LED lighting will promote a
measure with a long effective useful life.
To produce the best study results a technology trail should be implemented in a location where
the operation is typical for a majority of potential applications. The trial would also be selected
for a location where the measure can be exclusively monitored without cross interference from
other loads. A site should be selected that does not have access restrictions that can delay the
implementation or study of the measure.
Appendix A 16
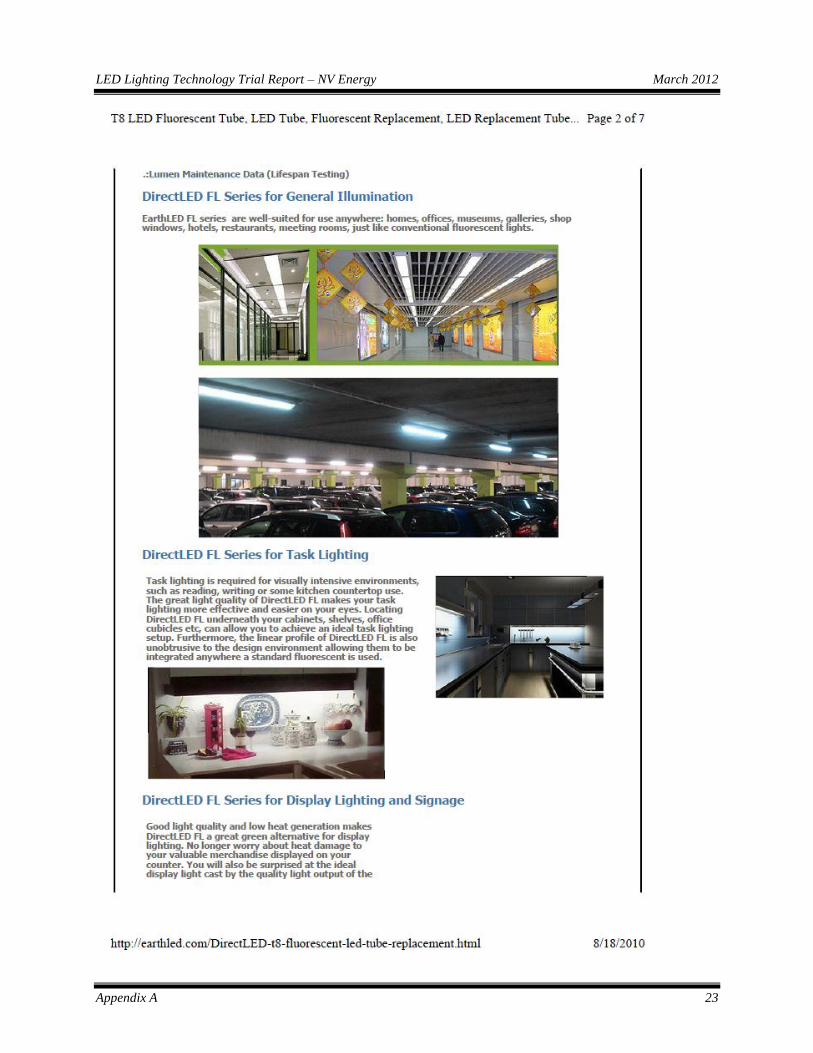
APPENDIX A: LED SPEC SHEETS
Below are copies of the LED Spec Sheets.

LED Lighting Technology Trial Report – NV Energy March 2012
Appendix A 17
LED Lighting Technology Trial Report – NV Energy March 2012
Appendix A 18
LED Lighting Technology Trial Report – NV Energy March 2012
Appendix A 19
LED Lighting Technology Trial Report – NV Energy March 2012
Appendix A 20

LED Lighting Technology Trial Report – NV Energy March 2012
Appendix A 21

LED Lighting Technology Trial Report – NV Energy March 2012
Appendix A 22
LED Lighting Technology Trial Report – NV Energy March 2012
Appendix A 23

LED Lighting Technology Trial Report – NV Energy March 2012
Appendix A 24

LED Lighting Technology Trial Report – NV Energy March 2012
Appendix A 25

LED Lighting Technology Trial Report – NV Energy March 2012
Appendix A 26

LED Lighting Technology Trial Report – NV Energy March 2012
Appendix A 27