Lectures on Medical Biophysics Dept. Biophysics, Medical faculty, Masaryk University in Brno.
69
Lectures on Medical Biophysics Dept. Biophysics, Medical faculty, Masaryk University in Brno
-
Upload
elwin-mccarthy -
Category
Documents
-
view
226 -
download
1
Transcript of Lectures on Medical Biophysics Dept. Biophysics, Medical faculty, Masaryk University in Brno.

Lectures on Medical Biophysics
Dept. Biophysics, Medical faculty, Masaryk University in Brno
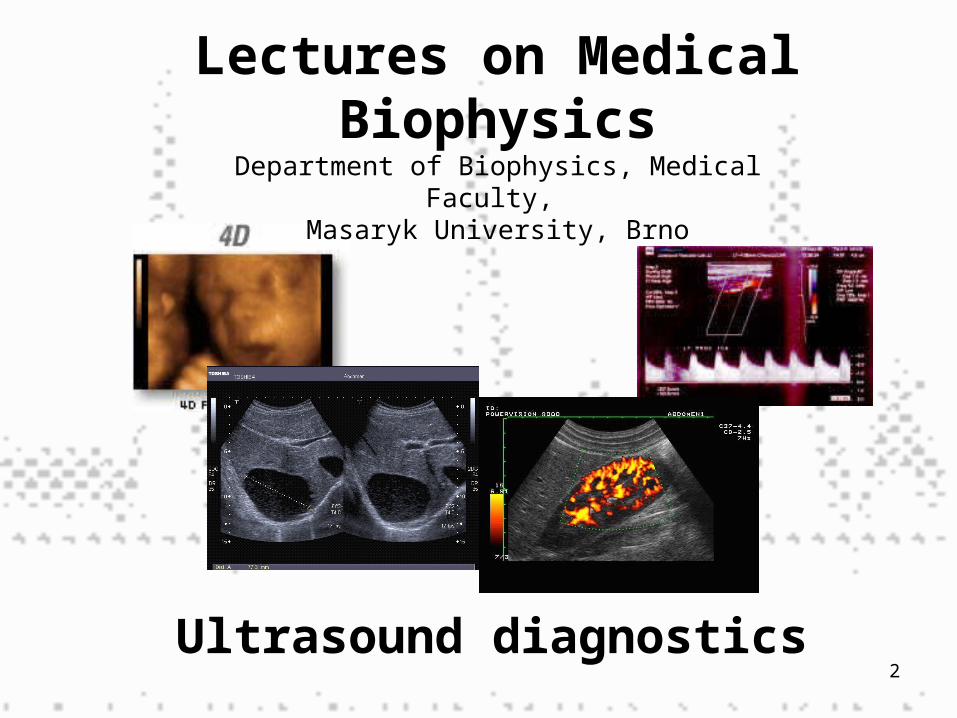
2Ultrasound diagnostics
Lectures on Medical Biophysics
Department of Biophysics, Medical Faculty, Masaryk University, Brno

3
Lecture outline Physical properties of ultrasound and acoustic parameters of medium Ultrasonography
• Impulse reflection method• A-mode – one-dimensional• B-mode – two-dimensional• M-mode• Basic characteristics of US images• Interventional sonography• Echocontrast agents • Harmonic imaging• Principle of 3D imaging
Doppler flow measurement• Principle of Doppler effect• Principle of blood flow measurement• CW Doppler system• Systems with pulsed wave – PW Doppler• Duplex and Triplex methods• Power Doppler method• Tissue Doppler Imaging (TDI)
Ultrasonic densitometry Patient Safety: reducing Ultrasound ‘Doses’
4
Ultrasound diagnostics Ultrasound diagnostics started to develop in early 50‘
of 20th century. It allows to obtain cross-sectional images of the human body which can also include substantial information about its physiology and pathology.
Ultrasound diagnostics is based mainly on reflection of ultrasound waves at acoustical interfaces
We can distinguish:
– Ultrasonography (A, B and M mode, 3D and 4D imaging)– Doppler flow measurement, including Duplex and Triplex
methods (Duplex, Colour Doppler, Triplex, Power Doppler)– Tissue Doppler imaging– Ultrasound densitometry
5
Physical properties of ultrasound
Before we will deal with diagnostic devices, we need to understand what is ultrasound and what are the main acoustical properties of medium.
Ultrasound (US) is mechanical oscillations with frequency above 20 kHz which propagate through an elastic medium.
In liquids and gases, US propagates as longitudinal waves.
In solids, US propagates also as transversal waves.

6
Interactions of US with Tissue Reflection (smooth homogeneous interfaces of size greater than
beam width, e.g. organ outlines)
Rayleigh Scatter (small reflector sizes, e.g. blood cells, dominates in non-homogeneous media)
Refraction (away from normal from less dense to denser medium, note opposite to light, sometimes produces distortion)
Absorption (sound to heat)– absorption increases with f, note opposite to X-rays– absorption high in lungs, less in bone, least in soft tissue, again note
opposite to x-rays
Interference: ‘speckles’ in US image result of interference between Rayleigh scattered waves. It is an image artefact.
Diffraction

7
Acoustic parameters of medium:
Interaction of US with medium – reflection and back-scattering, refraction, attenuation (scattering and absorption)

8
Acoustic parameters of medium
Speed of US c depends on elasticity and density of the medium:
K - modulus of compression
in water and soft tissues c = 1500 - 1600 m.s-1, in bone about 3600 m.s-1

9
Attenuation of US expresses decrease of wave amplitude along its trajectory. It depends on frequency
Ix = Io e-2x = ´.f2
Ix – final intensity, Io – initial intensity, 2x – medium layer thickness (reflected wave travels „to and fro“), - linear attenuation coefficient (increases with frequency).Since
= log10(I0/IX)/2x
we can express in units dB/cm. At 1 MHz: muscle 1.2, liver 0.5, brain 0.9, connective tissue 2.5, bone 8.0
Acoustic parameters of medium
10
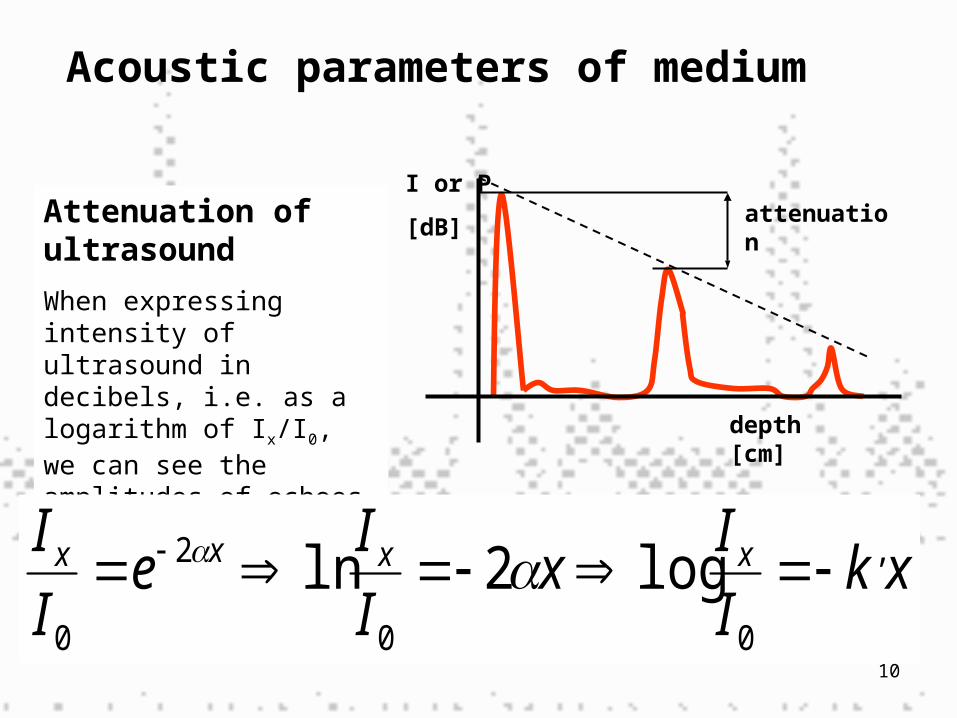
Acoustic parameters of medium
Attenuation of ultrasound
When expressing intensity of ultrasound in decibels, i.e. as a logarithm of Ix/I0, we can see the amplitudes of echoes to decrease linearly.
xkI
Ix
I
Ie
I
I xxxx ,
00
2
0
log2ln
depth [cm]
I or P
[dB]attenuation

11
Acoustic impedance: product of US speed c and medium density
Z = . c (Pa.s/m)
Z.10-6: muscles 1.7, liver 1.65 brain 1.56, bone 6.1, water 1.48
Acoustic parameters of medium

12
We suppose perpendicular incidence of US on an interface between two media with different Z - a portion of waves will pass through and a portion will be reflected (the larger the difference in Z, the higher reflection).
Acoustic parameters of medium: US reflection and transmission on interfaces
P1 Z 2 - Z 1
R = ------- = --------------- P Z2 + Z1
P2 2 Z 1
D = ------- = --------------- P Z2 + Z1
Z
ROZHRANÍ
P P2
1P
Z1 2
Coefficient of reflection R – ratio of acoustic pressures of reflected and incident waves
Coefficient of transmission D – ratio of acoustic pressures of transmitted and incident waves

13
Near field (Fresnel area) – this part of US beam is cylindrical – there are big pressure differences in beam axis
Far field (Fraunhofer area) – US beam is divergent – pressure distribution is more homogeneous
Increase of frequency of US or smaller probe diameter cause shortening of near field - divergence of far field increases
Acoustic parameters of medium: Near field and far field

14
Ultrasonography
Passive US – low intensity waves which cannot cause substantial changes of medium.
In US diagnostics (ultrasonography = sonography = echography) - frequencies used are 2 - 40 MHz with (temporal average, spatial peak) intensity of about 1 kW/m2
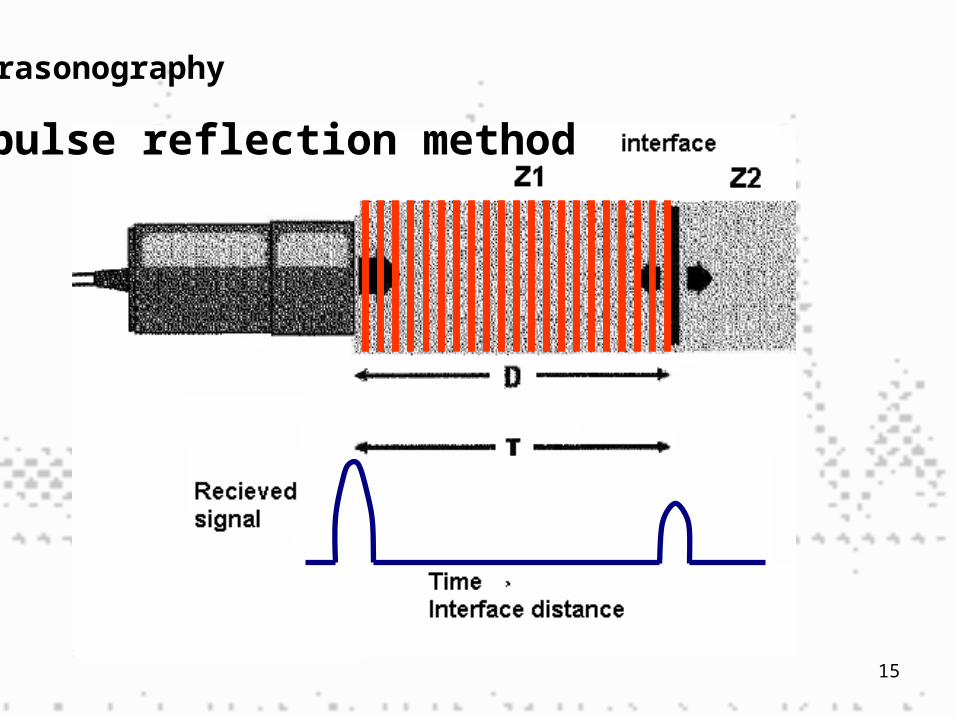
Impulse reflection method: a probe with one transducer which is source as well as detector of US impulses. A portion of emitted US energy is reflected on the acoustic interfaces and the same probe then receives reflected signal. After processing, the signal is displayed on a screen.
15
Ultrasonography
Impulse reflection method

16
Ultrasonography
Impulse reflection method

17
Ultrasonography
Impulse reflection method
Main parts of the US apparatus:
Common to diagnostics and therapy
probe with electroacoustic transducer (transducers)generator of electric oscillations (continuous, pulsed)
Special parts of diagnostic apparatus
electronic circuits for processing of reflected signaldisplay unitrecording unit

18
Ultrasonography
A-mode – one-dimensionalDistances between reflecting interfaces and the probe are shown.
Reflections from individual interfaces (boundaries of media with different acoustic impedances) are represented by vertical deflections of base line, i.e. the echoes.
Echo amplitude is proportional to the intensity of reflected waves (Amplitude modulation)
Distance between echoes shown on the screen is approx. proportional to real distance between tissue interfaces.
Today used mainly in ophthalmology.

19
Ultrasonography
A-mode – one-dimensional
Ivo Hrazdira
olej se již dávno nepoužívá, doporučuji opravit na gel film

20
A tomogram is depicted.
Brightness of points on the screen represents intensity of reflected US waves (Brightness modulation).
Static B-scan: a cross-section image of examined area in the plane given by the beam axis and direction of manual movement of the probe on body surface. The method was used in 50‘ and 60‘ of 20th century
Ultrasonography
B-mode – two-dimensional

21
Ultrasonography
B-mode – two-dimensional - static

22
Ultrasonography M-mode
One-dimensional static B-scan shows movement of reflecting tissues. The second dimension is time in this method.
Static probe detects reflections from moving structures. The bright points move vertically on the screen, horizontal shifting of the record is given by slow time-base.
Displayed curves represent movement of tissue structures
chest wall
lungs

23
Ultrasonography
Comparison of A-, B- and M-mode principle
24
Repetitive formation of B-mode images of examined area by fast deflection of US beam mechanically (in the past) or electronically „in real time“ today. Electronic probes consist of many piezoelectric transducers which are gradually activated.
Ultrasonography
B-mode - dynamic

25
Ultrasound probes for dynamic B-mode: electronic and mechanical (history), sector and linear.
Ultrasonography B-mode - dynamic
Abdominal cavity is often examined by convex probe – a combination of a sector and linear probe.

26
Modern ultrasonography - digital processing of image Analogue part – detection system Analogue-digital converters (ADC) Digital processing of signal – possibility of programming (preprocessing, postprocesssing), image storage (floppy discs, CD, flash cards etc.)
Ultrasonography B-mode - dynamic
MEM
OR
Ysampling

27
Ultrasonography B-mode - dynamic

28
Degree of reflectivity – echogenity. The images of cystic (liquid-filled) and solid structures are different. According to the intensity of reflection in the tissue bulk we can distinguish structures:
hyperechogenic, izoechogenic, hypoechogenic, anechogenic.
Solid structures – acoustic shadow (caused by absorption and reflection of US)
Air bubbles and other strongly reflecting interfaces cause repeating reflections (reverberation, „comet tail“).
Ultrasonography
Basic characteristics of US images

29
Acoustic shadow caused by absorption and
reflection of US by a kidney stone (arrow)
Hyperechogenic area below a cyst (low attenuation of US during passage through the cyst compared with the surrounding tissues – arrow)
Ultrasonography
Ivo Hrazdira
doplněny šipky

30
Limitation! – absorption of US increases with frequency of ultrasound = smaller penetration depthCompromise frequency 3-5 MHz – penetration in depth of about 20 cm
Ultrasonography
Spatial resolution of US imaging system is determined by the wavelength of the US. When the object dimension is smaller than this wavelength only scattering occurs. Hence higher spatial resolution requires higher frequencies

31
Axial spatial resolution - it is given by the shortest distance of two distinguishable structures lying in the beam axis – it depends mainly on frequency (at 3.5 MHz about 0.5 mm)
Lateral spatial resolution - it is given by the shortest distance of two distinguishable structures perpendicularly to the beam axis – depends on the beam width
Elevation – ability to distinguish two planes (sections) lying behind or in front of the depicted tomographic plane – it depends on frequency and beam geometry
Ultrasonography Spatial Resolution

32
The best resolving power can be found in the narrowest part of the US beam profile.
Focusing – US beam is converged at the examined structure by means of acoustic lenses (shapes of the layer covering the transducer) or electronically.
The probes can be universal or specially designed for different purposes with different focuses.
The position of focus can be changed in most sector probes).
Ultrasonography Spatial Resolution

33
Ultrasonography
Interventional sonography
Interventional sonography is used mainly for guiding punctures
diagnostic – thin needle punctures to take tissue samples for histology
therapeutic – for aspiration of a cyst or an abscess content or an exudate etc.
Puncture can be done by „free hand“ – the probe is next to the puncture site – or the puncture needle is guided by a special probe attachment.

34
Ultrasonography
Echocontrast agents
- increase echogenity of streaming bloodGas microbubbles(mainly air or volatile hydrocarbons) - free- enclosed in biopolymerenvelope
A SEM micrograph ofencapsulated echocontrast agent

35
Ultrasonography
Echocontrast agents - application
Enhanced demarcation of heart ventricle after application of the echocontrast agent

36
An impulse with basic frequency f0 is emitted into the tissue. The receiver, however, does not detect the reflected US with this same frequency but with the second harmonic frequency 2f0. Its source is tissue itself (advantage in patients „difficult to examine“). The method is also used with echocontrast agents – source of the second harmonic are oscillating bubbles. Advantageous when displaying blood supply of some lesions.
Conventional (left) and harmonic (right) images of a kidney with a stone.
Ultrasonography
Harmonic imaging
37
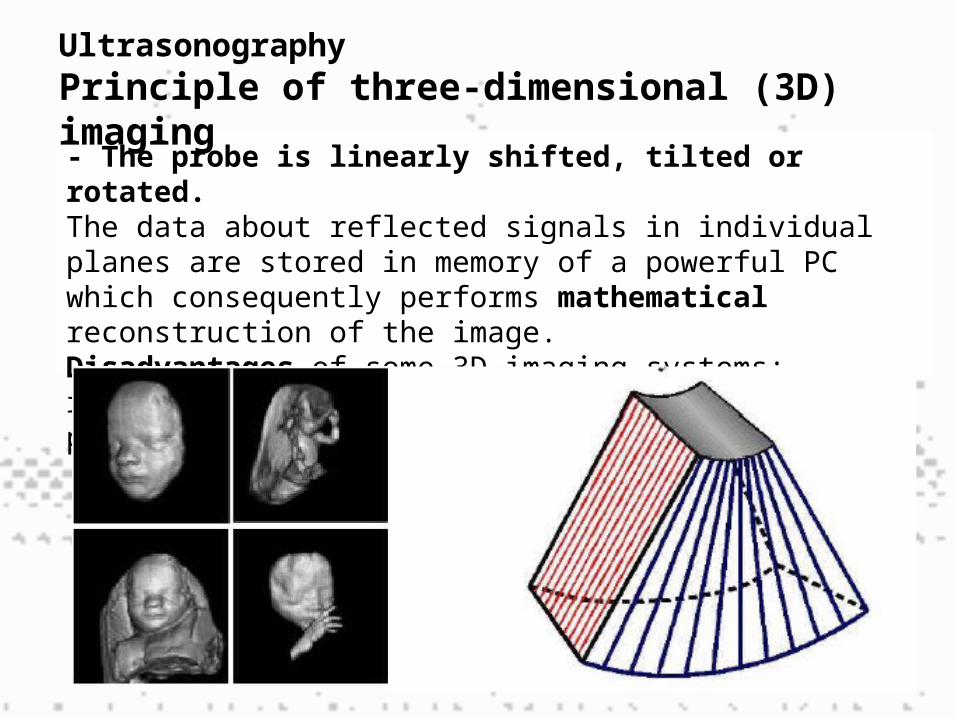
- The probe is linearly shifted, tilted or rotated.The data about reflected signals in individual planes are stored in memory of a powerful PC which consequently performs mathematical reconstruction of the image. Disadvantages of some 3D imaging systems: relatively long time needed for mathematical processing, price.
Ultrasonography Principle of three-dimensional (3D) imaging

38
Four-dimensional (4D) imageThe fourth dimension is time

39
Doppler flow measurement
The Doppler effect (frequency shift of waves formed or reflected at a moving object) can be used for detection and measurement of blood flow, as well as, for detection and measurement of movements of some acoustical interfaces inside the body (foetal heart, blood vessel walls)
Christian. A. Doppler (1803-1853), Austrian physicist and mathematician, formulated his theory in 1842during his stay in Prague.
Ivo Hrazdira
doplněný diapozitiv

40
perceived frequency corresponds with source frequency in rest
perceived frequency is higher when approaching
perceived frequency is lower when moving away
Doppler flow measurement
Principle of Doppler effect

41
Application of Doppler effect in blood flow velocity measurement
Moving reflector (back scatterer) = erythrocytes
Doppler flow measurement
Principle of Doppler effect

42
US Doppler blood flow-meters
are based on the difference between the frequency of ultrasound (US) waves emitted by the probe and those reflected (back-scattered) by moving erythrocytes.
The frequency of reflected waves is (in comparison with the emitted waves)
higher in forward blood flow (towards the probe)
lower in back blood flow (away from the probe)
The difference between the frequencies of emitted and reflected US waves is proportional to blood flow velocity.
Doppler flow measurement
Principle of blood flow measurement

43
Doppler flow measurement
General principle of blood flow measurement

44
1) Calculation of Doppler frequency change fd
2) Calculation of „reflector“ (erythrocytes) velocity v
1) 2)
fv - frequency of emitted US wavesα - angle made by axis of emitted US beam and the velocity
vector of the reflectorc – US speed in the given medium (about 1540 m/s in blood)
c
vff vd
cos2 cos2
v
d
f
cfv
Doppler flow measurement

45
Dependence of velocity overestimation on the incidence angle α (if the device is adjusted for = 0, i.e. cos = 1)
- angle made by axis of emitted US beam and the velocity vector of the reflector
Doppler flow measurement

46
1) Systems with continuous wave – CW. They are used for measurement on superficial blood vessels. High velocities of flow can be measured, but without depth resolution. Used only occasionally.
2) Systems with pulsed wave. It is possible to measure blood flow with accurate depth localisation. Measurement of high velocities in depths is limited.
Doppler flow measurement

47
The probe has only one transducer which acts alternately as emitter and receiver.
The measurement of velocity and direction of blood flow in the vessel is evaluated in the so-called sampling volume with adjustable size and depth.
The pulse duration defines the size of the sampling
volume (this volume should involve the whole diameter of
the examined blood vessel).
Doppler flow measurement
Systems with pulsed wave - PW

48
Aliasing – at high repetition frequency of pulses the upper part of the spectral curve can appear in negative velocity range
- at velocity above 4m/s aliasing cannot be removed
Nyquist limit
Doppler methods
Pulse wave (PW) systems

49
DUPLEX method
is a combination
of dynamic B-mode imaging (the morphology of examined area with blood vessels is depicted)
and the PW Doppler system (measurement of velocity spectrum of blood flow).
It allows to examine blood flow inside heart or in deep blood vessels (flow velocity, direction and character)
Doppler methods

50
Doppler methods DUPLEX method
Scheme: sector image Image of carotid with spectral with sampling volume analysis of blood flow velocity

51
Doppler methods DUPLEX method
Placement of sampling volume (left) and the record of blood flow velocity spectrum in stenotic a. carotis communis (right)

52
Doppler methods
Colour Doppler imaging
The image consists of black-white and colour part.The black-white part contains information about reflectivity and structure of tissues.The colour part informs about movements in the examined section. (The colour is derived from average velocity of flow.)The apparatus depicts distribution and direction of flowing blood as a two-dimensional image. BART rule – blue away, red towards. The flow away from the probe is coded by blue colour, the flow towards the probe is coded by red colour. The brightness is proportional to the velocity, turbulences are depicted by green patterns.

53
Doppler methods
Colour Doppler imaging
Carotid bifurcation

54
Doppler methods TRIPLEX method
A combination of duplex method (B-mode imaging with PW Doppler) and colour flow mapping
Normal finding of blood flow in a. carotis communis (left) and about 90%-stenosis of a. carotis interna (right)
Ivo Hrazdira
opravena chybná formulace

55
Doppler methods TRIPLEX method
stenosis
of
a. carotis

56
Doppler methodsPOWER DOPPLER method
- the whole energy of the Doppler signal is utilised - mere detection of blood flow only little depends on the so-called Doppler incidence angle- imaging of even very slow flows (blood perfusion of tissues and organs)- flow direction is not shown
57
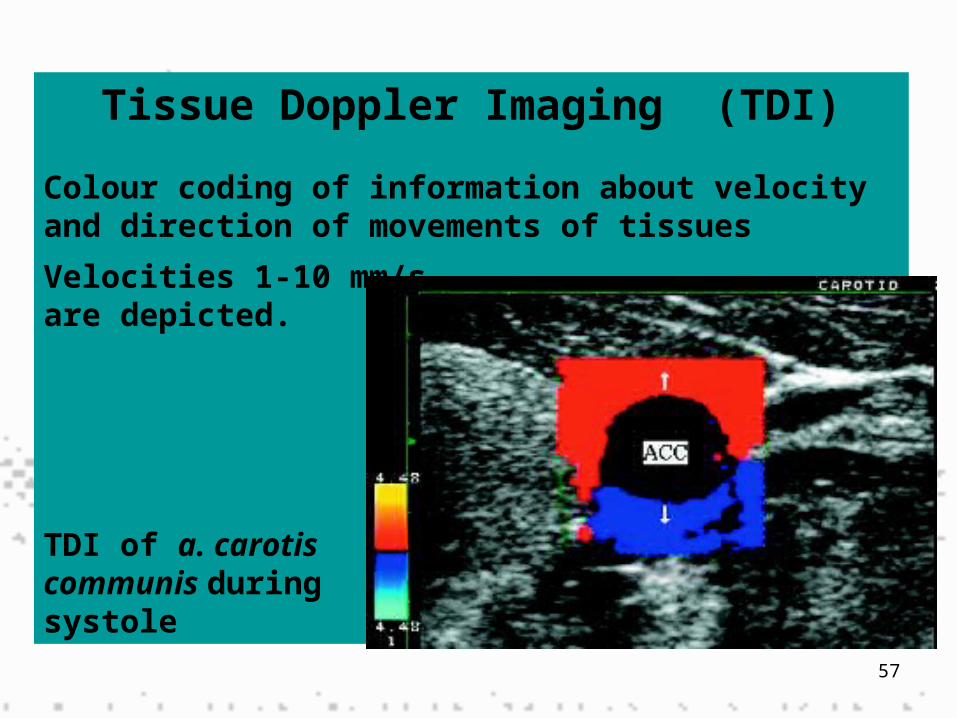
Tissue Doppler Imaging (TDI)
Colour coding of information about velocity and direction of movements of tissues
Velocities 1-10 mm/sare depicted.
TDI of a. carotiscommunis duringsystole

58
Ultrasonic densitometryIt is based on both the measurement of speed of
ultrasound in bone and the estimation of ultrasound attenuation in bone. In contrast to X-ray methods, ultrasound densitometry also provides information on the structure of bone and its elastic properties.
The speed of ultrasound depends on the density and elasticity of the measured medium. The anterior area of the tibia and the posterior area of the calcaneus are frequently used as places of measurement. The speed of ultrasound is given by the quotient of measured distance and the transmission time.
Ultrasound attenuation depends on the physical properties of the given medium and the frequency of the ultrasound applied. For the frequency range 0.1 - 1 MHz the frequency dependence is nearly linear. Attenuation is currently expressed in dB/MHz/cm.Clinical importance: diagnostics of osteoporosis

59
Ultrasonic densitometry
Ultrasound measurements used to assess bone density at the calcaneus

Patient Safety: reducing Ultrasound ‘Doses’
61
Prudent use of Ultrasound
US is non-ionising BUT since many bioeffects of ultrasound have not yet been studied fully, ‘prudent’ use is recommended
ALARA – as low as reasonably achievable (exposure)
In practice ‘prudent’ = justification + optimisation

62
Biological Effects Possible bioeffects: inactivation of enzymes,
altered cell morphology, internal haemorrhage, free radical formation …
Mechanisms of bioeffects:– Mechanical effects
• Displacement and acceleration of biomolecules• Gas bubble cavitation (stable and transient) – see the lecture
on biological effects of ultrasound
– Elevated tissue temperatures (absorption of ultrasound and therefore increase in temperature high in lungs, less in bone, least in soft tissue)
All bioeffects are deterministic with a threshold (cavitation) or without it (heating).

63
Output Power from Transducer
varies from one machine to another
Increases as one moves from real-time imaging to colour flow Doppler
M-mode output intensity is low but dose to tissue is high because beam is stationary

64
Risk Indicators To avoid potentially dangerous exposures, two indices were
introduced. Their values (different for different organs) are often displayed on device screens and should not be exceeded.
Thermal Index (TI): TI = possible tissue temperature rise if transducer is kept stationary– TIS: soft tissue path– TIB: bone near focus of beam– TIC: Cranium (near surface bone)
Mechanical Index (MI): measure of possible mechanical bioeffects

65
More on the TI and MI
Thermal index – device power divided by the power that would increased the temperature by one degree under conditions of minimum heat loss (without perfusion).Mechanical index (for assessment of cavitation-conditioned risk, increased danger when using echocontrast agents):

66
Justification
No commercial demos on human subjects
No training on studentsNo ‘see baby just for fun’ or
excessive screening in obstetrics

67
Optimisation of ‘Dose’ 1
Minimise TI and MI and use appropriate index (TIS, TIB, TIC), care in cases when these underestimate
Check acoustic power outputs on manual
Use high receiver gain when possible as opposed to high transmit power
Start scan with low transmit power and increase gradually

68
Optimisation of ‘Dose’ 2
Avoid repeat scans and reduce exposure time
Do not hold transducer stationary
Greater care when using contrast agents as these increase the possibility of cavitation
Exceptional care must be taken in applying pulsed Doppler in obstetrics
Regular quality control of the ultrasound device

Authors: Vojtěch Mornstein, Ivo Hrazdira, Pavel Grec
Content collaboration and language revision:
Carmel J. Caruana
Graphical design: Lucie Mornsteinová
Last revision: August 2012
http://www.freehotgame.com