Lecture slides3; Basic Project Management
200
MANAGEMENT:CIVIL II_ MCIV 2/0 MODULE THREE: PRINCIPLES OF PROJECT MANAGEMENT JB NARTEY
-
Upload
jb-nartey -
Category
Leadership & Management
-
view
17 -
download
0
Transcript of Lecture slides3; Basic Project Management

MANAGEMENT:CIVIL II_ MCIV 2/0
MODULE THREE: PRINCIPLES OF PROJECT MANAGEMENT
JB NARTEY

2
PROJECT_ DEFINITION
A project is any planned temporary endeavour
Undertaken to create a unique product, service or complete and
Definite outcomes(result or deliverable) Within a limited time scale and Within limited resources: limited budget.

3
PROJECT_EXAMPLES
ND-Civil program, Course Assignment, Wedding, Construction of a 400 bed capacity
students hostel, A Holiday/Vacation, Rehabilitation of the WSU Study block etc.
4

5

6

7
PROJECT_TEMPORARY
Temporary:. It is undertaken to accomplish a goal within a given period of time, once the goal is achieved the project ceases to exist.

8
PROJECT_UNIQUE
Unique endeavour; a unique task. A project requires doing things differently
than before. A project is one of the kind never to be
repeated.

9
OPERATIONS
Routine/Recurring tasks are not projects. Examples; The routine issuance of certificates to graduates of
WSU is not a project. Daily issuance of reports on material inventories/stocks
is not a project., Production is not a project eg. Mass production of cars
is not a project Operations is not a project eg. Routine servicing and
maintenance of cars is not a project.

10
PROJECTS Vs OPERATIONS
Projects are unique and have a definite time to complete. Project work ends when the project is closed.
Examples: Construction of a shopping mall. Operations are on-going repetitive work to support the business and
systems of the organisation Examples: Operations & Maintenance of infrastructure The two(2) are managed differently . Operations cannot be managed like a
project or using project management principles to manage operations

11
PROJECTS Vs OPERATIONS
Projects make work unique, while operations are repetitive.
Projects are finite and therefore exist in many cases for relatively short periods of time, whereas in operations the emphasis is on creating a stable production environment, which is expected to last for an indefinite period of time

12
PROJECT_TIME SCALE
Limited Time Scale: Must be completed within a specific
time specified upfront. Example; 6 months, 1 year,2 years,4
years etc.

13
PROJECT_TIME SCALE(TYPES)
Time limits could be as soon as possible(asap) or due dates.
Due date projects- projects with a predetermined fixed due date for completion
Examples; Nelson Mandela Bridge in Joburg, 2010 World Cup Infrastructure development.
As soon as possible projects- Projects with some amount of flexibility in the time for completion.
Examples; Many projects.

14
PROJECTS VS EVENTS
Events Activities with durations less than a day
are not projects.
Examples; project milestones, site meetings, parties,
soccer matches are not projects.
Event management skills to handle them

15
PROJECT_RESOURCES
Resources: Consume resources( money, people, equipment,expertise etc)

16
PROJECT_BUDGET
Limited Budget: Must be completed within a limited budget specified upfront.

17
PROJECT_BACKGROUND-ORIGIN
A project usually originate from the needs, wants or opportunities or changes; new laws/regulations/technology
identified by a client/customer/ community
Example; The need to accommodate new students at
WSU

18
PROJECT_PURPOSE
GOAL OBJECTIVES(SCOPE) DELIVERABLES(QUANTITY/
QUALITY)

19
PROJECT_ GOAL
Broad statement about the intended purpose of a project.
Example To provide accomodation for new
students at WSU To develop an app for registration of new
students at WSU

20
PROJECT_ OBJECTIVES(SCOPE/SCOPE BASELINE)
Cost (Complete within budget) Schedule (Complete within
time) Deliverables(Satisfy
performance specifications(Quantity/Quality)
S.M.A.R.T. PROJECT OBJECTIVES

21
PROJECT OBJECTIVES(SCOPE)
It must be SMART( Specific, Measurable, Agreed, Realistic and Time-bound)
AVOID GENERAL or VAGUE STATEMENTS or SOFT BRIEFS It has to be discussed with and formally approved by the relevant
stakeholders. It must be very clear as to the exact objectives of the project so
as to eliminate any uncertainty or fears in the minds of stakeholders.
Avoid “ Assumed/Thought” scope of the project. All the relevant stakeholders must be involved early in its
development and approval.

22
PROJECT_OBJECTIVES(SCOPE)_EXAMPLE
To initiate, plan, build, furnish and equip the 400 bed student hostel at Cuba township near Butterworth within eighteen(18) months, at a cost not exceeding R29 million and which compiles/conforms to the Mnquma local municipality development plans/zoning restrictions for the area and SANS 1921 building code.

23
PROJECT_OBJECTIVES(SCOPE)_EXAMPLE
Initiate, plan and provide portable drinking water for 1000 households in the Bizana Municipality within 1 year at a cost not exceeding R2million and which complies with SANS 241 standards/specifications

24
EXAMPLES_GOOD OBJECTIVES
Provide portable pipe born water for 1000 households in the Bizana Municipality in 2015
To increase gross profit by 10% for my company in the year 2015 To build 1000m2/400 bed capacity local hospital for Ibika township
in year 2015 To reduce weight by 20 kgs at ibika campus in the year 2015 Reduce woody weed cover to less than 5% in 2,000m² of degraded
vegetation in Blue Mountains Park. Educate 100 local residents in the Blue Mountains region on how to
prevent and restore degraded vegetation in Blue Mountains Park. Increase the awareness of 500 people visiting Blue Mountains Park
on the environmental and cultural significance of the Park. To educate 1,000 households within Butterworth on ways to reduce
energy and water usage by 10%.

25
EXAMPLES_ BAD/POOR OBJECTIVES
Install 1,000 plants Remove weeds Run a workshop Install a sign Create a website that is appealing for all age groups Expansion of partnerships and networks Improved environmental education with tools and
strategies Raise awareness of the issue of climate change Improve awareness of conservation issues

26
PROJECT_DELIVERABLES
A Complete & definite outcome Performance/Results that must meet the quality/quantity
specifications/requirements of the project. All deliverables must satisfy or exceed the needs and expectations
of stakeholders. Deliverables could have long or short life spans.
Examples 400 bed hostel building that conforms to the Mnquma local
municipality development plans/zoning restrictions for the area and SANS 1921 building code.
Portable drinking water for 1000 households in the Bizana Municipality which complies with SANS 241 standards/specifications

27
PROJECT_DELIVERABLES(TYPES)
Projects with tangible( physical) deliverables/products
A building project. A road project A water supply project. A project with intangible deliverables/services A research project that produces new knowledge,
insights or service innovation, An election project that delivers election results, A population census project that delivers a census
report

28
PROJECT-STAKEHOLDERS
Stakeholders This is any person or group of persons that forms part
of the project team, vested or perceived interest in the project, may be affected by the project or have a positive or negative impact on the project.
Examples; Client, Project Manager, Project Team, Ward
Councillors, Mayor, Engineer, End users, Contractor, the community,DOL,ECSA etc

29
PROJECT_MULTI-DISCIPLINARY
Multi-disciplinary They require input from people with different kinds of
knowledge and expertise. Usually have considerable need to cross departmental boundaries for technology, information, resources and personnel.
Multi-disciplinary Team; A temporary team of people from within or outside the
organisation with the relevant backgrounds and skills brought together to manage the project. It implies that projects can be cross-functional within the organisation. Risk of Conflict

30
PROJECT_ A PROJECT LIFECYCLE
A project passes through a number of phases before coming to completion.
A project cycle is a sequential grouping and description of the phases of the project.
Because projects all differ in terms of scope and complexity, different phases may be applicable to any one project
All organisms have a life cycles.(eg.Man) Likewise every program, project or product has certain phases of development.

31
PROJECT_ A PROJECT LIFECYCLE(CONSTRUCTION PROJECT)
Most Construction Projects comprises five(5) basic phases:
CONCEPTUAL PHASE DESIGN & DEVELOPMENT PHASE IMPLEMENTATION PHASE TERMINATION PHASE O & M PHASE

32
PROJECT_CONCEPTUAL PHASE
Needs or opportunity Identification Project Goals Requirements Objectives/Scope definition. Appointment of Project Manager & Project Team Initiation- Outdooring of the project/Project Charter Feasibility/Business plan - Is the process of investigating a
problem and developing a solution in sufficient detail to determine if it is economically viable and worthy of development.
Project Registration to solicit funding and other permits
Most Influence on the success of the project

33
PROJECT_DESIGN & DEVT PHASE
Project Management Plan/Project Plan - Scope statements, WBS, Gannt chart etc Preliminary Design and specifications Detailed design and specifications Detailed Scope and Planning Documents Cost Estimations/Budget, SOQ, Tender Documents Procurement & Contract Award

34
PROJECT_IMPLEMENTATION PHASE
Procurement/Execution Construction, building Fabrication, installations, testing, Monitoring & Control-Project Meetings,
inspections etc

35
PROJECT-TERMINATION PHASE
Commissioning & Hand over Inspection and testing to verify
compliance Project formal acceptance(Happy Letters) Handing over Training of clients operators Project Close out Report Project Commissioning

36
PROJECT_O&M PHASE
Operations, Maintenance & Support.

37
PROJECT_ORGANISATIONAL STRUCTURE
THE STRUCTURE WITHIN WHICH THE PROJECT WILL BE ORGANISED.
FEATURES; DESIGNATIONS(POSTS) RESPONSIBILITIES/DUTIES INTERRELATIONSHIPS(AUTHORITY LINES) COMMUNICATION LINES

38
A Project Organisational structure; A classroom block, R5million contract
H/O
C.M.
P.M.Store boy/Time clerk Estimator/Buyer
Site Agent-Building Works Site Agent-Civil Works Site Agent-Access Road
Foremen Foremen Foremen
Artisans
Labourers
Artisans
Labourers
Artisans
Labourers

39
PROJECT_ISSUES/PROBLEMS
Issues/Problems that prevents the achievement of the goals/objectives/ deliverables(scope)
Example; Bad Weather Material Scarcity Workers on strike

40
PM_ WHAT IT IS
Project Management is the application of knowledge, skills, tools and techniques in the planning, organising, directing and control of various resources throughout the life of a project in order to meet or exceed customer/stakeholder needs and expectations stipulated in terms of time frame, budget and performance.

41
PM VS TM
Project management approach Traditional/Operations approach Transient resources In PM there is rapid mobilisation of resources
up-front and again rapid demobilisation near project closeout. (No "dead wood"!)
The density of the resource profile changes over the life cycle. (More economical use of resources.)
Success highly visible Specific goals identified by WBS at conception - upon completion those are measured against preset standards for time, quality and cost. Tasks are newly formulated Every project is unique and therefore every task or activity has to be newly formulated - a WBS and schedule are created anew. (All the activities for the first moon landing were newly formulated!) Greater emphasis on effectiveness The emphasis is on getting things done to preset standards of time, quality and cost. Uncertainty Risk management ensures steady state where a probability of outcome = 1, completely certain. More emphasis on goals Goals/objectives/milestones are important and preset - things must happen as scheduled according to a specific plan.
Stable resources Resource profile is stable. ("Dead wood"
accommodated!). Resources can generally be estimated or
planned according to expected growth rate for future period. ("Dead wood" not so obvious.)
Success very often not easily visible It is very difficult to compare one product on a moving production line to another. Tasks well defined Tasks and activities are accepted as well defined and well seasoned. Some might have been done for centuries! Why consider a new way of doing things? Greater emphasis on efficiency Emphasis is on input/output relationship - minimising input and maximising output. More or less certain environment People are working in a more or less/accepted certain environment (which breeds complacency!). More emphasis on roles Goals/objectives/milestones less rigorously, even poorly, defined.

42
PM PROCESS
What you need to do(the steps) to manage the project.
43
PM PROCESS_NATURE
THE PM PROCESS IS; INTERACTIVE
ITERATIVE(REPETITIVE)
44
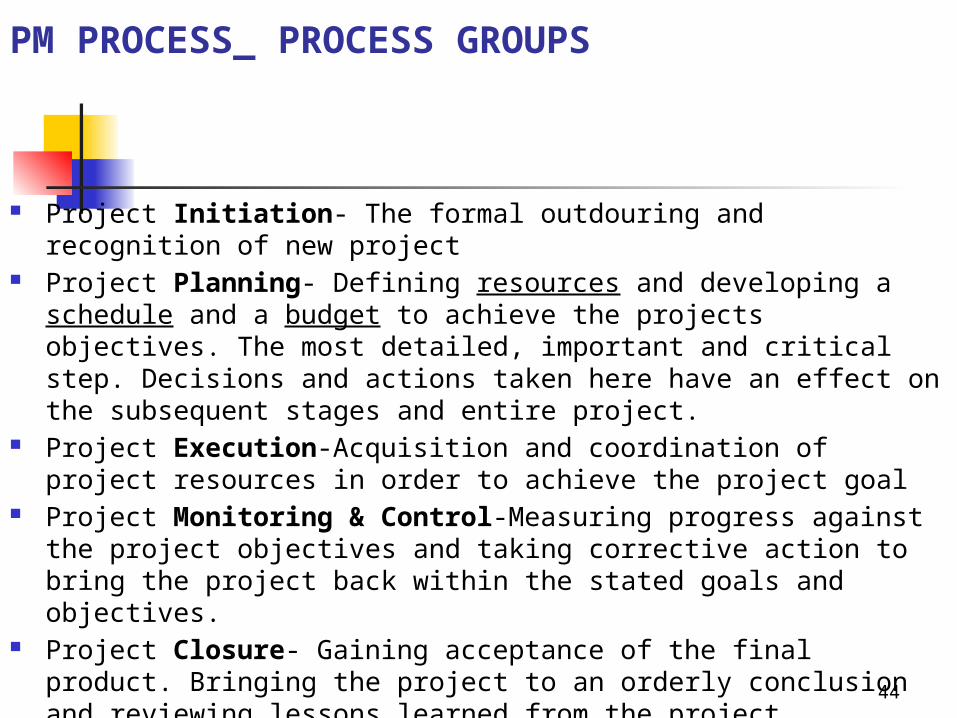
PM PROCESS_ PROCESS GROUPS
Project Initiation- The formal outdouring and recognition of new project
Project Planning- Defining resources and developing a schedule and a budget to achieve the projects objectives. The most detailed, important and critical step. Decisions and actions taken here have an effect on the subsequent stages and entire project.
Project Execution-Acquisition and coordination of project resources in order to achieve the project goal
Project Monitoring & Control-Measuring progress against the project objectives and taking corrective action to bring the project back within the stated goals and objectives.
Project Closure- Gaining acceptance of the final product. Bringing the project to an orderly conclusion and reviewing lessons learned from the project.
45
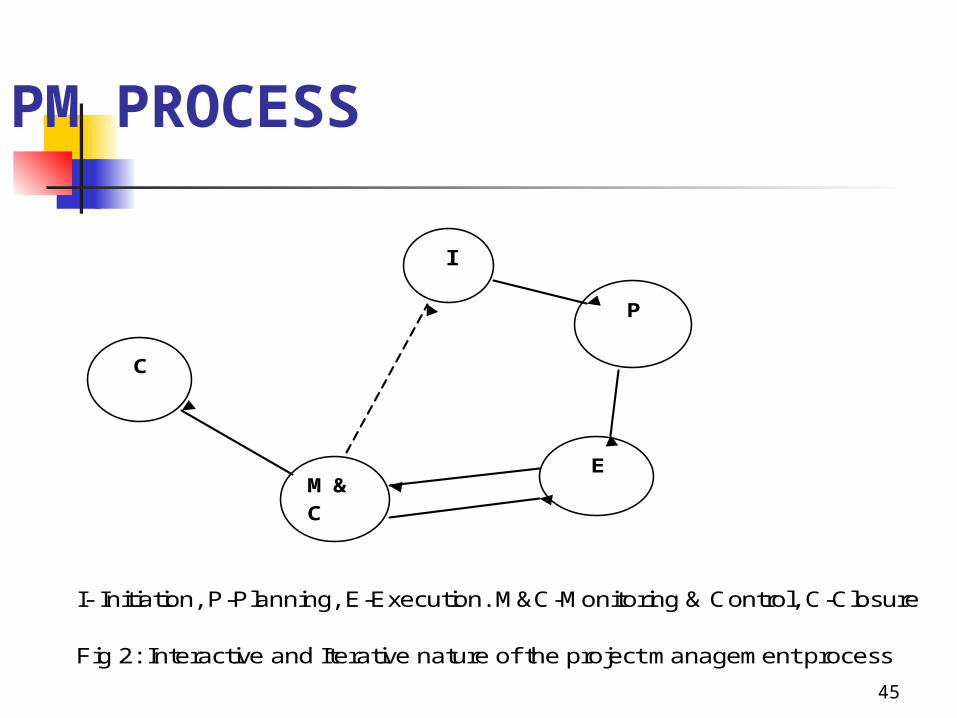
PM PROCESS
I- Initiation, P-Planning, E-Execution. M&C-Monitoring & Control, C-Closure Fig 2: Interactive and Iterative nature of the project management process
C
M & C
I
P
E

46
PROJECT PHASES VS PM PROCESS
Conceptual Phase
Design & Devt Phase
Implementation Phase
Termination Phase
O&M Phase
I- Initiation, P-Planning, E-Execution. M&C-Monitoring & Control, C-Closure Fig 2: Interactive and Iterative nature of the project management process
C
M & C
I
P
E
I- Initiation, P-Planning, E-Execution. M&C-Monitoring & Control, C-Closure Fig 2: Interactive and Iterative nature of the project management process
C
M & C
I
P
E
I- Initiation, P-Planning, E-Execution. M&C-Monitoring & Control, C-Closure Fig 2: Interactive and Iterative nature of the project management process
C
M & C
I
P
E
I- Initiation, P-Planning, E-Execution. M&C-Monitoring & Control, C-Closure Fig 2: Interactive and Iterative nature of the project management process
C
M & C
I
P
E
I- Initiation, P-Planning, E-Execution. M&C-Monitoring & Control, C-Closure Fig 2: Interactive and Iterative nature of the project management process
C
M & C
I
P
E

47
PM GOAL
The goal of project management is to achieve the predetermined objectives of COST, TIME and PERFORMANCE that have been outlined in the SCOPE of the project by the client.

48
PM GOAL
TIME
COSTQUALITY SCOPE

49
PM OBJECTIVES
Projects have three interrelated objectives and the performance of
a project is measured by these 3 dimensional objectives; Time- Is the project on time or early? Cost- Is the project on or under budget? Deliverables-Does the project deliver the agreed - upon
outputs(Quantity/Quality) to the satisfaction of the customer?
Other goals/ objectives: Scope, Safety, health, environment(mining/construction),good client relations(construction)

50
PM OBJECTIVES
Within Good Customer/ client relations
Fig.3: Project Management
Time Cost
Performance/Deliverables
Performance & Deliverables
Resources
51
PM_ SUCCESS
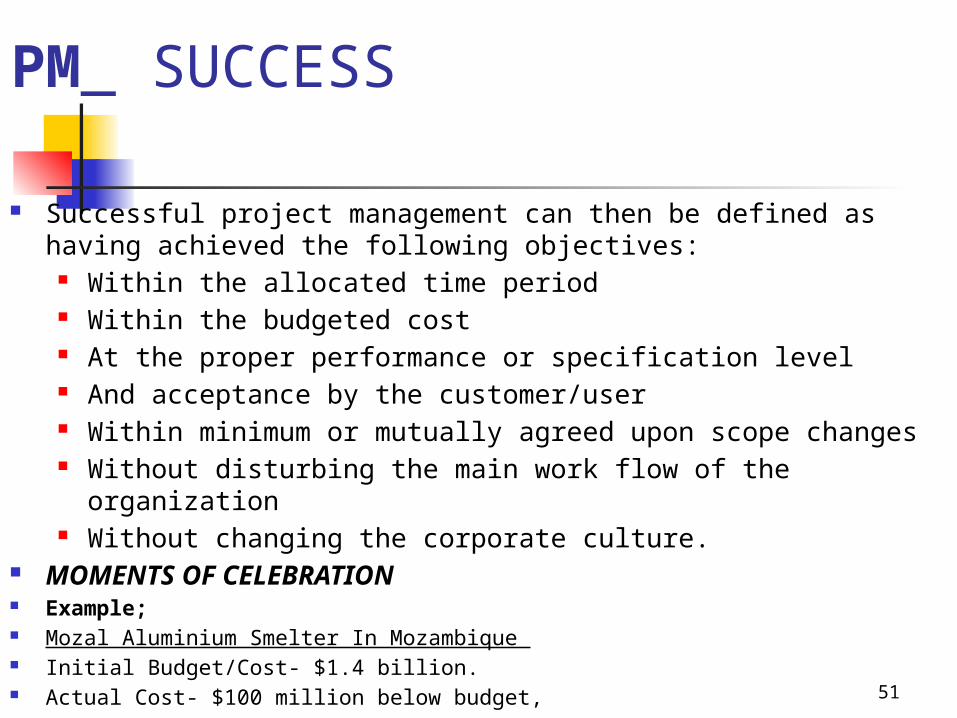
Successful project management can then be defined as having achieved the following objectives:
Within the allocated time period Within the budgeted cost At the proper performance or specification level And acceptance by the customer/user Within minimum or mutually agreed upon scope changes Without disturbing the main work flow of the organization Without changing the corporate culture.
MOMENTS OF CELEBRATION Example; Mozal Aluminium Smelter In Mozambique Initial Budget/Cost- $1.4 billion. Actual Cost- $100 million below budget, Time- Completed 6 months ahead of schedule

52

53
PM_ FAILURE
A failed project management can also be defined as having fallen short of the above objectives: Time overruns, budget overruns, non-acceptance by customer etc.
Example; Sydney Opera House in Australia Initial Budget/Cost-$A 7 million, Actual Cost- $A102 million Time-Completed 10 years late

54

55
PM GOAL _HOT SPOTS
These constraints interact constantly and it is necessary to determine the balance between them. The balance between these 3 constraints in terms of precedence and priority is called the hot spot.
Where should the focus for the project be? This depends on the specific type of project or product.

56
PM_GOAL_ WHICH IS MOST IMPORTANT?
It depends on the circumstances of the project. Economic downturns result in an increased level of
importance given to cost. While deliverables are almost always paramount when
dealing with an “ arm’s - length ” client. It is not invariably so for an inside client.
If the parent firm has inadequate profits, some specifications may be sacrificed for cost savings.
Organizational policy may influence trade – offs in favour of cost.

57
PM GOALS _TRADE-OFFS
Once a project manager makes a commitment on the time, budget and deliverable. It must be met. Clients usually are not comfortable with budget and time overruns.
The primary method of adapting to unpredictable changes to the goals is to trade - off one objective for another.
These trade-offs must be negotiated amongst the project key stakeholders; client, contractor, consultant, users etc
Most of the trade - offs PMs make involve trade-offs between time and cost, but if we cannot alter either the time(schedule) or the (budget), then the deliverables( specifications) of the project may be altered or compromised.
The time-cost/deliverable trade-offs are also most common on due date projects.

58
PM GOALS_TRADE-OFF EXAMPLES
1. Meeting the time could be more important than the budget eg.The infrastructure for the 2010 FIFA World Cup had to be completed by a certain date;10th June 2010 and late delivery will be totally unacceptable
2. If a construction project falls behind schedule because of bad weather, it may be possible to get back on schedule by adding more resources(labor and
some equipment) to speed up.(Crashing). This implies more cost to be incurred due to the additional resources.
If the budget cannot be raised to cover the additional resources, the PM may have to negotiate with the client for a later delivery date. If neither cost nor schedule can be negotiated, the contractor may have to “ swallow ” the added costs (or pay a penalty for late delivery) and accept lower profits.
3. The wants(luxuries/wish list) of a due date project may be foregone or capabilities not badly needed may be compromised to save time and budget. A due date project such as ABSA stadium in EL. had to forgo a wish list due to budgetary and time constraints.

59
PROJECT_PROJECT MANAGER
Responsible for the ff; PM PROCESS; Initiation, planning,execution,monitoring & control, and closing of any project
Achievement of the stated project GOAL/OBJECTIVES/DELIVERABLES

60
PM GOAL
TIME
COSTQUALITY SCOPE

61
PROJECT SCOPE MANAGEMENT PROCESS
Define Requirements Define Objectives(Scope) Define Deliverables WBS Verify Scope Control Scope

62
PS MANAGEMENT_ DELIVERABLES_BUILD A HOSTEL
400 bed hostel building that conforms to the Mnquma local municipality development plans/zoning restrictions for the area and SANS 1921 building code.

63
PS MANAGEMENT_ WORK BREAKDOWN STRUCTURE (WBS)
A hierarchical decomposition of the work to be executed by the project team to accomplish the project objectives and create the required deliverables”.
Is the process of dividing the whole entire project into small workable and manageable activities.

64
PS MANAGEMENT_ WBS_PURPOSE
The Work Breakdown Structure (WBS) is the solid foundation on which every project should be built, the common framework which all project participants understand.

65
PS MANAGEMENT_WBS_MODEL
Fig 2: Work Breakdown structure( With List of Activities)- Smaller Projects
Level 1- Subprojects Level2 –Work Package/Task Level3-Activity/Sub-task
1.0 Project
1.1 Sub-Projects
1.2.2.1 Activity
1.2.2 Work Package
Scope Statement
1.2 Sub-projects
1.2.1Work Package
1.1.2 Work Package
1.1.1 Work Package
1.2.2.2 Activity
66
PS MANAGEMENT _WBS_MODEL
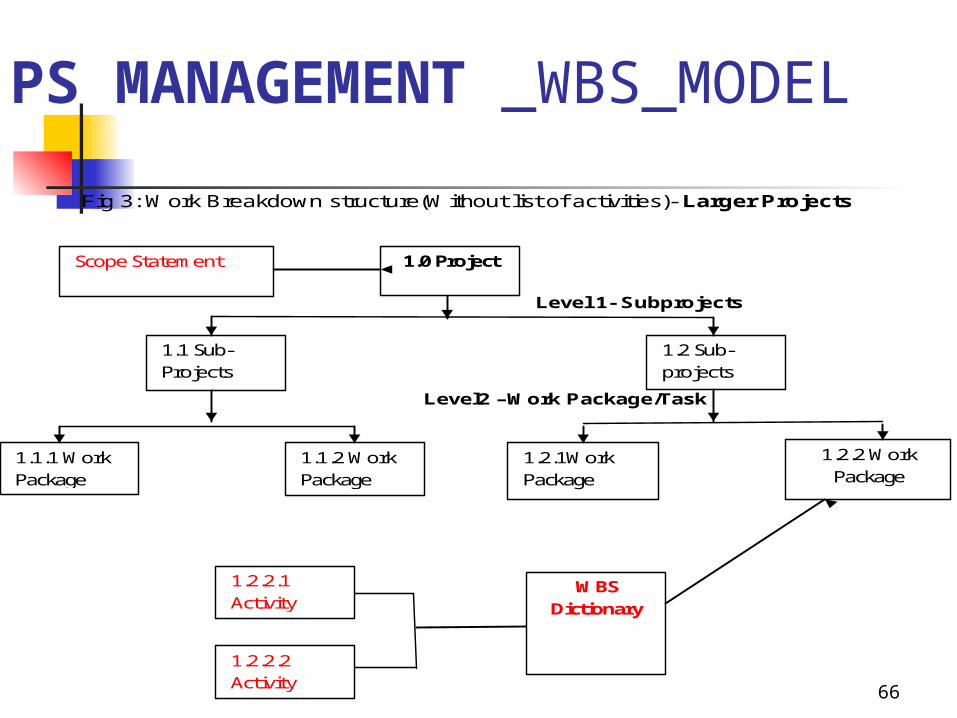
Fig 3: Work Breakdown structure(Without list of activities)- Larger Projects
Level 1- Subprojects Level2 –Work Package/Task
1.0 Project
1.1 Sub-Projects
1.2.2 Work Package
Scope Statement
1.2 Sub-projects
1.2.1Work Package
1.1.2 Work Package
1.1.1 Work Package
1.2.2.1 Activity
1.2.2.2 Activity
WBS Dictionary

67
PS MANAGEMENT_WBS_ COMPONENTS
WBS Level; Level of decomposition eg. Project Level,Sub-project Level, Work Package Level, Work Activity Level.
WBS Code: A unique identifier assigned to each element in a Work Breakdown Structure for the purpose of designating the elements hierarchical location within the WBS.
WBS Element: A WBS Element is a single WBS component and its associated attributes located anywhere within a WBS. A WBS Element can contain work, or it can contain other WBS Elements or Work Packages.
Work Package : A Work Package is a deliverable or work component at the lowest level of its WBS branch.
WBS Component: A component of a WBS which is located at any level. It can be a Work Package or a WBS Element as there's no restriction on what a WBS Component is.

68
Sub-project level Work Package level Activity Level
1.1 Design
1.0 Build Hostel
1.2 Municipal approval
1.3 Obtain finance
1.4 Construction
1.4.1 Plumbing 1.4.2 Electrical 1.4.3 Building
1.4.3.2 Buy Materials
1.4.3.3 Dig & cast found
1.4.3.4 Build Walls
1.4.3.1 Detail planning & control
EXAMPLE_WBS_BUILD A HOSTEL
Fig 1: Tree Structure

69
EXAMPLE_WBS_BUILD A HOSTEL
1. Build Hotel 1.1 Design 1.2 Municipal Approval 1.3 Obtain Finance 1.4 Construction
1.4.1 Plumbing 1.4.2 Electrical 1.4.3 Building
1.4.3.1 Detailed planning & control 1.4.3.2 Buy Materials 1.4.3.3 Dig & Cast foundations 1.4.3.4 Build Walls
Fig.2 Outline(Indent) View

70
EXAMPLE_WBS_BUILD A HOSTEL
Level WBS Code Element Name 1 1 Build Hotel
2 1.1 Design 2 1.2 Municipal Approval 2 1.3 Obtain Finance 2 1.4 Construction 3 1.4.1 Plumbing 3 1.4.2 Electrical 3 1.4.3 Building 4 1.4.3.1 Detailed planning & approval 4 1.4.3.2 Buy Materials 4 1.4.3.3 Dig & Cast foundations 4 1.4.3.4 Build Walls
Fig.3 Hierarchical Structure

71
EXAMPLE_WBS_BUILD A HOSTEL
Level 1 Level 2 Level 3 Level 4 1 Build Hotel 1.1 Design
1.2 Municipal Approval
1.3 Obtain finance
1.4 Construction 1.4.1 Electrical
1.4.2 Plumbing
1.4.3 Building
1.4.3.1 Detailed planning & approval
1.4.3.2 Buy Materials
1.4.3.3 Dig & Cast found
1.4.3.4 Build Walls
Fig.4 Tabular View

72
CLASS EXERCISE
PREPARE A WBS FOR WAKING UP AND GETTING DRESSED

73
WBS_WAKING UP & GETTING DRESSED
1.0 Waking up & Getting Dressed
1.1Wake up
1.2 Get Undressed
1.3 Take a shower
1.4 Dress up
1.4.1Apply Cosmetics
1.4.2Put on underwear
1.4.3Put on Socks
1.4.4Put on dress
1.4.5Put on shoes
1.4.6Comb Hair
1.4.4.1Put on trousers
1.4.4.2Put on shirt
1.3.1Wash hair
1.3.2Wash body
1.3.3Dry up
1.4.1.1Apply C.face
1.4.1.2Apply C. body

74
WBS_ADDITIONAL DATA (1) estimates of the resources required
for each task in the plan, (2) the estimated time required to
accomplish each task, (3) information about who has
responsibility for the task, and (4) data that will allow tasks to be
sequenced so that the set may be completed in the shortest possible time.

75
PS MANAGEMENT_ SOFTWARES
Microsoft Visio Microsoft Project Microsoft Excel(SmartART),

76
PT MANAGEMENT PROCESS
Project deliverables(scope) Listing of Phases/Activities(WBS) Sequence/Prioritise phases/ Activities Estimate Activity Resources
requirements Estimate Activity Durations Develop Time Schedule (Gantt chart) Control Schedule

77
PT MANAGEMENT_ DELIVERABLES_BUILD A HOSTEL
400 bed hostel building that conforms to the Mnquma local municipality development plans/zoning restrictions for the area and SANS 1921 building code.

78
PT MANAGEMENT _LISTING OF ACTIVITIES/PHASES/WORK ITEMS
Design Municipal approval Obtain finance construction

79
CLASS EXERCISE_LIST OF ACTIVITIES
LIST ACTIVITIES/PHASES/WORK ITEMS ON THE SUB-PROJECT LEVEL OF THE WBS

80
PT MANAGEMENT _ACTIVITY SEQUENCING/DEPENDENCY
TABLE OF PREDECESSORS
WBS Code WBS Activity/Task ImmediatePredecessor
1.1 Design
1.2 Municipal Approval 1.1
1.3 Obtain finance 1.1
1.4 Construction 1.2,1.3

81
CLASS EXERCISE_TABLE OF PREDECESSORS
PREPARE TABLE OF PREDECESSORS FOR THE LISTED ACTIVITIES

82
CLASS EXERCISE_TABLE OF PREDECESSORS
WBS code Activity Name Predecessor
1.1 Wake up -
1.2 Get Undressed 1.1
1.3 Take a shower 1.2
1.4 Dress -up 1.3

83
PT MANAGEMENT _ACTIVITY _SCOPE OF WORK
Establish the scope of work for each listed activity
This is usually obtained from the BOQ/SOQ of the project

84
PT MANAGEMENT _ACTIVITY_SCOPE OF WORK
Obtain finance_ R25 Million Design_ 1000 m2 hotel facility Municipal approval- 400
bedrooms 3-storey building,fenced and gated
construction_1000m2 hotel facity

85
PT MANAGEMENT _ACTIVITY_RESOURCE REQUIREMENTS
_
ACTIVITY SCOPE LABOUR/MANPOWER
PLANT & EQUIP.
MATERIALS
OBTAIN FINANCE
R25 MIL CEO/PM NONE NONE
DESIGN 1000M2 PM,Architect/Engineer
NONE NONE
MUNICIPAL APPROVAL
400 bedrooms 3-storey building,fenced and gated
PM,Municipality
NONE NONE
CONSTRUCTION 1000m2 PM, Contractor,
Bull dozers,Concrete Mixers,Small tools etc
Cement,Sand,Stone,Water,gravel,bricks etc

86
PT MANAGEMENT _ACTIVITY_RESOURCE PRODUCTIVITY & TIME ESTIMATING
HISTORICAL DATA EXPERIENCE WORK STUDY
EXAMPLE ACTIVITY: EXCAVATION SCOPE: 100 M3 RESOURCE: TLB EXCAVATOR PRODUCTIVITY: 10M3/DAY ACTIVITY DURATION: 100/10 = 10 DAYS

87
PT MANAGEMENT _RESOURCE PRODUCTIVITY & TIME ESTIMATING
EXAMPLE: ACTIVITY; DESIGN SCOPE: 1000M2 RESOURCE: ARCHITECT PRODUCTIVITY; 333M2/MONTH TIME DURATION: 1000/333 = 3 MONTHS

88
PT MANAGEMENT _TIME ESTIMATING
This is the determination of the duration of all processes, activities and tasks.
Time duration based on historical data

89
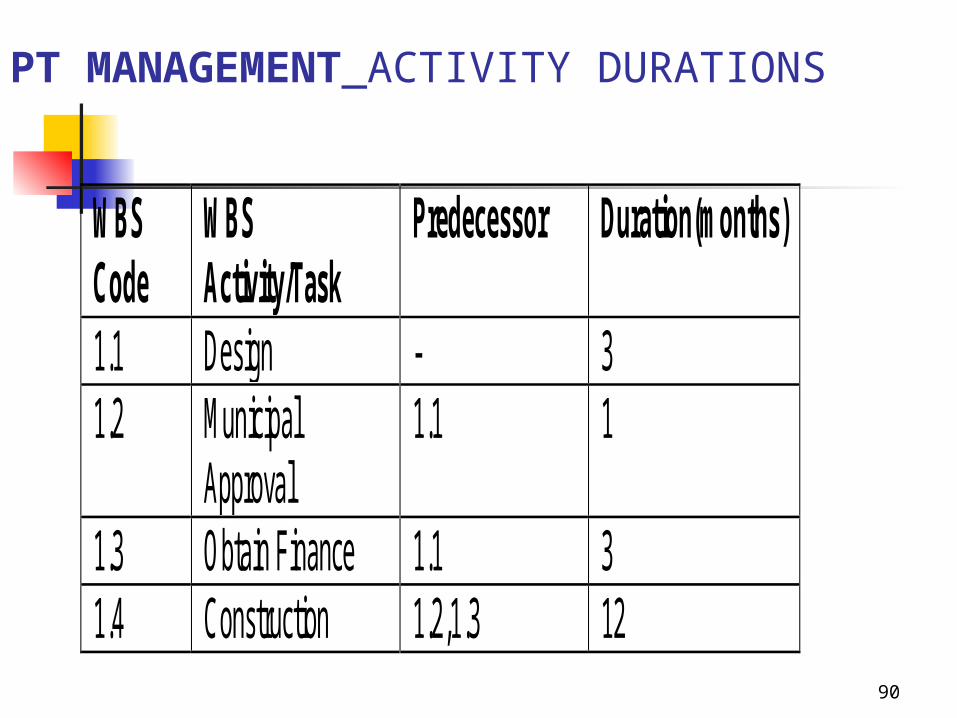
PT MANAGEMENT_ACTIVITY DURATIONS
Design_3 months Obtain finance_3 months Municipal approval-1 month Construction_ 12 months
90
PT MANAGEMENT_ACTIVITY DURATIONS
WBS Code
WBS Activity/Task
Predecessor Duration(months)
1.1 Design - 3 1.2 Municipal
Approval 1.1 1
1.3 Obtain Finance 1.1 3 1.4 Construction 1.2,1.3 12

91
CLASS EXERCISE_ACTIVITY DURATIONS
WBS code
Activity Name Predecessor Duration(mins)
1.1 Wake up - 5
1.2 Get Undressed 1.1 5
1.3 Take a shower 1.2 20
1.4 Dress -up 1.3 30

92
PT MANAGEMENT _TIME SCHEDULE/TIME BASELINE
TIME PLAN FOR THE EXECUTION OF THE PROJECT. NETWORK DIAGRAM GANTT OR BAR CHART

93
PT MANAGEMENT _NETWORK DIAGRAM
Activity Critical path = 1.1-1.3-1.4 Duration of project/Critical Time = 3+3+12= 18 months Critical Activities = 1.1,1.3,1.4 Non-critical activities = 1.2
1.1 Design 3
1.2 Municipal Approval
1
1.3 Obtain Finance
3 1.4 Construction
12

94
NETWORK DIAGRAM_ADVANTAGES/DISADVANTAGES
Advantages Shows dependencies between activities. The planner is forced to think logically Critical activities that demand more attention are identified. Disadvantages Interpretation is more difficult for the uneducated. It must be redrawn when amendments are made. Unrealistic due dates

95
CLASS EXERCISE_NETWORK DIAGRAM
DRAW THE NETWORK DIAGRAM FROM THE TP DRAWN

96
CLASS EXERCISE_NETWORK DIAGRAM
1.1Wake up
5
1.2 Get
Undressed5
1.3Take a Shower
20
1.4 Dress up
30

97
PT MANAGEMENT_GANTT CHART
Gantt Chart
WBS Activity/ Task
Pred. Dur. (mths)
Time(months) 1 2 3 4 5 6 7 8 9 10 11 12 13 14 15 16 17 18
Design - 3 Municipal Approval
1.1 1
Obtain Finance 1.1 3 Construction 1.2,
1.3 12
Critical Activities Non-critical Activity Free Float- Tolerable delays/ 2 days SF Lag
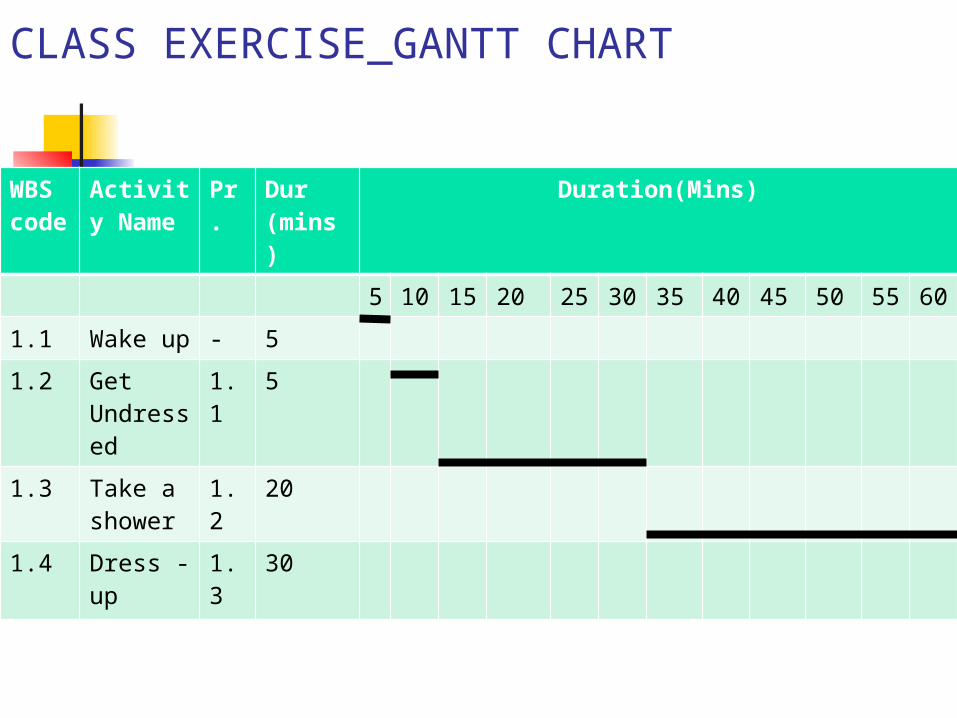
CLASS EXERCISE_GANTT CHART
WBS code
Activity Name
Pr. Dur(mins)
Duration(Mins)
5 10
15
20 25
30
35 40
45 50 55
60
1.1 Wake up
- 5
1.2 Get Undressed
1.1
5
1.3 Take a shower
1.2
20
1.4 Dress -up
1.3
30
99
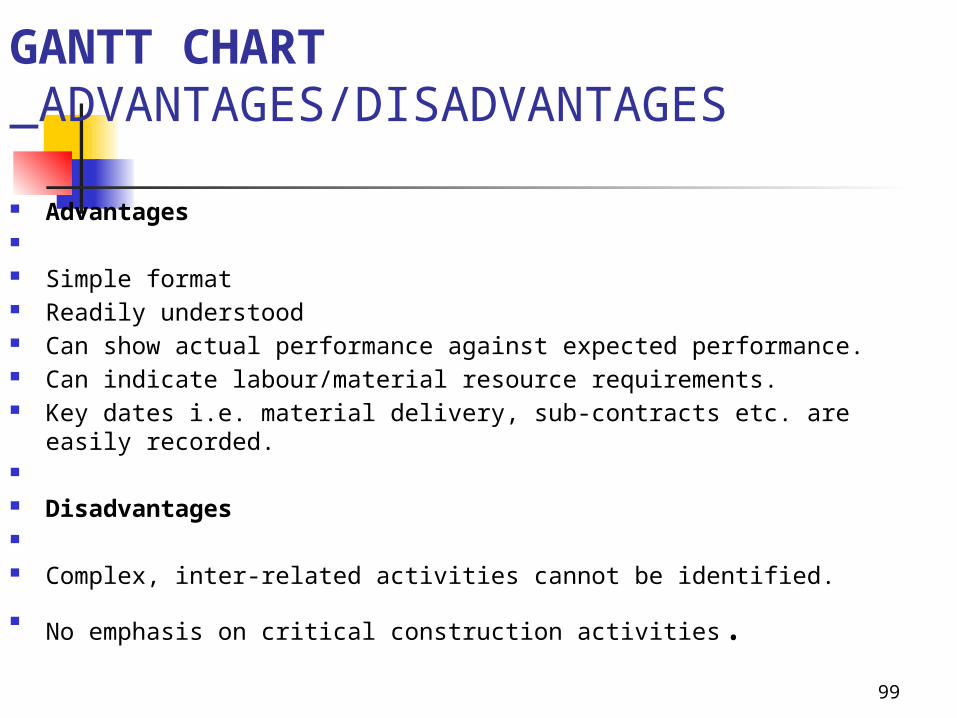
GANTT CHART_ADVANTAGES/DISADVANTAGES
Advantages Simple format Readily understood Can show actual performance against expected performance. Can indicate labour/material resource requirements. Key dates i.e. material delivery, sub-contracts etc. are easily recorded. Disadvantages Complex, inter-related activities cannot be identified.
No emphasis on critical construction activities.
100
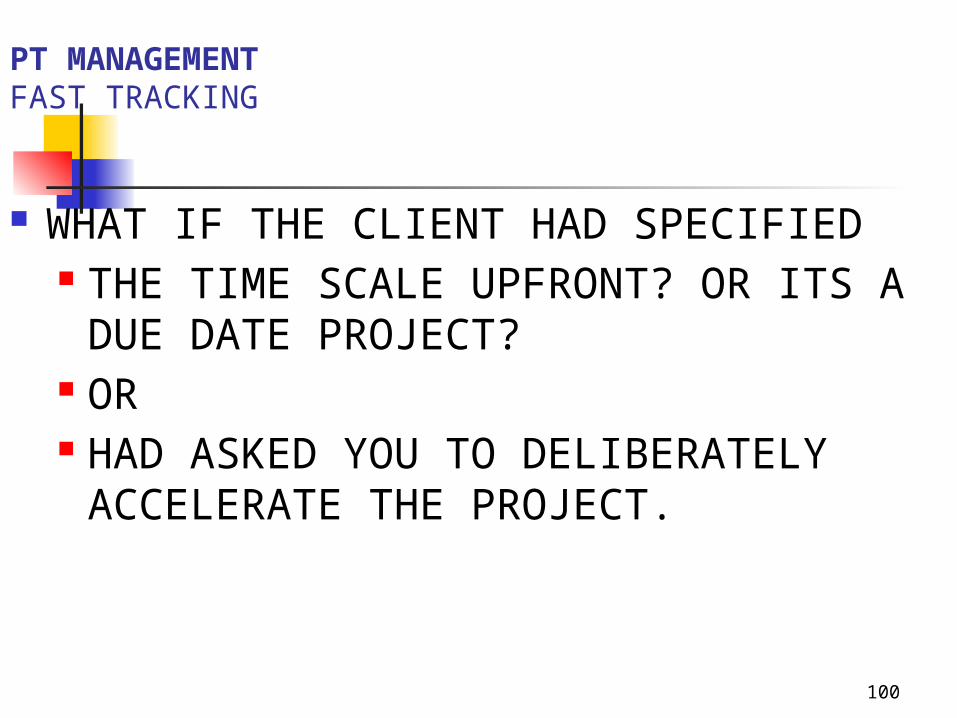
PT MANAGEMENT FAST TRACKING
WHAT IF THE CLIENT HAD SPECIFIED THE TIME SCALE UPFRONT? OR ITS A
DUE DATE PROJECT? OR HAD ASKED YOU TO DELIBERATELY
ACCELERATE THE PROJECT.

101
PT MANAGEMENT FAST TRACKING-METHODS
OVERLAPPING
CONCURRENCY
CRASHING

102
CLASS EXERCISE
Overlap/Concurrent the first two(2) activities:wake up and undress. Is it possible technically
Re-draw the network diagram What is the impact on the critical path
and the project duration Is it possible to overlap/concurrent the
last 2 activities; Shower and getting dressed

103
CLASS EXERCISE_NETWORK DIAGRAM
1.1Wake up
5
1.2 Get
Undressed5
1.3Take a Shower
20
1.4 Dress up
30Start

CLASS EXERCISE_NEW GANTT CHART
WBS code
Activity Name
Pr. Dur(mins)
Duration(Mins)
5 10
15
20 25
30
35 40
45 50 55
60
1.1 Wake up
- 5
1.2 Get Undressed
1.1
5
1.3 Take a shower
1.2
20
1.4 Dress -up
1.3
30

105
PT MANAGEMENT FAST TRACKING-FEASIBILITY/IMPACT
WHATEVER METHOD YOU CHOOSE
IT MUST BE FEASIBLE/POSSIBLE IMPACT ON THE NETWORK

106
PT MANAGEMENT _TIME M &C
Time control entails; the measurement of actual project progress
compared with the original or revised schedule or project plan,
measurement of what the implications of variances - if any - will be,
and the implementation of remedial action if needed.

107
Gantt Chart
WBS Activity/ Task
Pred. Dur. (mths)
Time(months) 1 2 3 4 5 6 7 8 9 10 11 12 13 14 15 16 17 18
Design - 3
Municipal Approval
1.1 1
Obtain Finance 1.1 3
Construction 1.2, 1.3
12
TODAY- END OF MONTH 9 Critical Activities Non-critical Activity Free Float- Tolerable delays/ 2 days SF Lag Time Progress
PT MANAGEMENT _TIME M & C

108
PT MANAGEMENT_TIME M&C_EFFECTIVENESS
Continuously/Regular measuring of the real time situation compared with the plan.
Time control is clearly of prime importance for successful project execution.
109
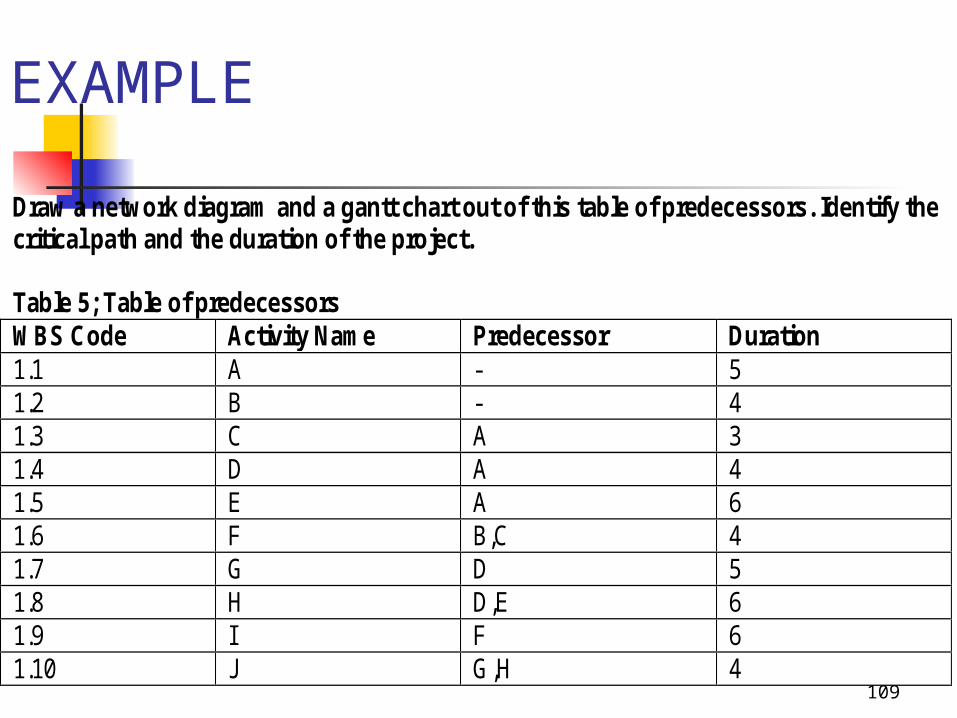
EXAMPLE
Draw a network diagram and a gantt chart out of this table of predecessors. Identify the critical path and the duration of the project. Table 5; Table of predecessors WBS Code Activity Name Predecessor Duration 1.1 A - 5 1.2 B - 4 1.3 C A 3 1.4 D A 4 1.5 E A 6 1.6 F B,C 4 1.7 G D 5 1.8 H D,E 6 1.9 I F 6 1.10 J G,H 4

110
NETWORK DIAGRAM
Dummy Dummy Critical path- A-E-H-J Critical Activities- A,E,H,J Non-critical Activities= B,C,F,I,D,G Critical Time/Project Duration- 21 days
Start
End A 5
B 4
D 4
E 6
C 3
G 5
H 6
F 4
J 4
I 6

111
GANTT CHART

112
PT MANAGEMENT_ SOFTWARES
Microsoft Visio Microsoft Project Microsoft Excel(SmartART),

113
PC MANAGEMENT PROCESS
Scope of Work Resource Requirements Cost estimating Cost budgeting Cost control Cost application.

114
PC MANAGEMENT _COST ESTIMATING
Cost estimating is the process of gathering information and predicting the cost of a project over its life cycle.
"An estimate is an intelligent evaluation of cost based on the minimum of knowledge.“
Cost estimation is a process that evolves throughout the project lifecycle
HOW REALISTIC IS THE COST ESTIMATE?

115
PC MANAGEMENT COST ESTIMATING & PROJECT LIFECYCLE
STAGE/PHASE TYPE OF COST ESTIMATE
LEVEL OF ACCURACY
CONCEPTUAL ORDER OF MAGNITUDEPARAMETRIC”BALL PARK” ESTIMATES”GUESSTIMATE”
HIGH LEVEL ROUGH ESTIMATE-30%- x- +50%
DESIGN & DEV’T PRELIM”BEST”ESTIMATEANALOGOUS ESTIMATEDESIGN TO COSTTOP-DOWN ESTIMATE
-15%- x- +30%
IMPLEMENTATION DEFINITIVE ESTIMATESCONTROL ESTIMATESBOTTOM-UP ESTIMATES
+/-5-15%

116
ORDER OF MAGNITUDE/BALL PARK ESTIMATES/PARAMETRIC ESTIMATES
Establishes a rough cost estimates based on known/published standardized units costs eg. cost/m2(buildings), cost/km(roads,pipeline) etc.
Before the scope of a project has been explicitly defined , these estimates provide a rough picture of the costs involved. It can be expected that errors will be in the neighborhood of ‐30% to 50%.

117
ORDER OF MAGNITUDE/BALL PARK ESTIMATES/PARAMETRIC ESTIMATES
Cost/m2(Students Hostel),2015 = R25,000/M2
Cost, Students hostel,2015= 1000x 25,000= R25MIL
Cost estimate Range;-30%-R25MIL-+50%

118
PRELIMINARY “BEST” ESTIMATE/ANALOGOUS ESTIMATE/TOP-DOWN ESTIMATE
Establish cost estimates by comparing to the cost of similar sized projects with an adjustment for cost escalation. Or compare to the cost of similar activities in another project.
Detailed engineering analysis may not yet be performed at this stage , but more detailed estimates concerning equipment and facility costs are made. The accuracy in this stage should be ‐15% to 30%.

119
PRELIMINARY “BEST” ESTIMATE/ANALOGOUS ESTIMATE/TOP-DOWN ESTIMATE
Cost of similar students hostel(900m2), 2011 = R20 MIL Cost of current students hostel(1000m2),2011
=1000/900*20MIL = R22.2 MIL Cost of current project(1000m2),2015 ?
Inflation/CPI; Published by the SA Statistics Department.
Calculate Price Adjustment factor(PAF): USE FORMULA; 1.126
Cost of current project(1000m2),2015? = 22.2 *1.126 =R25 MIL
Cost Estimate Range; -15%-R25MIL-+30%

120
PRELIMINARY “BEST” ESTIMATE/ANALOGOUS ESTIMATE/TOP-DOWN ESTIMATE
1.0 Build Hotel25 MIL
1.1 Design433,500
1.2 Municipal Approval5,500
1.3 Obtain Finance61,000
1.4 Construction24.5 MIL
1.4.1 Plumbing4.5 MIL
1.4.2 Electrical4MIL
1.4.3 Building16MIL

121
DEFINITIVE ESTIMATES/BOTTOM-UP/FINAL ESTIMATES
This involves the decomposition of the project scope into a deliverable oriented WBS.
Each deliverable cost is established in the WBS by the person responsible and this is added up to establish the overall cost of the project.
Final set of estimates to construct the cash flow
diagram. It is expected that errors will be ‐5% to 15%.

122
DEFINITIVE ESTIMATES/BOTTOM-UP/FINAL ESTIMATES -WBS ELEMENTS
1.0 Build Hotel
1.1 Design 1.2 Municipal Approval 1.3 Obtain Finance 1.4 Construction
1.4.1 Plumbing 1.4.2 Electrical 1.4.3 Building

123
DEFINITIVE ESTIMATES/BOTTOM-UP/FINAL ESTIMATES -WBS ELEMENTS_SCOPE OF WORK
Obtain finance_ R25 Million Design_ 1000 m2 hostel facility Municipal approval_400 bedrooms 3-
storey building, fenced and gated Construction
Plumbing_1000 m2 hostel facility Electrical_1000 m2 hostel facility Building Works_1000m2 hostel facility

124
DEFINITIVE COST ESTIMATE _WBS ELEMENT_RESOURCE REQUIREMENTS
ESTIMATE THESE RESOURCES FOR EACH WBS ELEMENT; LABOUR/MANPOWER PLANT& EQUIPMENT MATERIAL

125
DEFINITIVE COST ESTIMATE _WBS ELEMENT_RESOURCE REQUIREMENTS
_
ACTIVITY SCOPE LABOUR/MANPOWER
PLANT & EQUIP.
MATERIALS
OBTAIN FINANCE R25 MIL CEO/PM - -
DESIGN 1000M2 PM,Architect/Engineer
- -
MUNICIPAL APPROVAL 400 bedrooms 3-storey building,fenced and gated
PM,Municipality
- -
CONSTRUCTION
Plumbing Works 1000m2 Labourers,Artisans,
Small tools etc
Pvc pipes,joints,fittings etc
Electrical Works 1000m2 Labourers,Artisans,
Small tools etc
Conduit pipes,wires, fittings etc
Building 1000m2 Labourers,Artisans
Concrete Mixers,scaffold,Small tools etc
Cement, Ready Mix, Sand,Stone, Crusher run,Water,gravel,bricks etc
126
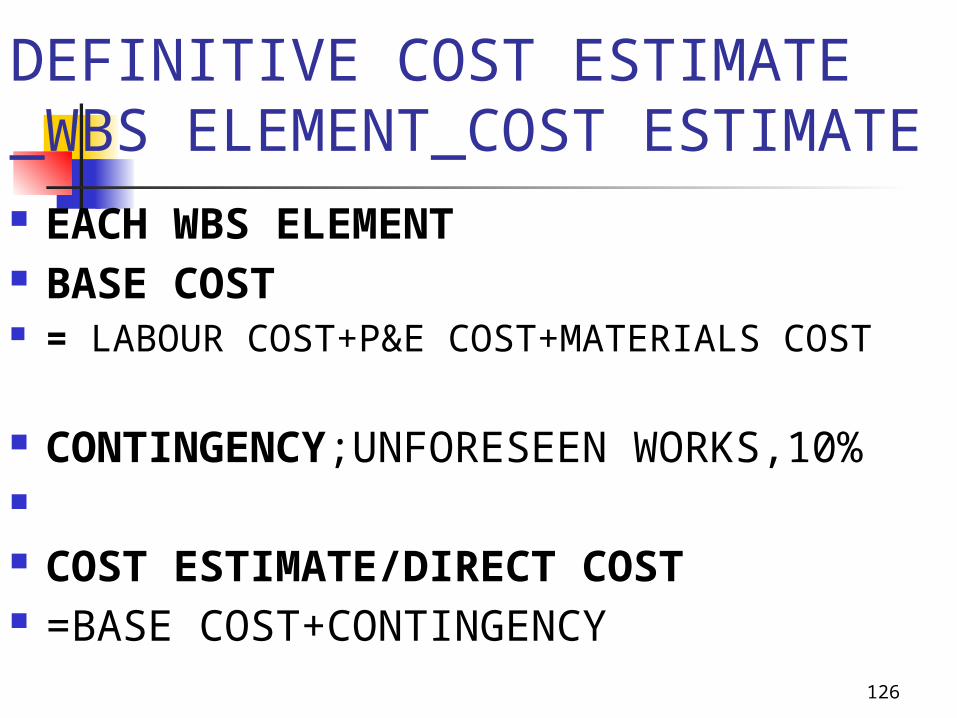
DEFINITIVE COST ESTIMATE_WBS ELEMENT_COST ESTIMATE EACH WBS ELEMENT BASE COST = LABOUR COST+P&E COST+MATERIALS COST
CONTINGENCY;UNFORESEEN WORKS,10%
COST ESTIMATE/DIRECT COST =BASE COST+CONTINGENCY

127
DEFINITE COST ESTIMATING_COST ESTIMATE BUILD UP
_
ACTIVITY SCOPE LABOUR/MANPOWER
PLANT & EQUIP.
MATERIALS BASE COST
OBTAIN FINANCE R25 MIL 60,000 - - 60,000
DESIGN 1000M2 400,000 - - 400,000
MUNICIPAL APPROVAL 400 bedrooms 3-storey building,fenced and gated
5000 - - 5000
CONSTRUCTION
Plumbing Works 1000m2 0.8 1 2 3.8 MIL
Electrical Works 1000m2 0.6 0.8 2.2 3.6 MIL
Building Works 1000m2 1.4 3.6 9.5 14.5 MIL
SUB-TOTALS 3.2 5.4 13.7 22.3 MIL
ADD 10% Contingency
2.3 MIL
TOTALS 24.6 MIL

128
DEFINITIVE COST ESTIMATE(DIRECT COST)
1.0 Build Hotel24.6 MIL
1.1 Design400,000
1.2 Municipal Approval5,500
1.3 Obtain Finance66,000
1.4 Construction24.2 MIL
1.4.1 Plumbing3.8 MIL
1.4.2 Electrical3.6MIL
1.4.3 Building14.5MIL

129
PC MANAGEMENT _COST BUDGETTING/COST BASELINE
Process of establishing cost budgets (allowable costs) against which the actual costs can be measured and managed.
A cost budget is an intelligent evaluation based on the maximum of knowledge.
Cost Budgeting is also process that evolves throughout the project lifecycle

130
PC MANAGEMENT COST BUDGETTING & THE PROJECT LIFECYCLE
STAGE/PHASE TYPE OF COST BUDGET LEVEL OF ACCURACY
CONCEPTUAL ORDER OF MAGNITUDEPARAMETRIC”BALL PARK” ESTIMATES”GUESSTIMATE”
HIGH LEVEL ROUGH ESTIMATE-30%- x- +50%
DESIGN & DEV’T PRELIM”BEST”ESTIMATEANALOGOUS ESTIMATEDESIGN TO COSTTOP-DOWN ESTIMATE
-15%- x- +30%
IMPLEMENTATION DEFINITIVE ESTIMATESCONTROL ESTIMATESBOTTOM-UP ESTIMATES
+/-5-15%

131
PC MANAGEMENT _COST BUDGETTING
COST BUDGET = Direct Costs+ Overheads/Indirect Costs Direct Cost; Labour Cost+P&E Cost+Material
Costs+Activity Overheads Indirect Cost; Overheads; Site Expenses/P&Gs+H/O
Expenses+Price Escalation+Contingencies

132
PC MANAGEMENT _BUDGET ESTIMATES_ELEMENTS
DIRECT COST OVERHEADS/INDIRECT COST:
ACTIVITY OVERHEADS(15%), TRANSPORT,MATERIAL WASTAGE/LOSSES ETC PRELIMINARY& GENERAL ITEMS(P&GS)(5%) SITE ESTABLISHMENT,SITE OVERHEADS,PERMITS ETC H/O EXPENSES(5%) H/O RENT,UTILITIES,H/O STAFF SALARIES,STATIONERY PRICE ESCALATION; (10%) CHANGES IN PRICE,BANK CHARGES &INTEREST RATES ETC,
10% COST BUDGET = DIRECT COST+ INDIRECT COST/OVERHEADS

133
PC MANAGEMENT _COST BUDGET ESTIMATES_SUMMARY
BASE COST – R24.6 MIL
ADD ACTIVITY OVERHEADS(15%) - R3.7 MIL
DIRECT COST - R28.3MIL
ADD P&Gs(5%) -R1.4MIL
ADD H/O EXPENSES(5%) - R1.4MIL
ADD PRICE ESCALATION(10%) -R2.8 MIL
COST BUDGET – R34 MIL

134
PC MANAGEMENT_COST BUDGET/COST BASELINE_ACTIVITY BASED
WBS CODE
WBS ACTIVITY BUDGET
1.1 OBTAIN FINANCE 60,000
1.2 DESIGN 400,000
1.3 MUNICIPAL APPROVAL 5000
1.4 CONSTRUCTION 22.3 MIL
CONTINGENCY(10%) 2.3 MIL
ACTIVITY OVERHEADS(15%) 3.7 MIL
P&GS(5%) 1.4 MIL
H/O EXPENSES(5%) 1.4MIL
PRICE ESCALATION(10%) 2.8 MIL
COST BUDGET 34 MIL

135
PC MANAGEMENT_COST BUDGET/COST BASELINE_RESOURCE BASED
ITEM NO. DESCRIPTION BUDGET(MIL)
1. LABOUR/MANPOWER 3.2
2. P&E 5.4
3. MATERIALS 13.7
CONTINGENCY(10%) 2.3
ACTIVITY OVERHEADS(15%) 3.7
P&GS(5%) 1.4
H/O EXPENSES(5%) 1.4
PRICE ESCALATION(10%) 2.8
COST BUDGET 34 MIL

136
PC MANAGEMENT _CASHFLOW BUDGETTING
Process of establishing cost budgets (allowable costs) against the project time.
A cashflow budget is an intelligent evaluation based on the maximum of knowledge.
Cashflow Budgeting is also process that evolves throughout the project lifecycle

137
PC MANAGEMENT CASHFLOW BUDGETTING & THE PROJECT LIFECYCLE
STAGE/PHASE TYPE OF CASHFLOW BUDGET
CONCEPTUAL PRELIMINARY(S-CURVE)WORK-PROGRAM RELATED
DESIGN & DEV’T PRELIMINARY(S-CURVE)WORK-PROGRAM RELATED
IMPLEMENTATION PRELIMINARY(S-CURVE)WORK-PROGRAM RELATED

138
PROJECT_OBJECTIVES(SCOPE)_EXAMPLE
To initiate, plan, build, furnish and equip the 400 bed student hostel at Cuba township near Butterworth within eighteen(18) months, at a cost not exceeding R25 million and which compiles/conforms to the Mnquma local municipality development plans/zoning restrictions for the area and SANS 1921 building code.

139
PC MANAGEMENT__PRELIMINARY CASHFLOW BUDGET(S-CURVE)
CUM COSTBUDGET(R
)
TIME(MONTHS)
18
28.3 MIL
S-CURVE

140
PRELIMINARY CASHFLOW BUDGET( ¼ -1/3 S-CURVE)
CUM. COST
BUDGET(R)
TIME(DAYS)18
28.3MIL
¼-1/3 S-CURVE

141
PC MANAGEMENT _CASHFLOW BUDGET
MONTH CUMULATIVE COST BUDGET(S-CURVE)
MONTHLY COST BUDGET
0 0 0
1 3 MIL 3MIL
2 5 MIL 2MIL
3 6 MIL 1 MIL
4 . .
. . .
. . .
18 25 MIL
TOTALS 25 MIL

142
PC MANAGEMENT_COST BUDGET CONTROL
This is the process of gathering, analysing, comparing and monitoring the costs of a project and reporting the results continuously during the life cycle of a project.

143
PC MANAGEMENT_COST BUDGET CONTROL METHODS
VARIANCE /EVM REPORTS Reports in which actual expenditure and cost
budget are generated and compared monthly

144
PC MANAGEMENT_COST CONTROL METHODS-VARIANCE REPORTS
WBS CODE
WBS ACTIVITY BUDGET(A)
ACTUAL EXP.(B)
VARIANCE(A-B)
1.1 OBTAIN FINANCE 60,000 50,000 10,000
1.2 DESIGN 400,000 600,000 (200,000)
1.3 MUNICIPAL APPROVAL 5000 . .
1.4 CONSTRUCTION 22.3 MIL . .
CONTINGENCY(10%) 2.3 MIL . .
ACTIVITY OVERHEADS(15%)
3.7 MIL . .
P&GS(5%) 1.4 MIL . .
H/O EXPENSES(5%)
1.4MIL . .
PRICE ESCALATION(10%)
2.8 MIL . .
COST BUDGET 34 MIL . .

145
PC MANAGEMENT_COST CONTROL METHODS_EVM REPORTS
BUD
GET
ACTUAL
EXP.
BUDGET/VARIANCE
DIRECT COST BUDGET
TIME(MONTHS)
MONTH 9

146
PC MANAGEMENT_COST CONTROL METHODS_CODE OF ACCOUNTS_RESOURCE CODING
WBS CODE
WBSACTIVITY
DESCRIPTION
COST CODE
DESCRIPTION
BUDGET
1.4.3 BUILDING
MATERIALSM1
1.4.3.1.11.4.3.1.21.4.3.1.31.4.3.1.4
CementReady mix Sand/stoneCrusher run
R1MILR5MILR3MILR0.6MIL

147
PC MANAGEMENT_COST CONTROL METHODS_RESOURCE CODING_EXAMPLE
Resource cost code, e.g. 040714311 will thus mean:
PROJECT NO.; 07 of YEAR 2004 COST CODE : 14311 RESOURCE : CEMENT BUDGET: R1 MIL ACTUAL EXPENDITURE: R900,000

148
PQ MANAGEMENT_WHAT IS QUALITY?
QUALITY(%) = QUALITY PERFORMANCE QUALITY EXPECTATIONS THE DEGREE OF ACHIEVEMENT/COMPLIANCE OF
QUALITY EXPECTATIONS HIGH QUALITY(= OR >100%), LOW QUALITY(<100%) HIGH QUALITY QUALITY PERFORMANCE = OR >QUALITY
EXPECTATIONS LOW QUALITY QUALITY PERFORMANCE < QUALITY EXPECTATIONS

149
PQM_QUALITY_EXAMPLES
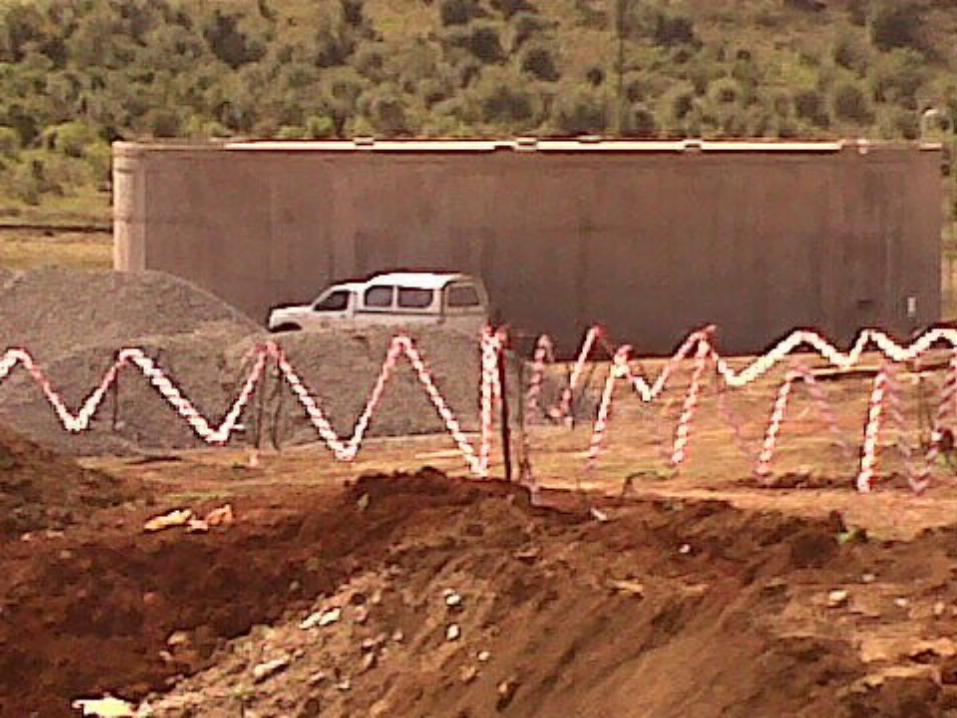
Poor Quality hostel building Poorly designed floor space Roof leakage Imbalanced heating & ventilation systems
Good quality/high quality hostel building Correct floor layout No leakage Mech/electrical systems functioning correctly

PQM_QUALITY

151
PQM_QUALITY

152
PQM_QUALITY

153
PQM_QUALITY

154
PQM_QUALITY EXPECTATIONS/REQUIREMENTS
IS QUALITY EXPECTATIONS SUBJECTIVE? IS QUALITY EXPECTATIONS A PERCEPTION? “BEAUTY LIES IN THE EYES OF THE BEHOLDER” PLATO TO REMOVE THE SUBJECTIVITY AND PERCEPTIONS QUALITY EXPECTATIONS/REQUIREMENTS ARE STANDARDIZED INTO/EXPRESSED IN; QUALITY STANDARDS QUALITY REGULATIONS QUALITY CODES QUALITY SPECIFICATIONS QUALITY SYSTEMS QUALITY PROGRAMS QUALITY POLICIES DRAWINGS

155
PQM_ QUALITY STANDARDS
Mandatory Quality Requirements Area-Specific regulations eg. Mnquma local municipality zoning
restrictions for Cuba area Industry quality regulations eg.CESA or ECSA,CIDB,NHBRC
Quality Legislation quality standards eg. SANS 1921-Building works,
SANS 1200- Civil Engineering Works, SANS 241-drinking water International Quality requirements eg ISO 9001 Client/End-User Quality Requirements
Project Objectives/Scope_Deliverables Construction Contract(Project/Technical Quality) requirements
Contractor Quality Requirements In-house quality requirements/policies
WHAT QUALITY STANDARDS GOVERNS YOUR PROJECT?

156
PQM_QUALITY CRITERIA
PERFORMANCE AND ACCEPTANCE CRITERIA
COMPLETENESS & CORRECTNESS CRITERIA
ACTIVITY; SOIL COMPACTIONQUALITY CRITERIA; 98% DRY DENSITY
ACTIVITY; CONCRETEQUALITY CRITERIA; STRENGTH>30Mpa,Slump +/- 100mm

157
PQM_QUALITY ASSURANCE STANDARDS/CRITERIA
Activity; Concrete Mixing
Quality Assurance Standards; SABS 1200 GA-1982 CLAUSE 5.4.3
Quality Assurance Criteria: c.) The volume of the mixed material per batch
shall not exceed the rated capacity of the mixer.

158
PQM _QUALITY CONTROL STANDARDS/CRITERIA
Activity; Manufacture 25 MPa Concrete
Quality Control Standards; SABS 1200 GA-1982 CLAUSE 7.3
Quality Control Criteria
If any valid test result for a specific grade of concrete is more than 3 MPa below the specified strength , the concrete yielding such result will be deemed not to comply with the requirements of the specification.

159
PQM_QUALITY STANDARDS/QUALITY CRITERIA
QUALITY STANDARDS
QUALITY CRITERIA

160
PQM_QUALITY PERFORMANCE_3 DIMENSIONS
Does the process quality influence the deliverable quality? Yes
Is the process quality the only influencing factor for deliverable quality? No
What other factors outside the process could influence the deliverable quality?
QC Process

161
PQM_TOTAL QUALITY PERFORMANCE_3 DIMENSIONS
WE ARE INTERESTED IN THE QUALITY PERFORMANCE OF;
PROCESS, DELIVERABLE QC(V&V) PROCESS
PROCESSProcedures
Methods
DELIVERABLE
QC(V&V) PROCESS, sampling, walkthroughs, deliverable reviews,
inspections, tests

162
PQM_TOTAL QUALITY PERFORMANCE- 3 DIMENSIONS
COOKING SOUP
INGREDIENTS MIXING
CAKE
QC(V&V) Process
QC(V&V) Process

PQM_TOTAL QUALITY PERFORMANCE_3 DIMENSIONS_EXAMPLE
Activity; Manufacture of 25 Mpa R.Concrete
Does the Quality of the Process influence the Quality of the Deliverable? Is the process quality the only influencing factor for deliverable quality? What other factors outside the process could influence the deliverable quality? You need Quality Compliance for the process, the deliverable and the QC
process
Process(Mixing of Concrete)
Deliverable(25MPa RC)
QC(V&V) Process

164
PQM_TOTAL QUALITY PERFORMANCE_3 DIMENSIONS
A PROJECT LIFECYCLE IS MADE OF MANY PROCESSES UNDERTAKEN TO PRODUCE A DELIVERABLE AND THESE DELIVERABLES ARE SUBJECTED TO QUALITY CONTROL(V&V) PROCESS TO ENSURE QUALITY COMPLIANCE.
165
PQM_TOTAL QUALITY PERFORMANCE_3 DIMENSIONS
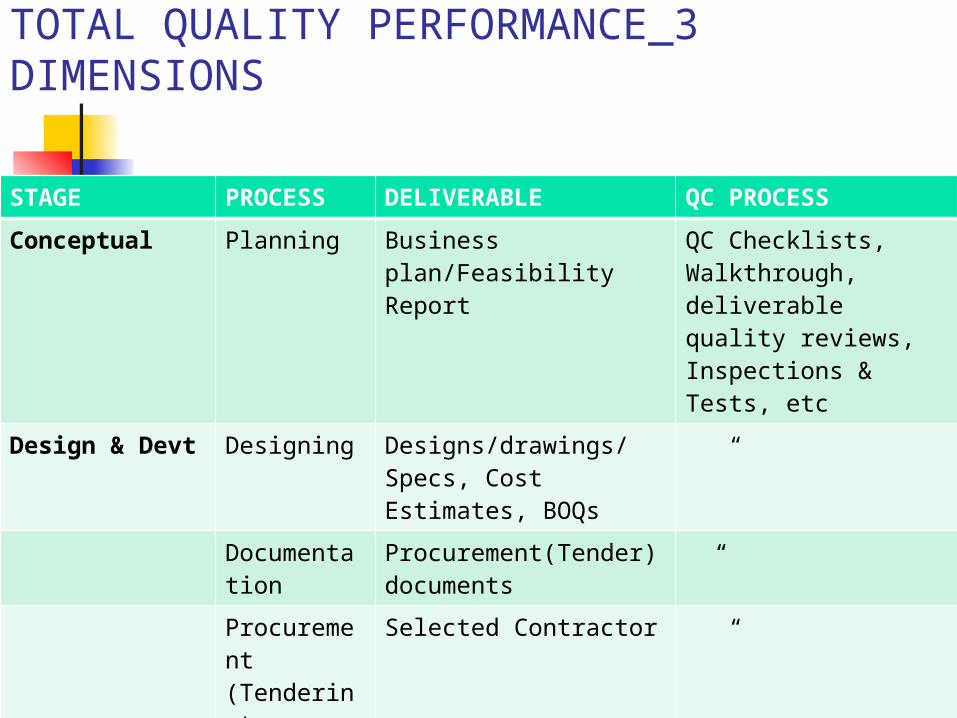
STAGE PROCESS DELIVERABLE QC PROCESS
Conceptual Planning Business plan/Feasibility Report
QC Checklists, Walkthrough, deliverable quality reviews, Inspections & Tests, etc
Design & Devt Designing Designs/drawings/Specs, Cost Estimates, BOQs
“
Documentation
Procurement(Tender) documents
“
Procurement(Tendering)
Selected Contractor “
Implementation
Construction
Building,Road,Water System etc
“
Termination Termination Building,Road,Water System etc
“
O& M O& M Product in use (Building,Road,Water System etc)
“

166
PQM_QUALITY PERFORMANCE_3 DIMENSIONS
Processes Deliverable/Product/
End-Result/
Output(O)
Controls(C):Quality
Standards
Inputs(I);materials, Data
Mechanisms(M)P&E, Staff,Techniques
QC(V& V) PROCESS
M
I O
C

167
PQM_TOTAL QUALITY PERFORMANCE_ 3 DIMENSIONS_EXAMPLE
WATER TREATMENTPROCESS
WATERO
QC(V&V) PROCESS
M
I
C
I
C
M
O

168
PQMQUALITY_RESPONSIBILITY
QUALITY PERFORMANCE; QC: CONTRACTOR(CQCO), QA: CPM,(CQAO),ENGINEER,INDEPENDENT
CONTRACTOR
QUALITY EXPECTATIONS; CLIENT/END-USERS/REGULATORS

169
PQM_GOOD QUALITY _BENEFITS
Less Warranty claims/work_O&M Stage
Less Repairs / maintenance Client satisfaction and reward Less Rework. High morale Gain trust

170
PQM_POOR QUALITY_COST
Frequent Warranty claims/work_O&M High Repairs / maintenance Client dissatisfaction Help desk. Support staff Rework. Works Failure/Disaster Poor morale Mistrust
There is a reward/penalty for quality.

171
PQM
IS A JOURNEY UNDERTAKEN THROUGHOUT ALL THE PROCESSES AND DELIVERABLES AND THEIR QC(V&V) PROCESSES WITHIN THE PROJECT LIFECYCLE
172
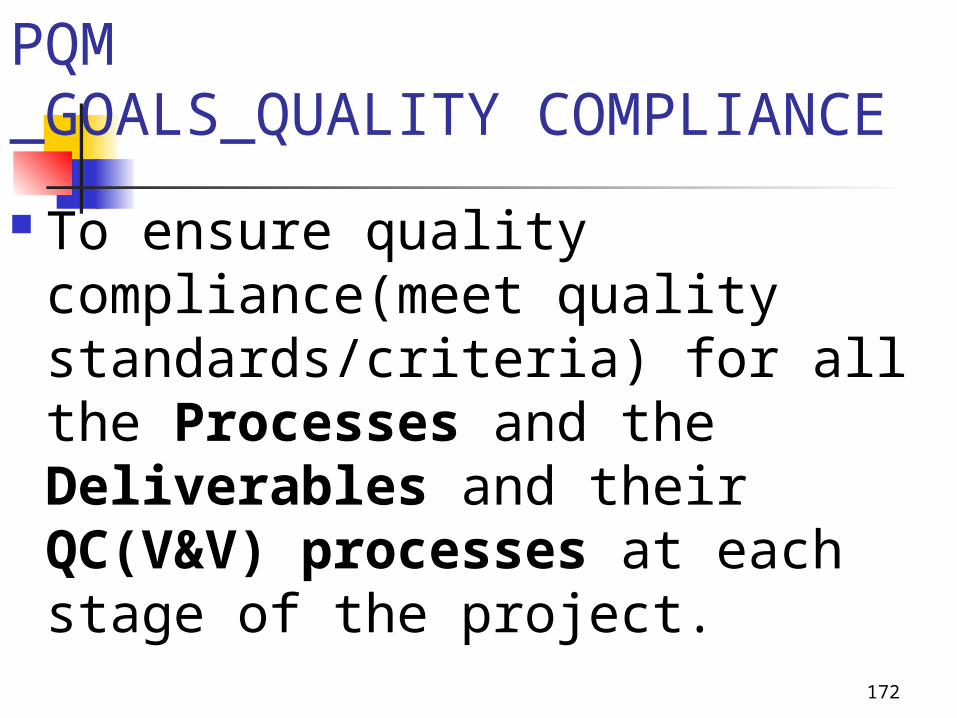
PQM_GOALS_QUALITY COMPLIANCE
To ensure quality compliance(meet quality standards/criteria) for all the Processes and the Deliverables and their QC(V&V) processes at each stage of the project.

173
PQMGOAL:QUALITY COMPLIANCE
TO ENSURE THAT THE PROCESSES AND DELIVERABLES & the QC(V&V) PROCESSES MEET THE QUALITY CRITERIA AND STANDARDS.
Quality Standards/Criteria
Processes, Deliverables,QC(V&V) processes

174
PQMGOAL:QUALITY COMPLIANCE
Quality Standards
Processes, Deliverables,QC(V& V) processes
Quality Criteria

175
PQM
PROCESSQUALITY STANDARDS
QUALITY CRITERIA
DELIVERABLE
QA (V&V) PROCESSQUALITY STANDARDS
QUALITY CRITERIAQAPQA
QC(V&V) PROCESSQUALITY STANDARDS
QUALITY CRITERIAQCPQC
CONTRACTOR(CQCO)
CPM,(CQAO),ENGINEERINDEPENDENT CONTRACTOR

176
PQMQUALITY ASSURANCE(QA)_PURPOSE
Planned evaluation of the quality of the processes and their QC(V&V) processes to verify & validate their quality compliance.
VERIFICATION & VALIDATION(V&V) PROCESS
QA Activities; Quality Assurance Audit, Quality Assurance Checklist, Quality Assurance Checkpoints

177
PQM_QA AUDIT
ProcessesDeliverable/
Product/End-Result/
Output(O)
Controls(C):Quality
Standards
Inputs(I);materials, Data
Mechanisms(M)P&E, Staff,Techniques
QC(V& V) PROCESS
QA(V& V) PROCESS
I
C
M
O(QC Results)

178
PQM_QUALITY CONTROL(QC)_PURPOSE
Planned evaluation of the quality of the deliverables to verify and validate their quality compliance
QC Activities Quality control check list, Deliverable review, Structured walkthroughs, Inspections, Statistical sampling, Testing( Laboratory/In-situ)
179
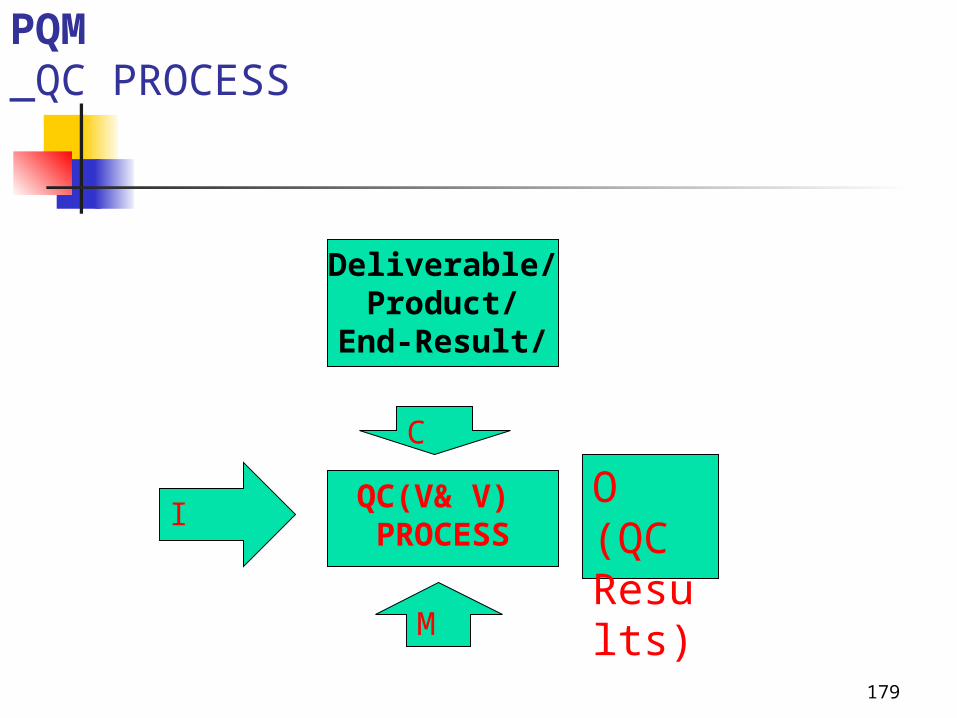
PQM_QC PROCESS
Deliverable/Product/
End-Result/
QC(V& V) PROCESS
O(QC Results)
C
M
I

180
PQM_QC PROCESS
On-going checks and acceptance procedures on the deliverable to ensure quality compliance
VERIFICATION & VALIDATION(V&V) PROCESS
QC Activities QC Checklists Statistical Sampling Structured Walkthroughs Deliverable reviews Inspections Tests( Laboratory/In-situ)

181
PQM_QC PROCESS_INSPECTIONS/TESTS

182
PQM_QC PROCESS_SAMPLING,TESTS

183
PQM_QC PROCESS_ INSPECTIONS,TESTS,DRAWING REVIEW

184
PQM_QC PROCESS_ TESTS,QC CHECKLISTS

185
PQM_QC PROCESS_ TESTS,INSPECTIONS

186
PQM_QC PROCESS_ TESTS(LAB)

187
PQM_TOTAL QUALITY MANAGEMENT(QA/QC)
Processes Deliverable/Product/
End-Result/
Outputs(O)
Controls(C):Quality
Standards
Inputs(I);materials, Data
Mechanisms(M)P&E, Staff,Techniques
QC(V& V) PROCESS
QA(V& V) PROCESS
I
C
M
O

188
PQMPROJECT_OBJECTIVES(SCOPE)_EXAMPLE
To initiate, plan, build, furnish and equip the 400 bed student hostel at Cuba township near Butterworth within eighteen(18) months, at a cost not exceeding R29 million and which complies/conforms to the Mnquma local municipality development plans/zoning restrictions for the area and SANS 1921 building code.

189
PQM PROCESS_ A 3-STAGE PROCESS
Plan for QualityQMP•QAP•QCP
Plan ImplementationPerform QAPerform QC

190
PQM PROCESS_ QUALITY MANAGEMENT PLAN(QMP)
1.QAP 2.QCP 3.QA/QC-QUALITY RELATED
TOOLS 4.QA/QC PROBLEM RESOLUTION
PLAN

191
1. QMP_ QAP
Critical project processes; Project Processes+ QC(V&V) Processes_ICOM
QA Standards Mnquma Local municipality development plans/zoning restrictions for the area SANS 1921 building code.
QA Criteria QA Activities
Quality Assurance Audit, Quality Assurance Checklist, Quality Assurance Checkpoints QA Activity plan
Process QA Activity Frequency/When?
Who?
Design QA AuditQA ChecklistQA Checkpoints
Monthly ClientCPMCQAOIndependent quality contractorEngineer
Municipal Approval
“ “ “
Obtain Finance
“ “ “
Construction
“ “ “

192
2. QMP_QCP Key deliverables( building,drawing,report)
QC Requirements Quality standards(ISO 9001 etc) Quality criteria (95% defect free etc)
QC Activities Quality control check list, Deliverable review, Structured walkthroughs, inspections, Statistical sampling,
Testing
QC Activity PlanDeliverable QC Activity Frequency/When? Where? Who?
Drawing Drawing Review
At final delivery Client’s office Independent Reviewer
Municipal Devt.Permit
MDP Review “ Client’s office Client
Funds(R25Mil) Inspections “ Client’s office Client
Building Inspections, & Testing
Monthly Contractor’s Lab
Contractor

193
3. QMP_QA/QC_ QUALITY EVALUATION/RELATED TOOLS
Control charts, Pareto charts, Run charts, SPC, histograms, scatter diagrams, compliance checklists Process Flow Charts

194
4. QMP_QC/QA PROBLEM RESOLUTION PLAN
QA & QC Results unsatisfactory Non conformance/Non-Compliance reports(NCR) Rework;
Take corrective steps to bring the deliverable to compliance
Investigate causes of non-compliance; Pareto charts, Cause & effect diagrams
Corrective/Preventative Action Plan (CAR/PAR Reports) Process Improvement plan

195
QAP/QCP- Examples Activity RC Columns construction QA Activities
QC Activities
Process QA Activities When/Frequency Who
Concreting-Columns
Check dimensions, rebar size and placement of columns
Before Conncrete pour CM/CQAO
Concrete Supply Review inspection reports of concrete supplied
Before concrete pour CM/CQAO
Deliverables QC Activities When/Frequency
Where Who
Concrete Materials
Sampling Before Concrete mixing
On Site Contractor/CQCO
Hardened Concrete
Cube tests After 28 days Contractors Lab Contractor/CQCO
Fresh Concrete Slump test Before Concrete pour
On Site Contractor/CQCO

196
QAP/QCP_EXAMPLES Activity Compaction test for trenching,backfilling &compacting Quality Standards; ASTM D698 Quality Criteria 95% of Max dry density QA
QC
Process QA When Who
Compaction Test 7-10% Verification test
Monthly CM/CQAO
Deliverable QC When Where Who
Trench base Compaction test
After Completion
Contractor’s testing laboratory
Contractor/CQCO

197
QAP/QCP_EXAMPLES
Activity Leakage test for pressure piping Quality Standards; ASTM C-828 Quality Criteria Rate of leakage has stabilized for 3 consecutive 15 minutes intervals QAP
QCP
QA/QC Problems: Any leaks detected shall be permanently stopped.
Process QA When Who
Leakage Test All tests shall be witnessed by the CM_
During the Test CM
Deliverable QC When Where Who
Pressure Pipe Leakage Test Results of all leakage tests shall submit to CM within 2 working days of test completion._
On-Site Contractor

198
PQM_ PERFORM QA_ QA AUDIT
QA Standards
QA Criteria
Perform QA QA Audit
QA Audit Results
QA Audit Results Evaluation
Non-compliance Report_NCR
Investigate non-compliance
Corrective Action/Preventative Action Report_CAR/ PAR
Processes(ICM)QC Process(ICOM)
Satisfactory?
No

199
PQM_ PERFORM QC
QC Standards
QC Criteria
Perform QCSampling, Walkthroughs, Inspections, Tests
QC Results
QC Results Evaluation
Non-compliance Report_NCR
Investigate non-compliance
Corrective Action/Preventative Action Report_CAR/ PAR
Deliverables
Satisfactory?
No
Rework

200
TUTORIAL3CASE STUDY
READ THE PROJECT CASE STUDY ATTACHED AND DESCRIBE THE DISTINCTIVE ELEMENTS OF THE PROJECT UNDER THE FF,HEADINGS;
BACKGROUND: NEEDS/WANTS GOALS OBJECTIVES(SCOPE)- S.M.A.R.T. DELIVERABLES ORGANISATIONAL STRUCTURE PROJECT MANAGER MULTI-DISCIPLINARY TEAM COMPOSITION PHASE OF DEVT. BUDGET TIME SCALE( DUE DATE/ASAP PROJECTS) STAKEHOLDERS PROBLEMS/ISSUES HOW WOULD YOU RESOLVE THESE PROBLEMS/ISSUES IS THE PROJECT A SUCCESS OR A FAILURE? EXPLAIN? KEY TAKE AWAYS/LESSONS