Lecture 8: Distributional considerations
22
15.03.2005 Tor Iversen Lecture 8: Distributional considerations Reference on the reading list: Williams and Cookson
-
Upload
inga-decker -
Category
Documents
-
view
21 -
download
0
description
Lecture 8: Distributional considerations. Reference on the reading list: Williams and Cookson. Problem to be discussed:. With voluntary insurance each person decides for himself the kind of insurance contract he would like to have. Hence, the allocation of - PowerPoint PPT Presentation
Transcript of Lecture 8: Distributional considerations

15.03.2005 Tor Iversen
Lecture 8:Distributional considerations
Reference on the reading list: Williams and Cookson

Problem to be discussed:
With voluntary insurance each person decides for himself the kind of insurance contract he would like to have. Hence, the allocation of health care and the implied allocation of health is not a public concern.
With compulsory insurance the allocation of health care and the distribution of health in the population become challenges for political assemblies
Hence, distributional considerations (equity in health) become important to consider

What is meant by equity?
According to Williams: reducing inequalities in health
Assume that health is easily measurable, and interpersonal comparable for
instance in terms of Quality Adjusted Life Years (QALYs). (Of course
problematic, but convenient for sorting out various concepts at this stage)

Utilitarianism – maximize total health
Health of A
Health of B
F
X
F
F-F health frontier – the farthest you get with the available resources and the individuals’ capacity to benefit from health services in terms of health improvements.
The welfare function has linearindifference curves with 45 degree angles with both axes. This implies that a health improvement is of equalsocial value independent of who ishaving it and on what level of healthhe is initially.
45◦

A shift in the utility frontier
Health of A
Health of B
F
Y
F’
F-F has shifted to F’-F’ to the benefitof A
We can think of two reasons:-B has a smaller capacity to benefit
for instance because of old age-A’s disease has been less expensive
to treat
The utilitarian approach is not concerned about why theshift occurs.
X
F
F’

Greater weight for A than B
Health of A
Health of B
F
X
F
Welfare contours steeper than45 degrees
For some reason A deserves agreater weight than B

Health of A
Health of B
F
X
F
The welfare function has convexnon- linear indifference curvesThe better health you have the smaller is the weight that an additional improvement in healthis given in the social valuation

Health of A
Health of B
F
X
F
The welfare function has non- linear kinked indifference curvesOnly improvement in healthfor the person with the lowesthealth level is given a positive social valuation
Maxi-min
Allocate resources to maximize the level of health to the person who is least well off.
Need Seriousness of disease
45◦
Very strong preference for equality in health

An example (see also introduction): Prioritizing services and groups of patients according to explicit
goals
• Related to degrees equity concern
Group I Treatment I
Group II Treatment II
Group III Treatment III
5 years survival without treatment
5 % 30 % 92 %
5 years survival with treatment
15% 60 % 97 %
Treatment cost per patient
100.000 100.000 100
Number of patients 100 100 100 Cost per saved life 1000.000 333.300 2.000

Alternative rules (criteria) for making priorities:
A: Priority according to the seriousness (prospects without the treatment)of the disease
Prioritize according to increasing survival without treatment
B: Priority according to treatment effectPrioritize according to difference in survival with treatment and without treatment, such that the group with the greatest difference is given first priority.
C: Maximize total health within the resource constraint Prioritize according to increasing cost per saved life, such that the group with lowest cost per saved life is given first priority.
D: Priority according to the seriousness of the disease constrained by an upper limit on cost per saved life.
E: Maximize total health constrained by a lower limit on the seriousness of disease

The importance of criteria for prioritizing the three treatments
Treatment I Treatment II Treatment III A:Priority according to seriousness
1
2
3
B:Priority according to treatment effect
2
1
3
C: Maximize total health
3
2
1
D:Priority according to seriousness given that cost per saved life is less than 900 000
Not compatible with constraint
1
2
E: Maximize total health given that the probability of survival without treatment is less than 90%
2
1
Not compatible with constraint

Some implications:
Optimal priority-setting depends on the aims that the health sector is expected to pursue including the distributional considerations
It is possible to obtain a considerable total health gain by prioritizing treatments with modest effect given that they are sufficiently inexpensive
Criteria C and E is at a disadvantage for patients who, because of some reason, do not manage to get much health out of the health services
The cost of treatment relative to other treatments should not influence priority according to criteria A and B.
The introduction of cost saving technologies should influence priorities according to criterion C (and possibly D and E), but not according to criteria A and B
Cost- benefit analysis are relevant for priority decisions only according to criteria C, D and EHence, if you are in favor of criteria A or B, it is inconsistent simultaneously to argue that cost-benefit analysis should have an increased role as a means to allocating resources within the health sector

In fact the three types of criteria mirror quite well the criteria actually used in legislations and other regulation of priority-setting
Norway: Act on the right of patients (1999), Article 2 (my translation):The patient has a right to necessary help from the specialist health service when:1. The patient has a considerable reduction in length of life or quality of life if treatment is
postponed.2. The patient may have an expected health improvement from the treatment3. The expected cost is in a reasonable relation to the expected effect of the treatment
Which of the three criteria apply here?Ammendment (2003):The specialist health service should, based on medical criteria, decide on a time limit for a patient with a right to treatment…… If the regional health enterprise does not manage to give a patient necessary treatment within the prescribed time limit, then the patient has a right to receive treatment without further delay, if necessary from a private provider or a provider abroad.
• Tendencies in development of criteria over time?

• In Norway the ambition of equity in the allocation of medical care is high among all political parties.
• The instruments for auditing whether these goals are fulfilled are not equally ambitious.
• Decentralized decision-making makes it hard to verify whether approved priority rules in fact are adhered to
• An example of a Norwegian study – see http://www.hero.uio.no/publicat/2005/HERO2005_2.pdf
• The Norwegian Act on Health Enterprises states that the aim of the health enterprises is to provide high quality specialist health care on an equitable basis to patients in need, irrespective of age, sex, place of residence, material resources and ethnic background.
• To what extent is this goal fulfilled?

Patient flows(system of referrals not strictly adhered to when the study was done)
Patient GP
Private specialist
Hospital outpatient
Hospital inpatient

• Panel data of survey of living-conditions (Statistics Norway) merged with data on capacity and accessibility to general practice and specialist care
• A representative national sample consisting of 3501 individuals
• Reported use of outpatient visits and visits to private specialists during the last year
• Self-assessed health
• Accessibility index: Describing the access to specialist health care at the municipality level
• Specialist care includes: -hospitals, outpatient and inpatient care -privately practicing physician specialists
• Incorporated in the index is:-capacity of the specialized health care -discounted distance
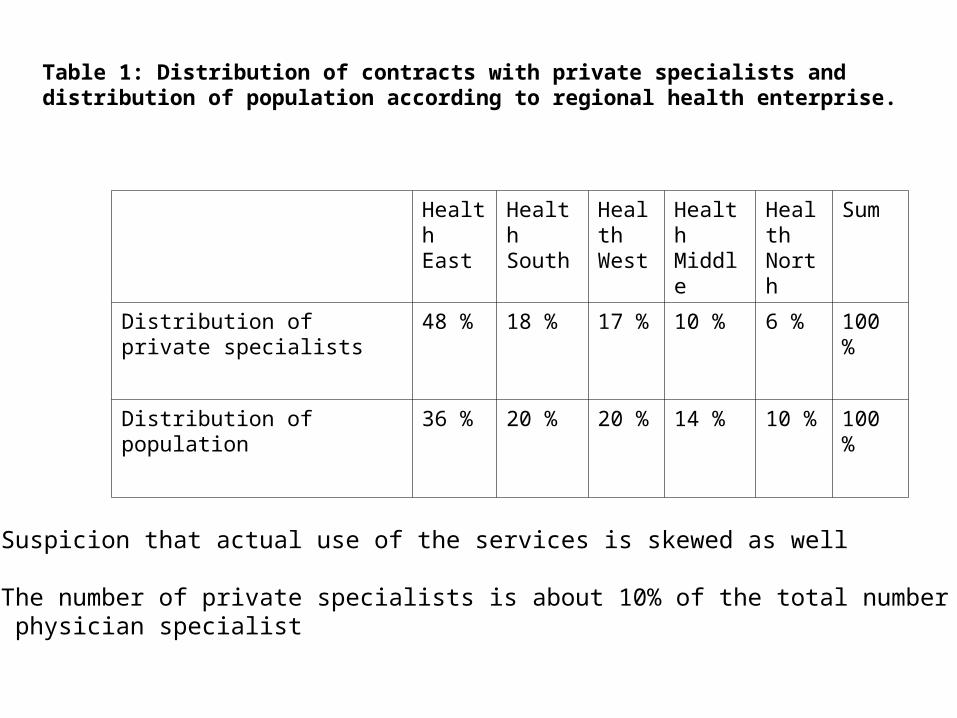
Table 1: Distribution of contracts with private specialists and distribution of population according to regional health enterprise.
Health East
Health South
Health West
Health Middle
Health North
Sum
Distribution of private specialists
48 % 18 % 17 % 10 % 6 % 100 %
Distribution of population 36 % 20 % 20 % 14 % 10 % 100 %
Suspicion that actual use of the services is skewed as well
The number of private specialists is about 10% of the total number of physician specialist

0.22
0.14 0.14
0.09 0.09
0
0.05
0.1
0.15
0.2
0.25
Helse Øst Helse Sør Helse Vest Helse Midt-Norge Helse Nord
Private physician specialists with a contract 2003Number of man-labor years per 1000 inhabitants
Kilde: Statistics Norway

Variable Definition Private specialist visits N=589 (17%)
Hospital outpatient visitsN=667 (19%)
The whole sample N=3501
Very good health =1 Very good health 0.19 0.17 0.26
Good health =1 Good health 0.46 0.41 0.50
Fair health =1 Fair health 0.23 0.27 0.17
Bad or very bad health =1 Bad or very bad health 0.12 0.15 0.07
Chronic illness =1 if the person has a chronic illness0.46 0.49
0.31
Man =1 if man 0.38 0.39 0.48
Age The respondent’s age 47.1(16.5)
48.4(16.5)
44.6(16.6)
Junior high =1 if highest education is junior high 0.16 0.21 0.18
University low =1 if university degree after 3 years 0.21 0.21 0.21
University high =1 if university degree after 5 years or more 0.06 0.03 0.05
Household income Household income in NOK 100,000 3.86 (7.93)
3.35(2.71)
3.38(3.85)
Descriptives

Variable Definition Private specialist visits N=589 (17%)
Hospital outpatient visitsN=667 (19%)
The whole sample N=3501
GPs per 10,000 residents No. of GPs per 10,000 residents in the municipality
7.71(1.53)
7.81(1.69)
7.79(1.67)
Personal GP =1 if the individual consider himself to have a personal GP. 0.68 0.69
0.60
Regular health center =1 if individual sees a regular health center 0.21 0.23 0.24
Hospital outpatient visits
=1 if individual has been at hospital for outpatient visits during the last 12 months 0.31 1
0.19
Number of hospital outpatient visits
The number of hospital outpatient visits during the last 12 months.
0.69(2.16)
2.58(6.35)
0.49(2.95)
Visits to a private specialist
=1 if individual has had at least one visit to a private specialist during the last 12 months 1 0.27
0.17
Number of visits to private specialists
The number of visits to privately specialists during the last 12 months
2.34(4.89)
0.68(2.33)
0.39(2.19)
Access to hospital beds Accessibility index estimated for hospital beds 1.83(2.43)
1.52(2.25)
1.68(2.37)
Access to hospital physician
Accessibility index estimated for hospital physicians
2.10(2.84)
1.70(2.58)
1.90(2.73)
Access to private specialists
Accessibility index estimated for private specialists
2.70(3.57)
2.03(3.19)
2.31(3.42)
Descriptives II

Estimated effect of independent variables (Statistically significant at 5% level) on the probability of at least one visit to private specialists or hospital outpatient departments during the last 12 months. Marginal effect estimated from a multinomial logit model
Private specialist Hospital outpatientConstant -0.17Very good health -0.08 -0.13Good health -0.05 -0.11Fair health -0.05 -0.06Chronic illness 0.05 0.06Man -0.05 -0.04High school 0.04University low 0.04University high 0.11Age:31-50 0.04Age: 51-70 0.04 0.05Age: 70< 0.06Household income 0.005GPs per 10,000 residents -0.01Personal GP 0.07Regular health center 0.07Access to private specialists 0.07Access to hospital physicianAccess to hospital beds

Conclusion:
A person’s self-assessed health contributes to the probability of hospital outpatient visits and visits to private specialists in the sense that poorer health increases the probability of a visit
The utilization of hospital outpatient clinics is not influenced by socioeconomic factors
A person’s accessibility to hospital physicians does not contribute to the probability of hospital outpatient visits
The utilization of private specialists is influenced by the accessibility to specialists and a patient’s socioeconomic characteristics, such as education and income
An individual with a higher university degree living in a municipality with the best access to private specialists has a 46 percentage points higher probability of at least one visit to a private specialist compared with an individual with junior high living in a municipality with poorest access to private specialists
Private specialists seems to offer services that are supplemental to services provided by the outpatient departments and alternative to services offered by the GPs.
Implications for health policy?
Should specialists be relocated or ambitions regarding equity be reduced?


![1.2cm Lecture 1: [1ex] Background and Overview Hamiltonians and Phase Diagrams … · 2019-07-09 · Lecture 1: Background and Overview Hamiltonians and Phase Diagrams Distributional](https://static.fdocuments.in/doc/165x107/5f1252578a2c7b204e2441c7/12cm-lecture-1-1ex-background-and-overview-hamiltonians-and-phase-diagrams-2019-07-09.jpg)