Lecture 7 Notes
40
HE191 Principles of Economics Lecture 7 Chapters 23 and 24 Principles of Economics, Fourth Edition N. Gregory Mankiw
-
Upload
dao-tuan-anh -
Category
Documents
-
view
327 -
download
0
Transcript of Lecture 7 Notes

HE191Principles of EconomicsLecture 7
Chapters 23 and 24Principles of Economics, Fourth Edition
N. Gregory Mankiw
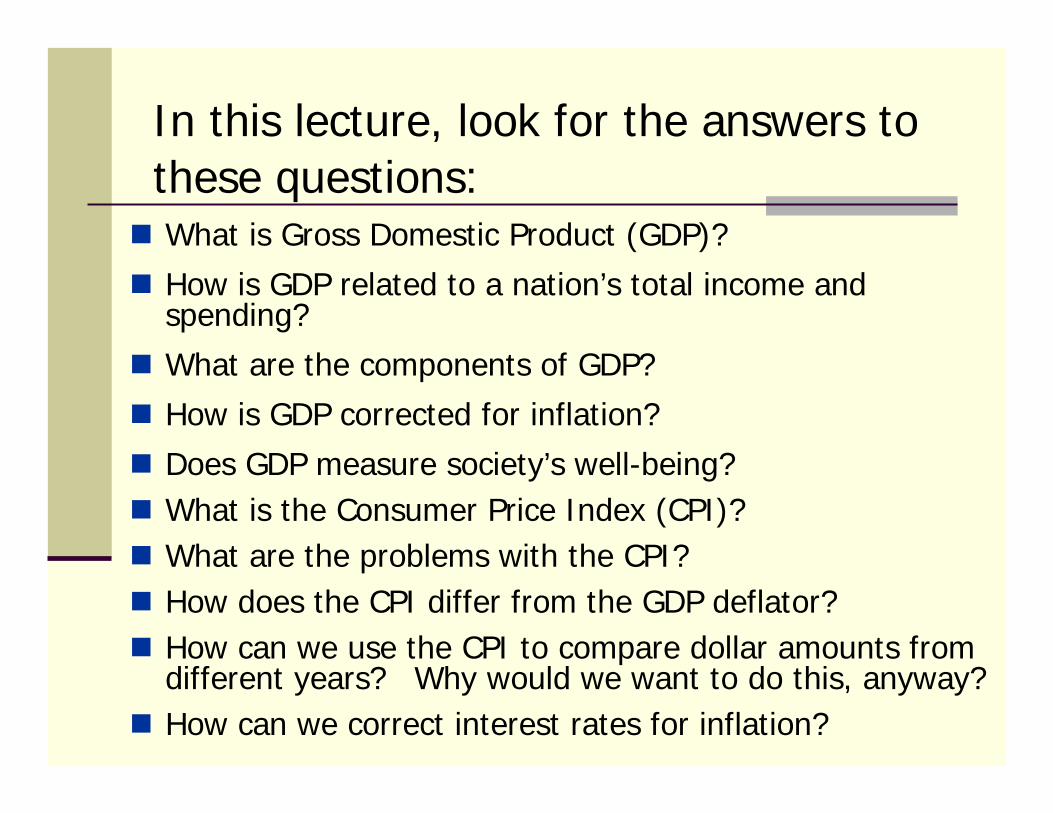
In this lecture, look for the answers to these questions:What is Gross Domestic Product (GDP)?
How is GDP related to a nation’s total income and spending?
What are the components of GDP?
How is GDP corrected for inflation?
Does GDP measure society’s well-being?What is the Consumer Price Index (CPI)?What are the problems with the CPI?How does the CPI differ from the GDP deflator? How can we use the CPI to compare dollar amounts from different years? Why would we want to do this, anyway?How can we correct interest rates for inflation?
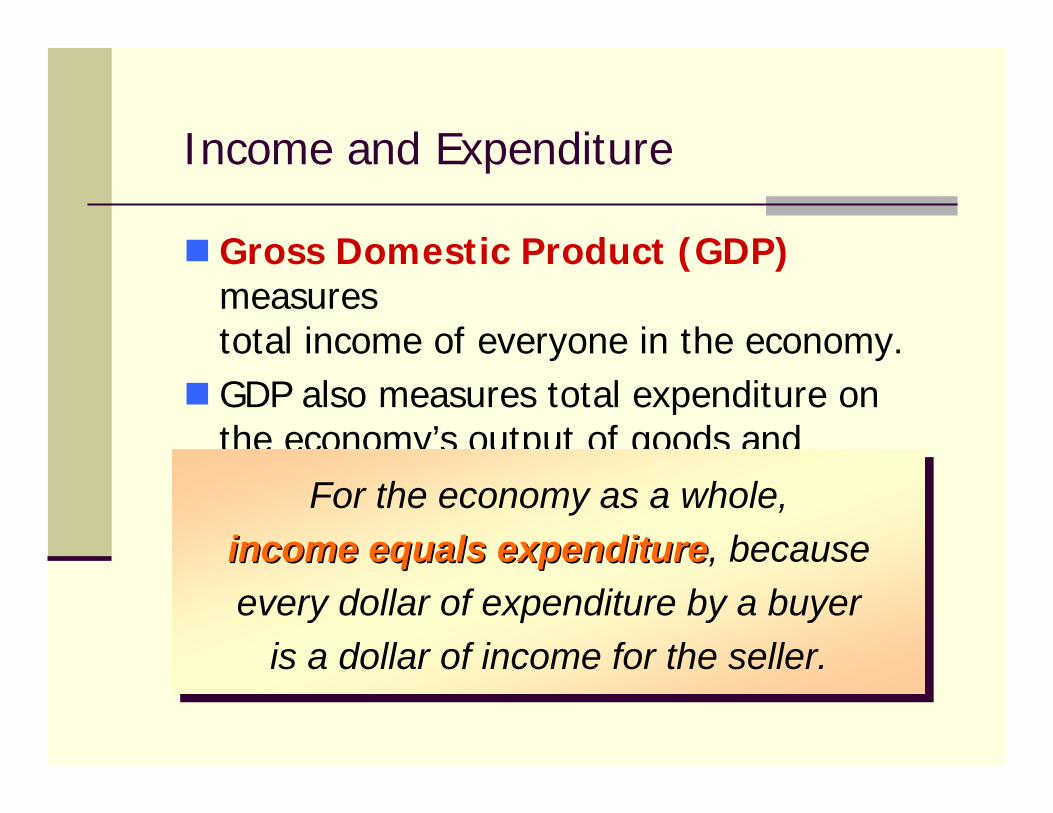
Income and Expenditure
Gross Domestic Product (GDP)measures total income of everyone in the economy. GDP also measures total expenditure on the economy’s output of goods and services. For the economy as a whole, income equals expenditure, because every dollar of expenditure by a buyer
is a dollar of income for the seller.
For the economy as a whole, income equals expenditureincome equals expenditure, because every dollar of expenditure by a buyer
is a dollar of income for the seller.
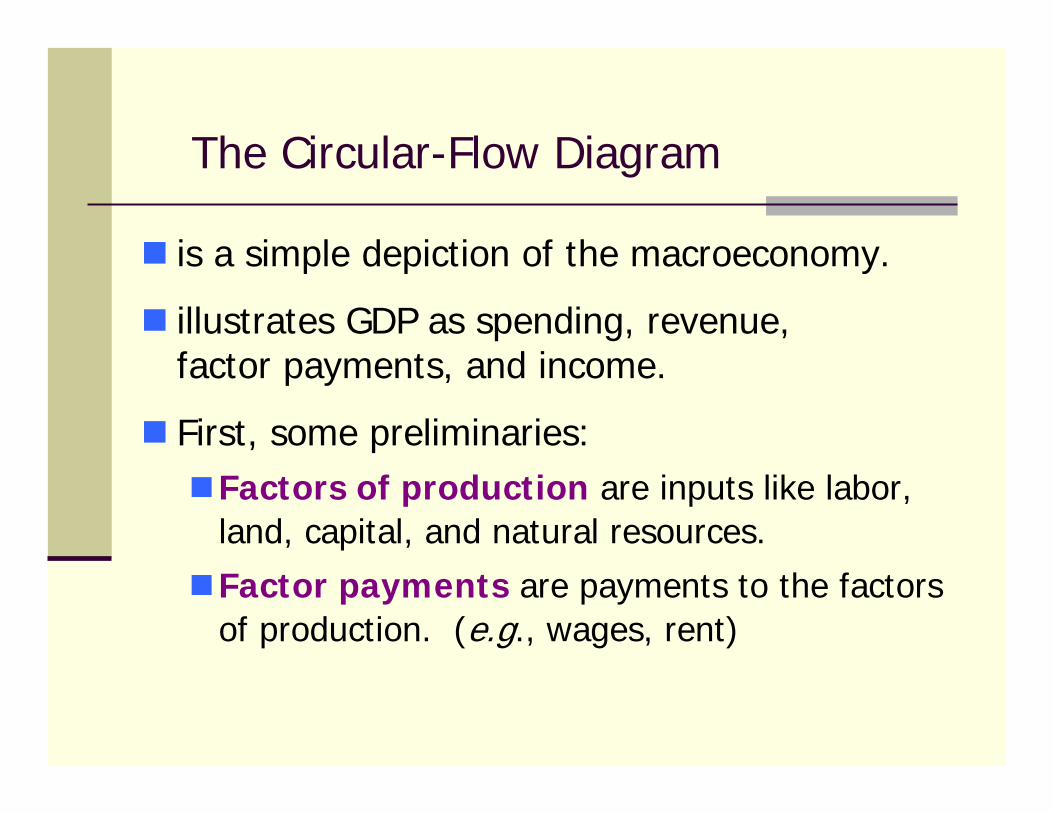
The Circular-Flow Diagram
is a simple depiction of the macroeconomy.
illustrates GDP as spending, revenue, factor payments, and income.
First, some preliminaries:Factors of production are inputs like labor, land, capital, and natural resources.
Factor payments are payments to the factors of production. (e.g., wages, rent)
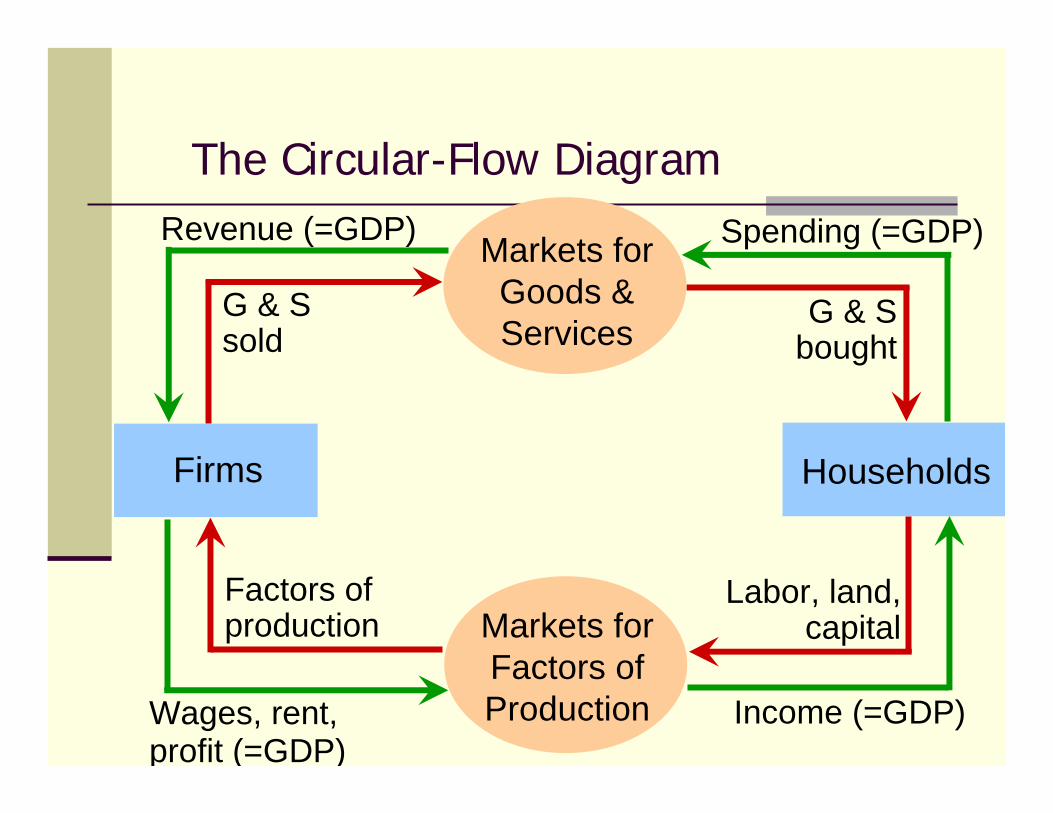
The Circular-Flow Diagram
Markets for Factors of Production
HouseholdsFirms
Income (=GDP)Wages, rent, profit (=GDP)
Factors of production
Labor, land, capital
Spending (=GDP)
G & S bought
G & S sold
Revenue (=GDP) Markets for Goods & Services
What This Diagram OmitsThe government
collects taxespurchases g&s
The financial systemmatches savers’ supply of funds with borrowers’demand for loans
The foreign sectortrades goods and services, financial assets, and currencies with the country’s residents
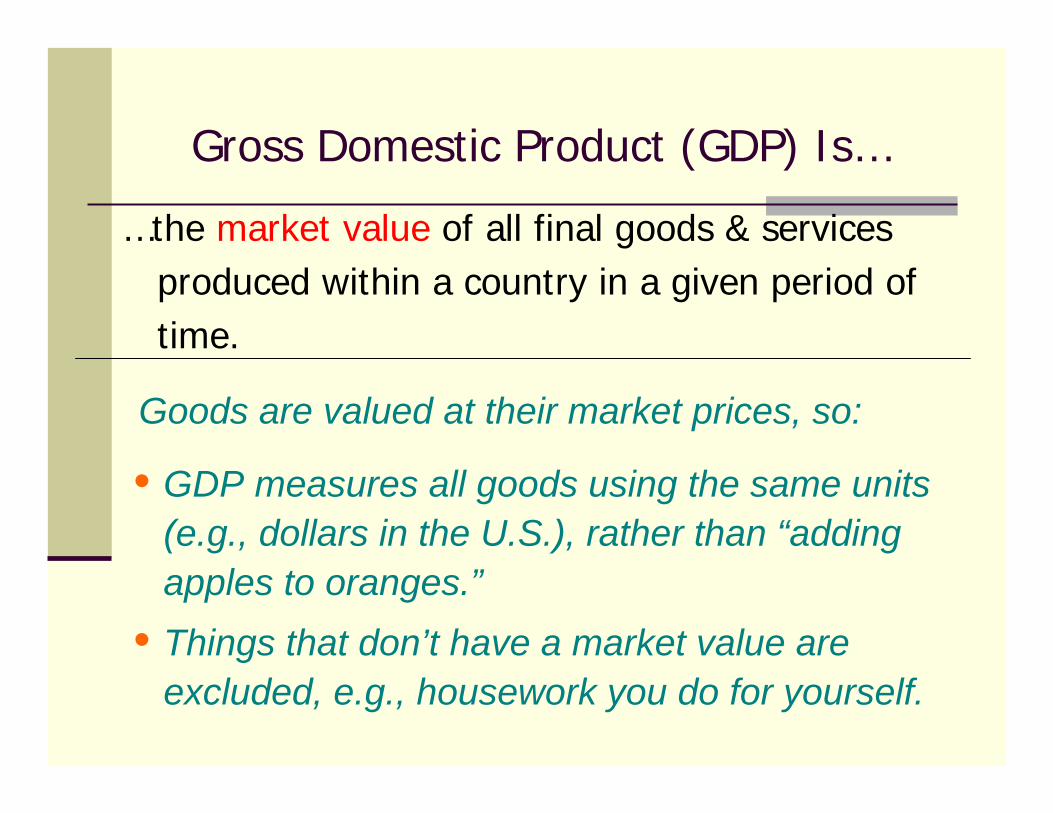
…the market value of all final goods & services produced within a country in a given period of time.
Gross Domestic Product (GDP) Is…
Goods are valued at their market prices, so:
• GDP measures all goods using the same units (e.g., dollars in the U.S.), rather than “adding apples to oranges.”
• Things that don’t have a market value are excluded, e.g., housework you do for yourself.
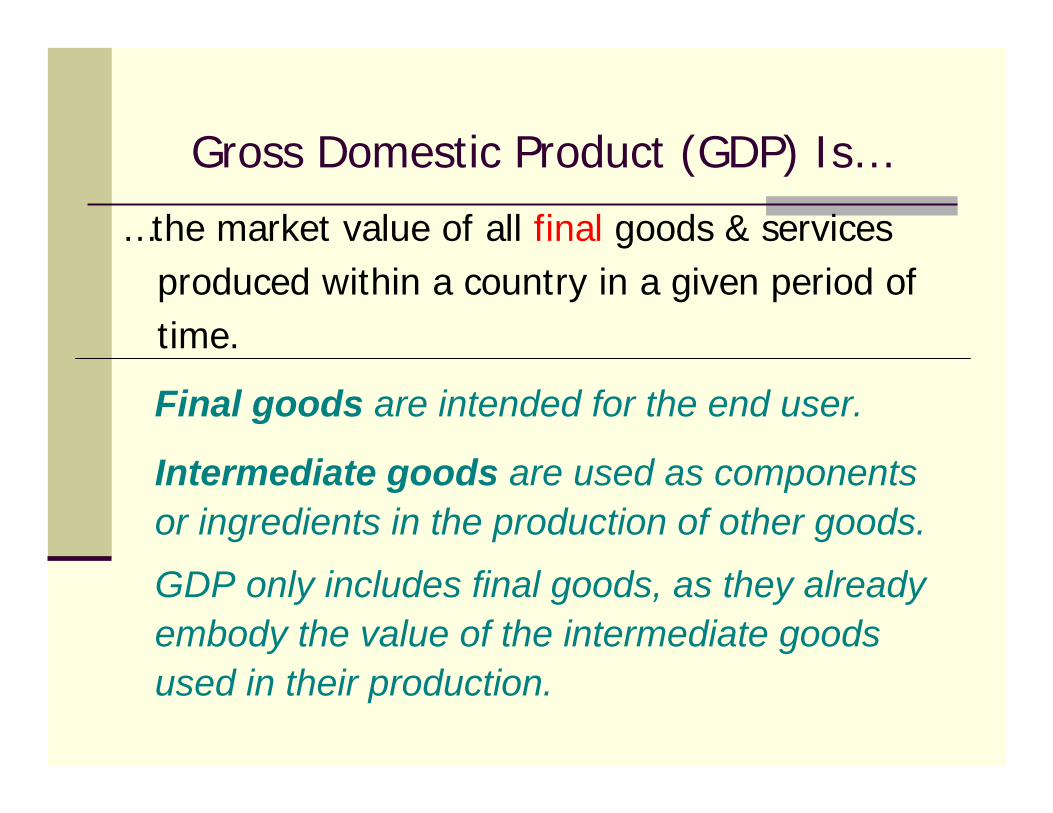
…the market value of all final goods & services produced within a country in a given period of time.
Gross Domestic Product (GDP) Is…
Final goods are intended for the end user.
Intermediate goods are used as components or ingredients in the production of other goods.
GDP only includes final goods, as they already embody the value of the intermediate goods used in their production.
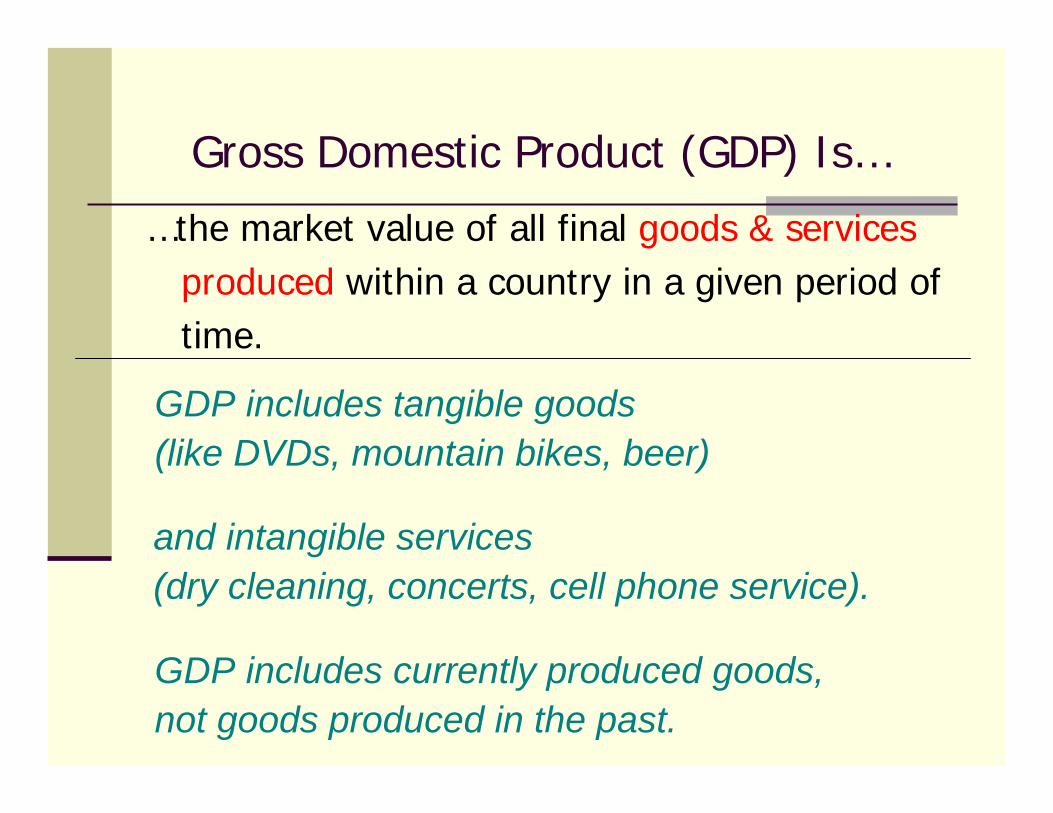
…the market value of all final goods & servicesproduced within a country in a given period of time.
Gross Domestic Product (GDP) Is…
GDP includes tangible goods (like DVDs, mountain bikes, beer)
and intangible services (dry cleaning, concerts, cell phone service).
GDP includes currently produced goods, not goods produced in the past.
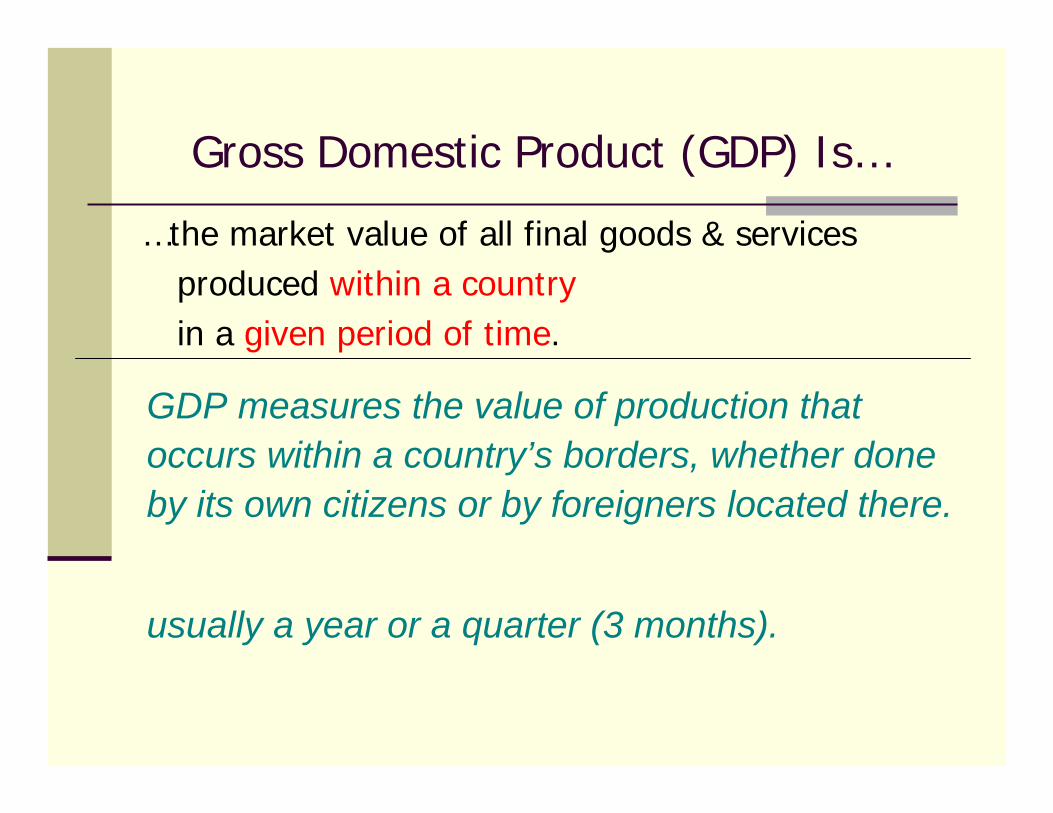
…the market value of all final goods & services produced within a countryin a given period of time.
Gross Domestic Product (GDP) Is…
GDP measures the value of production that occurs within a country’s borders, whether done by its own citizens or by foreigners located there.
usually a year or a quarter (3 months).
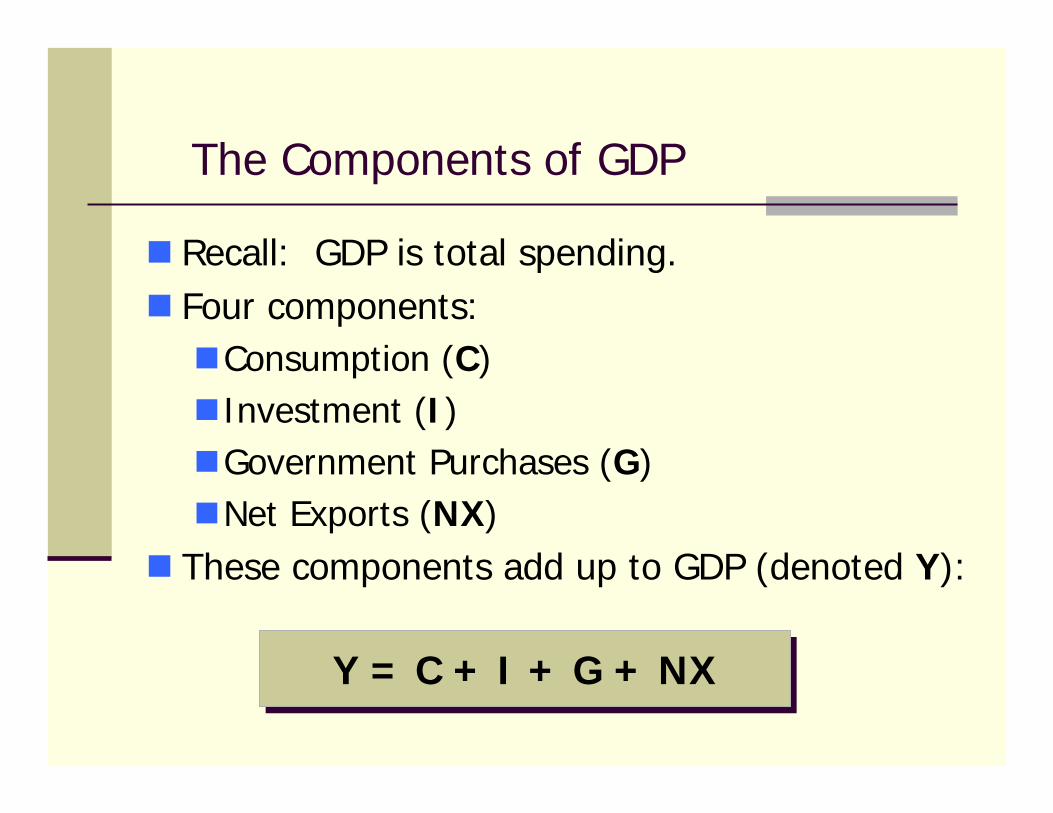
The Components of GDP
Recall: GDP is total spending. Four components:
Consumption (C)Investment (I)Government Purchases (G)Net Exports (NX)
These components add up to GDP (denoted Y):
Y = C + I + G + NXY = C + I + G + NX
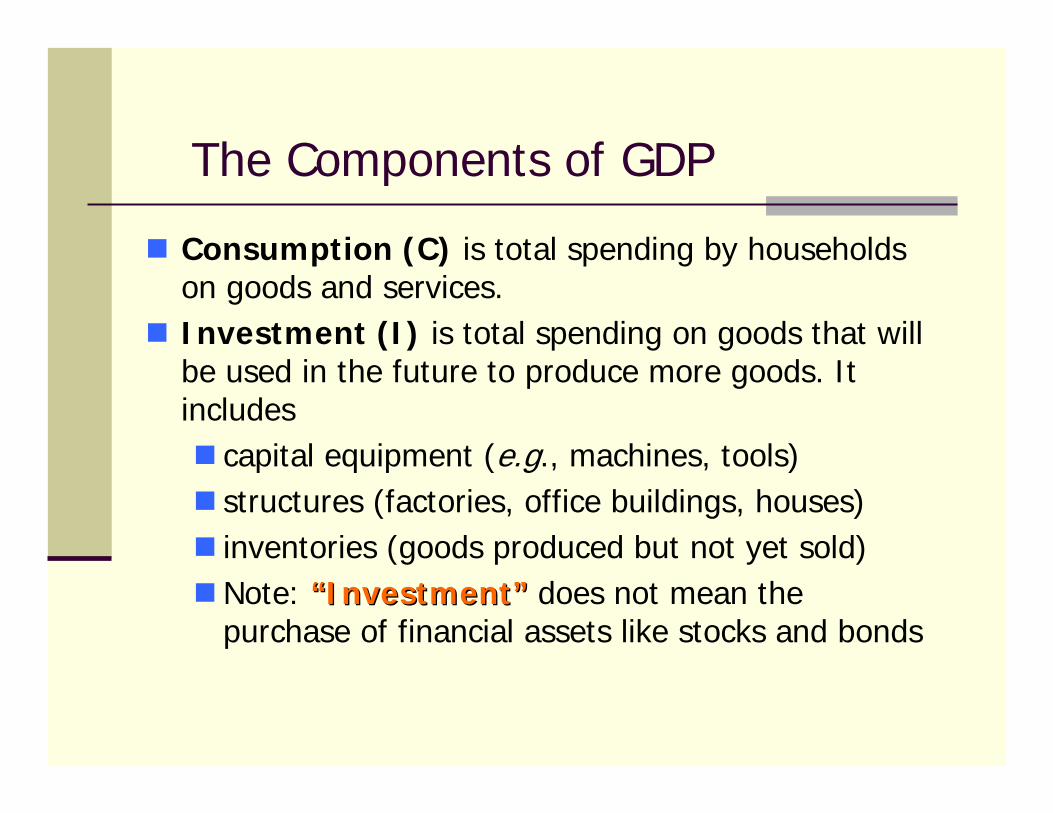
Consumption (C) is total spending by households on goods and services.Investment (I) is total spending on goods that will be used in the future to produce more goods. It includes
capital equipment (e.g., machines, tools)structures (factories, office buildings, houses)inventories (goods produced but not yet sold)Note: ““InvestmentInvestment”” does not mean the purchase of financial assets like stocks and bonds
The Components of GDP
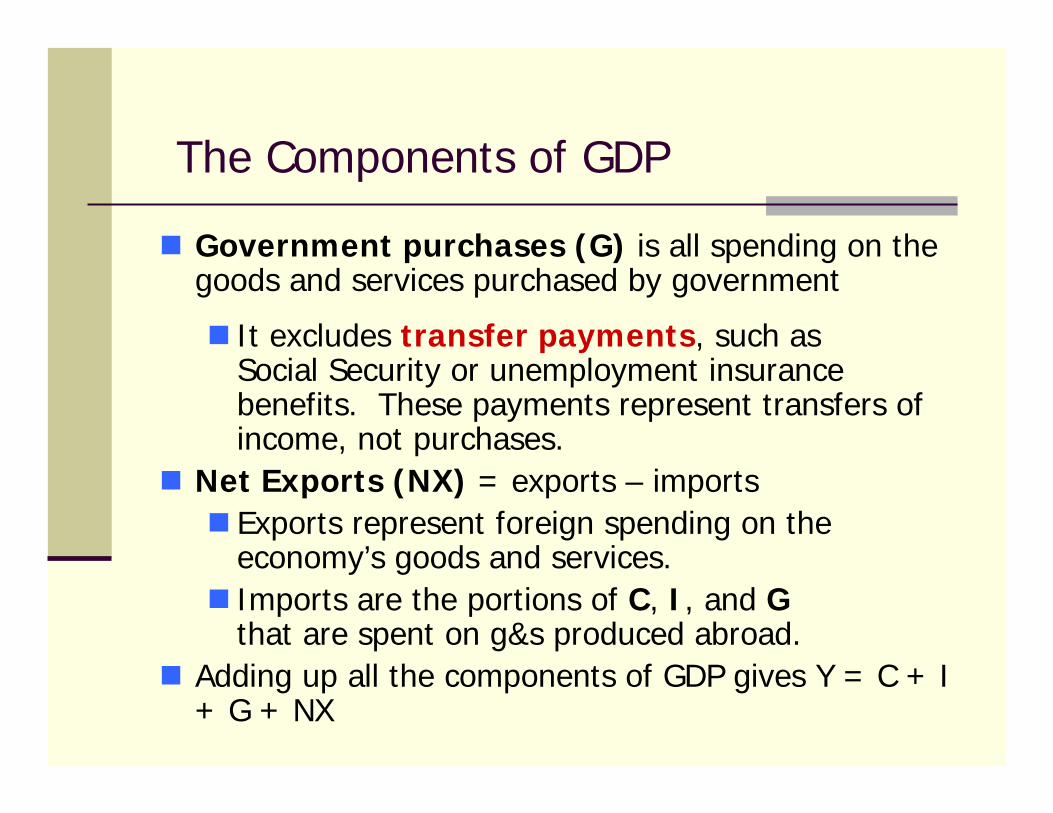
Government purchases (G) is all spending on the goods and services purchased by government
It excludes transfer payments, such as Social Security or unemployment insurance benefits. These payments represent transfers of income, not purchases.
Net Exports (NX) = exports – importsExports represent foreign spending on the economy’s goods and services. Imports are the portions of C, I, and Gthat are spent on g&s produced abroad.
Adding up all the components of GDP gives Y = C + I + G + NX
The Components of GDP
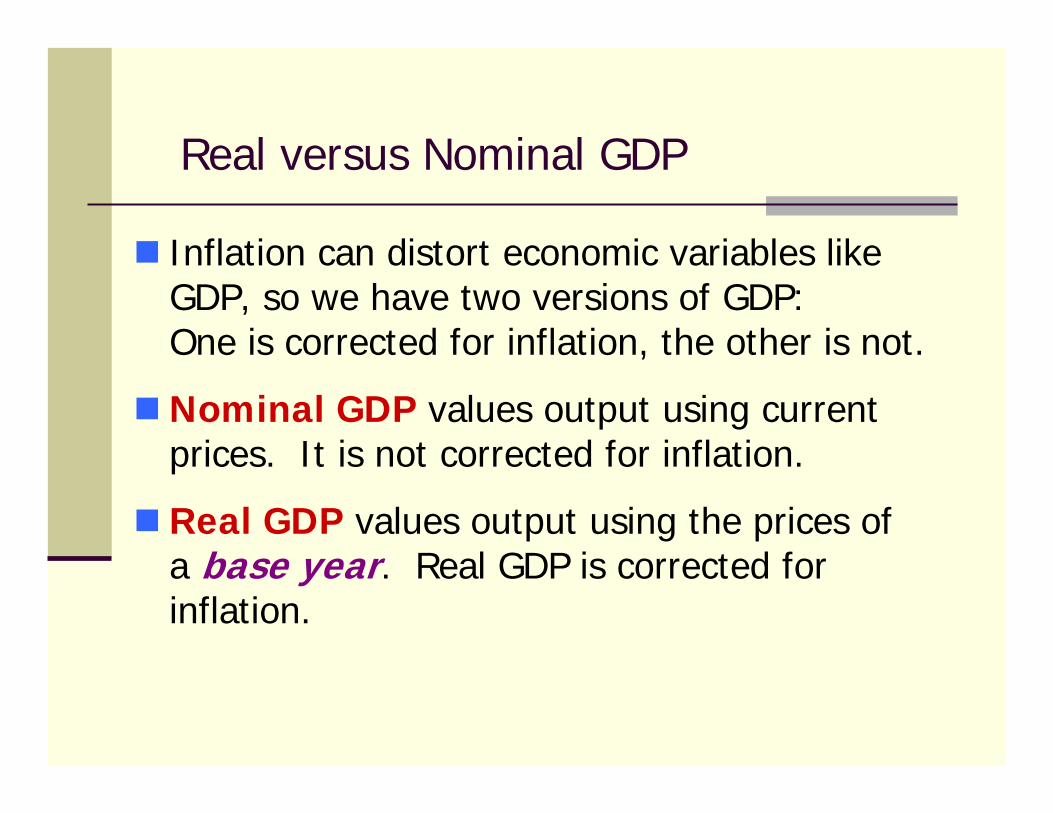
Real versus Nominal GDP
Inflation can distort economic variables like GDP, so we have two versions of GDP: One is corrected for inflation, the other is not.
Nominal GDP values output using current prices. It is not corrected for inflation.
Real GDP values output using the prices of a base year. Real GDP is corrected for inflation.
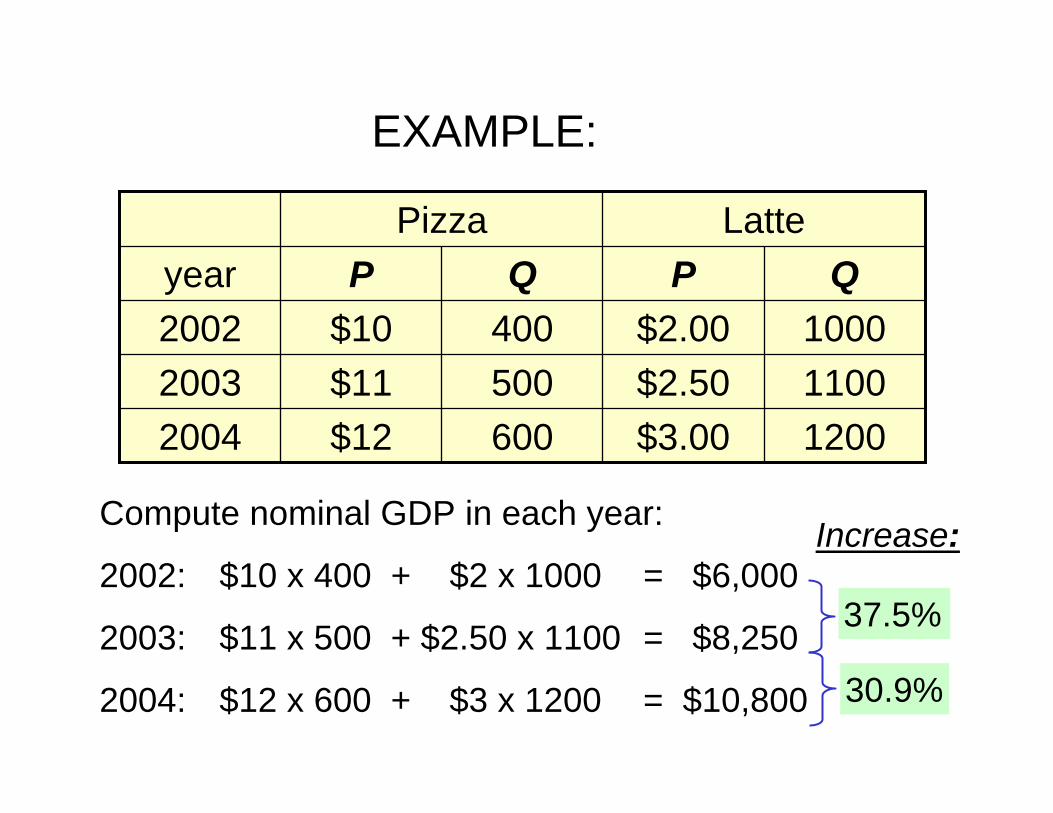
EXAMPLE:
Compute nominal GDP in each year:
2002: $10 x 400 + $2 x 1000 = $6,000
2003: $11 x 500 + $2.50 x 1100 = $8,250
2004: $12 x 600 + $3 x 1200 = $10,800
1200$3.00600$1220041100$2.50500$1120031000$2.00400$102002
QPQPyearLattePizza
37.5%
Increase:
30.9%
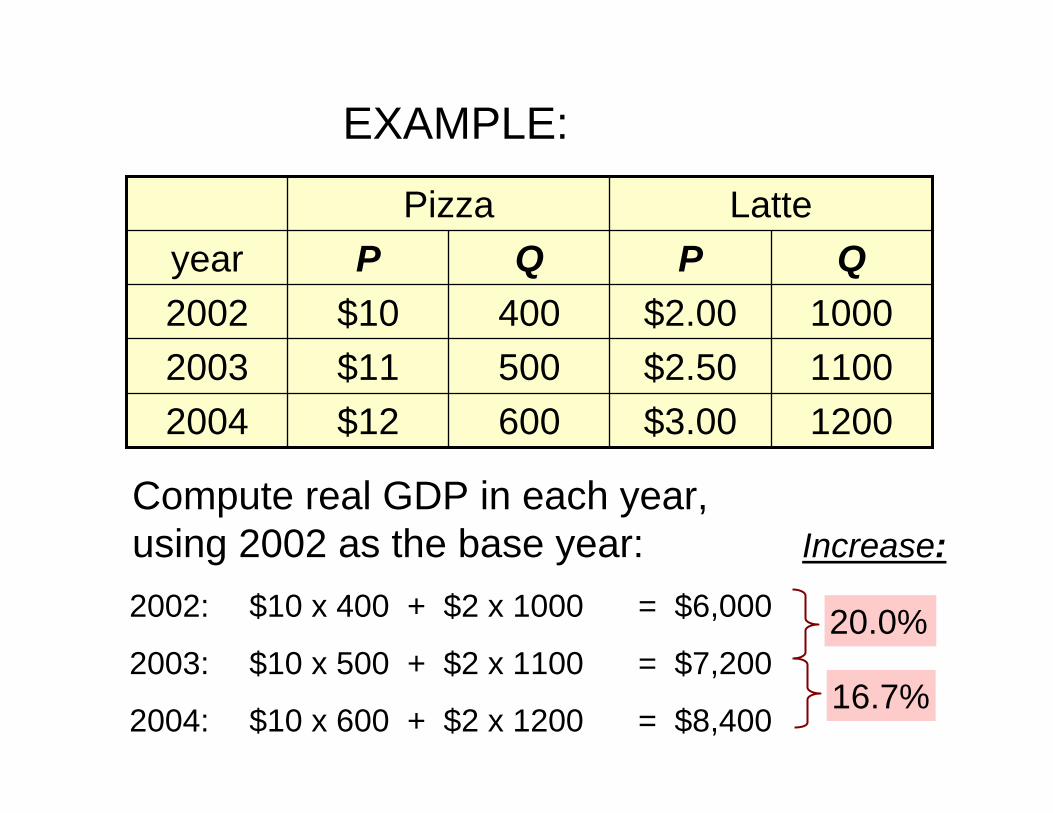
EXAMPLE:
Compute real GDP in each year, using 2002 as the base year:
1200$3.00600$1220041100$2.50500$1120031000$2.00400$102002
QPQPyearLattePizza
20.0%
Increase:
16.7%
2002: $10 x 400 + $2 x 1000 = $6,000
2003: $10 x 500 + $2 x 1100 = $7,200
2004: $10 x 600 + $2 x 1200 = $8,400
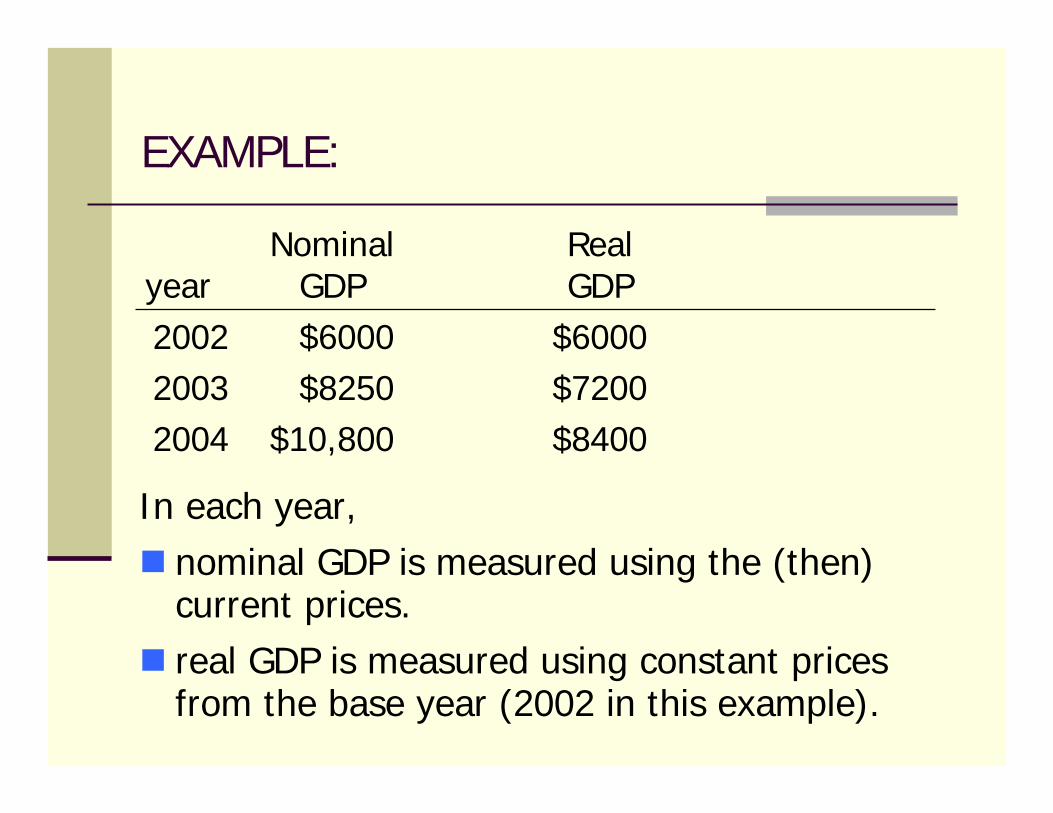
EXAMPLE:
In each year,nominal GDP is measured using the (then) current prices. real GDP is measured using constant prices from the base year (2002 in this example).
$8400$10,8002004$7200$82502003$6000$60002002
Real GDP
Nominal GDPyear
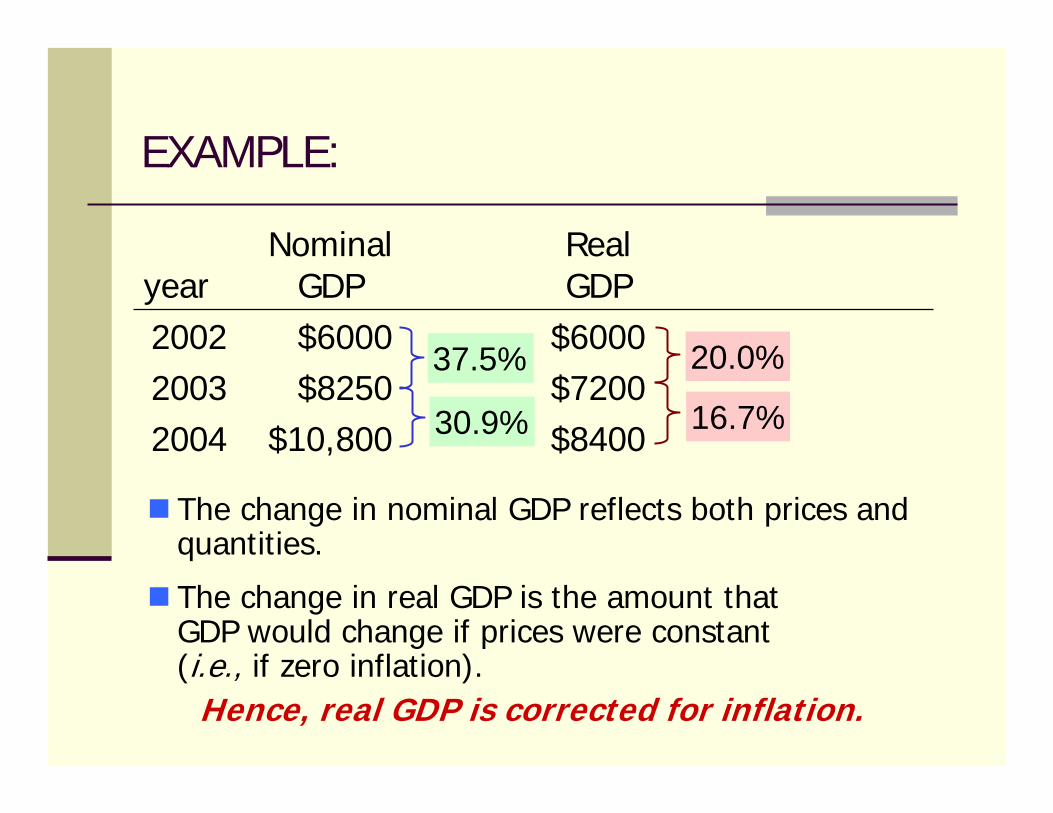
EXAMPLE:
The change in nominal GDP reflects both prices and quantities.
The change in real GDP is the amount that GDP would change if prices were constant (i.e., if zero inflation).
Hence, real GDP is corrected for inflation.
$8400$10,8002004$7200$82502003$6000$60002002
Real GDP
Nominal GDPyear
20.0%
16.7%
37.5%
30.9%
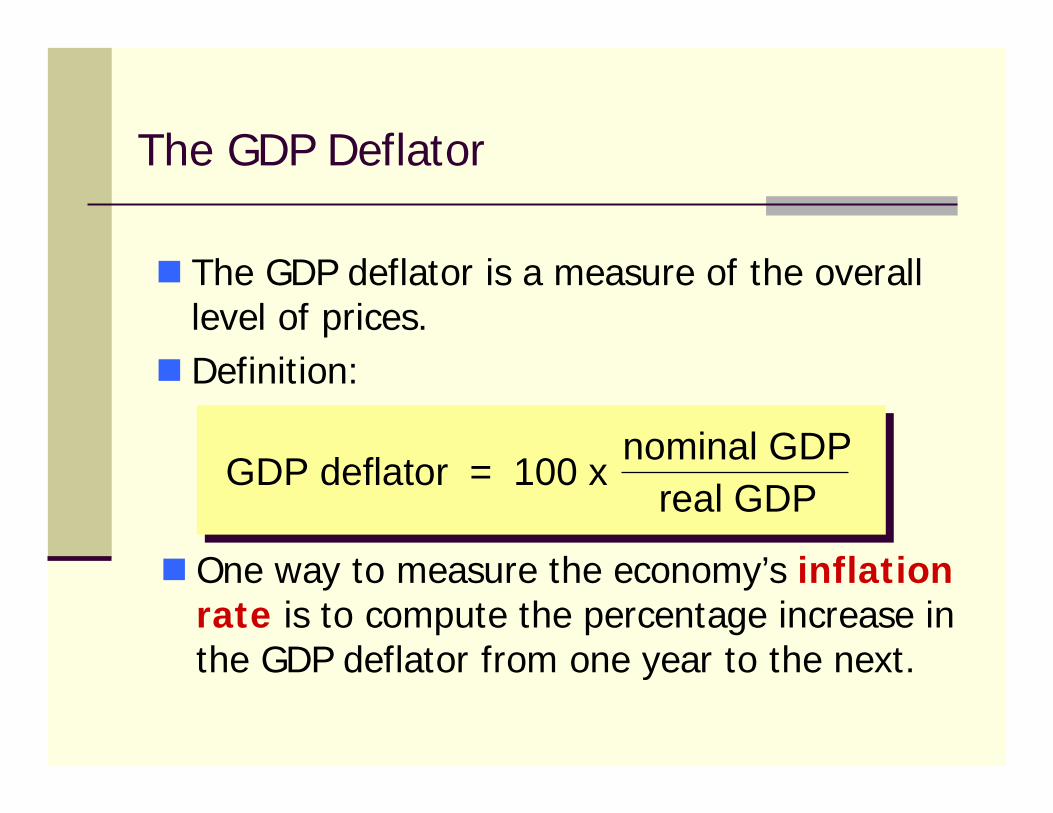
The GDP Deflator
The GDP deflator is a measure of the overall level of prices. Definition:
One way to measure the economy’s inflation rate is to compute the percentage increase in the GDP deflator from one year to the next.
GDP deflator = 100 xGDP deflator = 100 x nominal GDPreal GDP
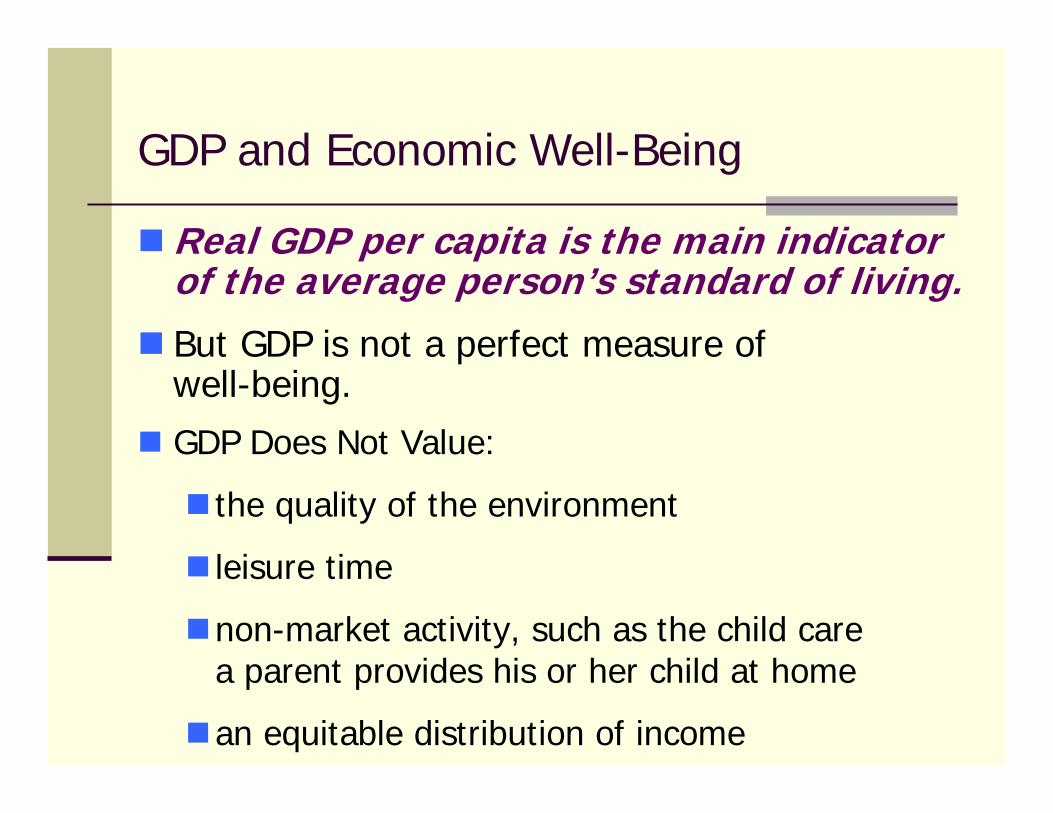
GDP and Economic Well-Being
Real GDP per capita is the main indicator of the average person’s standard of living.
But GDP is not a perfect measure of well-being.GDP Does Not Value:
the quality of the environment
leisure time
non-market activity, such as the child care a parent provides his or her child at home
an equitable distribution of income
Then Why Do We Care About GDP?
Having a large GDP enables a country to afford better schools, a cleaner environment, health care, etc.
Many indicators of the quality of life are positively correlated with GDP. For example…
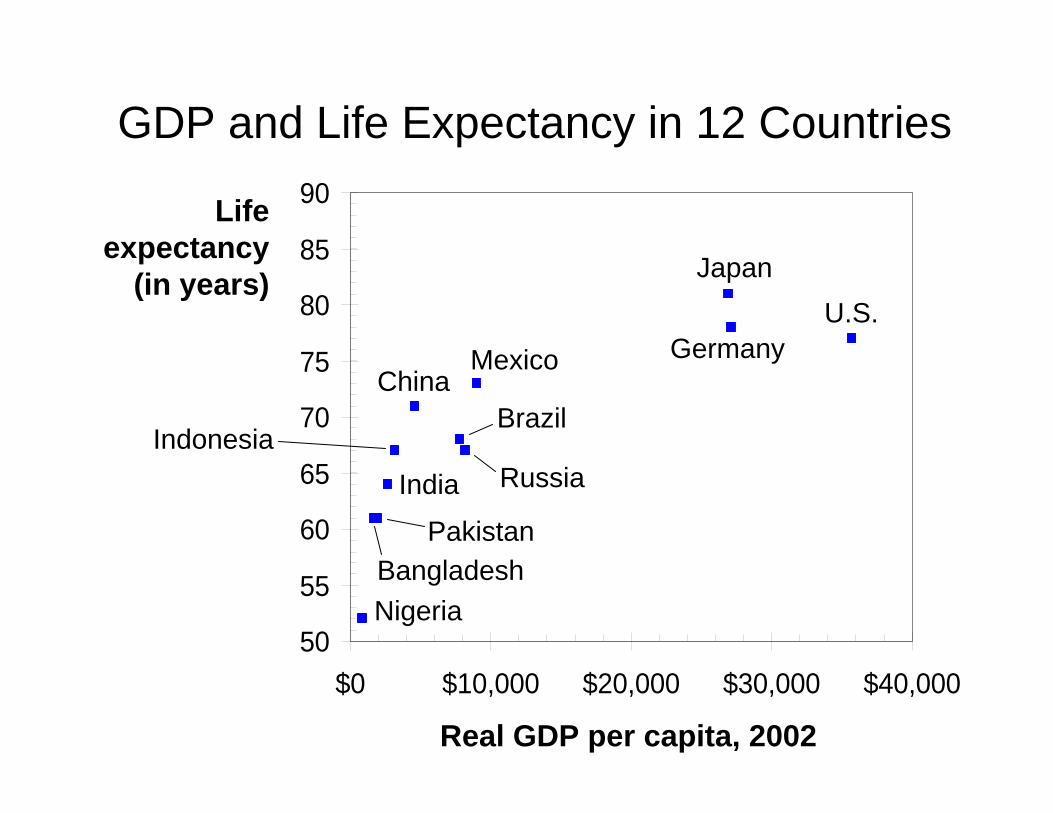
GDP and Life Expectancy in 12 Countries
50
55
60
65
70
75
80
85
90
$0 $10,000 $20,000 $30,000 $40,000
Life expectancy
(in years)
Real GDP per capita, 2002
U.S.Germany
Japan
Nigeria
Mexico
Russia
BrazilChina
PakistanBangladesh
IndiaIndonesia
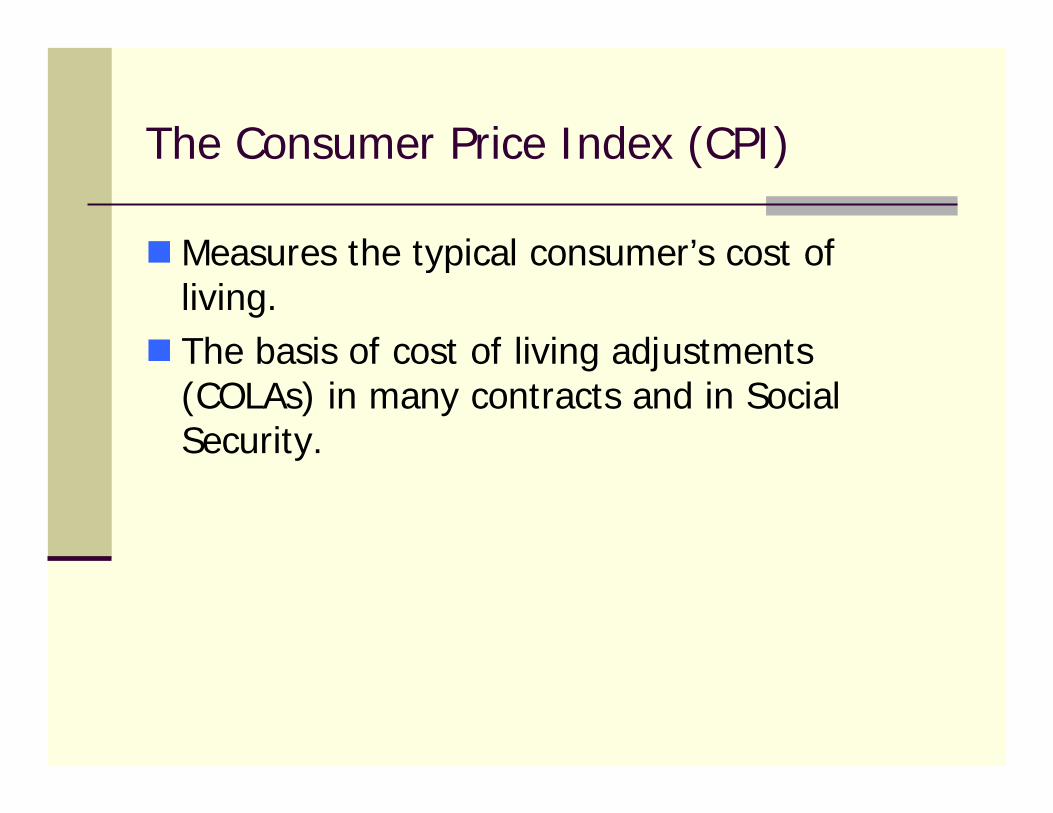
The Consumer Price Index (CPI)
Measures the typical consumer’s cost of living.The basis of cost of living adjustments (COLAs) in many contracts and in Social Security.
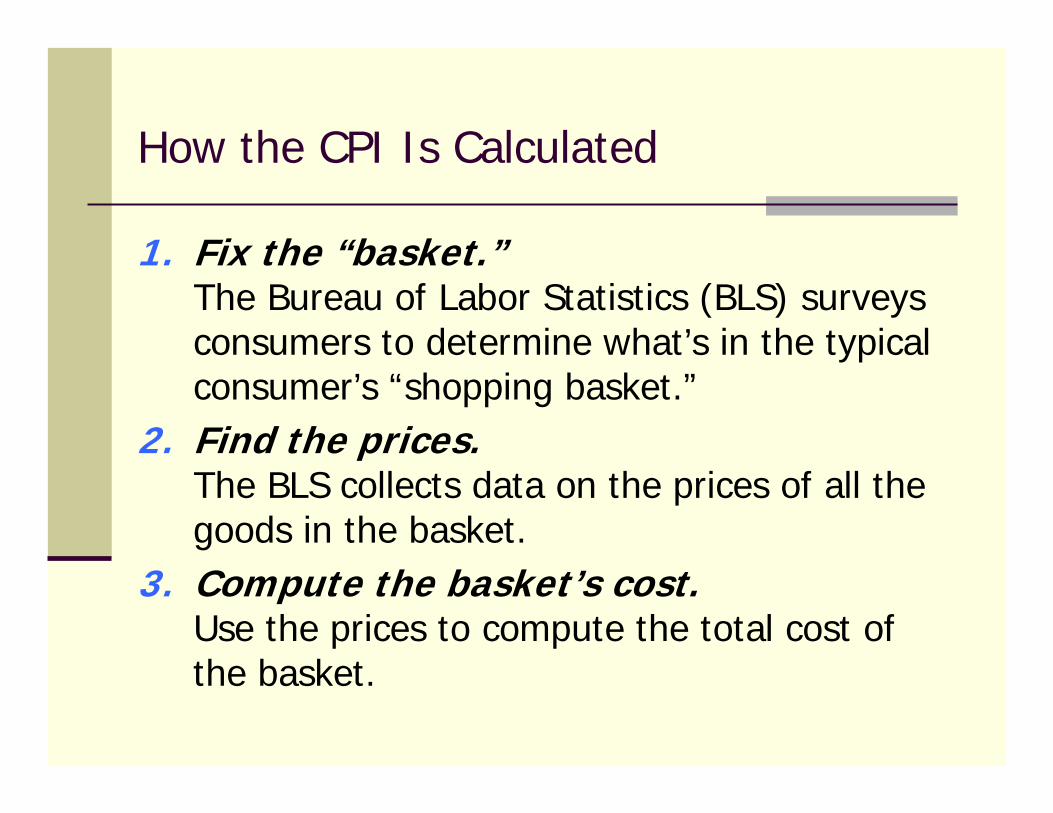
How the CPI Is Calculated
1. Fix the “basket.”The Bureau of Labor Statistics (BLS) surveys consumers to determine what’s in the typical consumer’s “shopping basket.”
2. Find the prices.The BLS collects data on the prices of all the goods in the basket.
3. Compute the basket’s cost.Use the prices to compute the total cost of the basket.
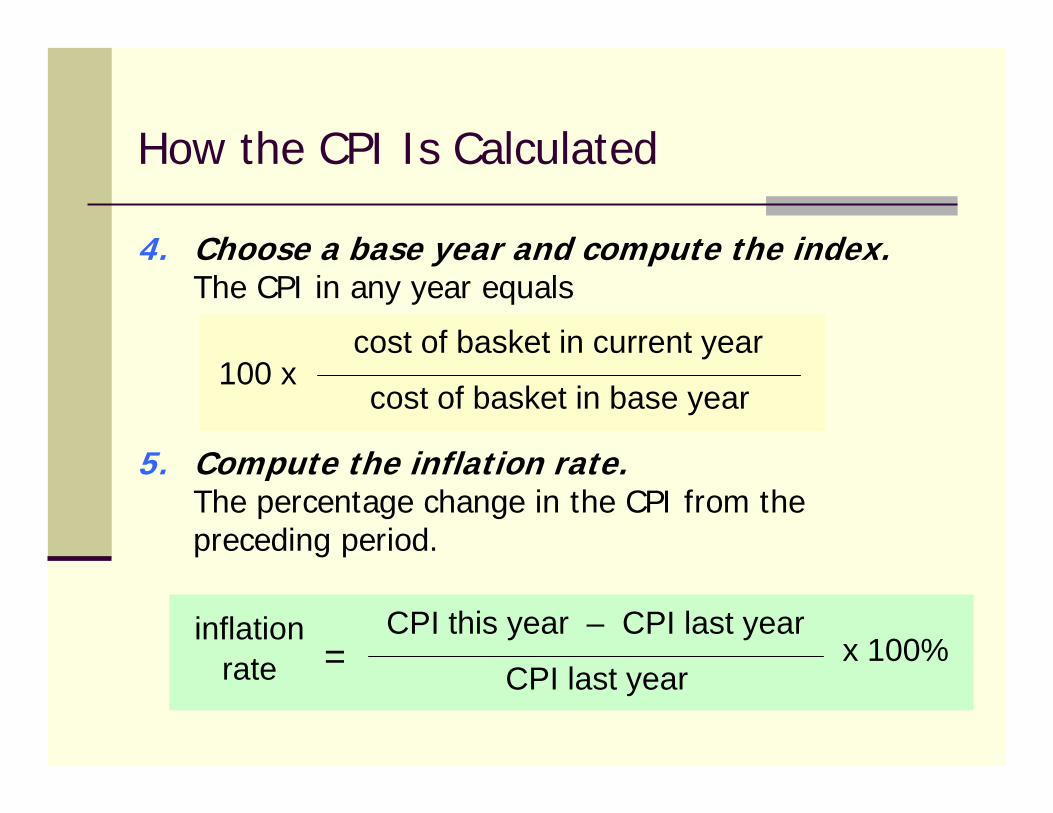
How the CPI Is Calculated
4. Choose a base year and compute the index.The CPI in any year equals
5. Compute the inflation rate.The percentage change in the CPI from the preceding period.
100 xcost of basket in current year
cost of basket in base year
CPI this year – CPI last year
CPI last yearinflation
rate x 100%=
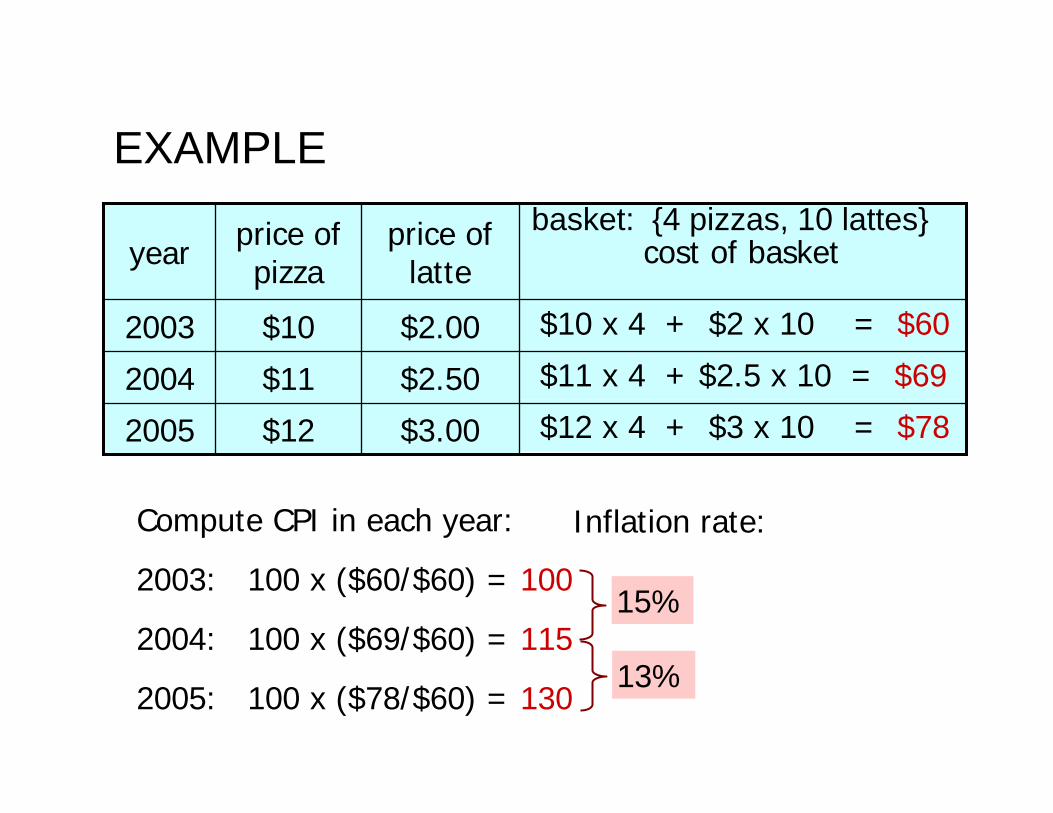
EXAMPLE
$12 x 4 + $3 x 10 = $78
$11 x 4 + $2.5 x 10 = $69
$10 x 4 + $2 x 10 = $60
cost of basket
$3.00
$2.50
$2.00
price of latte
$122005
$112004
$102003
price of pizzayear
Compute CPI in each year:
2003: 100 x ($60/$60) = 100
2004: 100 x ($69/$60) = 115
2005: 100 x ($78/$60) = 130
15%
13%
Inflation rate:
basket: {4 pizzas, 10 lattes}
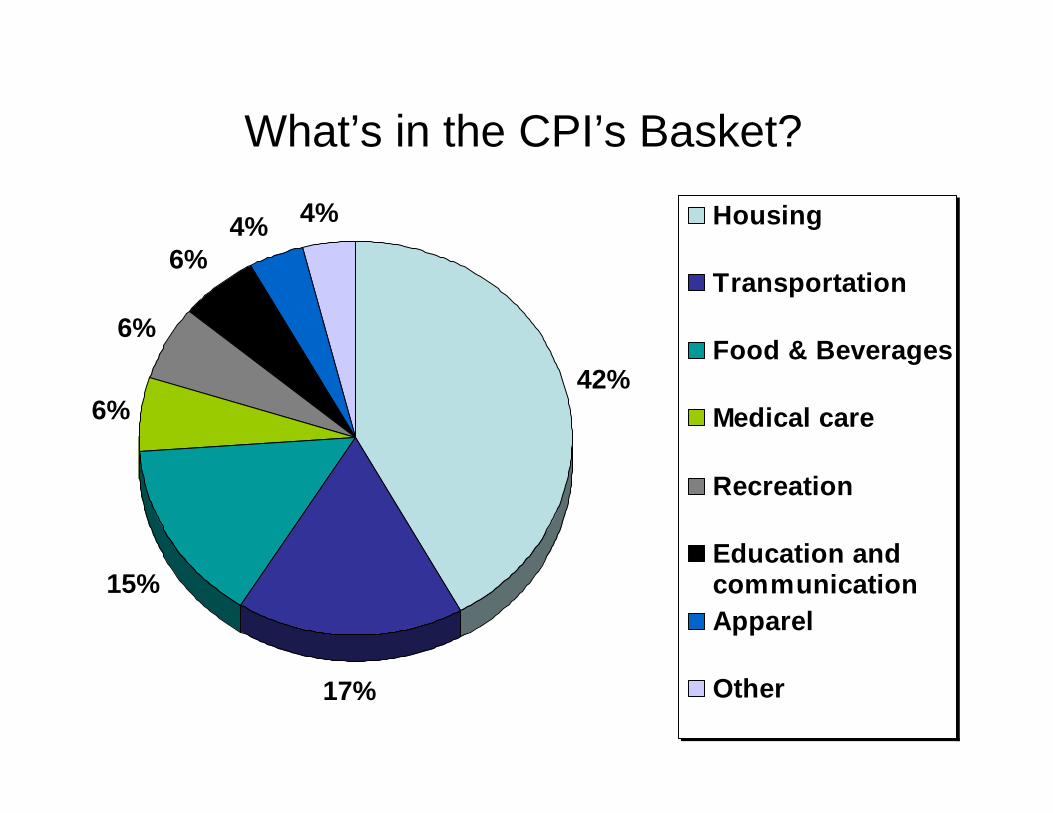
What’s in the CPI’s Basket?
42%
17%
15%
6%
6%
6%4% 4% Housing
Transportation
Food & Beverages
Medical care
Recreation
Education andcommunicationApparel
Other
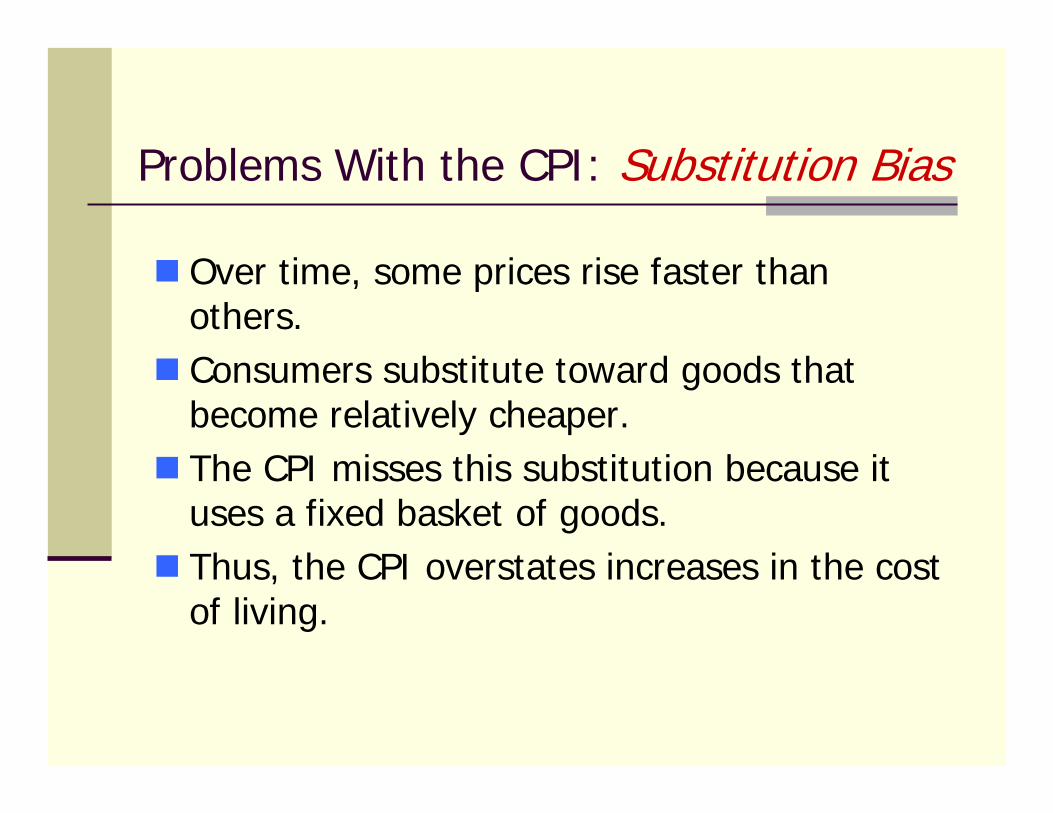
Problems With the CPI: Substitution Bias
Over time, some prices rise faster than others. Consumers substitute toward goods that become relatively cheaper. The CPI misses this substitution because it uses a fixed basket of goods. Thus, the CPI overstates increases in the cost of living.
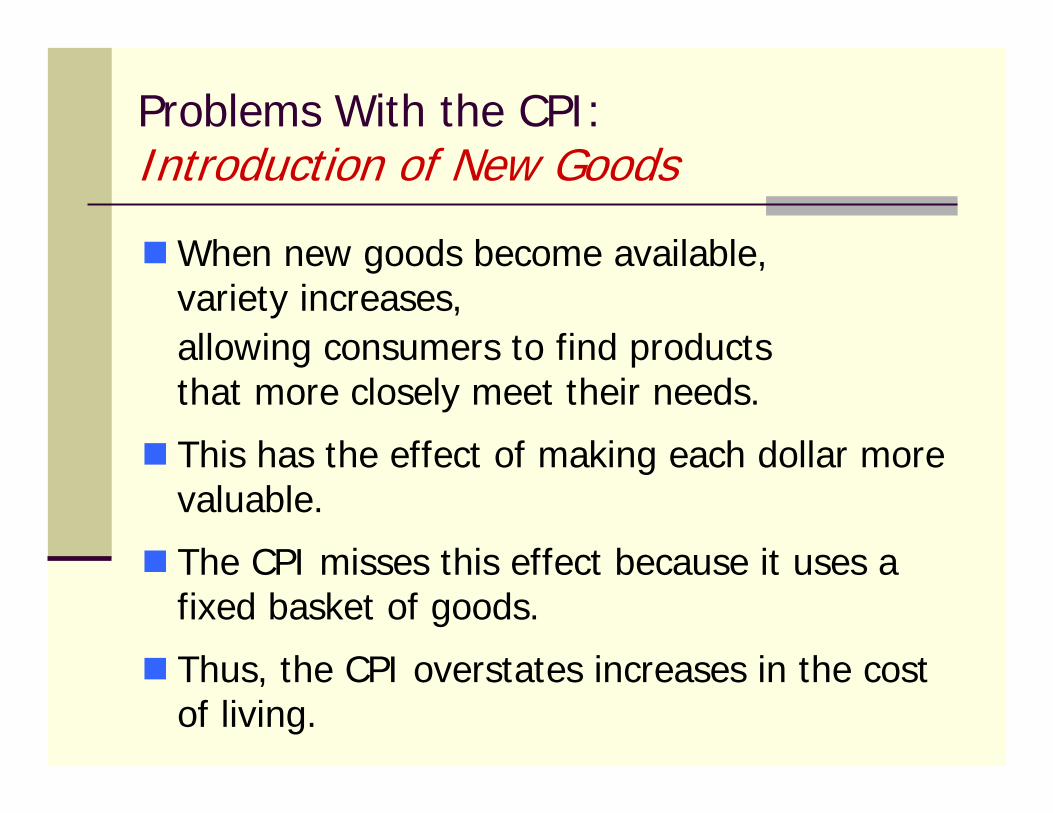
Problems With the CPI:Introduction of New Goods
When new goods become available, variety increases, allowing consumers to find products that more closely meet their needs.
This has the effect of making each dollar more valuable.
The CPI misses this effect because it uses a fixed basket of goods.
Thus, the CPI overstates increases in the cost of living.
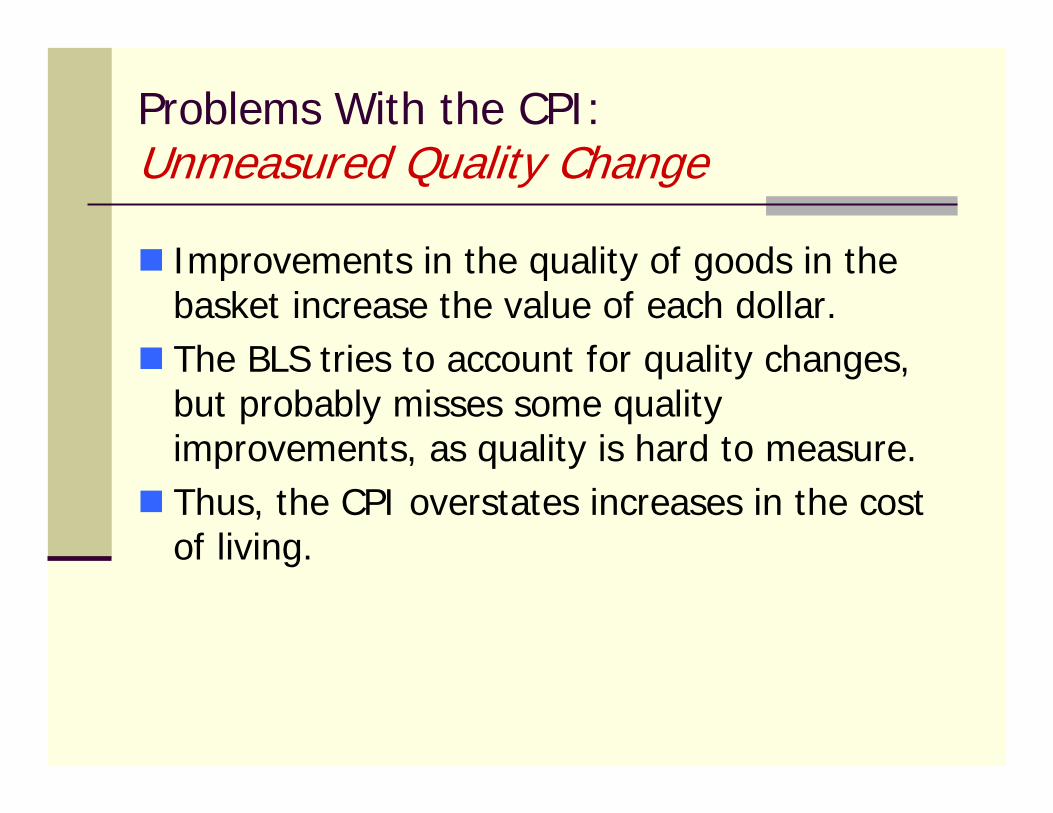
Problems With the CPI: Unmeasured Quality Change
Improvements in the quality of goods in the basket increase the value of each dollar.The BLS tries to account for quality changes, but probably misses some quality improvements, as quality is hard to measure. Thus, the CPI overstates increases in the cost of living.
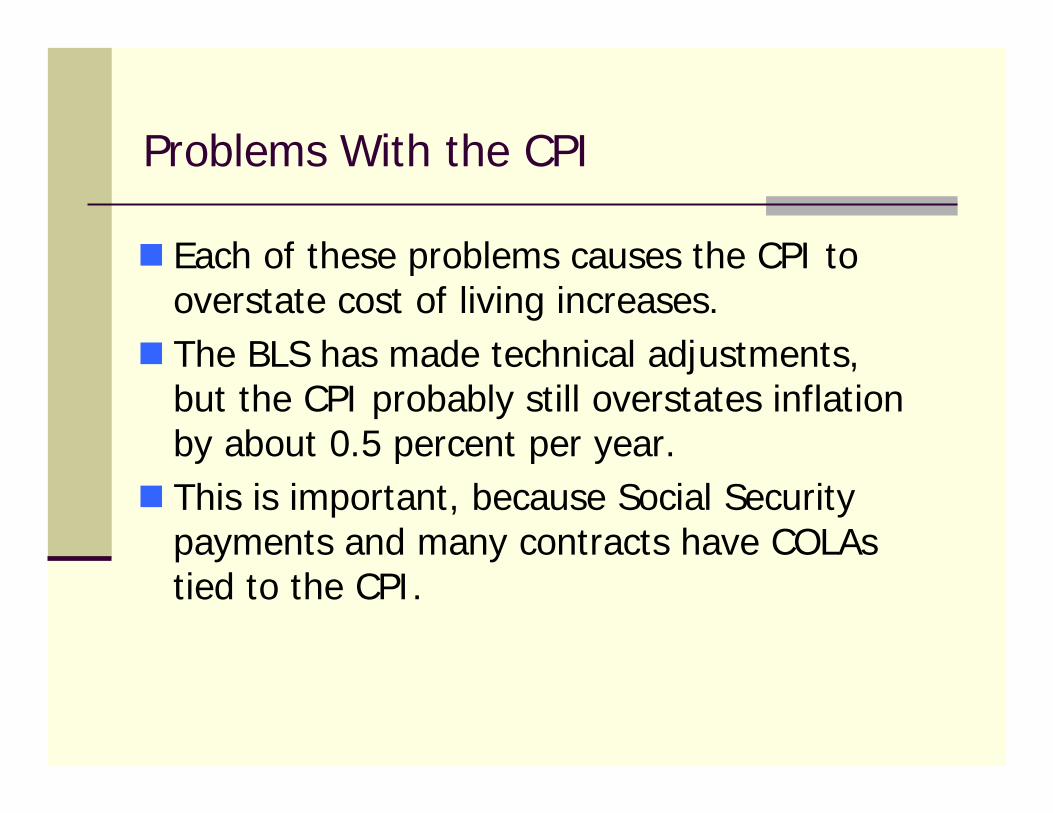
Problems With the CPI
Each of these problems causes the CPI to overstate cost of living increases. The BLS has made technical adjustments, but the CPI probably still overstates inflation by about 0.5 percent per year.This is important, because Social Security payments and many contracts have COLAs tied to the CPI.
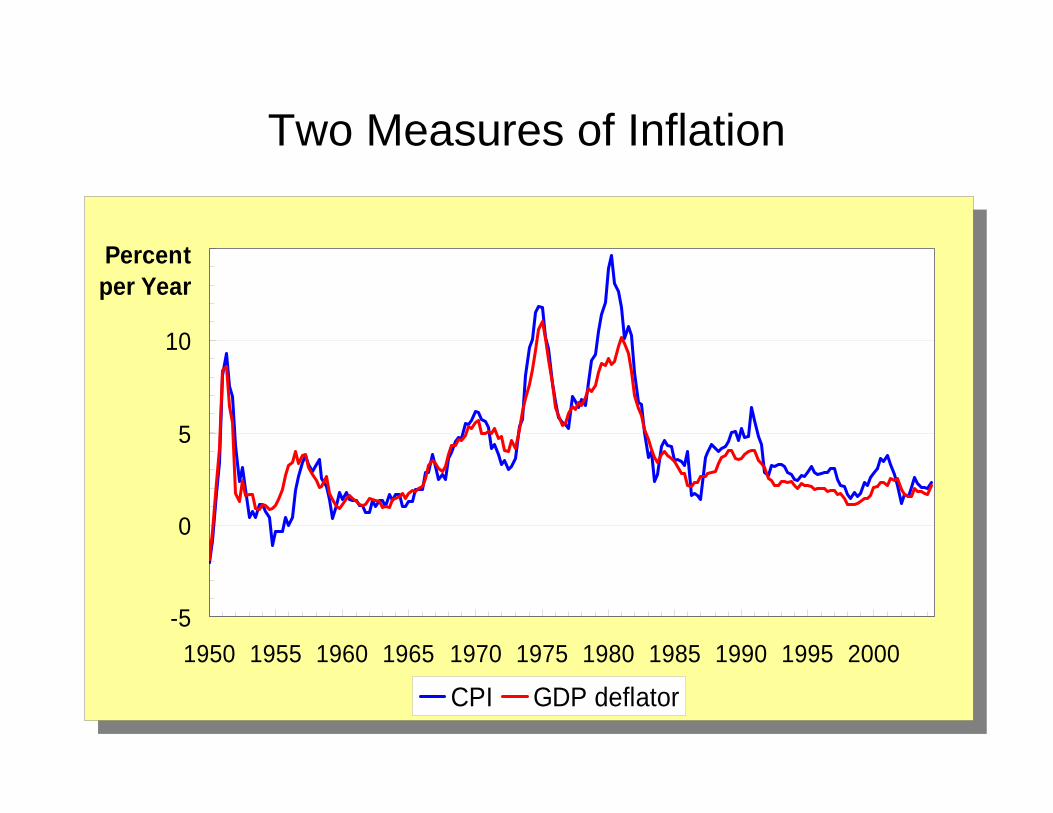
Two Measures of Inflation
-5
0
5
10
15
1950 1955 1960 1965 1970 1975 1980 1985 1990 1995 2000
Percent per Year
CPI GDP deflator
-5
0
5
10
15
1950 1955 1960 1965 1970 1975 1980 1985 1990 1995 2000
Percent per Year
CPI GDP deflator
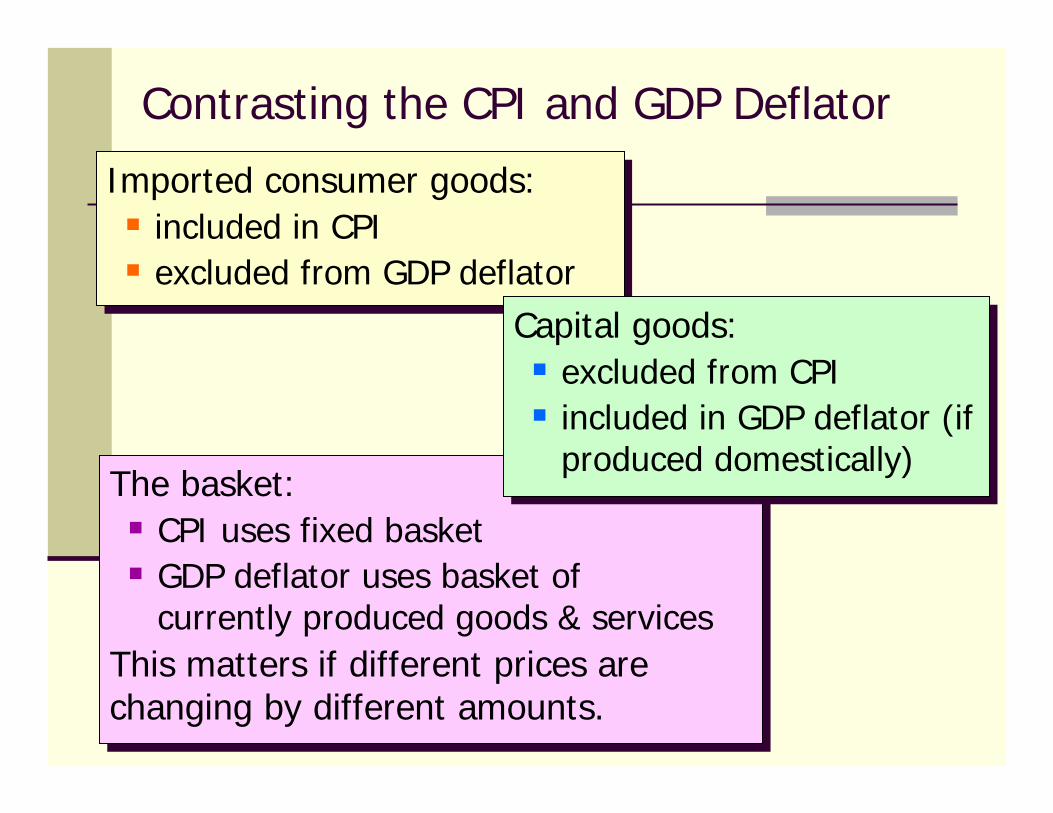
Imported consumer goods:included in CPI excluded from GDP deflator
Imported consumer goods:included in CPI excluded from GDP deflator
The basket:CPI uses fixed basketGDP deflator uses basket of currently produced goods & services
This matters if different prices are changing by different amounts.
The basket:CPI uses fixed basketGDP deflator uses basket of currently produced goods & services
This matters if different prices are changing by different amounts.
Capital goods:excluded from CPI included in GDP deflator (if produced domestically)
Capital goods:excluded from CPI included in GDP deflator (if produced domestically)
Contrasting the CPI and GDP Deflator
Correcting Variables for Inflation:
Comparing Dollar Figures from Different Times
Inflation makes it harder to compare dollar amounts from different times.We can use the CPI to adjust figures so that they can be compared.
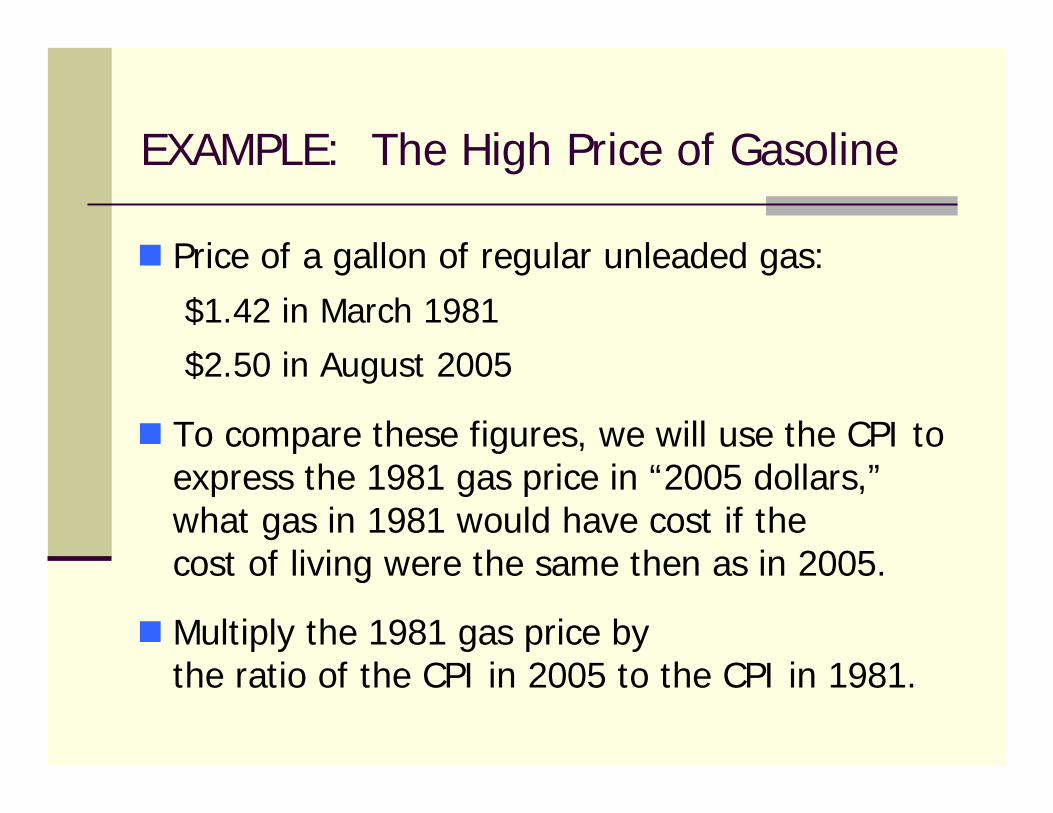
EXAMPLE: The High Price of Gasoline
Price of a gallon of regular unleaded gas:$1.42 in March 1981
$2.50 in August 2005
To compare these figures, we will use the CPI to express the 1981 gas price in “2005 dollars,”what gas in 1981 would have cost if the cost of living were the same then as in 2005.
Multiply the 1981 gas price by the ratio of the CPI in 2005 to the CPI in 1981.
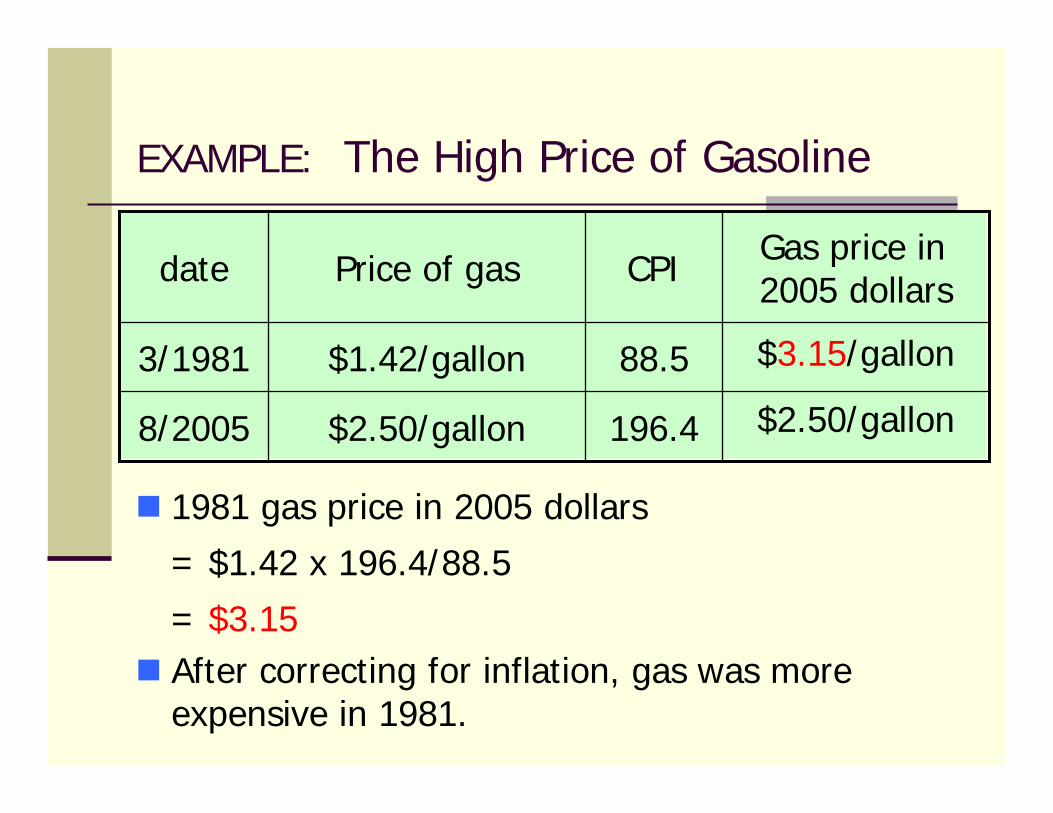
196.4$2.50/gallon8/2005
88.5$1.42/gallon3/1981
CPIPrice of gasdate
EXAMPLE: The High Price of Gasoline
1981 gas price in 2005 dollars
= $1.42 x 196.4/88.5
= $3.15After correcting for inflation, gas was more expensive in 1981.
$2.50/gallon
$3.15/gallon
Gas price in 2005 dollars
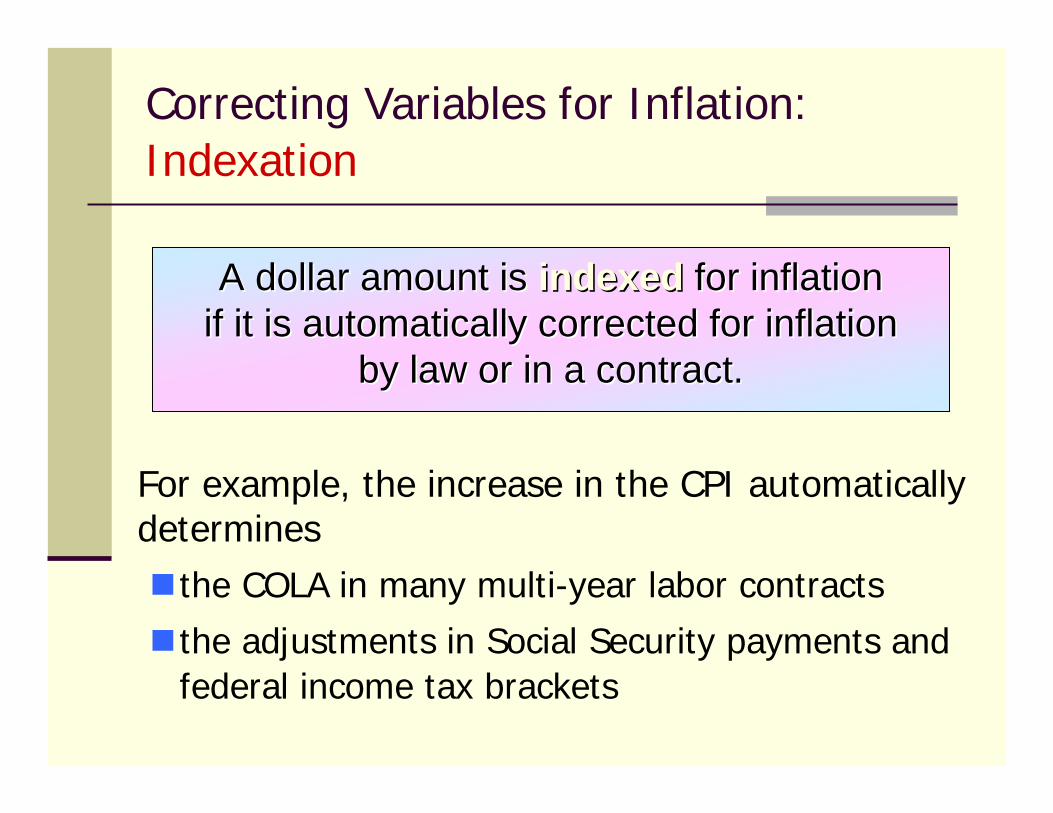
Correcting Variables for Inflation:Indexation
For example, the increase in the CPI automatically determines
the COLA in many multi-year labor contracts
the adjustments in Social Security payments and federal income tax brackets
A dollar amount is A dollar amount is indexedindexed for inflation for inflation if it is automatically corrected for inflation if it is automatically corrected for inflation
by law or in a contract.by law or in a contract.
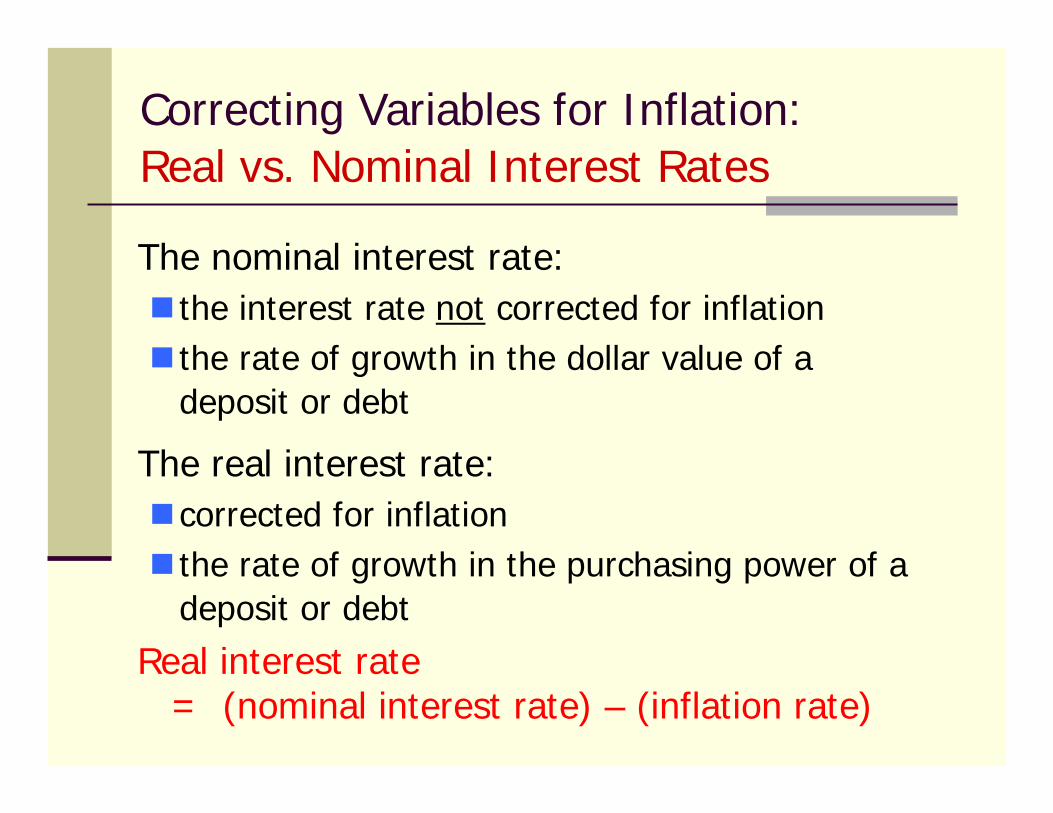
Correcting Variables for Inflation:Real vs. Nominal Interest Rates
The nominal interest rate: the interest rate not corrected for inflationthe rate of growth in the dollar value of a deposit or debt
The real interest rate:corrected for inflationthe rate of growth in the purchasing power of a deposit or debt
Real interest rate = (nominal interest rate) – (inflation rate)
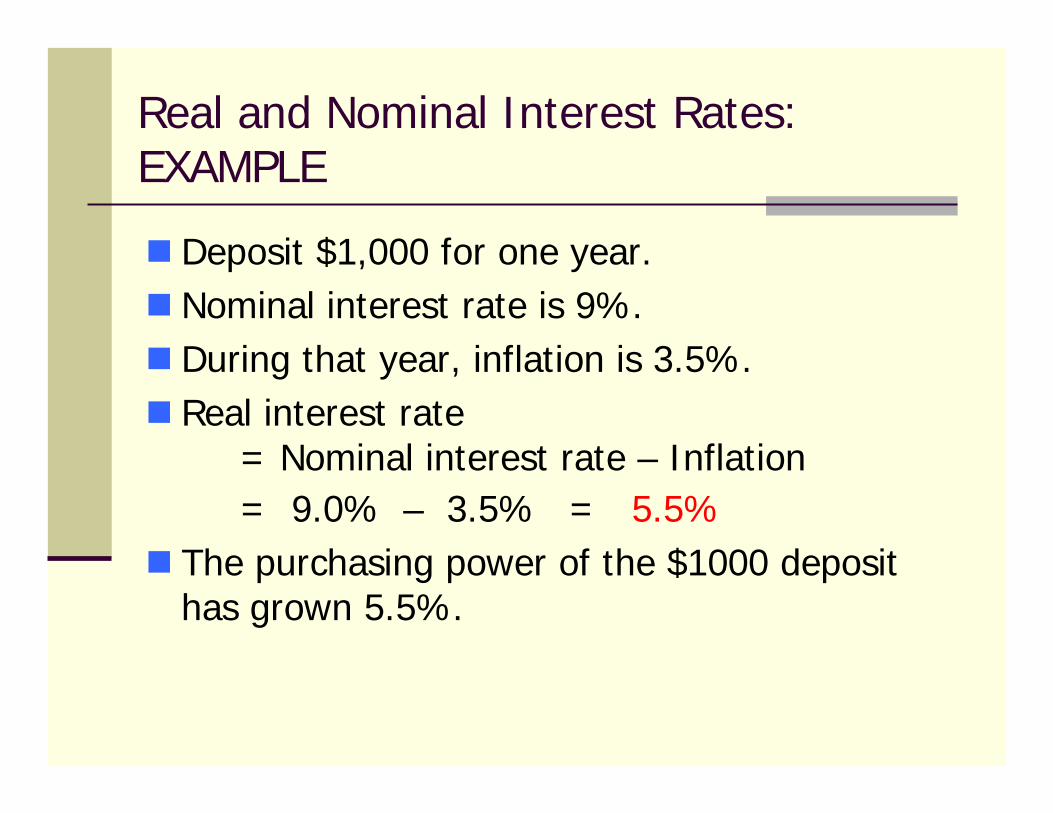
Real and Nominal Interest Rates: EXAMPLE
Deposit $1,000 for one year.Nominal interest rate is 9%. During that year, inflation is 3.5%.Real interest rate
= Nominal interest rate – Inflation= 9.0% – 3.5% = 5.5%
The purchasing power of the $1000 deposit has grown 5.5%.
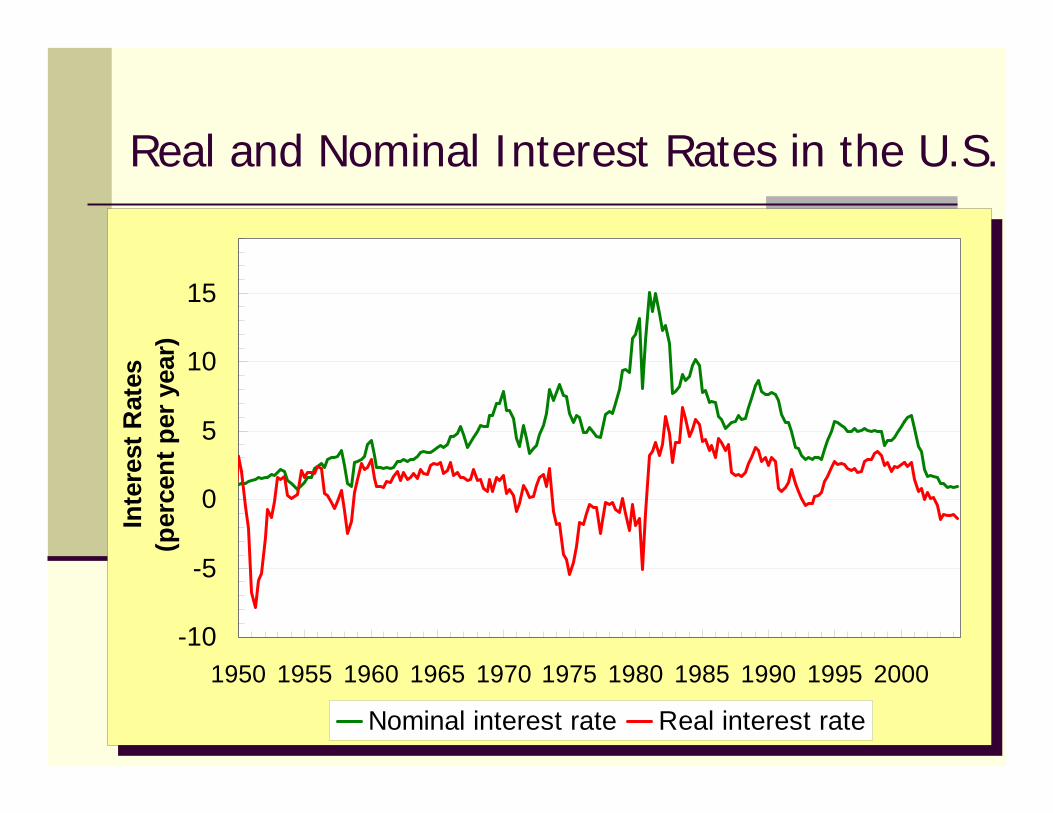
Real and Nominal Interest Rates in the U.S.
-10
-5
0
5
10
15
1950 1955 1960 1965 1970 1975 1980 1985 1990 1995 2000
Inte
rest
Rat
es
(per
cent
per
yea
r)
Nominal interest rate Real interest rate
-10
-5
0
5
10
15
1950 1955 1960 1965 1970 1975 1980 1985 1990 1995 2000
Inte
rest
Rat
es
(per
cent
per
yea
r)
Nominal interest rate Real interest rate