Lecture 5 & 6 Capital Stocks and Production Costs.
26
Lecture 5 & 6 Capital Stocks and Production Costs
-
Upload
aubrey-henderson -
Category
Documents
-
view
215 -
download
1
Transcript of Lecture 5 & 6 Capital Stocks and Production Costs.

Lecture 5 & 6
Capital Stocks and Production Costs

The nature of capital stocks
• Capital stockA quantity of any resource that is valued for its potential economic
contributions• InvestmentActions taken to increase the quantity or quality of a resource now,
in order to make benefits possible in the future• StockSomething whose quantity can be measured at a point in time• FlowSomething whose quantity can be measured only over a period of
time

Stocks vs. flows
Additionsor Inflows
Subtractionsor Outflows
Stock
Stocks vs. flows
Deposits of $2000during January
Withdrawals of $1500during January
Balance of $500on January 1
Balance of $1000on February 1

Five forms of capital
• Natural capitalPhysical assets provided by nature• Manufactured capitalAll physical assets that have been made by people• Financial capitalFunds of purchasing power available to facilitate economic activity• Human capitalPeople’s capacity for labor and their individual knowledge and skills• Social capitalThe stock of trust, mutual understanding, shared values, and socially
held knowledge that facilitates the social coordination of economic activity

Production process: A few definitons
• Inputs: resources that go into production• Outputs: the results of production• Waste products: outputs that are not used either for
consumption or in a further production process• Production: transformation of resources or commodities
into things that will ultimately be useful for consumers• Final goods: goods that are ready for use by people• Intermediate goods: goods that will undergo further
processing before they are ready for use

Production costs• Accounting cost: the costs of a project, figured in terms
of monetary flows• Economic costs: the costs of a project, including
opportunity costs
Gail’s Costs of Farming Accounting Costs Seeds $20,000 Fertilizer 3,000 Fuel and transportation 5,000 Interest on bank loan 15,000 Depreciation of equipment 5,000 Total Accounting Costs $48,000
Opportunity Costs Forgone return on equity capital $12,000
Forgone salary 30,000 Total Additional Costs $42,000 Total Economic Costs $90,000
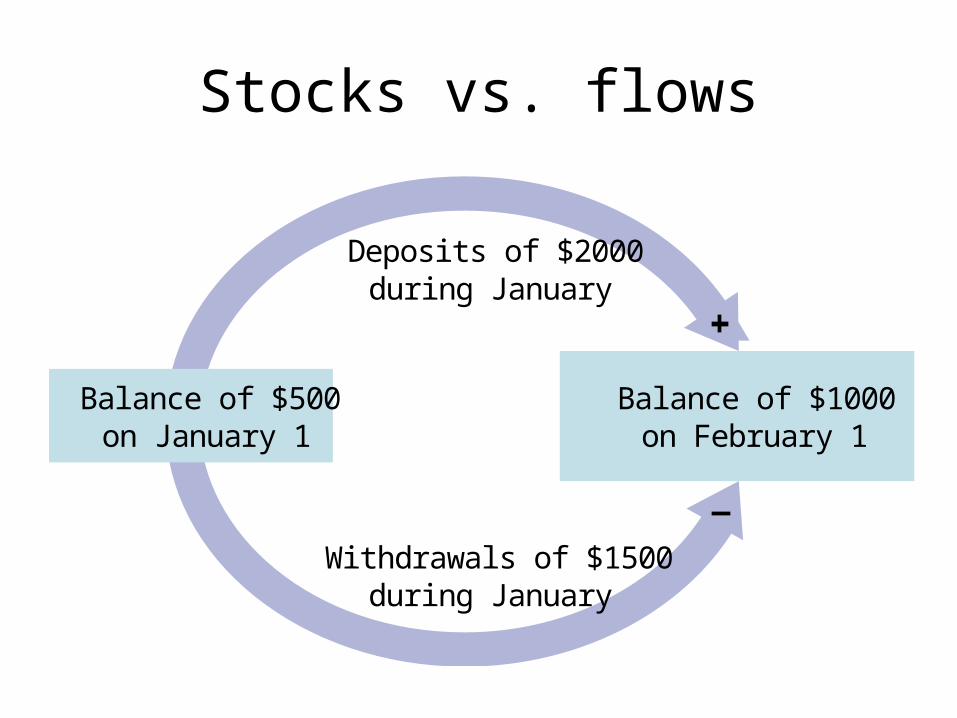
Production costs• Transaction costsCosts of arranging economic activities
• Technically efficientThe quality of a production process if no other process exists that can
produce the same output with smaller quantities of some input(s)
• Economic efficiencyAn efficient process involves no unnecessary waste or expense
• Social costs of productionThe costs of a project, both those born by the economic actors involved and
those borne by the others, figured in terms of opportunity costs

Production function

Production function
• Fixed inputAn input to the production that is fixed in quantity, no matter what
the level of production• Variable inputAn input to production the quantity of which can be quickly
changed, resulting in changes in the level of production• Short-run (for production processes)
A time period in which at least one input to the production cannot be varied in quantity
• Long-run (for production processes)
A time period in which all inputs to production can be varied in quantity
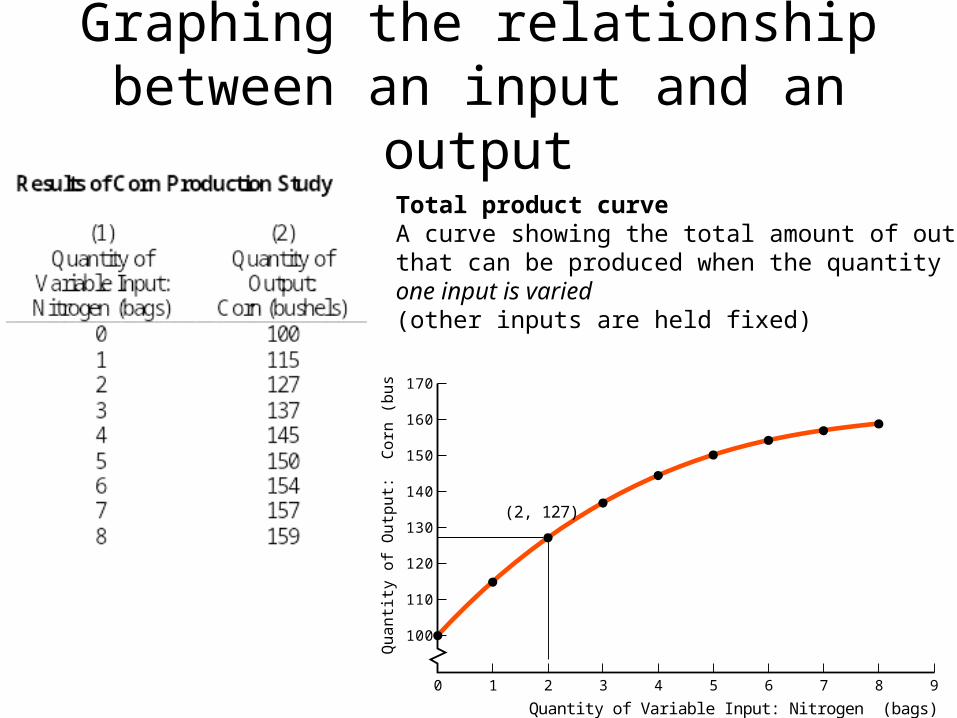
Graphing the relationship between an input and an output
0 1 2 63 875 9
110
170
160
100
140
150
120
130
4
Quantity of Variable Input: Nitrogen (bags)
Qua
ntity
of
Out
put:
C
orn
(bus
hels
)
(2, 127)
Total product curveA curve showing the total amount of output that can be produced when the quantity of one input is varied (other inputs are held fixed)

Production in the short-run
Marginal return:The additional quantity of output gained by using an additional unit of a variable input (with all other inputs held fixed)
Diminishing marginal returns:The use of an additional unit of a variable input produces a lesser additional quantity of output than did the previous unit of the input
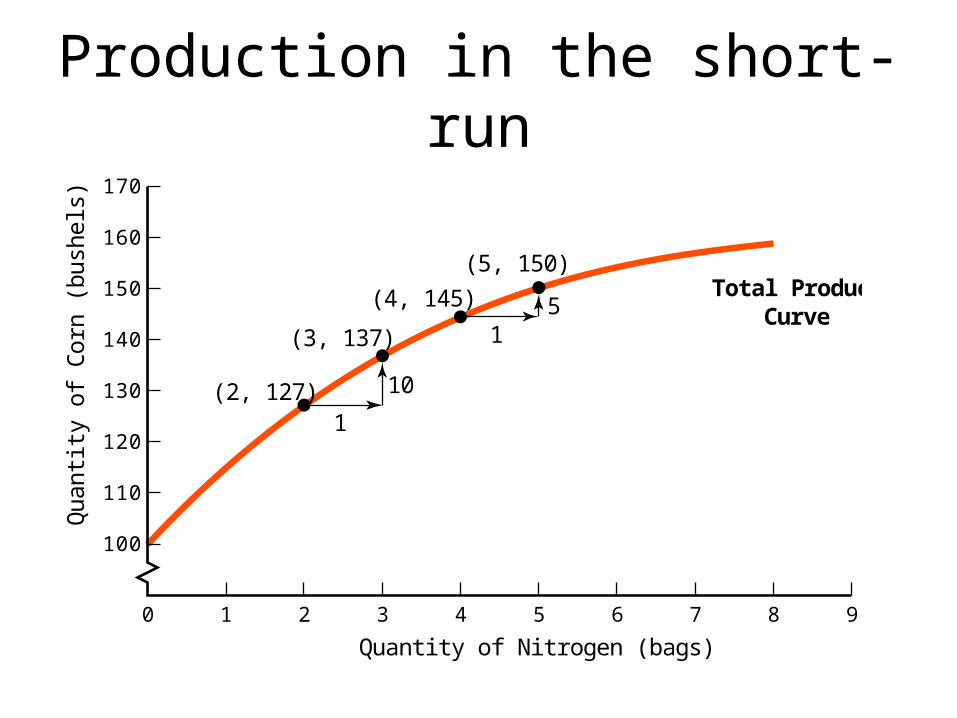
Production in the short-run
0 1 2 63 875 9
110
170
160
100
140
150
120
130
4
Quantity of Nitrogen (bags)
Qu
an
tity
of
Co
rn (
bu
she
ls)
(2, 127)
(3, 137)
(4, 145)
(5, 150)
10
1
51
Total Product Curve

Production in the short-run
Quantity of the Variable Input
Qu
an
tity
of
Ou
tpu
t
(a)
Total Product Curve
Quantity of the Variable Input
Qu
an
tity
of
Ou
tpu
t
(c)
Total Product Curve
Quantity of the Variable Input
Qu
an
tity
of
Ou
tpu
t
(b)
Total Product Curve
Diminishing marginal returns:The use of an additional unit of a variable input produces a lesser additional quantity of output than did the previous unit of the input
Constant marginal returns:The use of an additional unit of a variable input produces the same quantity of additional output as the previous unit of the input
Increasing marginal returns:The use of an additional unit of a variable input produces a greater quantity of additional output than did the previous unit of the input

Production in the short-run
Range ofincreasingreturns
Range ofconstantreturns
Range ofdiminishingreturns
TotalProductCurve
Quantity of the Variable Input
Qu
an
tity
of
Ou
tpu
t

Costs in the short-run
Fixed cost: the cost associated with using fixed inputs, which is the same no matter what quantity of output is produced
Variable cost: the cost associated with using variable inputs, which rises with the quantity of output
Total cost: The sum of fixed cost and variable cost
Marginal cost: The cost associated with producing the last unit of output

Costs in the short-run
63
100 140120 160
510
560
500
540
550
520
530
Quantity of Corn (bushels)
Tota
l Co
st (
$)
Total Cost Curve
(157, 542)
(154, 536)
Total cost curve: a curve showing the total cost associated with producing various levels of output

Costs in the short-runMarginal Cost of Corn Production
(1) Quantity
of Nitrogen
(bags)
(2) Quantity of Corn
(bushels)
(3) Marginal Return to
Additional Nitrogen
(bushels of corn)
(7) Cost of
Additional Nitrogen
($ per bag)
(8) Marginal Cost in
Dollars per Bushel of Corn
($/bushel) = Column(7) ÷ Column(3)
0 100 -- -- -- 1 115 15 6 0.4 2 127 12 6 0.5 3 137 10 6 0.6 4 145 8 6 0.75 5 150 5 6 1.2 6 154 4 6 1.5 7 157 3 6 = 6 3 = 2 8 159 2 6 3

Range ofdecreasingmarginalcost
Range ofconstantmarginalcost
Range ofincreasingmarginalcost
TotalCostCurve
Tota
l Co
st (
$)
MarginalCostCurve
Quantity of Output
Quantity of Output
Ma
rgin
al C
ost
($
)
Constant marginal cost:The cost of producing an additional unit of output stays the same as more output is produced
Decreasing marginal cost:The cost of producing an additional unit of output falls as more output is produced
Increasing marginal cost:The cost of producing an additional unit of output rises as more output is produced

Production and costs in the long-run
• Average cost (or average total cost)
Cost per unit of output, computed as the total cost divided by the quantity of output produced
• Long-run average costThe cost of production, per unit of output when all inputs
can be varied in quantity

Production and costs in the long-run
Quantity of Output
Minimum efficientscale
Maximum efficientscale
Economiesof scale
Diseconomiesof scale
Constant returnsto scale
Lo
ng
-Ru
n A
vera
ge
Co
st (
$)
Long-Run AverageCost Curve

A formal model of producer costs
• Assumptions:– The only producer is the firm– The firm produces only one good, hair dryers– The firm has already decided on a scale of production and
made its choice of Technologies (so, we focus only on its costs in the short-run)
– There are no nonmonetary opportunity costs or externalities
– We have perfect information about the cost structure of the firm
– The firm’s production technology is characterized by diminishing returns to its variable inputs

A formal model of producer costs
Costs of Hair Dryer Production Quantity of Hair Dryers
Fixed Cost ($)
Marginal Cost ($)
Total Cost ($)
Average Total Cost
($)
Variable Cost ($)
Average Variable Cost ($)
0 20 -- 20 0 0.00
1 20 12 32 32.00 12 12.00
2 20 8 40 20.00 20 10.00
3 20 8 48 16.00 28 9.33
4 20 9 57 14.25 37 9.25
5 20 10 67 13.40 47 9.40
6 20 14 81 13.50 61 10.17
7 20 20 101 14.43 81 11.57
8 20 35 136 17.00 116 14.50 9 20 55 191 21.22 171 19.00
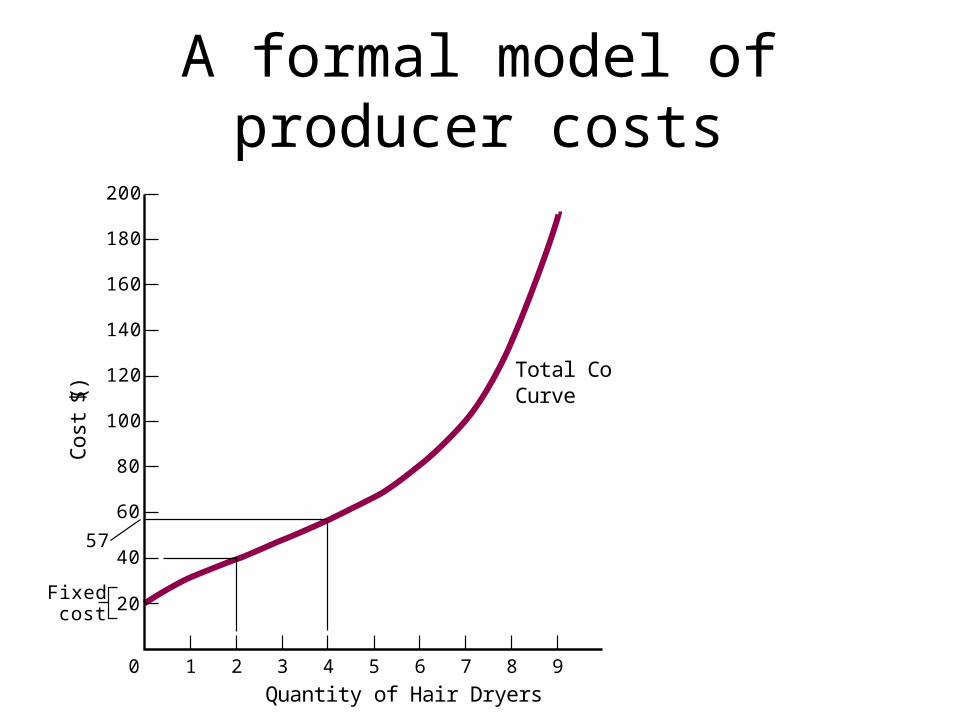
A formal model of producer costs
Total CostCurve
Fixedcost 20
40
60
57
80
100
120
140
160
180
200
9876543210
Quantity of Hair Dryers
Co
st (
$)
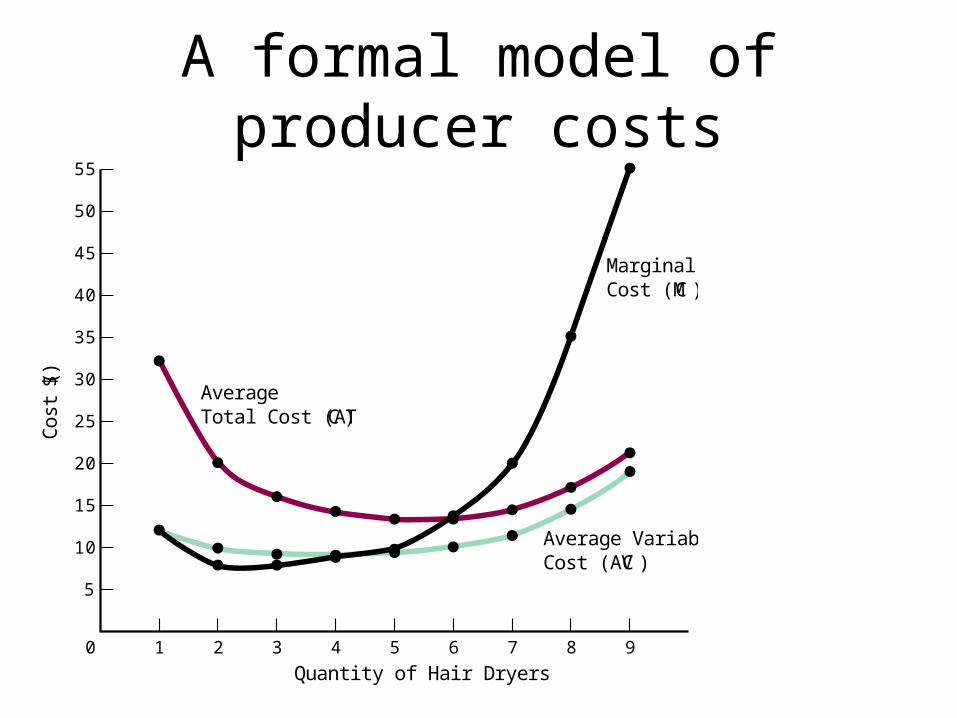
A formal model of producer costs
MarginalCost (MC)
AverageTotal Cost (AT C)
Average VariableCost (AVC)
9876543210
5
10
15
20
25
30
35
40
45
50
55
Quantity of Hair Dryers
Co
st (
$)

A formal model of producer costs
MarginalCost (MC)
AverageTotal Cost (AT C)
Average VariableCost (AVC)
Total Cost
9876543210
5
10
15
20
25
30
35
40
45
50
55
Quantity of Hair Dryers
Co
st (
$)