Lecture 4. Variability and trends of aerosol, clouds, and...
10
Lecture 4. Variability and trends of aerosol, clouds, and precipitation. Required reading: Chapters 3 and 4 in Aerosol Pollution Impact on Precipitation: A Scientific Review. WMO/IUGG INTERNATIONAL AEROSOL PRECIPITATION SCIENCE ASSESSMENT GROUP (IAPSAG) REPORT. Additional reading: Trends in aerosols: de Meij, A., Pozzer, A., and Lelieveld, J.: Global and regional trends in aerosol optical depth based on remote sensing products and pollutant emission estimates between 2000 and 2009, Atmos. Chem. Phys. Discuss., 10, 30731-30776, doi:10.5194/acpd-10-30731-2010, 2010. Zhang, J. and Reid, J. S.: A decadal regional and global trend analysis of the aerosol optical depth using a data-assimilation grade over-water MODIS and Level 2 MISR aerosol products, Atmos. Chem. Phys., 10, 10949–10963, doi:10.5194/acp-10-10949-2010, 2010. Thomas, G. E., Poulsen, C. A., Siddans, R., Sayer, A. M., Carboni, E., Marsh, S. H., Dean, S. M., Grainger, R. G., and Lawrence, B. N.: Validation of the GRAPE single view aerosol retrieval for ATSR-2 and insights into the long term global AOD trend over the ocean, Atmos. Chem. Phys., 10, 4849-4866, doi:10.5194/acp-10-4849-2010, 2010. Mishchenko, M. I., Geogdzhayev, I. V., Rossow, W. B., Cairns, B., Carlson, B. E., Lacis, A. A., Liu, L., and Travis, L. D.: Long-term satellite record reveals likely recent aerosol trend, Science, 315, 1543, 2007. Trends in clouds: The International Satellite Cloud Climatology Project (ISCCP) http://isccp.giss.nasa.gov/ Trends in precipitation: Assessment of Global Precipitation Products. A project of the World Climate Research Programme, Global Energy and Water Cycle Experiment (GEWEX) Radiation Panel http://www.gewex.org/reports/2008AssessmentGlobalPrecipReport.pdf Dai, A., I. Y. Fung, and A. D. Del Genio, 1997: Surface observed global land precipitation variations during 1900-1988. J. Climate, 10, 2943-2962. 1
Transcript of Lecture 4. Variability and trends of aerosol, clouds, and...
Lecture 4.
Variability and trends of aerosol, clouds, and precipitation.
Required reading:
Chapters 3 and 4 in Aerosol Pollution Impact on Precipitation: A Scientific Review.
WMO/IUGG INTERNATIONAL AEROSOL PRECIPITATION SCIENCE
ASSESSMENT GROUP (IAPSAG) REPORT.
Additional reading:
Trends in aerosols: de Meij, A., Pozzer, A., and Lelieveld, J.: Global and regional trends in aerosol optical depth based on remote sensing products and pollutant emission estimates between 2000 and 2009, Atmos. Chem. Phys. Discuss., 10, 30731-30776, doi:10.5194/acpd-10-30731-2010, 2010. Zhang, J. and Reid, J. S.: A decadal regional and global trend analysis of the aerosol optical depth using a data-assimilation grade over-water MODIS and Level 2 MISR aerosol products, Atmos. Chem. Phys., 10, 10949–10963, doi:10.5194/acp-10-10949-2010, 2010. Thomas, G. E., Poulsen, C. A., Siddans, R., Sayer, A. M., Carboni, E., Marsh, S. H., Dean, S. M., Grainger, R. G., and Lawrence, B. N.: Validation of the GRAPE single view aerosol retrieval for ATSR-2 and insights into the long term global AOD trend over the ocean, Atmos. Chem. Phys., 10, 4849-4866, doi:10.5194/acp-10-4849-2010, 2010. Mishchenko, M. I., Geogdzhayev, I. V., Rossow, W. B., Cairns, B., Carlson, B. E., Lacis, A. A., Liu, L., and Travis, L. D.: Long-term satellite record reveals likely recent aerosol trend, Science, 315, 1543, 2007.
Trends in clouds:
The International Satellite Cloud Climatology Project (ISCCP) http://isccp.giss.nasa.gov/
Trends in precipitation:
Assessment of Global Precipitation Products. A project of the World Climate Research Programme, Global Energy and Water Cycle Experiment (GEWEX) Radiation Panel http://www.gewex.org/reports/2008AssessmentGlobalPrecipReport.pdf
Dai, A., I. Y. Fung, and A. D. Del Genio, 1997: Surface observed global land precipitation variations during 1900-1988. J. Climate, 10, 2943-2962.
1

Aerosols.
Mean distribution:
Figure 4.1 Aerosol optical depth (AOD) from satellite observations.
Figure 4.2 Reconstruction of major aerosol types based on monthly mean aerosol
products as derived from measurements made by the AVHRR (AOD) and TOMS (AI)
satellite sensors (From Li e al.)
2

Trends:
Figure 4.3 Aerosol optical depth (AOD) trends from AVHRR (over oceans and cloud-
free sky) (Mishchenko et al.)
NOTE: AOD from both natural and anthropogenic
Figure 4.3 Global time-series showing the comparison of AVHRR AOD with ATSR-2
AOD between 1995 and 2001. ATSR-2 data are shown in black and AVHRR in blue.
The thick lines show the mean value for each month, with error bars indicating the
standard error on the mean. (From Thomas et al., 2010)
3
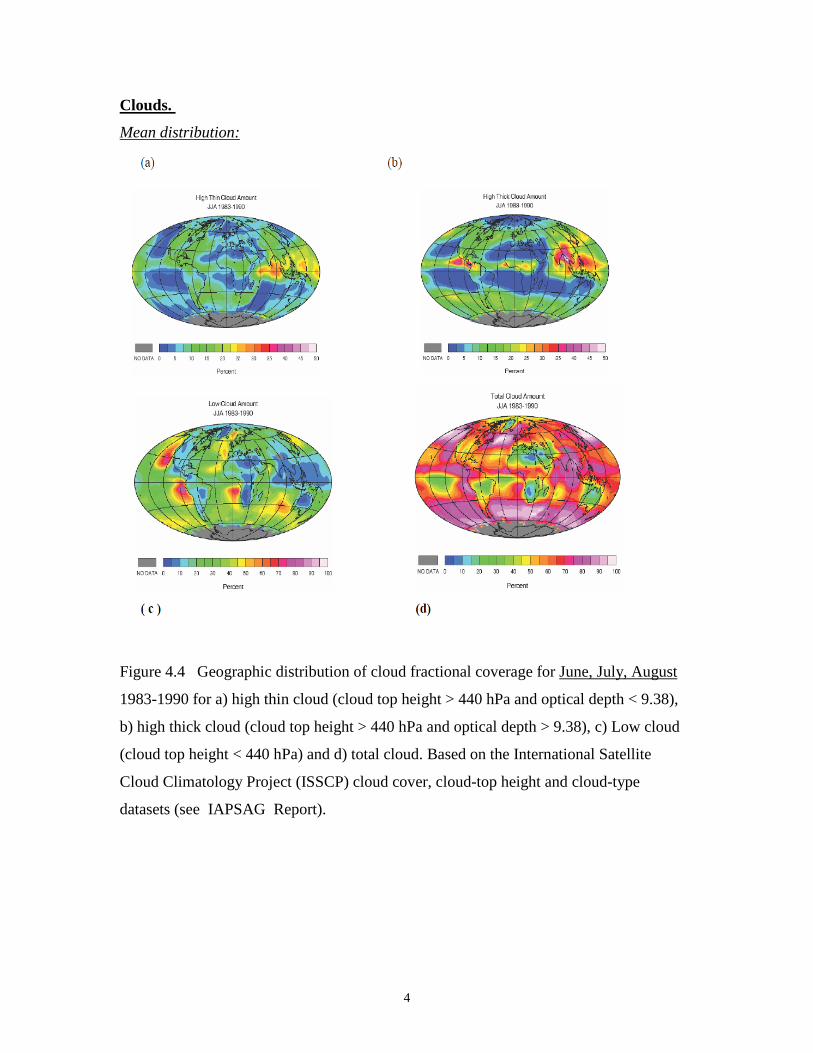
Clouds.
Mean distribution:
Figure 4.4 Geographic distribution of cloud fractional coverage for June, July, August
1983-1990 for a) high thin cloud (cloud top height > 440 hPa and optical depth < 9.38),
b) high thick cloud (cloud top height > 440 hPa and optical depth > 9.38), c) Low cloud
(cloud top height < 440 hPa) and d) total cloud. Based on the International Satellite
Cloud Climatology Project (ISSCP) cloud cover, cloud-top height and cloud-type
datasets (see IAPSAG Report).
4
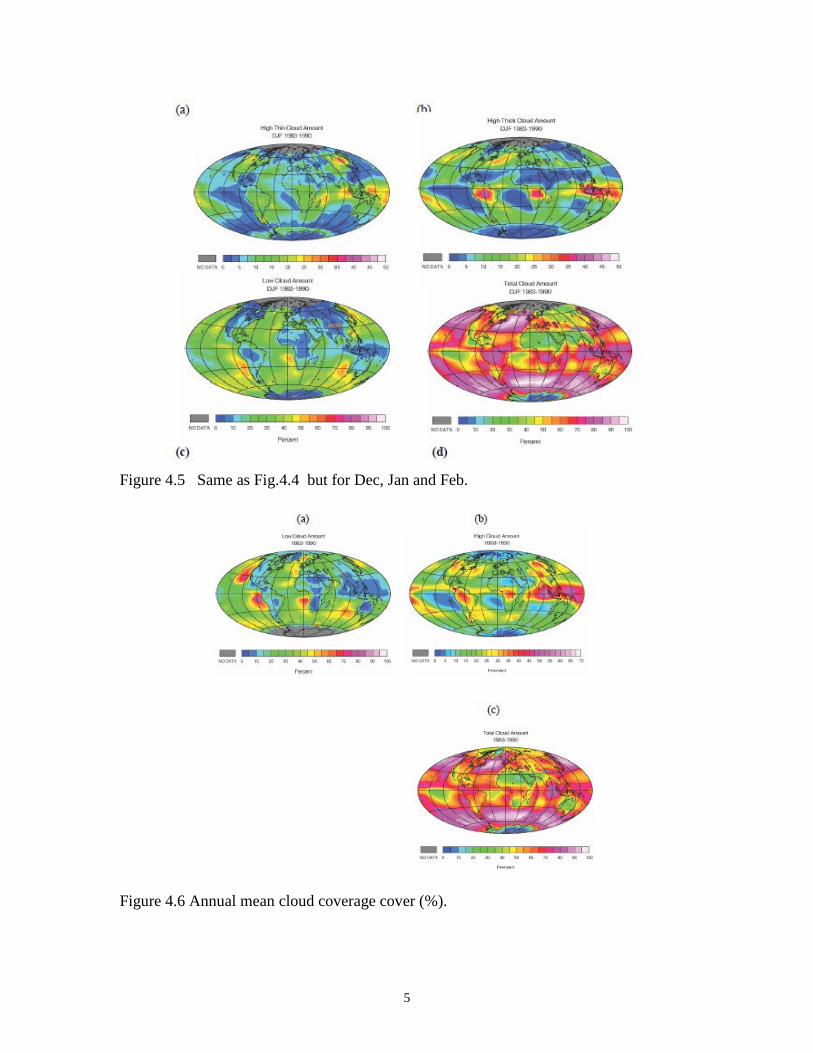
Figure 4.5 Same as Fig.4.4 but for Dec, Jan and Feb.
Figure 4.6 Annual mean cloud coverage cover (%).
5

Trends:
ISCCP analyses (see figs at http://isccp.giss.nasa.gov/climanal1.html)
Short data record (~22 years)
Some variation but no clear trends
Cloud amount increased by about 2% during the first three years of ISCCP and
then decreased by about 4% over the next decade. ISCCP began right after one of
the largest El Ninos this century (in 1982-83) and the eruption of the El Chichon
volcano, both of which may have caused some changes in clouds. There were
other, weaker El Ninos in 1986-87, 1990-91 and 1992-94 and another volcanic
eruption (Mt. Pinatubo) in 1991.
Difference between natural and human-induced climate change will most likely
appear clearly in much longer ( >= 50 years) data records.
Figure 4.7 (top) Globally averaged monthly mean total cloud amount from the ISCCP data. The overall decrease in cloud amount from 1985 to 2000 is about 4–5% with a recovery of about 2–3% from 2000 to 2004. (bottom) Globally averaged 5-year mean low (blue) and middle + high (red) cloud amounts. The difference in percent between low and middle + high cloud amounts is also given on top of each of the four 5-year intervals. Note the near doubling of this difference over the 2000–2004 period with respect to the previous means.
6

Trends(cirrus/contrails):
7
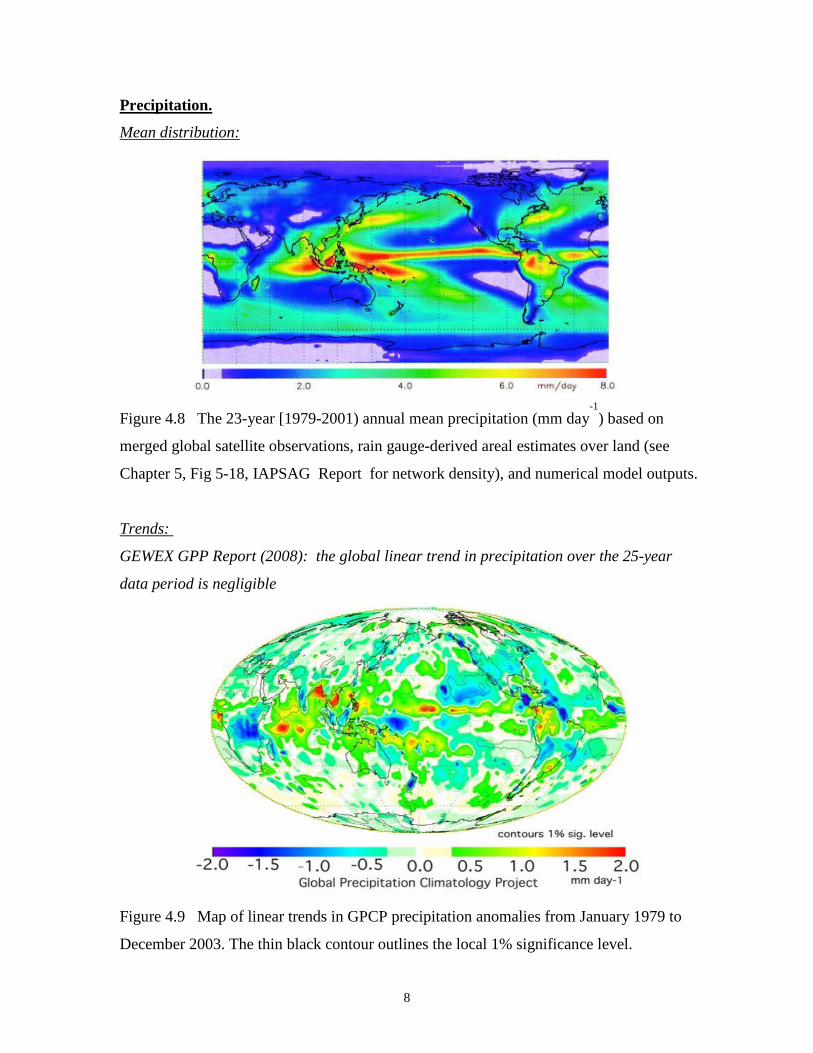
Precipitation.
Mean distribution:
Figure 4.8 The 23-year [1979-2001) annual mean precipitation (mm day-1
) based on
merged global satellite observations, rain gauge-derived areal estimates over land (see
Chapter 5, Fig 5-18, IAPSAG Report for network density), and numerical model outputs.
Trends:
GEWEX GPP Report (2008): the global linear trend in precipitation over the 25-year
data period is negligible
Figure 4.9 Map of linear trends in GPCP precipitation anomalies from January 1979 to
December 2003. The thin black contour outlines the local 1% significance level.
8

Changes in precipitation in the US:
Observations compiled by NOAA's National Climatic Data Center show that over the
contiguous U.S., total annual precipitation increased at an average rate of 6.1 percent per
century since 1900, although there was considerable regional variability. The greatest
increases came in the East North Central climate region (11.6 percent per century) and
the South (11.1 percent). Hawaii was the only region to show a decrease (-9.25 percent)
Figure 4.10 Annual precipitation trends 1901-2005.
9

IPCC (2007):
Precipitation has generally increased over land north of 30°N from 1900-2005,
but has mostly declined over the tropics since the 1970s. Globally, there has been
no statistically significant overall trend in precipitation over the past century,
although trends have varied widely by region and over time.
It has become significantly wetter in eastern parts of North and South America,
northern Europe, and northern and central Asia, but drier in the Sahel, the
Mediterranean, southern Africa and parts of southern Asia.
Changes in precipitation and evaporation over the oceans are suggested by
freshening of mid- and high-latitude waters (implying more precipitation), along
with increased salinity in low-latitude waters (implying less precipitation and/or
more evaporation).
There has been an increase in the number of heavy precipitation events (extreme
events) over many areas during the past century, as well as an increase since the
1970s in the prevalence of droughts—especially in the tropics and subtropics.
10