
Lecture 4 - Human Conflict and Cooperation lectures/Lecture 4.pdf · Study found that overall...
57
Lecture 4 Experiments and Observational Studies
-
Upload
dangnguyet -
Category
Documents
-
view
215 -
download
0
Transcript of Lecture 4 - Human Conflict and Cooperation lectures/Lecture 4.pdf · Study found that overall...

Lecture 4
Experiments and Observational Studies

Thought Question 1:In a study to relate two conditions, researchers often define one as the explanatory variableand other as the outcome or response variable.In a study to determine whether surgery or chemotherapy results in higher survival rates for a certain type of cancer, whether the patient survived is one variable, and whether he or she received surgery or chemotherapy is the other.Which is the explanatory variable and which is the response variable?

Thought Question 2:
In an experiment, researchers assign “treatments” to participants, whereas in an observational study, they simply observe what the participants do naturally.Give an example of a situation where an experiment would not be feasiblefor ethical reasons.

Thought Question 3:Interested in determining whether a daily dose of vitamin C helps prevent colds. Recruit 20 volunteers, want half to take vitamin C and other half to agree not to take it. Ask each which they prefer, and ten say take vitamin and other ten say not. Ask each to record how many colds he or she gets during the next ten weeks. At end of time, compare the results reported from the two groups. Give 3 reasons why this is not a good experiment.

5.1 Defining a Common Language
Explanatory variable is one that may explain or may cause differences in a response variable (or outcome variable).
Example:Study found that overall left-handed people die at a younger age than right-handed people.
Explanatory = HandednessResponse = Age at death

A treatment is one or a combination of categories of the explanatory variable(s) assigned by the experimenter.
Example: Salk Experiment (Chapter 1)
Explanatory = whether or not the baby listened to a heartbeat
Two treatments: heartbeat or silent
Response = Weight gain

Randomized Experiment versus Observational Studies
• Randomized experiment: create differences in the explanatory variable and examine results (response variable).
• Observational study: observe differences in the explanatory variable and notice whether these are related to differences in the response variable.

Experimental MethodsLaboratory experimentsLaboratory experimentsLaboratory experiments
Involve the direct manipulation of RV’s and the observation of their effects on the behavior of OV’s.
Advantages• allows cause-effect conclusions• control of extraneous variables
Disadvantages• artificial situations may not
represent natural events (participants know they are being observed)
• lack of generalizability
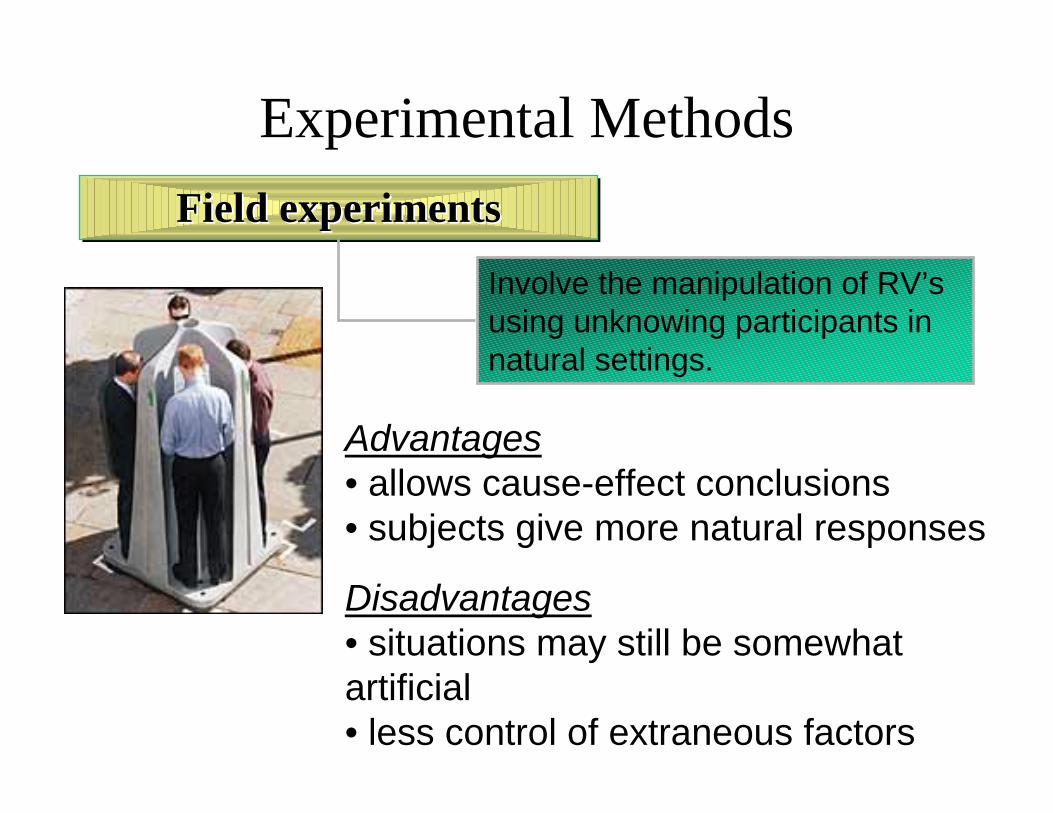
Experimental MethodsField experimentsField experimentsField experiments
Involve the manipulation of RV’s using unknowing participants in natural settings.
Advantages• allows cause-effect conclusions• subjects give more natural responses
Disadvantages• situations may still be somewhat artificial• less control of extraneous factors

Observational StudiesCase StudiesCase StudiesCase Studies
Involve intensive examination of a single person or group
Advantages• rich source of hypotheses• allows studies of rare behaviorsDisadvantages• observer bias• difficult to generalize• impossible to reconstruct causes from complexity of past events

Observational StudiesArchivesArchivesArchives
Involve gathering public records of social behaviors
Advantages• easy access to large amounts of pre-recorded data• little worry as to ethical issuesDisadvantages• many interesting social behaviors are never recorded• time consuming

Observational StudiesSurveysSurveysSurveys
Involve asking people questions about their beliefs and behaviors
Advantages• allows study of difficult-to-
observe behaviors, thoughts and feelings
• easy to distribute to large groupsDisadvantages
• people who respond may not be representative• responses may be biased or untruthful
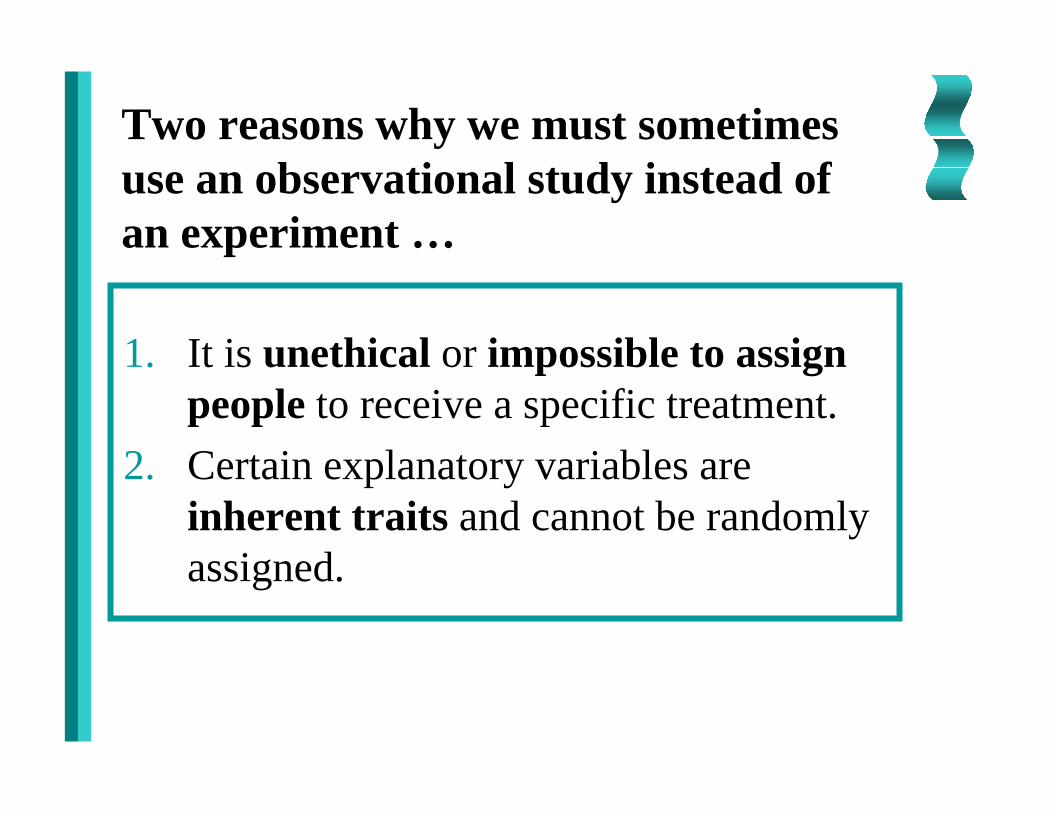
1. It is unethical or impossible to assign people to receive a specific treatment.
2. Certain explanatory variables are inherent traits and cannot be randomly assigned.
Two reasons why we must sometimes use an observational study instead of an experiment …

Confounding VariablesA confounding variable is …• related to the explanatory variable, and• affects the response variable.The effect of a confounding variable on the response variable cannot be separated from the effect of the explanatory variable on the response variable.Confounding variables are a bigger problem in observational studies. Researchers try to measure possible confounding variables and see if related to the response variable.

Example: Confounding Variables
Study of the relationship between smoking during pregnancy and child’s subsequent IQ a few years after birth.
• Explanatory variable: whether or not the mother smoked during pregnancy
• Response variable: subsequent IQ of the child• Women who smoke also have poor nutrition, lower levels of education, or lower income.
• Possible Confounding Variables: Mother’s nutrition, education, and income.

Interactions Between Variables[
An interaction between explanatory variablesoccurs when the effect of one explanatory variable on the response variable depends on what’s happening with another explanatory variable.
Example: If smoking during pregnancy reduces IQ when the mother does not exercise, but raises or does not influence IQ when the mother does exercise, then we would say smoking interacts with exercise to produce an effect on IQ.
If two variables interact, results should be given separately for each combination.

Experimental Units, Subjects, and Volunteers
• Experimental Units: smallest basic objects to which we assign different treatments in a randomized experiment.
• Observational Units: objects or people measured in any study.
• When they are people, often called participants or subjects.
• Participants are often volunteers (passive or recruited).

5.2 Designing a Good Experiment
• Randomization• Control Groups, Placebos,
and Blinding• Matched Pairs, Blocks,
and Repeated Measures

Randomization: The Fundamental Feature of Experiments
Randomly Assigning the Type of Treatments• In the basic experiment, each participant is assigned to
receive one treatment.• Randomly assigning the treatments to the experimental
units helps protect against hidden or unknown biases.
Randomizing the Order of the Treatments• In some experiments, all treatments are applied to
each unit.• Randomization should be used to determine the order
in which the treatments are applied.

15 of 16

1.) Start with 120 students. 2.) Randomly assign students to each box.
Non-Violent(girls)N=30
Violent(girls)N=30
Non-Violent(boys)N=30
Control
Violent(boys)N=30
Experiment

Example 1: Randomly Assigning Mindfulness Meditation
News Story #1: Would the regular practice of meditation enhance the immune system?
Details:• A total of 41 volunteers were recruited who were willing to
be assigned to meditate or not.• The 25 randomly assigned to the treatment group completed
an 8-week meditation program.• The 16 randomly assigned to the control group did not
receive this training during the study (offered it afterwards).
Randomization possible confounding factors (such as daily stress) should have been similar for the two groups.

Control Groups, Placebos, and BlindingControl Groups• Handled identically to the treatment group(s) in all respects,
except that they don’t receive the actual treatment.Placebos• Research shows people also respond to placebos – looks like
the real drug but has no active ingredients.• Randomly assign some patients to receive the drug and others
to receive a placebo, without telling which they are receiving.Blinding• Double-blind: neither the participant nor the researcher
taking measurements know who had which treatment.• Single-blind: only one of the two (participant or researcher)
knows which treatment the participant was assigned.

Example 2: Blindly Lowering Cholesterol
News Story #3: Which lowers cholesterol more? Special diet (portfolio) versus drug (lovastatin)?
Details:• Three treatments: portfolio diet, low-fat diet with lovastatin,
low-fat diet with placebo.• The 46 volunteers were randomized by a statistician using a
random number generator.• Blinding: researchers and participants both blind as to which
drug (lovastatin or placebo) people in those two groups were taking. However, participants and dieticians could not be blind to what the participants were eating. Lab staff evaluating cholesterol measurements were blinded to the treatment.

Matched Pairs, Blocks, and Repeated Measures
Matched-Pair Design• Use two matched individuals or the same individual to
receive each of two treatments.• Randomization used to assign the order of the two treatments.
Randomized Block Design• Extension of matched-pair to three or more treatments.
Repeated-Measures Design• Block designs in which the same participants are
measured repeatedly.

1. Random assignment to treatments is used to reduce unknown systematic biases due to confounding variables, that might otherwise exist between treatment groups.
2. Matched pairs, repeated measures and blocks are used to reduce known sources of natural variability in the response variable, so that differences due to explanatory variable can be detected more easily.
Reducing and Controlling Natural Variability and Systematic Bias

Case Study 5.1: Quitting Smoking with Nicotine Patches
Source: Hurt et al., 23 February 1994
Study Details: • 240 smokers recruited (all met entry criteria).• Randomly assigned to either nicotine patch or placebo
patch for 8 weeks. All received counseling.• Double-blinded.• After 8 weeks: 46% of nicotine group quit, only 20% of
placebo group quit.• After 1 year: 27.5% of nicotine group quit, only 14.2% of
placebo group quit.
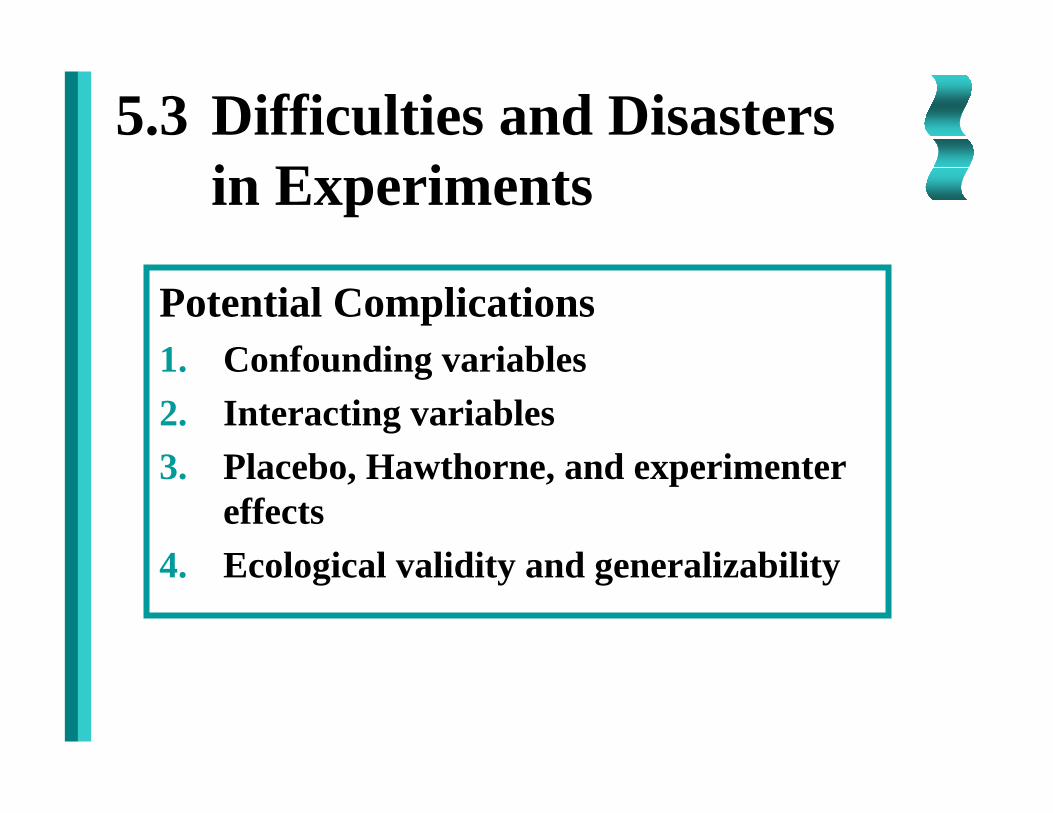
5.3 Difficulties and Disastersin Experiments
Potential Complications1. Confounding variables2. Interacting variables3. Placebo, Hawthorne, and experimenter
effects4. Ecological validity and generalizability

Confounding VariablesProblem: variables connected with explanatory
variable can distort results because they may be agent actually causing change in the response.
Solution: randomization => effects of confounding variables should apply equally to each treatment.
Example 3: Nicotine Patch Therapy• Nicotine patch more effective when no other smokers in home. • If first 120 volunteers assigned to placebo and last 120 to
nicotine patch, and if those with no other smokers in home more eager to volunteer => treatment would have been confounded with whether there were other smokers at home.
• Randomization => impact would be similar across two groups.

Interacting VariablesProblem: second variable interacts with explanatory
variable but results reported without noting it.Solution: researchers should measure/report variables
that may interact with explanatory variables.
Example 4: Other Smokers at Home• Interaction between treatment and whether other smokers in
home. Researchers measured and reported it.• After 8 weeks: proportion of nicotine group quitting only 31%
if other smokers at home, whereas 58% if not; proportions quitting were same whether other smokers or not for placebo.
• Misleading if only reported the 46% of nicotine group quit.

Placebo, Hawthorne, and Experimenter Effects
Problem: power of suggestion (placebo effect), just being included in a study (Hawthorne effect), and experimenter recording data erroneously, treating subjects differently – all these can bias results.
Solution: use double-blinding and control group, have data entered automatically in computer as collected.
Example 5: Dull Rats (Rosenthal and Fode, 1963)
• 12 experimenters each given 5 rats that had been taught to run amaze, all similar: six experimenters were told rats were bred to do well and other six told rats were not expected to do well.
• Experimenters told they had ‘maze bright’ rats reported much faster learning rates than those with ‘maze dull’ rats.

Ecological Validity and GeneralizabilityProblem: variables measured in labs or artificial setting,
results do not accurately reflect impact in real world; results for volunteers may not extend to larger group.
Solution: try to design experiment that can be performed in natural setting with a random sample from the population of interest; measure other variables to see if related to the response or the explanatory variables.
Example 6: Real Smokers with a Desire to Quit• Used a standard intervention that other physicians could follow.• Used participants at three different locations around country
with a wide range of ages (20 to 65).• Recorded other variables and checked to be sure not related to
the response variable or the patch treatment assignment.

Case Study 5.2: Exercise Yourself to Sleep
Source: King et al., 1 January 1997, pp. 32-37.
Study Details: • 43subjects: sedentary volunteers, 50-76 years old, with
moderate sleep problems but no heart disease.• Randomly assigned to either moderate community based
exercise program or continue to be sedentary.• Exercise group fell asleep 11 minutes faster on average
and slept 42 minutes longer on average.• Couldn’t be double-blind, sleep problems self-reported;
but otherwise a well-designed experiment.
Would regular exercise help reduce sleep difficulties in older adults?

5.4 Designing a Good Observational Study
• Observational study: compared 665 men admitted to hospital with 1st heart attack to 772 men (same age group) admitted to same hospitals for other reasons.
• Percent with pattern baldness higher for heart attack group (42%) compared to no heart attack (34%).
• Included adjustments for age and other heart attack risk factors.• Speculated about 3rd variable, possibly a male hormone.
“men with typical male pattern baldness … are anywhere from 30 to 300 percent more likely to suffer a heart attack than men with little or no hair loss at all.” Newsweek, March 8, 1993, p. 62.
Case Study 5.3: Baldness and Heart Attacks

Types of Observational Studies
Case-Control Studies• ‘Cases’ who have particular attribute or condition
are compared with ‘controls’ who do not.
Retrospective or Prospective Studies• Retrospective: participants are asked to recall past
events.• Prospective: participants followed into future, and
events recorded. Better because people often do not remember past events accurately.

Advantages of Case-Control Studies
Efficiency• Efficient in terms of time, money, inclusion of
enough people with disease.
Reducing Potential Confounding Variables• Controls chosen to try to reduce potential
confounding variables (but must be careful not to introduce new ones).

5.5 Difficulties and Disastersin Observational Studies
Potential Complications1. Confounding variables and the
implication of causation2. Extending the results
inappropriately3. Using the past as a source of data

Confounding Variables and the Implications of Causation
Problem: no way to establish causation with an observational study – can’t separate out all potential confounding factors w/o randomization.
Solution: measure potential confounding variables; choosing controls as similar as possible to cases.
Example 7: Smoking During Pregnancy• IQs lower for children of women who smoked. • Difference as high as 9 points before accounting for
confounding variables (diet and education); reduced to 4 points after accounting for those factors.
• Can’t conclude smoking caused lower IQs in children.

Extending the Results Inappropriately
Problem: many use convenience samples, not representative of any population.
Solution: researchers should use entire segment of population of interest.
Example 8: Baldness and Heart Attacks• Observational study only used men who were
hospitalized. • Should consider whether results should be extended
to all men.

Using the Past as a Source of DataProblem: retrospective studies unreliable –ask
people to recall past behavior; confounding variables in past not similar current ones.
Solution: use prospective studies if possible; else use authoritative sources versus memory.
Example 9: Do Left-Handers Die Young?• Retrospective: sent letters to next of kin asking about
handedness of deceased.• Average age of death of LH was 66 versus 75 for RH.• In early 20th century, many children forced to write RH.
Many in study may have been influenced.

5.6 Random Sample versus Random Assignment
Extending Results to a Larger Population:Random Sampling• Often impractical to obtain a random sample.• Extent to which results extend depends on extent to
which participants are representative of population.Establishing Cause and Effect: Random Assignment• Evens out confounding variables across treatments.• Without it, naturally occurring confounding variables
can result in an apparent relationship.

Getting the Big PictureChapter 6
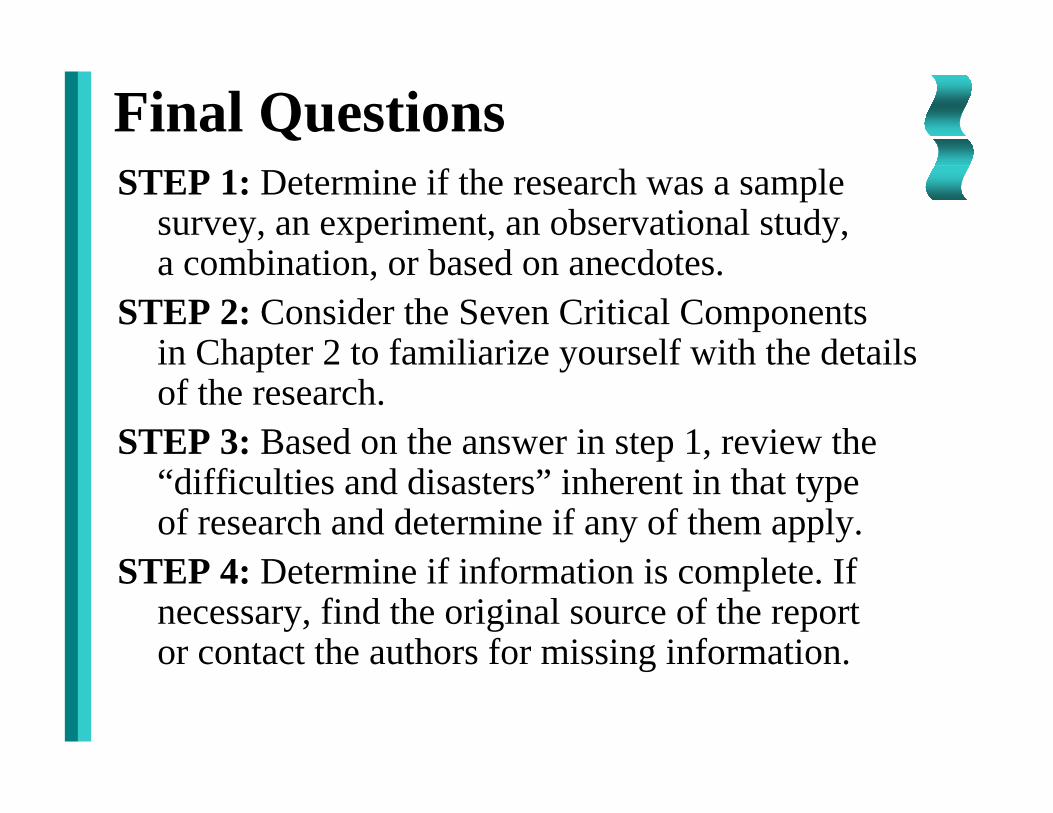
Final QuestionsSTEP 1: Determine if the research was a sample
survey, an experiment, an observational study, a combination, or based on anecdotes.
STEP 2: Consider the Seven Critical Components in Chapter 2 to familiarize yourself with the details of the research.
STEP 3: Based on the answer in step 1, review the “difficulties and disasters” inherent in that type of research and determine if any of them apply.
STEP 4: Determine if information is complete. If necessary, find the original source of the report or contact the authors for missing information.

Final QuestionsSTEP 5: Ask if the results make sense in the larger
scope of things. If they are counter to previously accepted knowledge, see if you can get a possible explanation from the authors.
STEP 6: Ask yourself if there is any alternative explanation for the results.
STEP 7: Determine if the results are meaningful enough to encourage you to change your lifestyle, attitudes, or beliefs on the basis of the research.

Case Study 6.1: Mozart, Relaxation, and Performance on Spatial Tasks
Source: Rauscher, Shaw, and Ky, 14 October 1993, p. 611.
Study Details: • Repeated measures experiment on 36 college students.• Each participated in 3 listening conditions:
(1) Mozart, (2) Relaxation Tape, (3) Silence.• Each condition followed by set of abstract/visual reasoning
tasks (from IQ test). Scores translated to full IQ score.• Averages: Mozart = 119 significantly higher than both
Relaxation Tape = 111 and Silence = 110.• Researchers tested some potential confounding factors
(pulse rates, order of presentation, different experimenters) and found no effect.
Case Study 6.1: Mozart, Relaxation, and Performance on Spatial Tasks
STEP 1: Determine if research was sample survey, experiment, observational study, a combination, or based on anecdotes.Repeated measures, randomized experiment but no info about how (or if) randomly assigned the order of conditions.
STEP 2: Consider the Seven Critical Components.Component 2: not told whether those who tested participants knew the purpose of experiment. Component 1: not told about funding. Component 3: not told how participants were selected.

Case Study 6.1: Mozart, Relaxation, and Performance on Spatial Tasks
STEP 3: Review “difficulties and disasters” inherent in that type of research and determine if any of them apply.Experimenter effect: not told whether subjects knew intent of experimenters; subjects could not be blinded. Generalizability: results obtained 10 min in a lab may not extend to real world. Confounding: not told which IQ task assigned; not told if amount of contact by experimenter was the same for all three conditions.
STEP 4: Determine if information is complete. If necessary, find original source of report or contact authors for missing info.Substantial information missing and would be helpful.

Case Study 6.1: Mozart, Relaxation, and Performance on Spatial Tasks
STEP 5: Ask if results make sense in larger scope of things. If counter, see if a possible explanation from the authors.Authors only reference “correlational, historical, and anecdotal relationships between music cognition and other ‘higher brain function’ – no other justification of results.
STEP 6: Ask if any alternative explanation for the results.Perhaps … subjects knew Mozart was ‘best’; IQ task for Mozart ‘easier’; experimenters interacted more for Mozart.
STEP 7: Determine if results meaningful enough to change lifestyle, attitudes, or beliefs on the basis of the research.Helpful if you will be taking abstract/spatial reasoning test.

Case Study 6.3: Drinking, Driving, and the Supreme Court
Source: Gastwirth, 1988, pp. 524-528.
Craig v. Boren, 429 U.S. 190, 1976: • Challenged Oklahoma state law prohibiting sale of 3.2%
beer to males under 21 but allowed it to females under 21.• Laws allowed to use gender-based differences if ‘serve
important governmental objectives’ and ‘are substantially related to achievement of these objectives’.
• Defense argued traffic safety was an important governmental objective and data show young males more likely to have alcohol-related accidents than females.
• Supreme Court shown two sets of data. • Review the data – do you think law should be upheld?

Case Study 6.3: Drinking, Driving, and the Supreme Court
2% of males 18-21 0.18% of females 18-21

Case Study 6.3: Drinking, Driving, and the Supreme Court
STEP 1: Determine if research was sample survey, experiment, observational study, a combination, or based on anecdotes.Table 6.1: observational, representing only a subset of those who committed the crimes. Table 6.2: sample survey, based on a convenience sample.
STEP 2: Consider the Seven Critical Components.Not told how the ‘random roadside survey’ was conducted.

Case Study 6.3: Drinking, Driving, and the Supreme Court
STEP 3: Review “difficulties and disasters” inherent in that type of research and determine if any of them apply.Table 6.1: Males more likely to be stopped for other traffic violations. Table 6.2: drivers questioned at these certain locations may not represent all drivers.
STEP 4: Determine if information is complete. If necessary, find original source of report or contact authors for missing info.Relatively complete (except for Step 2).
STEP 5: Ask if results make sense in larger scope of things. If counter, see if a possible explanation from the authors.Nothing suspicious.

Case Study 6.3: Drinking, Driving, and the Supreme Court
STEP 6: Ask if any alternative explanation for the results.Table 6.1: Males more likely to be stopped for other traffic violations. Table 6.2 shows almost 80% of drivers were male. Males more likely driving helps explain why Table 6.1 results so different. Table 6.2 results of 11.4% males versus 9.4% females were statistically indistinguishable.
STEP 7: Determine if results meaningful enough to change lifestyle, attitudes, or beliefs on the basis of the research.Supreme Court overturned law concluding Table 6.2 data ‘provides little support for a gender line among teenagers’.

Case Study 6.4: Smoking During Pregnancy and Child’s IQ
News Source: 11 February 1994, p. A-10.Original Source: Olds, Henderson, and Tatelbaum, February 994, pp. 221-227.

Case Study 6.4: Smoking During Pregnancy and Child’s IQ
STEP 1: Determine if research was sample survey, experiment, observational study, a combination, or based on anecdotes.Observational Study. Smoking behavior observed.
STEP 2: Consider the Seven Critical Components.News report too brief. Missing info provided in original report: Supporting grants from many sources not related to tobacco products; participant details (primiparous women, many teenagers, unmarried or poor, mostly white); two groups compared (smoked 10+ cigarettes per day average versus none); IQ measured at 12 months; many potential confounding variables measured and checked; not clear if study was single-blind.

Case Study 6.4: Smoking During Pregnancy and Child’s IQ
STEP 3: Review “difficulties and disasters” inherent in that type of research and determine if any of them apply.Prospective study. Difference in IQ for two groups reduced from 9 to 4 points when potential measured confounding variables included – there could be others not included, such as maternal report of illegal drug/alcohol use or child’s exposure to side-stream smoke. Results may not extend to older mothers or less disadvantaged groups.
STEP 4: Determine if information is complete. If necessary, find original source of report or contact authors for missing info.Original report fairly complete.

Case Study 6.4: Smoking During Pregnancy and Child’s IQ
STEP 6: Ask if any alternative explanation for the results.Confounding variables not measured; possible experimenter bias if those measuring IQ were not blind.
STEP 7: Determine if results meaningful enough to change lifestyle, attitudes, or beliefs on the basis of the research.If you were pregnant and concerned about your child’s IQ, results might lead you to quit smoking during pregnancy.
STEP 5: Ask if results make sense in larger scope of things. If counter, see if a possible explanation from the authors.Authors do speculate on what might be cause.


