Lecture 4: Basics Of Macroeconomics Given to the EMBA 8400 Class Buckhead Center April 3, 2009 Dr....
52
Lecture 4: Basics Of Macroeconomics Given to the Given to the EMBA 8400 Class EMBA 8400 Class Buckhead Center Buckhead Center April 3, 2009 April 3, 2009 Dr. Rajeev Dhawan Dr. Rajeev Dhawan Director Director
-
date post
19-Dec-2015 -
Category
Documents
-
view
215 -
download
0
Transcript of Lecture 4: Basics Of Macroeconomics Given to the EMBA 8400 Class Buckhead Center April 3, 2009 Dr....

Lecture 4: Basics Of Macroeconomics
Given to theGiven to theEMBA 8400 ClassEMBA 8400 ClassBuckhead CenterBuckhead Center
April 3, 2009April 3, 2009
Dr. Rajeev DhawanDr. Rajeev DhawanDirectorDirector

Chapter 28
Unemployment & Its Natural Rate

Unemployment Rate Since 1960Unemployment Rate Since 1960
Copyright©2003 Southwestern/Thomson Learning
10
8
6
4
2
0
1970 19751960 1965 1980 1985 1990 2005
Percent ofLabor Force
1995 2000
Natural rate ofunemployment
Unemployment rate

2009200820072006200520042003200220012000
8
7
6
5
4
3
700
600
500
400
300
200
(%) ('000)
Unemployment Insurance Claimsand Unemployment Rate
Unemployment Rate (Left) U.I. Claims (Right)

Identifying Unemployment Natural Rate of Unemployment
– The natural rate of unemployment is unemployment that does not go away on its own even in the long run.
– It is the amount of unemployment that the economy normally experiences.
Cyclical Unemployment– Cyclical unemployment refers to the year-to-year
fluctuations in unemployment around its natural rate.– It is associated with short-term ups and downs of the
business cycle.

How Is Unemployment Measured?
Based on the answers to the survey questions, the Bureau of Labor Statistics (BLS) places each adult into one of three categories:– Employed– Unemployed– Not in the labor force
Labor Force– The labor force is the total number of workers, including
both the employed and the unemployed.– The BLS defines the labor force as the sum of the
employed and the unemployed.

Breakdown Of The Population In 2004
AdultPopulation
(223.4 million)
Labor Force(147.4 million)
Employed(139.3 million)
Not in labor force(76.0 million)
Unemployed (8.1 million)
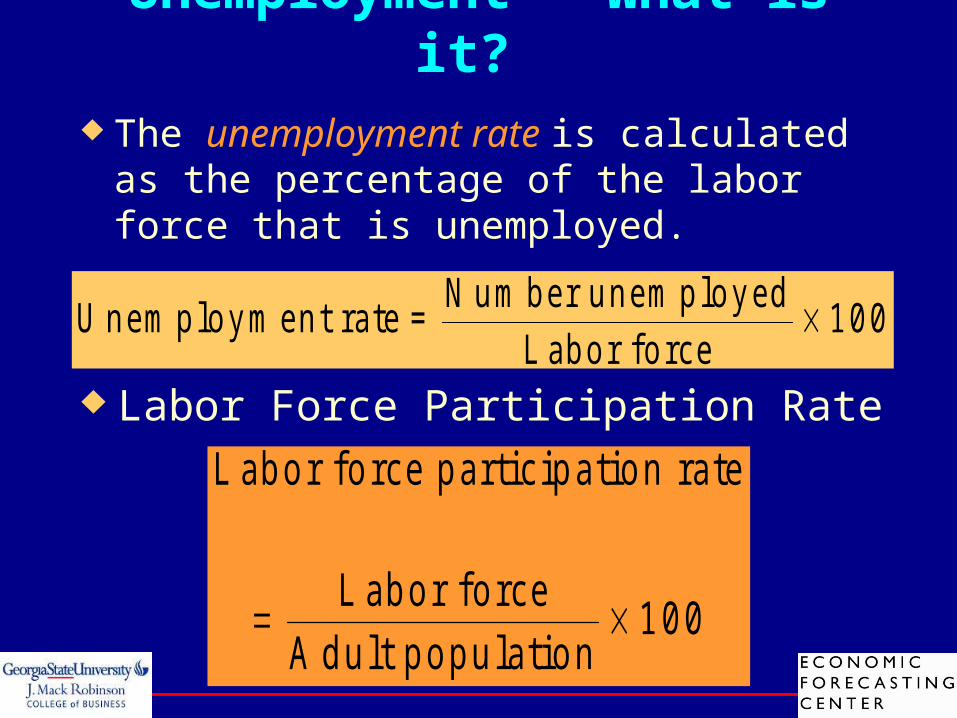
Unemployment - What is it? The unemployment rate is calculated as the
percentage of the labor force that is unemployed.
U n em p lo y m en t ra te =N u m b er u n e m p lo y ed
L ab o r fo rce 1 0 0
L ab o r fo rce p artic ip a tio n ra te
L ab o r fo rce
A d u lt p o p u la tio n 1 0 0
Labor Force Participation Rate

Example
In 2001, 135.1 million people were employed and 6.7 million people were unemployed.
– Labor Force = 135.1 + 6.7 = 141.8 million
– Unemployment Rate = (6.7 / 141.8) X 100
= 4.7 percent
– Labor Force Participation Rate =
(141.8 / 211.9) X 100 = 66.9 percent
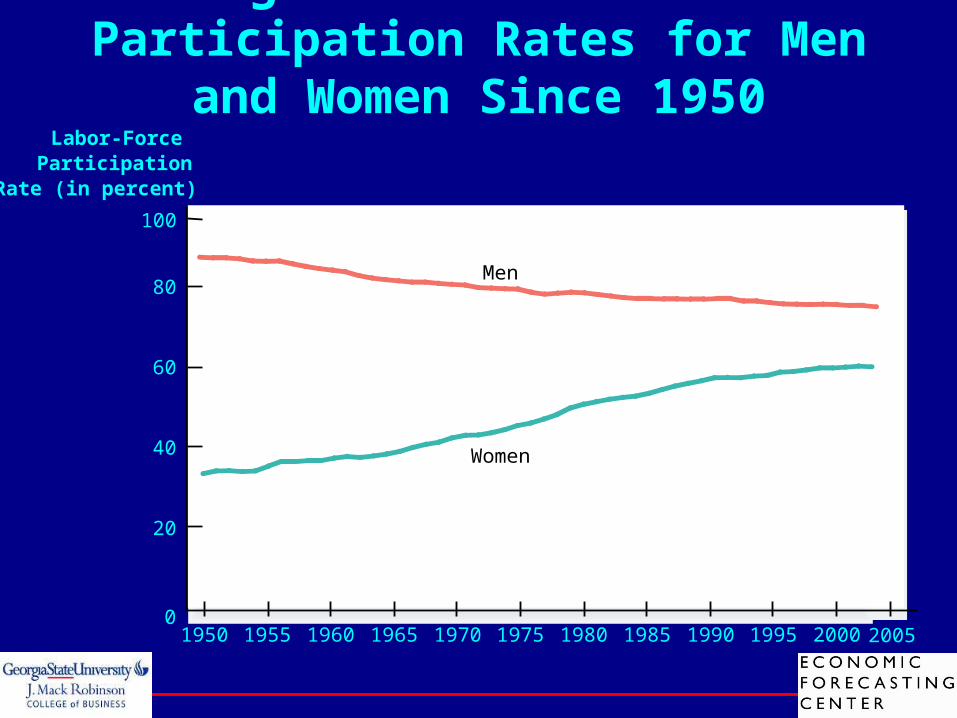
Figure 3 Labor Force Participation Rates for Men and Women Since 1950
100
80
60
40
20
01950 1955 1960 1965 1970 1975 1980 1985 1990 2000
Labor-ForceParticipation
Rate (in percent)
Women
Men
1995 2005

Questions About Unemployment
Does the Unemployment Rate Measure What We Want It To?
How Long Are the Unemployed without Work?
Why Are There Always Some People Unemployed?

Article: Why do Americans Work More Than Europeans?WSJ; by: Edward Prescott
Americans aged 15-64, on a per-person basis, work 50% more than French. The French, for example, prefer leisure more than do Americans or on the other side of the coin, that Americans like to work more. This is silliness !!
Germans and Americans spend the same amount time working, but the proportion of taxable market time vs. nontaxable home work time is different
But marginal tax rates explain virtually all of this difference. Labor supply is not fixed. People be they European or American, respond to taxed on their income. – Spanish labor supply increased by 12% in 1988
when taxes were cut

Article: The $366 Billion OutrageFortune Magazine; by: Janice Revell
Pension plans of 16 million state and local government workers are taking up a huge share of the budgets. In the 90’s elected officials allowed workers to dramatically spike their pre-retirement compensation, to retire on more than 100% of their pay, and to draw both their salaries and pensions, with guaranteed market returns, simultaneously.
San Diego deferred retirement option plan, or DROP allows pension, deposited into a special account earn a guaranteed 8% annual rate of interest, plus a 2% annual cost-of-living adjustment. When the employee actually decides to retire he can either collect the amount that has accumulated in his special pension account or let it keep compounding at that generous rate or return indefinitely.
Result:
The pension fund is short by billions and counting ($366 Billion so far!). The generosity of the plan means workers (e.g. in Houston 44% of the city workforce) can quit without taking a major financial hit => early retirement by qualified employees.
SolutionSolution: Raise property tax (is happening)Cut in city services (is happening)Cut benefits (?)

Chapter 29
The Monetary System
Money–What is it and what does it do?
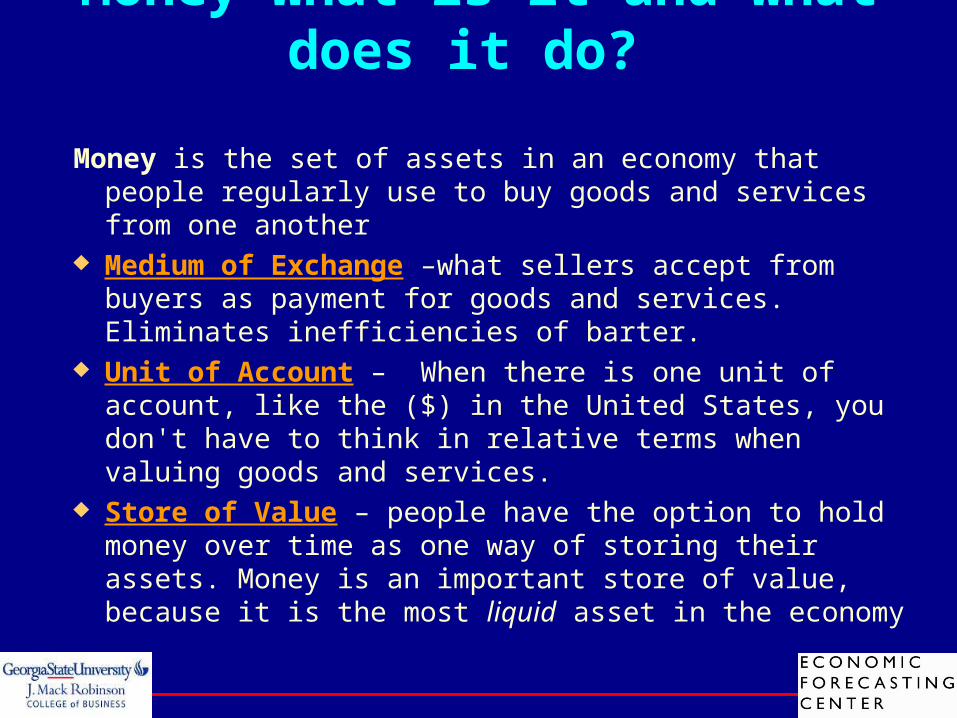
Money is the set of assets in an economy that people regularly use to buy goods and services from one another
Medium of Exchange –what sellers accept from buyers as payment for goods and services. Eliminates inefficiencies of barter.
Unit of Account – When there is one unit of account, like the ($) in the United States, you don't have to think in relative terms when valuing goods and services.
Store of Value – people have the option to hold money over time as one way of storing their assets. Money is an important store of value, because it is the most liquid asset in the economy

Types of Money
Commodity Money money that takes the form of a commodity with intrinsic value.
Fiat Money money without intrinsic value that is used as money because of government decree

How to Measure Money
Money Stock: The quantity of money circulating in the economy
Q: Suppose you want to know the size of the U.S. money stock. What should you count as money?
A: Currency and demand deposits, and a few other items (detailed below) but not credit cards.
Currency - the paper bills and coins in the hands of the public
Demand Deposits - balances in bank accounts that depositors can access on demand by writing a check (or by using a debit card)

Two Measures of the Money Stock for the U.S. Economy (2004)
Billionsof Dollars
• Currency($699 billion)
• Demand deposits• Traveler’s checks• Other checkable deposits ($664 billion)
• Everything in M1($1,363 billion)
• Savings deposits• Small time deposits• Money market mutual funds• A few minor categories ($5,035 billion)
0
M1$1,363
M2$6,398
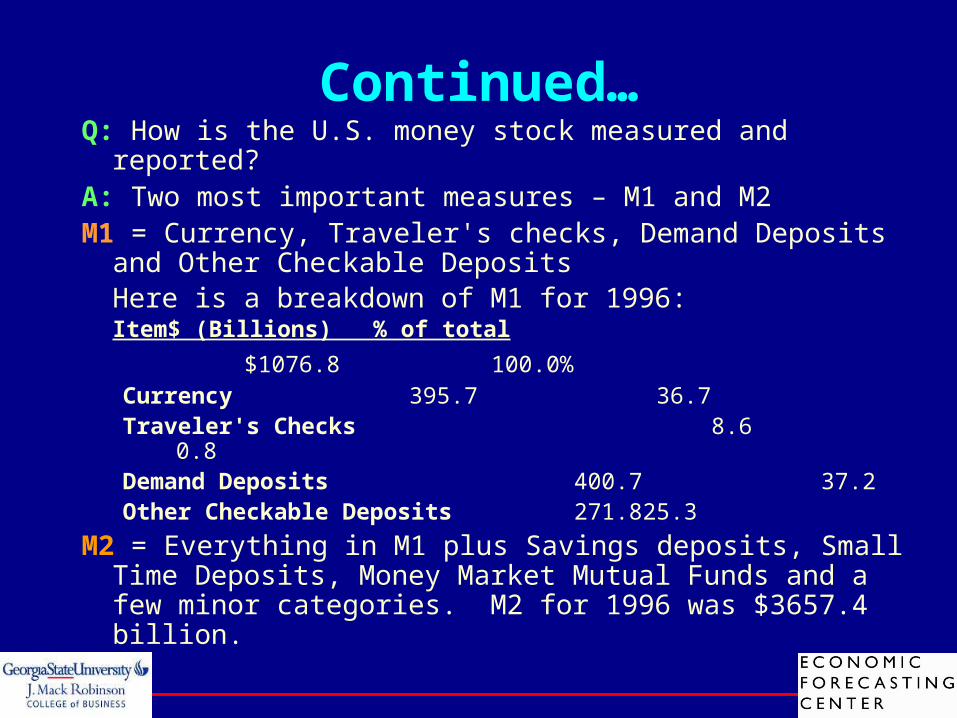
Continued…Q: How is the U.S. money stock measured and reported?A: Two most important measures – M1 and M2M1 = Currency, Traveler's checks, Demand Deposits and Other
Checkable DepositsHere is a breakdown of M1 for 1996:
Item$ (Billions) % of total
$1076.8 100.0%Currency 395.7 36.7Traveler's Checks 8.6 0.8Demand Deposits 400.7 37.2Other Checkable Deposits 271.8 25.3
M2 = Everything in M1 plus Savings deposits, Small Time Deposits, Money Market Mutual Funds and a few minor categories. M2 for 1996 was $3657.4 billion.

Banks & Money Supply
Q: How do banks operate?A: Banks accept deposits from people. That money is in an
account until the depositor makes a withdrawal or writes a check on their account.
Q: Do banks keep all of your money in their vault?A: No. Our banking system is called fractional reserve
banking. Bankers understand that it is not necessary to keep 100 percent of a depositors money on hand at all times. As a result, bankers take some of your money and loan it out to other people.

Continued..
Fractional reserve banking - a banking system in which banks hold only a fraction of deposits as reserves
Reserve ratio - the fraction of deposits that banks hold as reserves. Minimum reserve ratios are set by the Fed.

Money Creation with Fractional-Reserve Banking
When a bank makes a loan from its reserves, the money supply increases.
The money supply is affected by the amount deposited in banks and the amount that banks loan.– Deposits into a bank are recorded as both assets and
liabilities.– The fraction of total deposits that a bank has to keep
as reserves is called the reserve ratio.– Loans become an asset to the bank.

Money Creation with Fractional-Reserve Banking
This T-Account shows a bank that…– accepts deposits,– keeps a portion
as reserves, – and lends out
the rest. – It assumes a
reserve ratio of 10%.
Assets Liabilities
First National Bank
Reserves$10.00
Loans$90.00
Deposits$100.00
Total Assets$100.00
Total Liabilities$100.00

Money Creation with Fractional-Reserve Banking
When one bank loans money, that money is generally deposited into another bank.
This creates more deposits and more reserves to be lent out.
When a bank makes a loan from its reserves, the money supply increases.

The Money MultiplierSuppose that the Fed requires banks to keep 20 percent of their
demand deposits on reserve.
Q: What happens when somebody brings in $100 and deposits it in a bank?
A: The bank is required to keep $10 (10 percent) on reserve.
Q: What does the bank do with the remaining $90? A: The bank will turn around and lend it to somebody else,
earning interest income for the bank.Q: What did that $90 loan do to the size of the money supply?A: The money supply increased by $90 when the loan was made.
Here's how:

Continued… When the first depositor arrived with $100 in cash, the money
supply included that $100 of currency in the depositor's wallet After the deposit, the currency was in the bank vault and not
circulating (so out of the money supply) However, demand deposits increased by $100, so the money
supply was unchanged (currency fell by $100, deposits increased by $100)
When the bank made the $90 loan, $90 in currency reentered the money supply
Added to the $100 demand deposit, that original $100 has grown to $190.

Continued… Now suppose that the person who received the $90 loan
deposits that money into their checking account.
Q: What does the bank have to do with the $90? A: Keep 10 percent on reserve (10 percent of $90 = $9).
Q: What does the second bank do with the remaining $81? A: They can lend that out to somebody else

The Money Multiplier
Assets Liabilities
First National Bank
Reserves$10.00
Loans$90.00
Deposits$100.00
Total Assets$100.00
Total Liabilities$100.00
Assets Liabilities
Second National Bank
Reserves$9.00
Loans$81.00
Deposits$90.00
Total Assets$90.00
Total Liabilities$90.00
Money Supply = $190.00!

Money MultiplierQ: How far does this process of money creation go?A: The process of bank money creation continues until there are no more
excess reserves to be lent out. Money multiplier - the amount of money the banking system generates with
each dollar of reserves. The money multiplier is the reciprocal of the reserve ratio:
M = 1/RWith a reserve requirement, R = 10% or 1/10,The multiplier is 10. Therefore, the original $100 deposit will eventually turn into $1000 of deposits.
Q: The banking system can create money, but can it also create real wealth?A: No. Each loan has two parts. Recall that the first $90 loan generated $90 in
new money. At the same time, that $90 loan also created a new $90 liability for the person borrowing the money. The banking system cannot create real wealth.

The Federal Reserve System
The Federal Reserve (Fed) serves as the nation’s central bank.– It is designed to oversee the banking system.– It regulates the quantity of money in the economy.
The primary elements in the Federal Reserve System:
1) The Board of Governors2) The Regional Federal Reserve Banks3) The Federal Open Market Committee

The Federal Reserve SystemThe Federal Reserve System
Copyright©2003 Southwestern/Thomson Learning

The Fed’s Organization
The Federal Open Market Committee (FOMC)– Serves as the main policy-making organ of the Federal
Reserve System.– Meets approximately every six weeks to review the
economy. The FOMC is made up of the following voting
members:– The chairman and the other six members of the Board of
Governors.– The president of the Federal Reserve Bank of New York.– The presidents of the other regional Federal Reserve
banks (four vote on a yearly rotating basis).

The Fed’s Tools of Monetary Control
The Fed has three tools in its monetary toolbox:
– Open-market operations– Changing the reserve requirement– Changing the discount rate

Open-Market Operations– The Fed conducts open-market operations when it
buys government bonds from or sells government bonds to the public:
– When the Fed buys bonds, the money supply is increased. Here is why: The Fed pays for the bonds it buys with money that was not currently a part of the money supply, hence, when the Fed buys bonds it simply increases the total amount of money in circulation.
– When the Fed sells bonds, the money supply is decreased. Here is why: The Fed sells bonds in the market and receives cash in return for the bonds it sells. Once the Fed receives the cash, this cash is taken out of circulation – therefore, the size of the money supply is decreased.
The Fed’s Tools of Monetary Control
Problems in Controlling the Money Supply
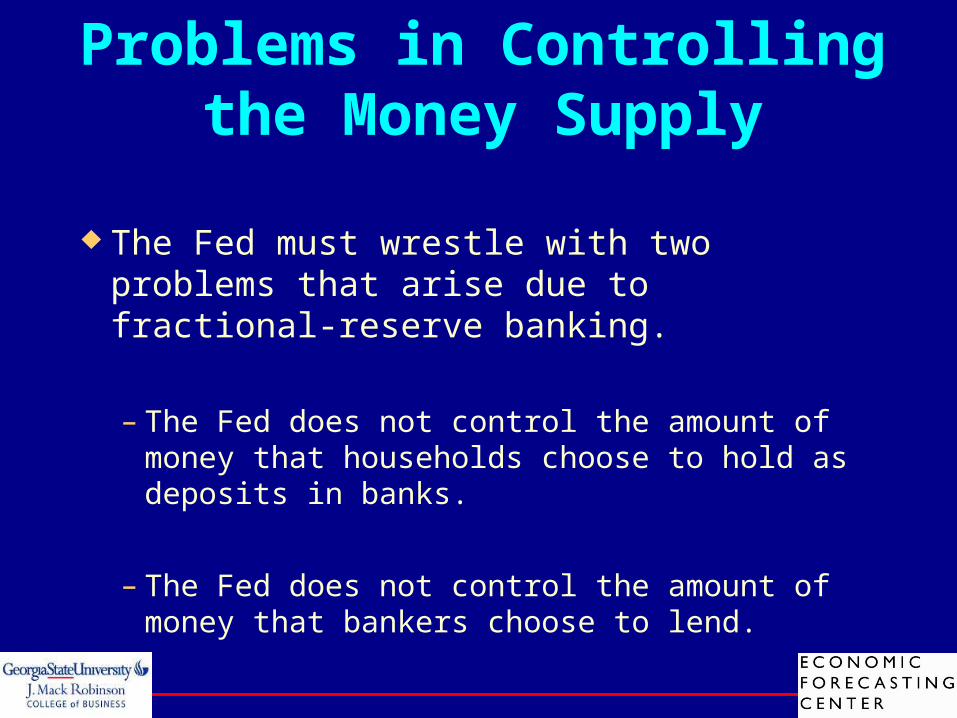
The Fed must wrestle with two problems that arise due to fractional-reserve banking.
– The Fed does not control the amount of money that households choose to hold as deposits in banks.
– The Fed does not control the amount of money that bankers choose to lend.

Chapter 30
Money Growth and Inflation
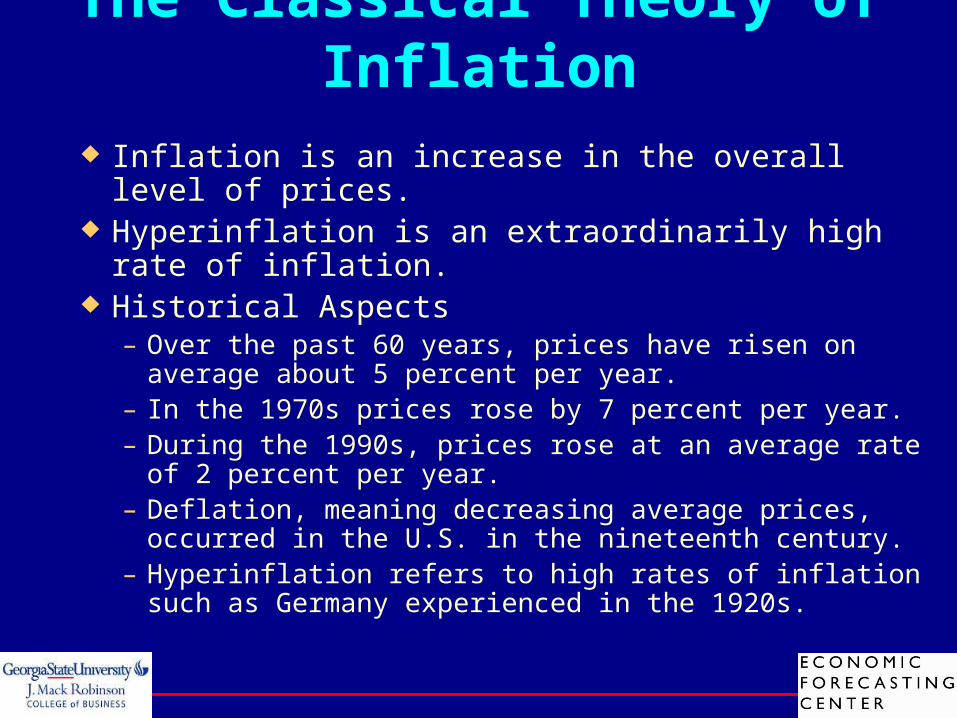
The Classical Theory of Inflation Inflation is an increase in the overall level of prices. Hyperinflation is an extraordinarily high rate of
inflation. Historical Aspects
– Over the past 60 years, prices have risen on average about 5 percent per year.
– In the 1970s prices rose by 7 percent per year. – During the 1990s, prices rose at an average rate of 2
percent per year.– Deflation, meaning decreasing average prices, occurred in
the U.S. in the nineteenth century.– Hyperinflation refers to high rates of inflation such as
Germany experienced in the 1920s.

Inflation is an economy-wide phenomenon that concerns the value of the economy’s medium of exchange.
When the overall price level rises, the value of money falls.
The Classical Theory of Inflation

Money Supply, Money Demand and Monetary Equilibrium
The money supply is a policy variable that is controlled by the Fed.– Through instruments such as open-market operations,
the Fed directly controls the quantity of money supplied. Money demand has several determinants, including interest
rates and the average level of prices in the economy. People hold money because it is the medium of exchange.
– The amount of money people choose to hold depends on the prices of goods and services.
In the long run, the overall level of prices adjusts to the level at which the demand for money equals the supply.

Money Supply, Money Demand, and the Equilibrium Money Supply, Money Demand, and the Equilibrium Price LevelPrice Level
Copyright © 2004 South-Western
Quantity ofMoney
Value ofMoney, 1/P
Price Level, P
Quantity fixedby the Fed
Money supply
0
1
(Low)
(High)
(High)
(Low)
1/2
1/4
3/4
1
1.33
2
4
Equilibriumvalue ofmoney
Equilibriumprice level
Moneydemand
A

Figure 2 The Effects of Monetary InjectionFigure 2 The Effects of Monetary Injection
Copyright © 2004 South-Western
Quantity ofMoney
Value ofMoney, 1/P
Price Level, P
Moneydemand
0
1
(Low)
(High)
(High)
(Low)
1/2
1/4
3/4
1
1.33
2
4
M1
MS1
M2
MS2
2. . . . decreasesthe value ofmoney . . .
3. . . . andincreasesthe pricelevel.
1. An increasein the moneysupply . . .
A
B
The Classical Theory of Inflation
The Quantity Theory of Money– How the price level is determined and why it
might change over time is called the quantity theory of money.
The quantity of money available in the economy determines the value of money.
The primary cause of inflation is the growth in the quantity of money.

Velocity and the Quantity Equation The velocity of money refers to the speed at
which the typical dollar bill travels around the economy from wallet to wallet.
V = (P Y)/MWhere: V = velocity
P = the price levelY = the quantity of outputM = the quantity of money
Rewriting the equation gives the quantity equation:
M V = P Y

Velocity & Quantity Equation
Velocity ( V ) = Nominal GDP/ Money Supply = ( P x Y ) / M
Example: V = ($10 x 100 ) / $ 50 = 20

Velocity & Quantity Equation
The quantity equation relates the quantity of money (M) to the nominal value of output (P Y).
The quantity equation shows that an increase in the quantity of money in an economy must be reflected in one of three other variables:– the price level must rise,
– the quantity of output must rise, or
– the velocity of money must fall.

Velocity and the Quantity Equation
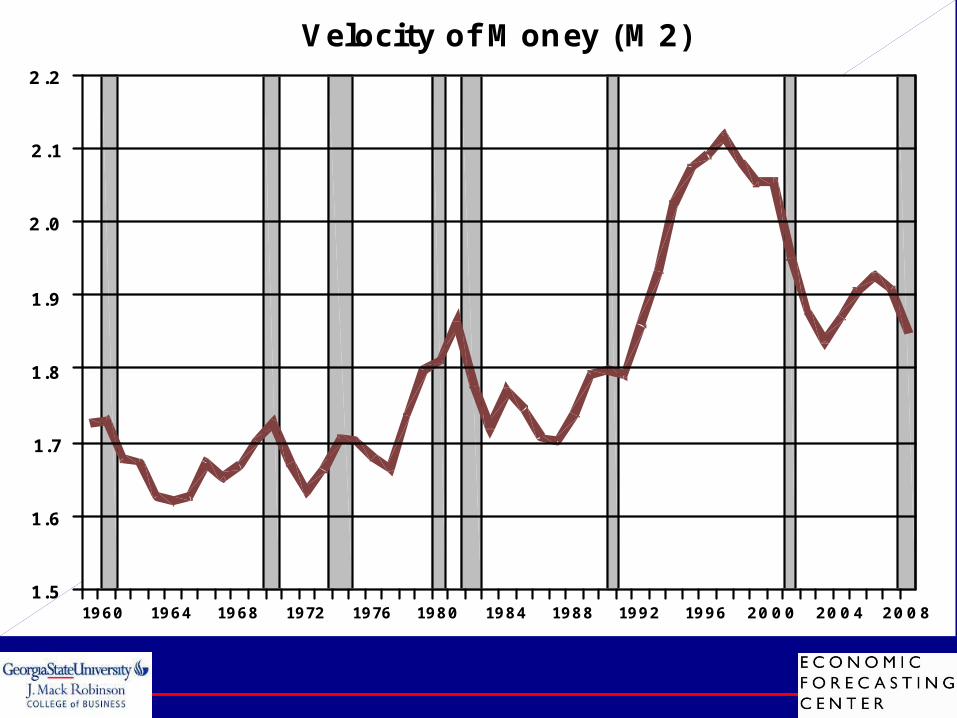
The Equilibrium Price Level, Inflation Rate, and the Quantity Theory of Money – The velocity of money is relatively stable over
time.– When the Fed changes the quantity of money, it
causes proportionate changes in the nominal value of output (P Y).
– Because money is neutral, money does not affect output.
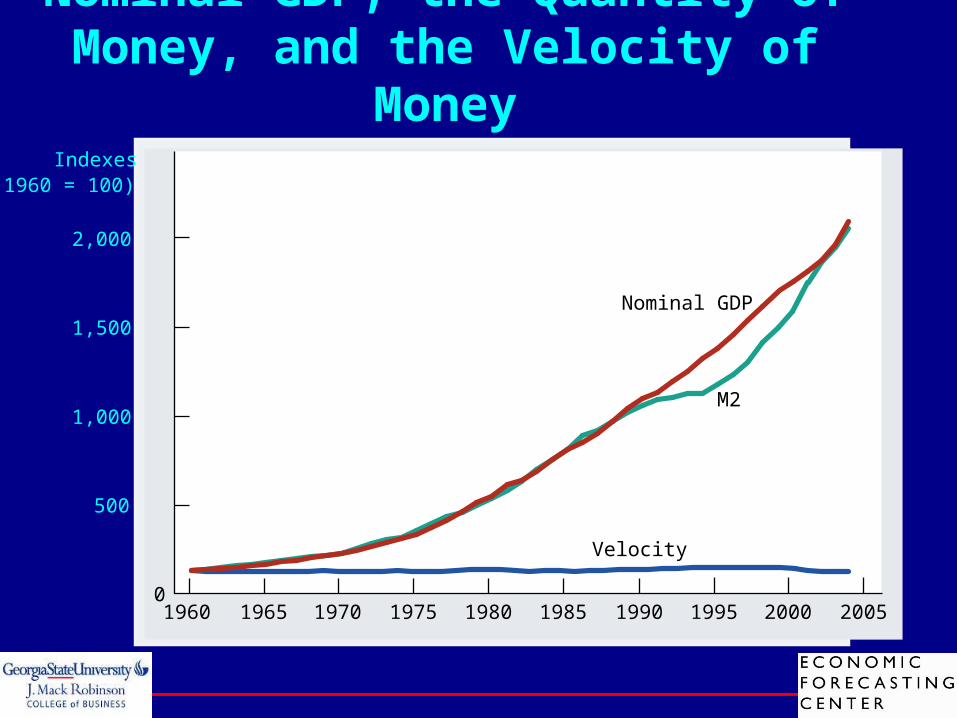
Nominal GDP, the Quantity of Money, and the Velocity of Money
Indexes(1960 = 100)
2,000
1,000
500
0
1,500
1960 1965 1970 1975 1980 1985 1990 1995 2000 2005
Velocity
M2
Nominal GDP
2008200420001996199219881984198019761972196819641960
2.2
2.1
2.0
1.9
1.8
1.7
1.6
1.5
Velocity of Money (M2)

The Inflation Tax
When the government raises revenue by printing money, it is said to levy an inflation tax.
An inflation tax is like a tax on everyone who holds money.
The Fisher effect refers to a one-to-one adjustment of the nominal interest rate to the inflation rate.
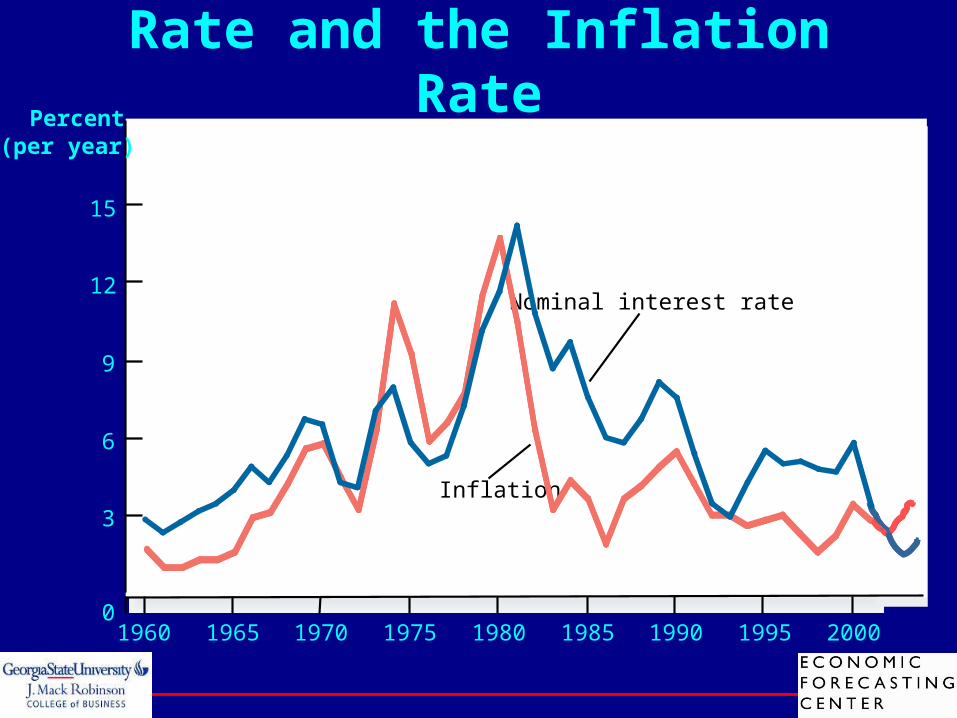
The Nominal Interest Rate and the Inflation Rate
Percent(per year)
1960 1965 1970 1975 1980 1985 1990 1995 20000
3
6
9
12
15
Inflation
Nominal interest rate
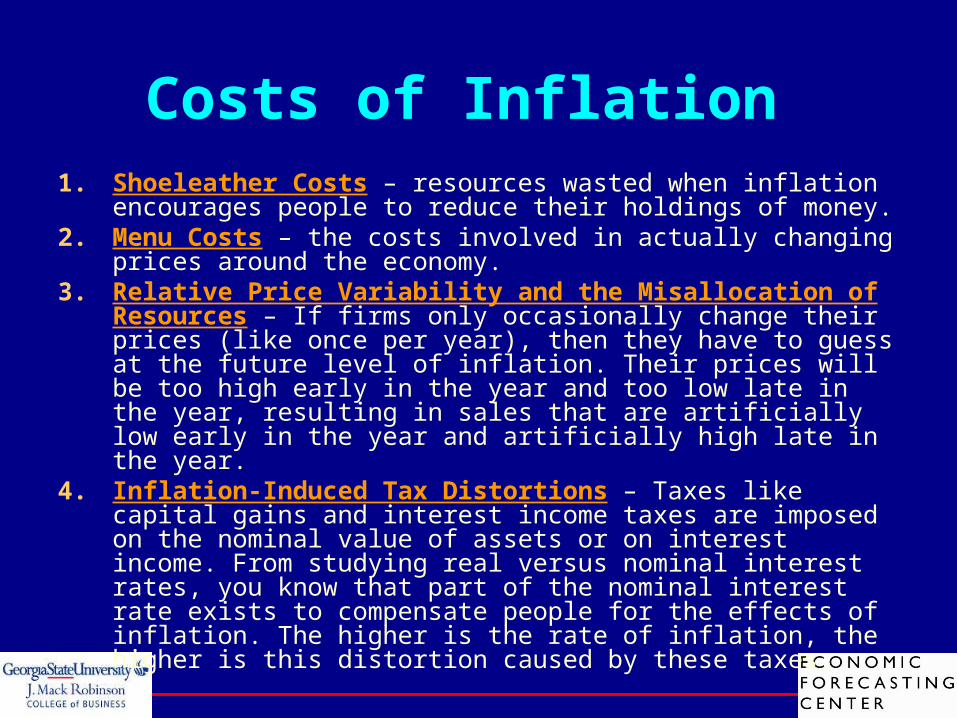
Costs of Inflation 1. Shoeleather Costs – resources wasted when inflation encourages
people to reduce their holdings of money. 2. Menu Costs – the costs involved in actually changing prices
around the economy. 3. Relative Price Variability and the Misallocation of Resources
– If firms only occasionally change their prices (like once per year), then they have to guess at the future level of inflation. Their prices will be too high early in the year and too low late in the year, resulting in sales that are artificially low early in the year and artificially high late in the year.
4. Inflation-Induced Tax Distortions – Taxes like capital gains and interest income taxes are imposed on the nominal value of assets or on interest income. From studying real versus nominal interest rates, you know that part of the nominal interest rate exists to compensate people for the effects of inflation. The higher is the rate of inflation, the higher is this distortion caused by these taxes.

Continued..
5. Confusion and Inconvenience – Money, being the economy's unit of account, is used to quote prices for goods and services throughout the economy. Confusion and inconvenience arise as a cost of inflation because inflation makes valuing dollars over time difficult. Many important items in the economy are measured over time (like the value of a firm, for instance), and inflation creates difficulties in the valuation of assets or debts that occur over time.
6. Arbitrary Redistributions of Wealth – "Inflation is good for borrowers and bad for lenders" is a common phrase that rings out in economics principles courses. Here's a personal example for you to consider (and a personal example for your website author as well). When you graduate from college, you will likely owe money on student loans that you took out during your college years. Between the time you borrowed the money and the time when you repay the loan, you will be better off if inflation is high.