Lecture 3 30-09-2008 Lecture: –simple mixtures (cont) –colligative properties –membrane...
52
Lecture 3 30-09-2008 • Lecture: – simple mixtures (cont) – colligative properties – membrane potential – Debye-Hückel limiting law – two-component phase diagrams – new problems • Last lecture problems
-
Upload
anastasia-hudson -
Category
Documents
-
view
291 -
download
6
Transcript of Lecture 3 30-09-2008 Lecture: –simple mixtures (cont) –colligative properties –membrane...

Lecture 330-09-2008
• Lecture:– simple mixtures (cont)– colligative properties– membrane potential– Debye-Hückel limiting law– two-component phase diagrams– new problems
• Last lecture problems

Chemical potential of liquid• Ideal solutionsLet’s consider vapour (treated as perfect gas) above the solution. At equilibrium the chemical potential of a substance in vapour phase must be equal to its potential in the liquid phase
* 0 *lnA A ART p For pure substance:
0 lnA A ART p In solution:
* ln AA A
pRT
p
Raoult’s law: *A A Ap x p
Mixtures obeying Raoult’s law called ideal solutions
Francouis Raoult experimentally found that:
* lnA A ART x

Chemical potential of liquid
' A Ak p kx
rate of condensation
rate of evaporation
• Molecular interpretation of Raoult’s law
*
' and in case of pure liquid ( 1):
'
A A
A
A
kp x
kx
kp
k

Chemical potential of liquid
Similar liquidDissimilar liquid often show strong deviation

Chemical potential of liquid• Ideal-dilute solutions: Henry’s law
A A Ap x K
empirical constant
In a dilute solution the molecule of solvent are in an environment similar to a pure liquid while molecules of solute are not!

Chemical potential of liquid• Using Henry’s law
A A Ap x K
Example: Estimate molar solubility of oxygen in water at 25 0C at a partial pressure of 21 kPa.
4 -14 -1
21kPa2.9 10 mol kg
7.9 10 kPa kg molA
AA
px
K
molality
22 H O[O ] 0.29Ax mM

Liquid mixtures
• Ideal solutions( ln ln )mix A A B BG nRT p p
( ln ln )
( ln ln )
0
mix A A B B
mix A A B B
mix mix mix
G nRT x x x x
S nR x x x x
H G T S
If Raoult’s law applied to
we have:
From molecular prospective it means that interactions of A-A, A-B, and B-B are the same.

Liquid mixturesIn real solutions we can define excess functions, e.g. excess entropy:
E Idealmix mix mixS S S
Model: regular solution 0 0E ES H
suppose: E
A BH n RT
Benzene/Cyclohexane
( ln ln )mix A A B B A BG nRT Then:
Molecules are randomly distributed but A-B interaction is different from A-A and B-B

Colligative properties
• Elevation of boiling point• Depression of freezing point• Osmotic pressure phenomenon
All stem from lowering of the chemical potential of the solvent due to presence of solute (even in ideal solution!)
Larger

Colligative properties• Elevation of boiling point
* *( ) ( ) lnA A Ag l RT
**( ) ( )ln(1 ) vapA A
B
Gl g
RT RT
vap vap vapG H T S
For pure liquid:*
ln1 vap vapH S
RT R
(Here we neglect temperature dependence)
* *2
1 1( )vap vap
B
H H T
R T T R T
* *
1 1ln(1 ) ( )vap
B
H
RT T T
*2
Bvap
RTT
H

Colligative properties• Depression of freezing point
* *( ) ( ) lnA A As l RT
*2
Bvap
RTT
H
f BT K
Cryoscopic constant
Can be used to measure molar mass of a solute

Colligative properties• Solubility
* *( ) ( ) lnB B Bs l RT
**( ) ( )ln fusB B
B
Gs l
RT RT
fus fus fusG H T S
*
1 1ln ( )fus
B
H
R T T
*( ) * 0fus fus fusG T H T S

Colligative properties: Osmosis• Osmosis – spontaneous passage of pure solvent into solution
separated by semipermeable membrane
Van’t Hoff equation: [ ] , [ ] /BB RT B n V

Osmosis
* *( ) ( ) lnA A Ap p RT
**( ) ( )p
A A m
p
p p V dp
For dilute solution: mRT V B
/B An n/ AV n
More generally: [ ] (1 [ ] ...)B RT b B Osmotic virial coefficients
Van’t Hoff equation: [ ] , [ ] /BB RT B n V
dG SdT Vdp

Osmosis: Examples
• Calculate osmotic pressure exhibited by 0.1M solutions of
mannitol and NaCl.
Mannitol (C6H8(OH)6)[ ] , [ ] /BB RT B n V

Osmosis: Examples
Isotonic conditions
Hypotonic conditions: cells burst and dyehaemolysis (for blood)
Internal osmotic pressure keeps the cell “inflated”
Hypertonic conditions: cells dry and dye
Decreasing salt
concentratio
n
Increasing salt
concentration

Application of Osmosis• Using osmometry to determine molar mass of a macromolecule
Osmotic pressure is measured at a series of mass concentrations c and a plot ofvs. c is used to determine molar mass.
/ c
[ ] (1 [ ] ...)B RT b B
gh /c M
2...
h RT bRTc
c gM gM

Membrane potential
• Electrochemical potential
Fcyt
Fext0 ln[ ]j j j A j jz N e RT j z F
P-
P-
P-Na+
Na+ Na+
P-
P-
P-
Na+
Na+ Na+
0 0ln[ ] ln[ ]
[ ]ln
[ ]
in in out outNa Na Na Na
out
in
RT Na z F RT Na z F
NaRT
F Na
• Example: membrane potential
Na salt of a protein

Activities• the aim: to modify the equations to make them applicable to real solutions
* **
ln AA A
A
pRT
p
Generally: vapour pressure of A above solution
vapour pressure of A above pure A
* * lnA A ART
For ideal solution
(Raoult’s law)
For real solution
* * lnA A ART a activity of A
* * ln lnA A A ART RT
activity coefficient of A
as 1A A Aa

Activities• Ideal-dilute solution: Henry’s law B B Bp K
* * ** *
ln ln lnB BB B B B
B B
p KRT RT RT
p p
* 0 lnB B BRT 0
B
• Real solutes* 0 lnB B BRT a B
BB
pa
K

Example: Biological standard state
• Biological standard state: let’s define chemical potential of hydrogen at pH=70 ln
H H HRT a
0 07 ln(10) 40 /H H H
RT kJ mol

Activities
• Margules equation 2 2ln lnA B B A
( ln ln )mix A A B BG nRT a a
( ln ln ln ln )mix A A B B A A B BG nRT
( ln ln )mix A A B B A BG nRT EA BH n RT
*A A Ap e p
Henry’s law
Raoult’s law

Ion Activities
0 lnRT a
standard state: ideal solution at molality b0=1mol/kg
0
ba
b
0 ln ln lnidealRT b RT RT
ideal solution of the same molality b
Alternatively:
In ionic solution there is no experimental way to separate contribution of cations and anions
lnideal idealmG RT
ln ; lnideal idealRT RT
2
In case of compound MpXq: lnideal p qm mG p q G RT

Debye-Hückel limiting law
• Coulomb interaction is the main reason for departing from ideality
• Oppositely charged ions attract each other and will form shells (ionic atmosphere) screening each other charge
• The energy of the screened ion is lowered as a result of interaction with its atmosphere

Debye-Hückel limiting law
12
2 0
log , 0.509 for water
1where: ( / )
2 i ii
z z AI A
I z b b
Ionic strength of the solution
Example: calculate mean activity coefficient of 5 mM solution of KCL at 25C.
0 0 3
1 3 1/ 22
1( ) / / 5 10
2
log 0.509*(5 10 ) 0.036
0.92
I b b b b b
z z AI
In a limit of low concentration the activity coefficient can be calculated as:

Debye-Hückel limiting law
12log z z AI
12
12
log1
z z AI
BI
Extended D-H law:

Phase Diagrams

Phase diagrams
iron-carbon diagram
- what is the composition (number of phases and their amount and composition) at equilibrium at a given temperature;- what happens to the system when is cools down/heats up- we can predict the structure and the properties of the system at low temperature.

Phase diagrams
iron-carbon diagram
That’s the base of all modern engineering from swiss knife to food and cosmetics!
water-surfactant-oil

Phase diagrams• Constituent – a chemical species that is present• Component – a chemically independent constituent of the system (i.e.
not connected by a chemical reaction)
variance
number of components
number of phases
Indeed: number of variables would be: P*(C-1)+2number of equations: C*(P-1)
• Variance – the number of intensive variables that can be changed independently without disturbing the number of phases at equilibrium.
• Phase rule (J.W. Gibbs):F=C-P+2
3 2( ) ( ) ( )CaCO s CaO s CO g Phase1 Phase2 Phase3
2C

One component diagramsC=1 therefore F=C-P+2=3-P

One component diagramsDetection of phase transitions and building a phase diagram is based on calorimetry measurements

Two-components diagramsC=2 therefore F=4-P. We have to reduce degree of freedom e.g. by fixing T=const
• Vapour pressure diagrams
* *A A A B B Bp x p p x p
Raoult’s Law
* * *( )A B B A A Bp p p p x p p

Two-components diagrams
• The composition of vapour
From Dalton’s law: ;
*; *
A BA B
A A A B B B
p py y
p p
p x p p x p
From Raoult’s law:
*; 1
* ( * *)A
A B AB A B A
py y y
p p p x
*
*A
B
p
p

Two components diagrams

Two components diagrams

Two components diagramsThe lever rule
n l n l

Two-components diagramsTemperature-composition diagrams
• Distillation of mixtures

Two-components diagramsTemperature-composition diagrams
•Azeotropes
A-B interacation stabilize the mixture
Azeotrope, evaporation w/o change in composition
n l
A-B interacation destabilize the mixture

Two components diagrams
• Immiscible liquids
Will boil at lower temperature!
A Bp p p

Two components diagrams
• Liquid-liquid phase diagrams

Two components diagrams
Upper critical solution T
( ln ln )mix A A B B A BG nRT
0 ln (1 2 ) 01mixG

Two components diagrams
Lower critical temperature is usually caused by breaking a weak complex of two components

Two components diagrams
Upper critical temperature is less than the boiling point
Boiling occur before liquids are fully miscible

Liquid-solid phase diagrams
Eutectic composition

Liquid-solid phase diagrams
Eutectic halt

Liquid-solid phase diagrams• Reacting systems
Incongruent melting: compounds melts into components

Liquid crystals• Mesophase – an intermedediate phase between
solid and liquid. Example: liquid crystal• Liquid crystal – substance having a liquid-like
imperfect order in at least one direction and long-range positional or orientational order in at least one another direction
NematicNematic
SmecticSmectic
CholestericCholesteric
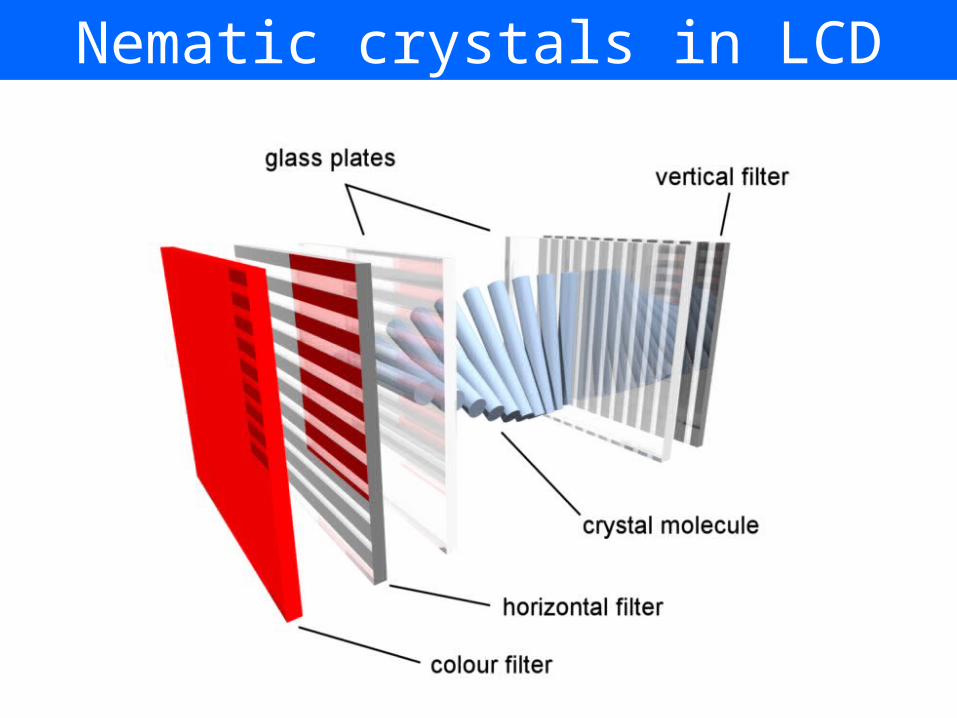
Nematic crystals in LCD

Problems I
• 5.6a The addition of 100 g of a compound to 750 g of CCl4 lowered the freezing point of the solvent by 10.5 K. Calculate the molar mass of the compound.
• 5.14a The osmotic pressure of solution of polystyrene in toluene were measured at 25 C and the pressure was expressed in terms of the height of the solvent of density 1.004g/cm3. Calculate the molar mass of polystyrene:c [g/dm3] 2.042 6.613 9.521 12.602 h [cm] 0.592 1.910 2.750 3.600
• 5.20(a) Estimate the mean ionic activity coefficient and activity of a solution that is 0.010 mol kg–1 CaCl2(aq) and 0.030 mol kg–1 NaF(aq).
Problems II
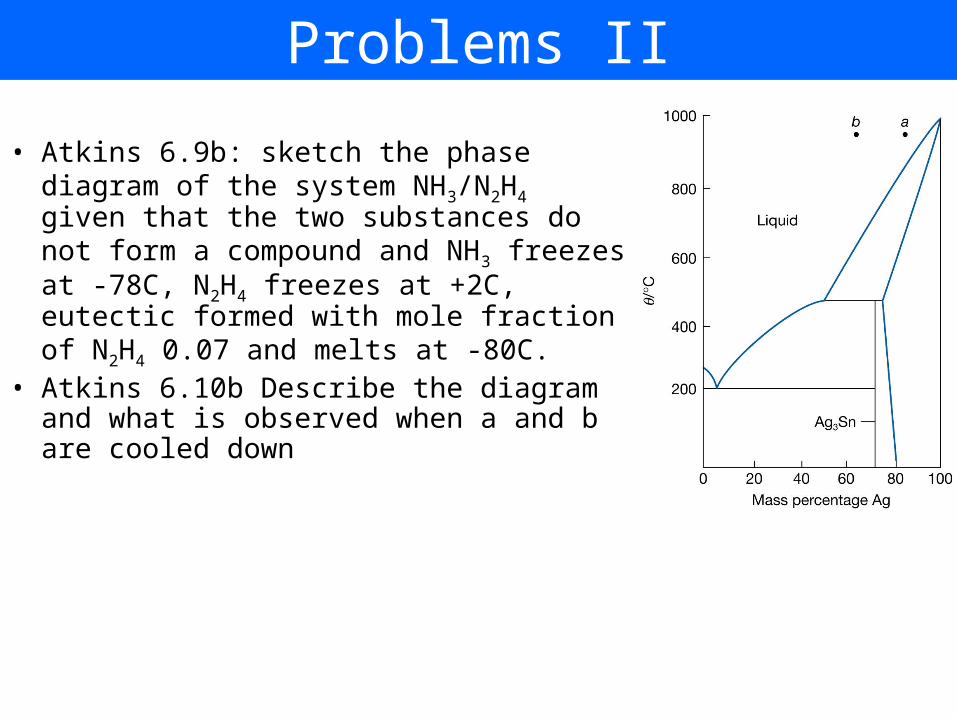
• Atkins 6.9b: sketch the phase diagram of the system NH3/N2H4 given that the two substances do not form a compound and NH3 freezes at -78C, N2H4 freezes at +2C, eutectic formed with mole fraction of N2H4 0.07 and melts at -80C.
• Atkins 6.10b Describe the diagram and what is observed when a and b are cooled down

Home problem analysis
• 4.7a: An open vessel containing (a) water, (b) benzene, (c) mercury stands in a laboratory measuring 5.0 m 5.0 m 3.0 m at 25C. What mass of each substance will be found in the air if there is no ventilation? (The vapour pressures are (a) 3.2 kPa, (b) 13.1 kPa, (c) 0.23 Pa.)
• 4.9a Calculate the melting point of ice under a pressure of 50 bar. Assume that the density of ice under these conditions is approximately 0.92 g cm–3 and that of liquid water is 1.00 g cm–3.
• 5.2a At 25C, the density of a 50 per cent by mass ethanol–water solution is 0.914 g cm–3. Given that the partial molar volume of water in the solution is 17.4 cm3 mol–1, calculate the partial molar volume of the ethanol.