
Lecture 24 - Process Analysis with LCA and TEA Notes
18
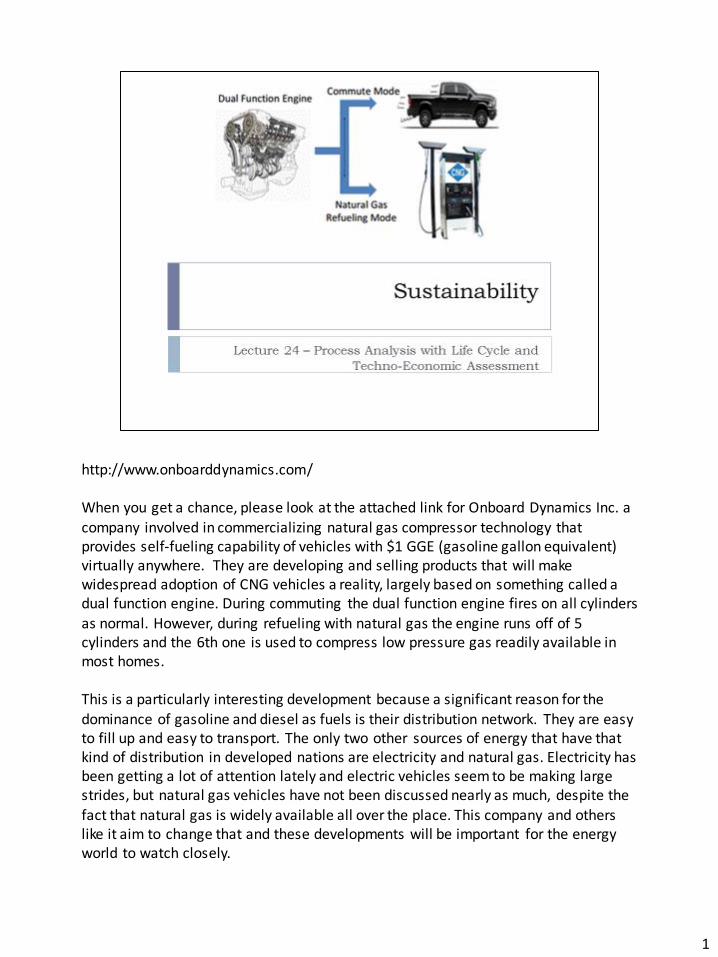
http://www.onboarddynamics.com/ When you get a chance, please look at the attached link for Onboard Dynamics Inc. a company involved in commercializing natural gas compressor technology that provides self-fueling capability of vehicles with $1 GGE (gasoline gallon equivalent) virtually anywhere. They are developing and selling products that will make widespread adoption of CNG vehicles a reality, largely based on something called a dual function engine. During commuting the dual function engine fires on all cylinders as normal. However, during refueling with natural gas the engine runs off of 5 cylinders and the 6th one is used to compress low pressure gas readily available in most homes. This is a particularly interesting development because a significant reason for the dominance of gasoline and diesel as fuels is their distribution network. They are easy to fill up and easy to transport. The only two other sources of energy that have that kind of distribution in developed nations are electricity and natural gas. Electricity has been getting a lot of attention lately and electric vehicles seem to be making large strides, but natural gas vehicles have not been discussed nearly as much, despite the fact that natural gas is widely available all over the place. This company and others like it aim to change that and these developments will be important for the energy world to watch closely. 1
Transcript of Lecture 24 - Process Analysis with LCA and TEA Notes
http://www.onboarddynamics.com/
When you get a chance, please look at the attached link for Onboard Dynamics Inc. a
company involved in commercializing natural gas compressor technology that provides self-fueling capability of vehicles with $1 GGE (gasoline gallon equivalent) virtually anywhere. They are developing and selling products that will make widespread adoption of CNG vehicles a reality, largely based on something called a dual function engine. During commuting the dual function engine fires on all cylinders
as normal. However, during refueling with natural gas the engine runs off of 5 cylinders and the 6th one is used to compress low pressure gas readily available in most homes.
This is a particularly interesting development because a significant reason for the
dominance of gasoline and diesel as fuels is their distribution network. They are easy to fill up and easy to transport. The only two other sources of energy that have that kind of distribution in developed nations are electricity and natural gas. Electricity has been getting a lot of attention lately and electric vehicles seem to be making large strides, but natural gas vehicles have not been discussed nearly as much, despite the
fact that natural gas is widely available all over the place. This company and others like it aim to change that and these developments will be important for the energy world to watch closely.
1
2
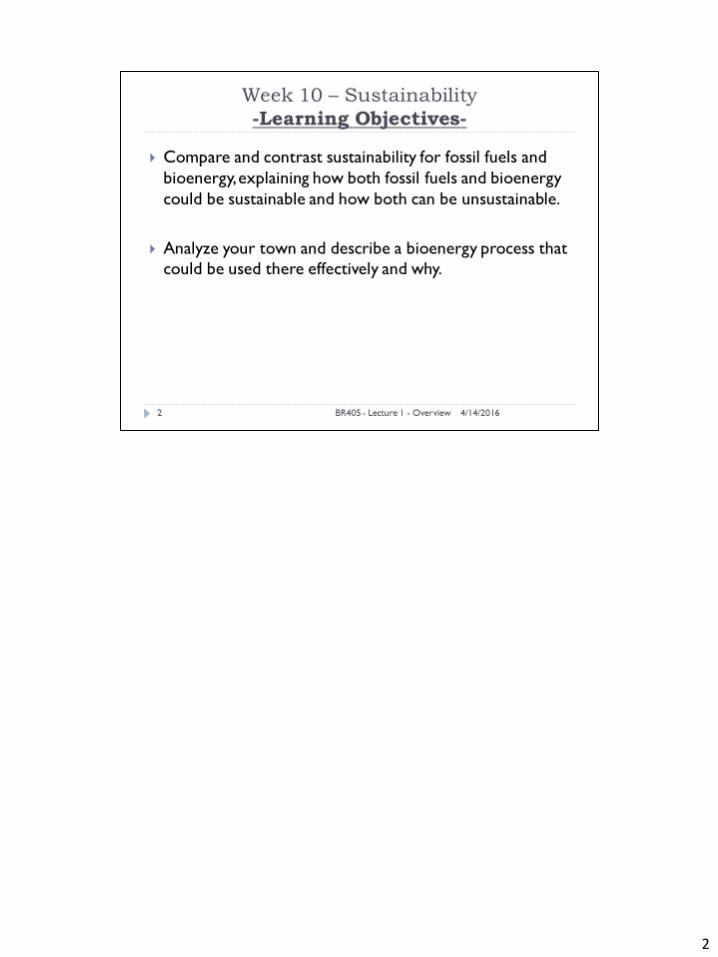
http://www.gcbl.org/system/files/sustainability-venn-sm.jpg
The triple bottom line incorporates the notion of sustainability into business
decisions. It is an accounting framework with three dimensions: social, environmental and financial. The dimensions are also commonly called the three Ps: people, planet and profit and are referred to as the "three pillars of sustainability". Interest in triple bottom line accounting has been growing in both for-profit, nonprofit and government sectors. Many organizations have adopted this framework to evaluate
their performance in a broader context.
3
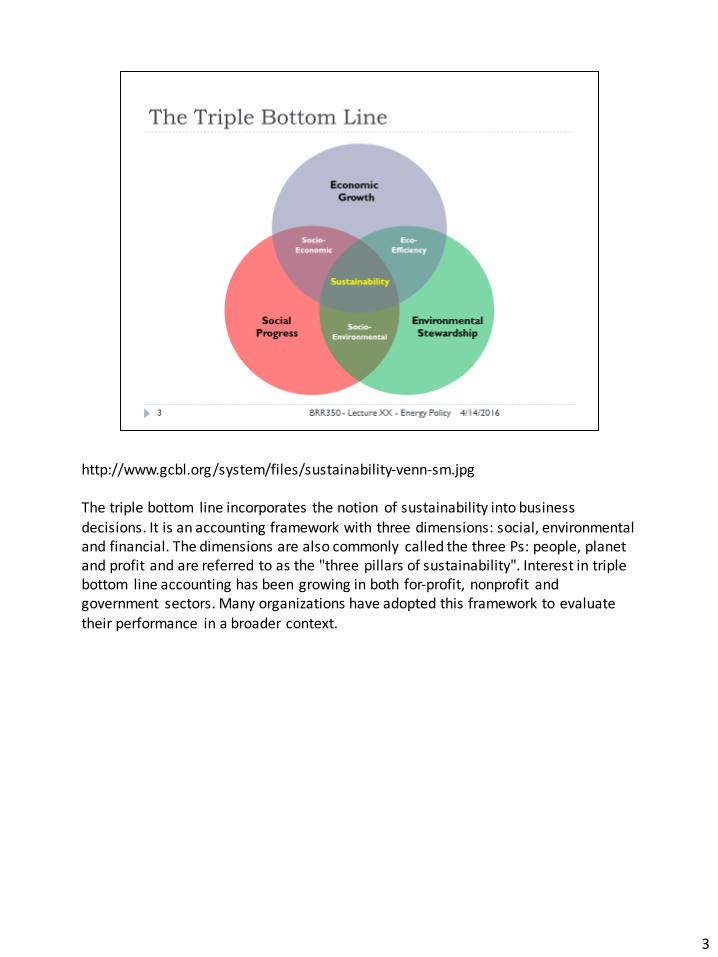
http://eplca.jrc.ec.europa.eu/
Life cycle assessment is somewhat about mass and energy. The technique works to
map the sources and destinations of all the mass and energy used to make a given product or as part of a process. By mass we mean the carbon, nitrogen, phosphorous, metals, etc. that the thing might be made of. By energy we mean the fuels and electricity that were necessary for the thing to go through its process. We know all of this technically can be used as a metric to determine how intensive or sustainable
the process is.
A cradle-to-grave approach for assessing industrial systems evaluates all stages of a product’s life from the perspective that they are interdependent, meaning that one operation leads to the next. It also provides a comprehensive view of the
environmental aspects of the product or process, and a more accurate picture of the true environmental trade-offs in product and process selection.
4
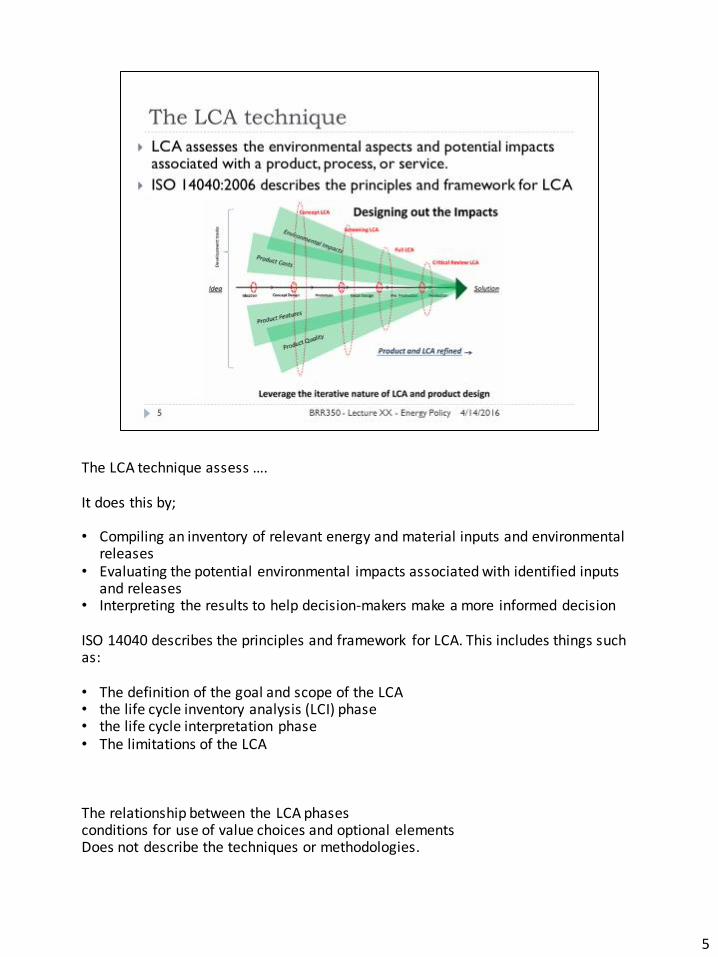
The LCA technique assess ….
It does this by;
• Compiling an inventory of relevant energy and material inputs and environmental releases
• Evaluating the potential environmental impacts associated with identified inputs and releases
• Interpreting the results to help decision-makers make a more informed decision
ISO 14040 describes the principles and framework for LCA. This includes things such as:
• The definition of the goal and scope of the LCA• the life cycle inventory analysis (LCI) phase• the life cycle interpretation phase• The limitations of the LCA
The relationship between the LCA phasesconditions for use of value choices and optional elementsDoes not describe the techniques or methodologies.
5

These are the components of the LCA approach.
Goal Definition and Scoping;
Define and describe the product, process or activity. Establish the context in which the assessment is to be made and identify the boundaries and environmental effects to be reviewed for the assessment.
Inventory Analysis;
Identify and quantify energy, water and materials usage and environmental releases (e.g., air emissions, solid waste disposal, waste water discharges).
Impact Assessment;Assess the potential human and ecological effects of energy, water and material
usage and the environmental releases identified in the inventory analysis.
Interpretation;Evaluate the results of the inventory analysis and impact assessment to select the preferred product, process or service with a clear understanding of the uncertainty
and the assumptions used to generate the results.
6

If you want to try a hands-on approach to learning about LCA, the GREET model is a great place to start.
GREET is an LCA model developed by the DOE and Argonne National Lab. The model has two integrated components. One is the well-to-pump fuel cycle analysis and another is the well-to-wheel vehicle cycle analysis. Argonne National Lab has developed a simulation tool for quantitative analysis of energy and emissions using the GREET model, and the model has been applied to a wide variety of transportation
fuel scenarios. It can be used for models for life-cycle assessment of transportation fuel systems, for consumption of total energy and fossil fuels and for emissions of pollutants.
7

Performing an LCA can be resource and time intensive. There is often limited data availability and data quality and furthermore LCA is only one component in decision making since cost and technical feasibility must also be determined.
Though LCA can identify potential environmental tradeoffs, converting the impact results to a single score for decision making requires value judgments. There is also a constant challenge in deciding boundaries and where to draw the box around the process. The model is only as good as its design, and the design is related to what’s
going into the model. This creates a challenge because rarely are two model exactly the same due to situations rarely ebbing exactly the same, so comparing models to one another is usually not a fair assessment. If one model could be used for everything this would be great, but that is not particularly reasonable, so it can be difficult to figure out how to use LCA data.
8

The major purpose of techno-economic analysis is to evaluate whether a process is economically feasible. We need a quantitative analysis to assess whether the process is economically reasonable or, in simpler terms, makes money. In order to do this, we need to establish a theoretical configuration of the process and estimate the costs associated with the process. With the cost estimate and some economic assumptions, we will be able to determine the value of the product, whether it is biodiesel, bioethanol, biogas, etc.
Techno-economic analysis is also important as a tool that we could use it to determine how we are going to build a plant. The variations in the plant design will likely affect the profitability of the process, and the fluctuations in the market (such as up-an-downs in feedstock price) will also impact the product value. Techno-economic analysis can get us prepared, by letting us know these impacts before building and operating the plant.
It is a multi-step methodology because you must develop the basic theoretical configuration or (“models”) and then you must determine the cost estimate for investment and capital cost.
It can be used for determination of product value such as net present value (NPV) or discounted cash flow rate of return.
It is often used for interpretation by supporting comparisons among scenarios and sensitivity analysis.
9
The costs associated with a biorefinery plant are very dynamic and have a lot of components. To build a plant, the equipment needs to be purchased and installed. The costs for equipment installation typically scale with the costs for equipment
purchase, so we usually use scaling factors for the estimates. There are also some other types of indirect costs that must be considered, such as engineering, construction, legal and contractors fees that will be incurred when the plant is built. These costs can be estimated parametrically using differences in scale based on the size and the type of the plant. In addition often 20% of the total direct and indirect
costs are added to the estimate for contingency, risk management and uncertainty purposes.
10
In addition to building the plant, operating the plant to make products also costs money. Such costs include direct production costs which accompany the production, as well as fixed costs that are more closely associated with the plant itself. The plant
overhead costs include the routine services, shipping, warehouse management and so on.
After the products are made, selling them will incur more costs. Expenses in marketing and R&D typically fall into this category. Gross-earnings expenses are
basically income taxes that are associated with the earnings.
When you are trying to figure out what the product must cost in order for the business to make money, you must include the cost of operating the facility and the cost of selling the product.
11
This may be a little confusing, it will offer important context for what we have been discussing.
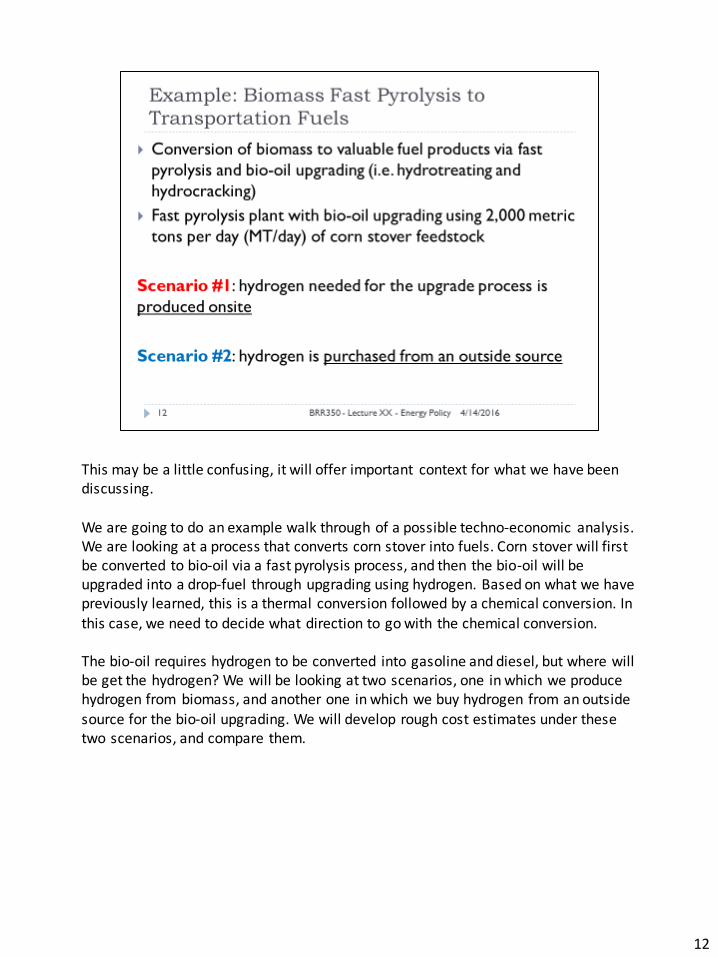
We are going to do an example walk through of a possible techno-economic analysis. We are looking at a process that converts corn stover into fuels. Corn stover will first be converted to bio-oil via a fast pyrolysis process, and then the bio-oil will be upgraded into a drop-fuel through upgrading using hydrogen. Based on what we have previously learned, this is a thermal conversion followed by a chemical conversion. In
this case, we need to decide what direction to go with the chemical conversion.
The bio-oil requires hydrogen to be converted into gasoline and diesel, but where will be get the hydrogen? We will be looking at two scenarios, one in which we produce hydrogen from biomass, and another one in which we buy hydrogen from an outside
source for the bio-oil upgrading. We will develop rough cost estimates under these two scenarios, and compare them.
12
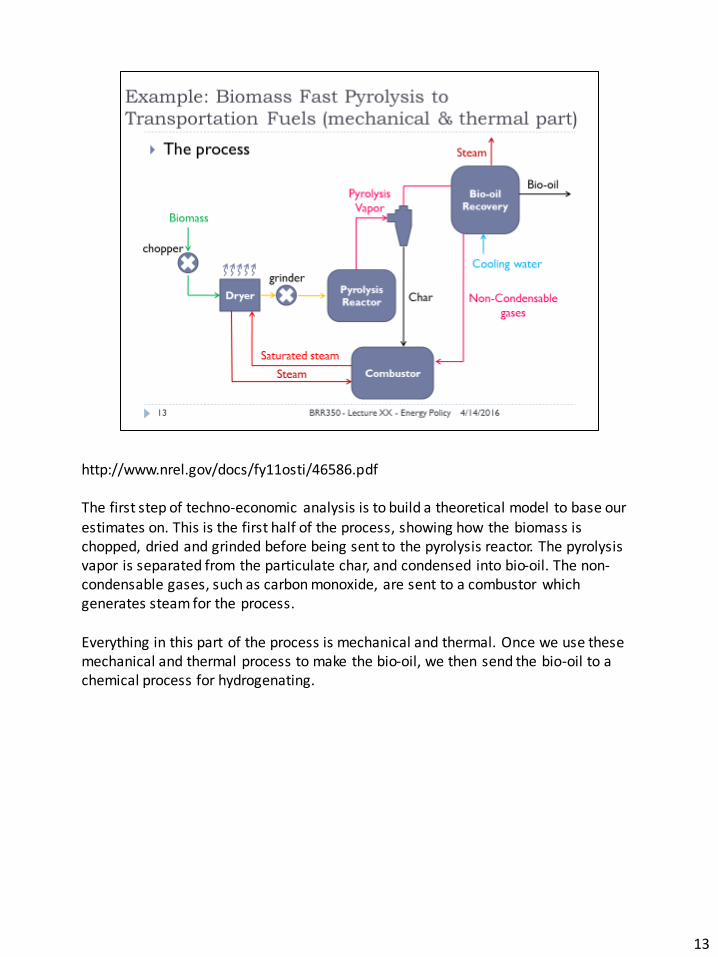
http://www.nrel.gov/docs/fy11osti/46586.pdf
The first step of techno-economic analysis is to build a theoretical model to base our
estimates on. This is the first half of the process, showing how the biomass is chopped, dried and grinded before being sent to the pyrolysis reactor. The pyrolysis vapor is separated from the particulate char, and condensed into bio-oil. The non-condensable gases, such as carbon monoxide, are sent to a combustor which generates steam for the process.
Everything in this part of the process is mechanical and thermal. Once we use these mechanical and thermal process to make the bio-oil, we then send the bio-oil to a chemical process for hydrogenating.
13

http://www.nrel.gov/docs/fy11osti/46586.pdf
The second half of the process is the upgrade of the bio-oil into drop-in fuels. This
picture contains both scenarios.
Scenario One is shown inside the dashed lines. The units operations contained inside the dashed lines are used to produce hydrogen from some of the bio-oil for the upgrading of “other” bio-oil. This way the hydrogen needed for upgrading is produced
from the biomass.
Scenario Two would be this process without everything in the dashed lines. If we removed all the unit operations inside the dashed lines and just bought hydrogen from a gas vendor for the hydro treating/hydro cracking step we would be purchasing
the hydrogen from an outside source instead of making it ourselves.
You can see the challenge here. Do we pay for more unit operations so we can do it ourselves? Or, do we build less stuff and then just pay a higher price for the hydrogen? There is a big difference between being self sustaining and being
sustainable both in terms of life cycle and economics.
14

In TEA, after we set up the process model, we need to outline the specifics of the design and the assumptions that we will use for the cost estimate.
These specifics and assumptions are important because they determine the sizes and types of the equipment we need. For example, if we would like greater storage capacity for bio-oil and char, we will then need more storage and piping equipment. If we want to grind the biomass to smaller particle sizes prior to the pyrolysis, we then need to use more energy for the grinding or even use different types of size-reduction
equipment.
All of the unit operations shown in the blue boxes in the previous slides have to be considered like this. Sometimes there are hundreds of them in a big plant and each has to be worked through to develop a functional and realistic model.
15
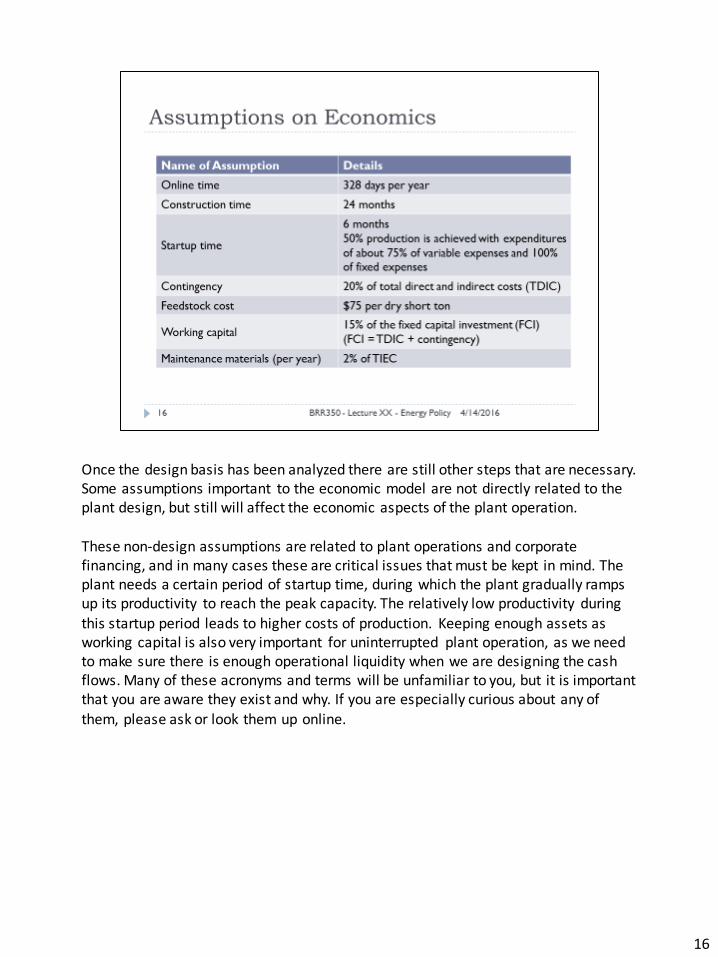
Once the design basis has been analyzed there are still other steps that are necessary. Some assumptions important to the economic model are not directly related to the plant design, but still will affect the economic aspects of the plant operation.
These non-design assumptions are related to plant operations and corporate financing, and in many cases these are critical issues that must be kept in mind. The plant needs a certain period of startup time, during which the plant gradually ramps up its productivity to reach the peak capacity. The relatively low productivity during
this startup period leads to higher costs of production. Keeping enough assets as working capital is also very important for uninterrupted plant operation, as we need to make sure there is enough operational liquidity when we are designing the cash flows. Many of these acronyms and terms will be unfamiliar to you, but it is important that you are aware they exist and why. If you are especially curious about any of
them, please ask or look them up online.
16

We are not going to work through all the finer details of the cost estimateand instead we will just look at the results. As we compare the two scenarios, using biomass-derived hydrogen or using purchased hydrogen, we can see a lot of differences.
As we discussed, producing hydrogen on-site requires all of those unit operations shown inside the dashed lines. This will result in a higher capital cost for the plant, but potentially a lower operating cost as no hydrogen gas vendor is needed. However, on-site hydrogen production will also use up some of the biomass bio-oil as feedstock, so we will take a hit on the fuel yield under the assumption that we have a fixed biomass supply.
As we can see, the capital cost for producing your own hydrogen from biomass is much higher than buying your hydrogen from the gas vendor. However, the operating cost of buying your hydrogen is somewhat higher than making it yourself. The true comparison comes when looking at the product value because they include all the capital and operating costs of both scenarios. Two things are apparent – first it costs a lot more to make fuels in scenario one than scenario two, making buying your hydrogen the better choice. Second, the pioneer plant values are far more dramatic for scenario one than scenario two, telling us that scenario one is potentially a lot more risky, but might have good upside if the cost of hydrogen changes a lot.
A pioneer plant is a first of its kind plant – when you build a type of chemicals plant that no one has ever built before, it is called a pioneer plant. In the field like bioenergy, the difference between a pioneer plant and a mature plant is often significant. There are certain risks associated with building a first-of-the-kind plant, because they have more problems than in a mature plant, and usuallywe don’t even know what kinds of problems we will run into.
Overall, it is important to understand that this TEA analysis suggests that buying hydrogen is a better idea than making it yourself, particularly if you will be the first company to ever build a plant like this.
17

http://eponline.com/articles/2014/02/27/epa-to-review-formulas-for-estimating-emissions-at-refineries-and-chemical-plants.aspx
When you have a chance please visit the attached link that discussed a new lawsuit against the EPA regarding emissions.
The lawsuit called for EPA to review the methodologies used to measure emissions of volatile organic compounds (VOCs) from liquid storage tanks, industrial flares, and
wastewater treatment systems. The federal Clean Air Act requires EPA to review, and if necessary revise these “emission factors” at least once every three years. Despite this requirement, the EPA has not reviewed some of these factors in over 20 years.
U.S. refineries reported releasing almost 38,000 tons of volatile compounds from
flares, tanks and wastewater treatment plants in 2010 alone. However, recent EPA studies have measured actual emissions of volatile and toxic compounds from U.S. refineries at levels 10 to 100 times higher than estimates based on the outdated emissions factors. EPA’s failure to revise these factors has resulted in significant underestimation of reported emissions from refineries and petrochemical plants,
allowing hundreds of thousands of tons of pollutants to go unreported each year and posing significant health risks by potentially exposing nearby communities to higher levels of pollution than the law allows.
18