Lecture 22
15
DWH-Ahsan Abdullah DWH-Ahsan Abdullah 1 Data Warehousing Data Warehousing Lecture-22 Lecture-22 DQM: Quantifying Data Quality DQM: Quantifying Data Quality Virtual University of Virtual University of Pakistan Pakistan Ahsan Abdullah Assoc. Prof. & Head Center for Agro-Informatics Research www.nu.edu.pk/cairindex.asp National University of Computers & Emerging Sciences, Islamabad Email: [email protected]
-
Upload
williamsock -
Category
Documents
-
view
1 -
download
0
description
Data Ware Housing
Transcript of Lecture 22

DWH-Ahsan AbdullahDWH-Ahsan Abdullah
11
Data Warehousing Data Warehousing Lecture-22Lecture-22
DQM: Quantifying Data Quality DQM: Quantifying Data Quality
Virtual University of PakistanVirtual University of Pakistan
Ahsan AbdullahAssoc. Prof. & Head
Center for Agro-Informatics Researchwww.nu.edu.pk/cairindex.asp
National University of Computers & Emerging Sciences, IslamabadEmail: [email protected]

22
BackgroundBackgroundCompanies want to measure the quality of their data that requires usable metrics.
Have to deal with both the subjective perceptions and objective measurements.
Subjective data quality assessments reflect the needs and experiences of stakeholders.
Objective assessments can be task-independent or task-dependent.
Task-independent metrics reflect states of the data without the contextual knowledge of the application.
Task dependent metrics, include organization’s business rules, regulations etc.
We will discuss objective assessment and validation techniques (dependent & independent), if time permits will briefly cover subjective assessment too.
Text will not go to graphics
33
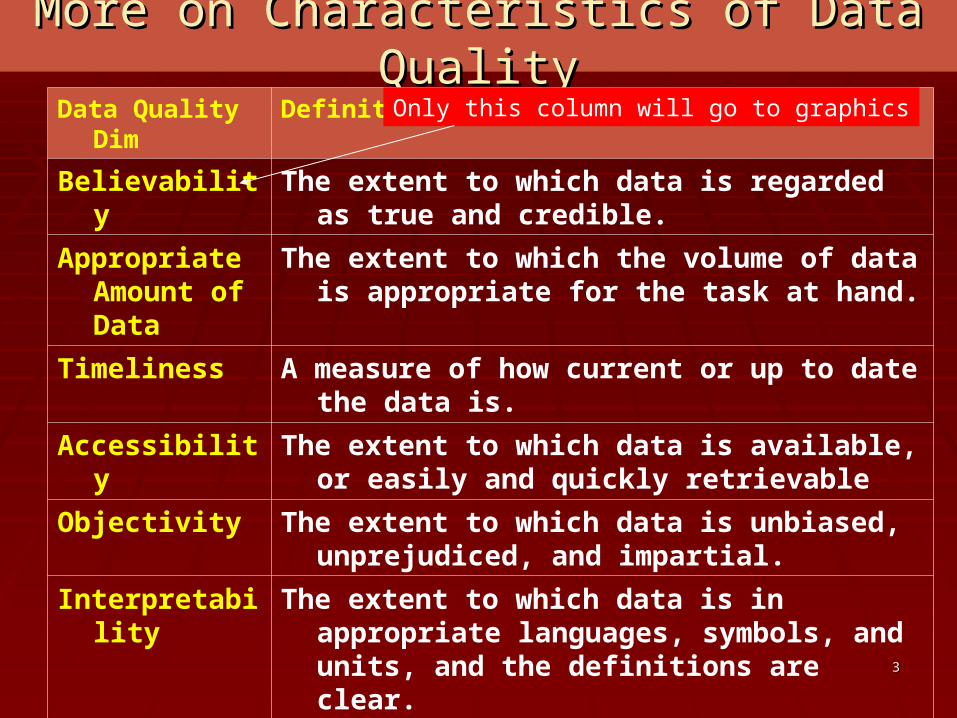
More on Characteristics of Data QualityMore on Characteristics of Data QualityData Quality Dim Definition
Believability The extent to which data is regarded as true and credible.
Appropriate Amount of Data
The extent to which the volume of data is appropriate for the task at hand.
Timeliness A measure of how current or up to date the data is.Accessibility The extent to which data is available, or easily and
quickly retrievableObjectivity The extent to which data is unbiased, unprejudiced,
and impartial.Interpretability The extent to which data is in appropriate languages,
symbols, and units, and the definitions are clear.Uniqueness The state of being only one of its kind or being
without an equal or parallel.
Only this column will go to graphics

44
Data Quality Assessment TechniquesData Quality Assessment Techniques
RatiosRatios
Min-MaxMin-Max

55
Simple RatiosSimple Ratios Free-of-ErrorFree-of-Error CompletenessCompleteness
SchemaSchema ColumnColumn PopulationPopulation
ConsistencyConsistencyRatio of violations to total number of consistency Ratio of violations to total number of consistency checks.checks.
Data Quality Assessment TechniquesData Quality Assessment Techniques
Sub-Sub-bullets will not go to graphics

66
Min-MaxMin-Max Used for multiple values, based on aggregation of normalized individual valuesUsed for multiple values, based on aggregation of normalized individual values Min is conservative, while max is liberalMin is conservative, while max is liberal
BelievabilityBelievability Comparison with a standard or experienceComparison with a standard or experience Min {0.8, 0.7, 0.6) = 0.6 Min {0.8, 0.7, 0.6) = 0.6 Weighted averageWeighted average
Appropriate Amount of DataAppropriate Amount of Data Min {Dp/Dn , Dn/Dp}Min {Dp/Dn , Dn/Dp}
Data Quality Assessment TechniquesData Quality Assessment Techniques
Dp: Data units providedDn: Data units needed
Sub-bullets and keys will not go to graphics

77
Min-MaxMin-Max
TimelinessTimeliness
Max {0, 1- C/V} C = A + Dt - It Max {0, 1- C/V} C = A + Dt - It
AccessibilityAccessibility
Max {0, 1- Trd/Tru}Max {0, 1- Trd/Tru}
Data Quality Assessment TechniquesData Quality Assessment Techniques
C: CurrencyV: VolatilityA: AgeDt: Delivery timeIt: Input time (received in system)
Trd: Time between request by user to delivery
Tru: Request by user to time data remains useful
Sub-bullets and keys will not go to graphics
88
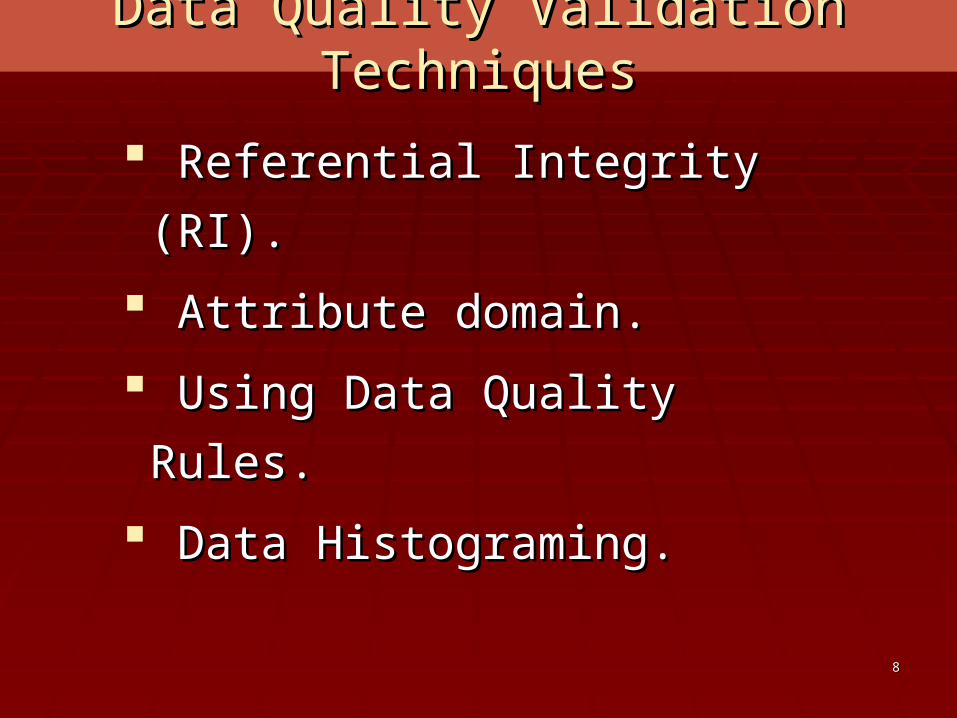
Data Quality Validation TechniquesData Quality Validation Techniques
Referential Integrity (RI).Referential Integrity (RI).
Attribute domain.Attribute domain.
Using Data Quality Rules.Using Data Quality Rules.
Data Histograming.Data Histograming.

99
Referential Integrity ValidationReferential Integrity Validation
Example: How many outstanding payments in the Example: How many outstanding payments in the DWH without a corresponding customer_ID in the DWH without a corresponding customer_ID in the customer table?customer table?
RI checked every week or month, and no. of orphan records should be going down with time.
RI peculiar to DWH, not for operational systemsYellow will not go to graphics

1010
Business Case for RIBusiness Case for RI
Not very interesting to know Not very interesting to know number of outstanding payments number of outstanding payments from a business point of view.from a business point of view.
Interesting to know the actual Interesting to know the actual amount outstanding, on per year amount outstanding, on per year basis, per region basis…basis, per region basis…

1111
Performance Case for RIPerformance Case for RI
Cost of enforcing RI is very high for large volume DWH Cost of enforcing RI is very high for large volume DWH implementations, therefore:implementations, therefore:
Should RI constraints be turned OFF in a data warehouse? orShould RI constraints be turned OFF in a data warehouse? or
Should those records be “discarded” that violate one or more Should those records be “discarded” that violate one or more RI constraints?RI constraints?

1212
3 steps of Attribute Domain Validation3 steps of Attribute Domain ValidationStep-1:Step-1: Capture and quantify Capture and quantify the occurrences of the occurrences of each domain value within each coded attribute of each domain value within each coded attribute of the database.the database.
Step-2:Step-2: Compare Compare actual content of attributes actual content of attributes against set of valid values.against set of valid values.
Step-3:Step-3: Investigate Investigate exceptions to determine exceptions to determine cause and impact of the data quality defects.cause and impact of the data quality defects.
Note: Step 3 (above) applies to all defect types.Note: Step 3 (above) applies to all defect types.
Yellow will go to graphics

1313
Attribute Domain Validation: What next?Attribute Domain Validation: What next?
What to do next?What to do next? Trace back to source cause(s).Trace back to source cause(s).
Quantify business impact of the defects.Quantify business impact of the defects.
Assess cost (and time frame) to fix and proceed Assess cost (and time frame) to fix and proceed accordingly.accordingly.

1414
Data Quality RulesData Quality Rules

1515
Statistical Validation using HistogramStatistical Validation using Histogram
1901 …………………………………………. 2000
Spike ofCenturions (age >= 100 yrs)
NOTE: For a certain environment, the above distribution may be perfectly normal.
outliers