Lecture 21 regression correlation - Laulima : Gateway : … · · 2017-01-27able to estimate y...
22
1 OF 22 Statistics 21_regression.pdf Michael Hallstone, Ph.D. [email protected] Lecture 21: Simple Linear Regression and Simple Correlation Some Common Sense Assumptions for Correlation and Regression: • Both variables are interval or ratio (and not nominal or ordinal). (Hint for exam: I don’t ask you whether or not you violate any assumptions on the regression part of the exam, but you will need to choose two interval or ratio level variables for this problem). • The data comes from a random sample. • There is a logical relationship between the two variables. (In almost all cases, we are looking for cause and effect relationship.) • There is a linear relationship between the two variables. • For those of you who are going on in statistics or are just very math oriented, there is a final assumption that is a bit difficult to understand. We assume that at each value of the independent variable the population of the dependent variable is normally distributed and these normal distributions have the same variance (homoscedastic condition.) Introduction Regression allows us to make “predictions” (the air quotes are on purpose – see below) and correlation allows us to measure association. In their simplest form, both regression and correlation look at two variables at a time. (Surprise, surprise but correlations and regressions that limit themselves to 2 variables are called “simple regression” and “simple correlation.”) Regression In simple regression we see how we can “predict” the outcome of one variable (usually called y) using another variable (x). The dependent variable (y) is the variable you wish to predict and you will predict it using the independent variable (x). Regression does prediction insofar as we are able to estimate y using x and to determine the percentage of variation in y that can be accounted for by x. For example, can we use the number of visitor arrivals here in HI “predict” hotel room occupancy rates? Furthermore, what percentage of the variation in hotel occupancy rates can be accounted for by changes in victor arrivals? Or can SAT scores “predict” college GPA? Can we use a SAT scores to “predict” college GPA? Furthermore, what percentage of the variation college GPA can be accounted for by changes in SAT scores? Correlation and association In correlation we see how closely the two variables under examination are associated. All “association” means is that changes in one variable are associated with changes in another. We
Transcript of Lecture 21 regression correlation - Laulima : Gateway : … · · 2017-01-27able to estimate y...

1 OF 22
Statistics 21_regression.pdf
Michael Hallstone, Ph.D. [email protected]
Lecture 21: Simple Linear Regression and Simple Correlation
Some Common Sense Assumptions for Correlation and Regression:
• Both variables are interval or ratio (and not nominal or ordinal). (Hint for exam: I don’t ask you whether or not you violate any assumptions on the regression part of the exam, but you will need to choose two interval or ratio level variables for this problem).
• The data comes from a random sample. • There is a logical relationship between the two variables. (In almost all cases, we are looking
for cause and effect relationship.) • There is a linear relationship between the two variables. • For those of you who are going on in statistics or are just very math oriented, there is a final
assumption that is a bit difficult to understand. We assume that at each value of the independent variable the population of the dependent variable is normally distributed and these normal distributions have the same variance (homoscedastic condition.)
Introduction
Regression allows us to make “predictions” (the air quotes are on purpose – see below) and correlation allows us to measure association. In their simplest form, both regression and correlation look at two variables at a time. (Surprise, surprise but correlations and regressions that limit themselves to 2 variables are called “simple regression” and “simple correlation.”) Regression
In simple regression we see how we can “predict” the outcome of one variable (usually called y) using another variable (x). The dependent variable (y) is the variable you wish to predict and you will predict it using the independent variable (x). Regression does prediction insofar as we are able to estimate y using x and to determine the percentage of variation in y that can be accounted for by x. For example, can we use the number of visitor arrivals here in HI “predict” hotel room occupancy rates? Furthermore, what percentage of the variation in hotel occupancy rates can be accounted for by changes in victor arrivals? Or can SAT scores “predict” college GPA? Can we use a SAT scores to “predict” college GPA? Furthermore, what percentage of the variation college GPA can be accounted for by changes in SAT scores? Correlation and association
In correlation we see how closely the two variables under examination are associated. All “association” means is that changes in one variable are associated with changes in another. We

2 OF 22
might expect that changes in the “ability to drive a car” is associated with the changes in the number of alcoholic drinks one consumes. We might expect changes in hotel occupancy rates to be associated with changes in the number of visitor arrivals. A change in one variable is associated with a change in another variable. We can use regression and correlations to see one variable (college GPA, hotel room occupancy, ability to drive a car, income, etc.) is associated or predicted by several variables at a time. Those sorts of tests are called “multiple” correlations and “multiple” regressions. As you might guess, the social world is very complex most social phenomenon are not caused or explained by single factors. I can’t think of a single social science question “Why do people do x?” that can be explained by a single factor. Why people use drugs, commit murder, are poor, spend money, visit Hawaii are all poorly explained by single factors or variables. However, we will limit ourselves to “simple” correlation and regression because that is the best way to be “introduced” to a theory. Logical Relationship?
The first step to any (simple) correlation or regression problem is to decide whether there is a logical relationship between the two variables. In this step, you are deciding whether or not it is actually appropriate to “do” a regression/correlation test for your two variables. If your two variables do not meet the following criteria there is no point in doing a regression/correlation test for your two variables. If your variables don’t meet the following theoretical criteria, you would stop right here and not do this statistical test! (That being said, in this class you will do a regression/correlation on the test just to get the points, even if it does not “make sense” to do this test!) Here you think about the theoretical relationship between your two variables as if you have not yet looked at your data! So discuss the theoretical relationship between your two variables pretending you had a large, random, representative sample from your population. All of these things will be described below, but in order for a simple regression or correlation test to be appropriate you must have:
• a logical relationship between the two variables • a direct cause and effect relationship between the two variables (not a common cause
relationship) • a straight linear relationship between the two variables -- not a curvilinear relationship. (More
sophisticated regression techniques can deal with curvilinear relationships – just not the one we are learning here.)
Logical vs. spurious relationships
Two variables may change together for many reasons, but if there is no logical relationship, then the association is spurious. For example for some weird reason there is an association between fruit sales and race riots. When fruit sales are up there tend to be more race riots than when fruit sales are down. (I could be wrong but here is my explanation: race riots tend to happen in the summer when fruit sales are high. Makes sense I suppose -- who wants to riot in the streets when the temperature outside is 20 degrees?) I found another great example of a spurious relationship on wikipedia:

3 OF 22
In neither of these examples could you say there is a cause and effect relationship. The two variables are associated – changes in one variable are associated with changes in the other variable – but there is not a direct cause and effect relationship. Remember: statistical association does lead to statistical correlation but correlation does not necessarily imply causation.
There are two types of causal relationships: cause-and-effect and common-cause. Cause-and-effect relationships exist when one variable causes another variable to change.
• For example a rise in the number of early drafts a student sends me in statistics is associated with getting higher grades on the take home tests. Since we catch mistakes and the student fixes them [before they lower their grade] their grade goes up. The number of drafts directly causes the test grade to go up.
• Here is an example from business. Stockbrokers and life insurance sales people start out their careers with no clients. They all start to build a client-base by “cold calling” people on the telephone. So stockbrokers who are beginning their careers might be told “don’t leave the office until you have made 100 cold-calls on the phone today.” Most people who are cold-called are not interested, but some are. So a sales person early in their career will see a cause and effect relationship between the number of cold calls they make and their income. The more cold-calls they make, the greater their income.
Common-cause relationships exist when two variables change together but neither “causes” the other – instead each are affected by “common-cause” factor that affects each variable in the same way.
• For example sitting in front of a class tends to be associated with high grades. That doesn’t mean that one can improve their grades by simply sitting in the front of a class. It is not cause and effect: merely sitting in the front of the class does not directly cause one’s grades to increase. There are other factors that influence both -- perhaps people in front are motivated and “want it” more than others and so they sit in the front so there are no distractions. The point is that there is a “common-cause” factor that influences both of these variables “behind the scenes” (if you will).
• Below I discuss the common cause relationship between age and income. In social sciences (and all sciences) we are most interested in cause and effect relationships. And for correlation and regression we are looking for cause and effect relationships. So on a test you may be asked to discuss the probability of a logical relationships between your two variables: you want to discuss
An example of a spurious relationship can be illuminated examining a city's ice cream sales. These sales are highest when the rate of drownings in city swimming pools is highest. To allege that ice cream sales cause drowning, or vice-versa, would be to imply a spurious relationship between the two. In reality, a heat wave may have caused both. The heat wave is an example of a hidden or unseen variable, also known as a confounding variable.” (http://en.wikipedia.org/wiki/Spurious_relationship)

4 OF 22
• whether or not it should be cause and effect (or common cause) or no logical relationship (discussed above)
• whether you expect the relationship to be positive or negative (discussed below) • whether or not it is linear in nature (discussed below)
If you have to do this on a take home exam [hint hint] be honest! I will not lower your grade if the two variables from your data set are not logically related, do not have a cause and effect relationship, and are have no linear relationship! I will lower your grade if you argue poorly and pretend that your variables are related in these ways when they really are not. For example, sometimes I make people collect data and use it on take home exams. All students will have at least two ratio level variables to use for this statistical test: age and income. If you think about it, the two variables are logically related. But age does not directly cause income to rise and it is not linear. Since some people might be tempted to cut and paste these words on an exam, I won’t explain exactly why, but think about it? Does age directly cause income to rise [and eventually fall]? No, but something associated with age does. So if you were to use these two variables on an exam, that would be fine but don’t pretend the relationship is cause and effect and linear when it probably is not. Your grade will be higher if you honestly explain why this is so! Linear Relationships
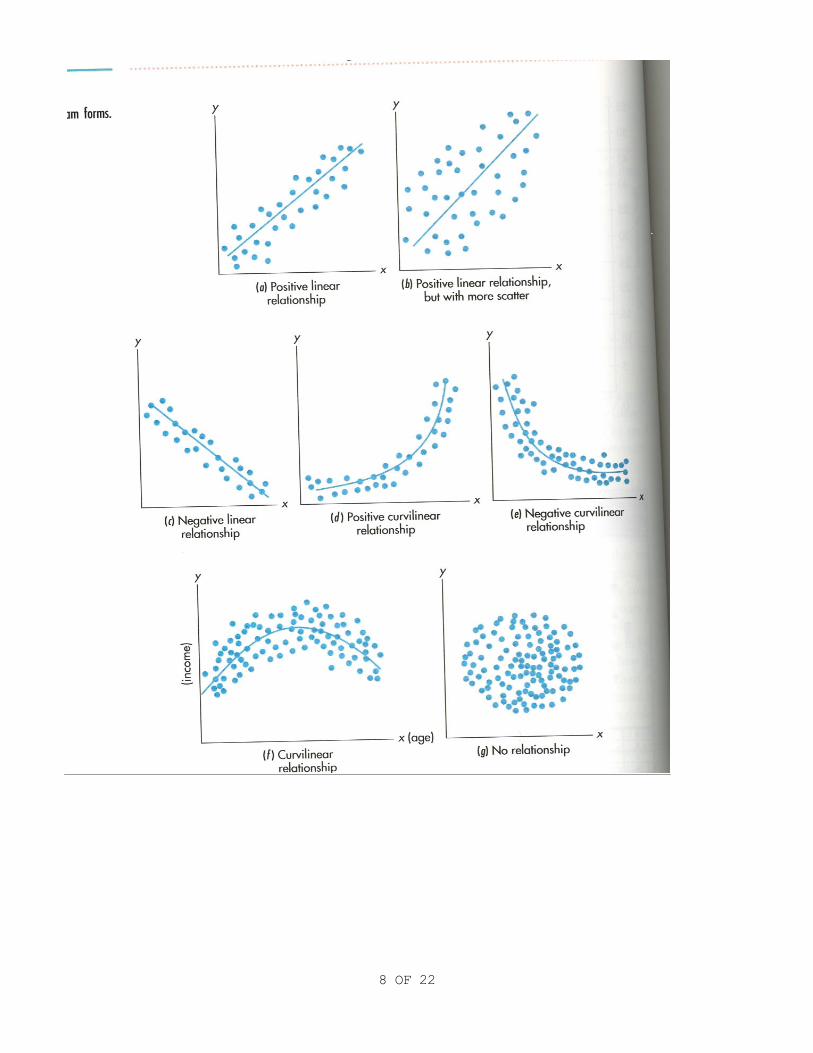
We are learning “simple linear regression/correlation” so what we are looking for in the scatter plot is evidence of a “linear” relationship. Generally, if you were to draw a circle around all the data points, the more it looks like an elongated ellipse and not a circle the “more linear” the relationship is. In the picture above, noticed how (a) (b) and (c) each show evidence of a linear relationship: the dots are scattered but they seems to resemble a line more or less. Notice how (g) shows no relationship whatsoever. The scatter plot above of Wave Height and Surfers in the Water show evidence of a linear relationship as well.
Positive and Negative relationships
X is the horizontal axis. Y is the vertical axis. Where the lines x and y meet [where the two lines would cross] each is equal to zero. As you move to the right on the x [or horizontal] axis x is getting bigger. As you move up on the y [or vertical] axis y is getting bigger.
Positive relationships
A positive relationship occurs when y increases as x increases. In the picture above (a) and (b) are positive relationships. See how the dots on the y axis get “higher” or larger as you move to the right on the x axis? Examples of positive relationships:
• wave height (x) and # of surfers in water at Waimea Bay (y). We will use this example below, but Waimea is one of the premiere big wave surf spots in the world, so one would expect more surfers in the water when the waves are big. Waimea is not a very good surf

5 OF 22
spot when the waves are smaller so one would expect fewer surfers in the water when the waves are smaller. So as the waves (x) get bigger we would expect more surfers in the water (y to get bigger along with x).
• hours study (x) and grade on exam (y). In general we would expect that the more hours you study for an exam (x) the higher your grade on that exam (y). So as x increases y increases along with it.
Negative relationships
A negative relationship occurs when y decreases as x increases. In the picture above (d) and (e) are examples of negative relationships. See how the dots on the y axis get “lower” or smaller as you move to the right on the x axis? Examples of negative relationships:
• number of years smoking (x) and life expectancy (y). In general we would expect that the more years a person smoked (x) the lower or shorter their life (y) would be.
• number of alcoholic drinks (x) and the ability to drive a car (y). As you ingest more alcohol (x) your ability to drive a car (y) goes down.
• hours gamble “games of chance” in a casino(x) and money in your possession (y). Games of chance are games like slots, roulette, and craps: unlike poker, these games are pure luck. Casinos are able to build roller coasters indoors and hotels that look like Venice Italy because of income created from games of chance. In general the more hours you gamble in a game of chance (x) the less money you will have in your possession (y).
Curvilinear relationships
Sometimes there are curvilinear relationships between two variables: see (d) (e) and (f) in the picture above.
Basic Curvilinear relationship
In curvilinear relationships we expect an increase to a certain extent but then a decrease after a while. This is seen in (f) in the picture above. Their example is prefect: age (x) and income (y). If you think about it your income is low until you get to about your 20-30’s and grows until retirement age and then starts to go down after retirement. Other examples:
• Think about the “childbearing years” of a woman: age (x) and children born (y). Children born starts to increase from puberty and is greatest in the late teens to early thirties and starts to drop off dramatically in the late 30’s to 40’s.
• Wave height (x) and surfers in the water at Waimea Bay (y) also probably resembles (f) in the picture above. We would expect the number of the surfers to slowly grow as the waves get bigger, but at a certain point the waves are so big that fewer and fewer people have the courage and skill to go surfing. At a certain point perhaps the waves get so large that no surfers enter the water. In fact, I was at Waimea Bay on Jan 28, 1998 when the waves were so big that they canceled the “Eddie” contest. The waves were so big that there were literally zero surfers in the water at Waimea Bay.
• Number of alcoholic drinks (x) and sociability (y). In small amounts alcohol makes people more social – that’s why they have cocktail parties. It acts as “social lubricant” but it does not

6 OF 22
mean that if you keep drinking you will get more and more pro-social. In fact if you keep drinking too much you will pass out and not be able to socialize at all!
• Number of caffeinated drinks (x) and concentration (y). In small amounts caffeine makes people concentrate better – that’s why people drink it at work or to start their day. But it does not mean that if you keep drinking coffee you will concentrate better and better. In fact if you keep drinking too much coffee your concentration starts to falter – have you ever had too much coffee and “tweaked out?”
Negative and positive curvilinear relationships
These are known as “exponential” relationships and I cannot for the life of me think of any examples of (d) and (e) from the picture below, but you may see this in a scatter plot of your two variables.
Draw a scatter plot to look for linear relationship.
Drawing a scatter plot is as simple as placing your variables in pairs and plotting them on the x and y axis. The variable you wish to predict or explain is called the dependent variable and it is always placed on the y axis. The variable you wish to use to explain the relationship with is called the independent variable and is placed on the x axis. (Be aware there are other terms for each of these types of variables, but these are the most universal.)
Wave Ht. Number of surfers
2 0 5 2 8 10 12 30 15 40 18 45 20 60
On a scatter plot, the x axis is horizontal and the y axis is vertical. So in the table above there are 7 data points to plot: the first number is the x coordinate and the second number is the y coordinate. (2,0) (5,2) (8,10) (12,30) (15,40) (18,45) (20, 60). Below is the scatter plot of these two variables from SPSS. You will notice that the scatter plot below seems to show a linear positive relationship.

7 OF 22
Scatter Plot of Wave Ht. and Number of surfers in water at Waimea
Below is Figure 12.3 from the sixth edition of Statistics: A First Course to illustrate the various scatter plots.
Below we will refer to this picture to discuss positive, negative, linear and curvilinear relationships between variables.
8 OF 22
9 OF 22
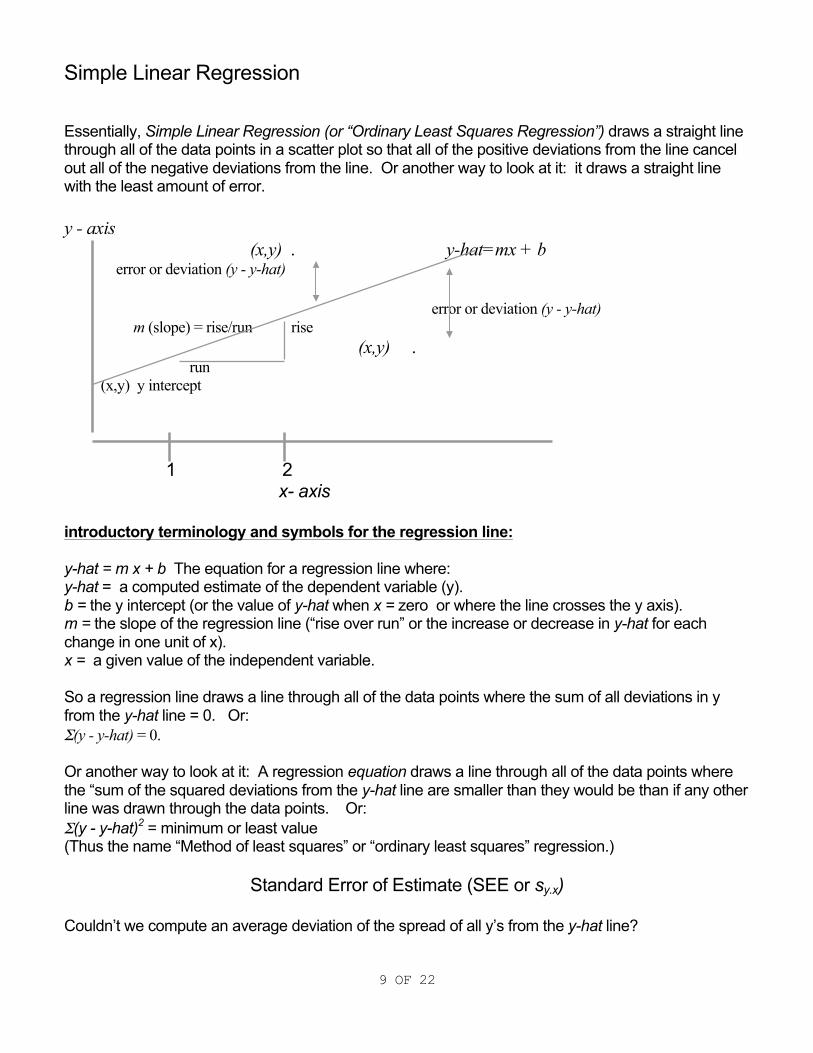
Simple Linear Regression
Essentially, Simple Linear Regression (or “Ordinary Least Squares Regression”) draws a straight line through all of the data points in a scatter plot so that all of the positive deviations from the line cancel out all of the negative deviations from the line. Or another way to look at it: it draws a straight line with the least amount of error. y - axis (x,y) . y-hat=mx + b error or deviation (y - y-hat) error or deviation (y - y-hat) m (slope) = rise/run rise (x,y) . run (x,y) y intercept 1 2 x- axis introductory terminology and symbols for the regression line: y-hat = m x + b The equation for a regression line where: y-hat = a computed estimate of the dependent variable (y). b = the y intercept (or the value of y-hat when x = zero or where the line crosses the y axis). m = the slope of the regression line (“rise over run” or the increase or decrease in y-hat for each change in one unit of x). x = a given value of the independent variable. So a regression line draws a line through all of the data points where the sum of all deviations in y from the y-hat line = 0. Or: Σ(y - y-hat) = 0. Or another way to look at it: A regression equation draws a line through all of the data points where the “sum of the squared deviations from the y-hat line are smaller than they would be than if any other line was drawn through the data points. Or: Σ(y - y-hat)2 = minimum or least value (Thus the name “Method of least squares” or “ordinary least squares” regression.)
Standard Error of Estimate (SEE or sy.x)
Couldn’t we compute an average deviation of the spread of all y’s from the y-hat line?
10 OF 22
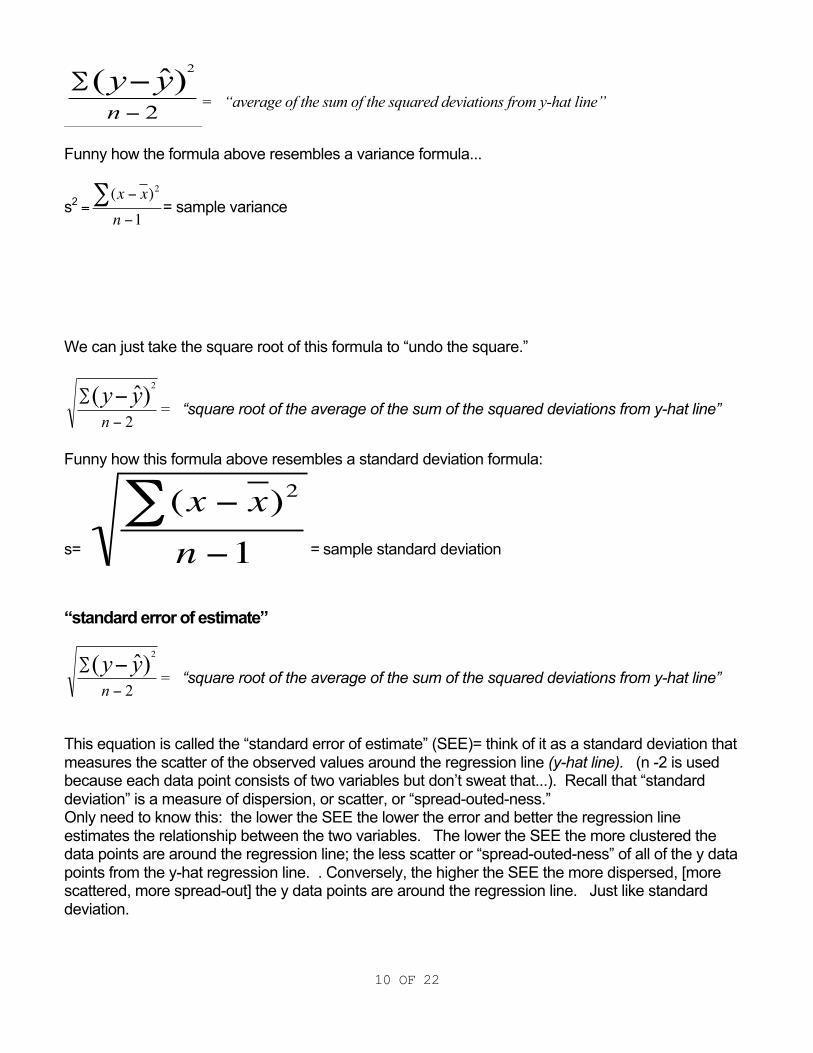
2)ˆ( 2
−
∑ −nyy
= “average of the sum of the squared deviations from y-hat line”
Funny how the formula above resembles a variance formula...
s2 =
€
(x − x)2∑n −1
= sample variance
We can just take the square root of this formula to “undo the square.”
2)ˆ( 2
−
∑ −nyy
= “square root of the average of the sum of the squared deviations from y-hat line”
Funny how this formula above resembles a standard deviation formula:
s=
€
(x − x)2∑n −1 = sample standard deviation
“standard error of estimate”
2)ˆ( 2
−
∑ −nyy
= “square root of the average of the sum of the squared deviations from y-hat line”
This equation is called the “standard error of estimate” (SEE)= think of it as a standard deviation that measures the scatter of the observed values around the regression line (y-hat line). (n -2 is used because each data point consists of two variables but don’t sweat that...). Recall that “standard deviation” is a measure of dispersion, or scatter, or “spread-outed-ness.” Only need to know this: the lower the SEE the lower the error and better the regression line estimates the relationship between the two variables. The lower the SEE the more clustered the data points are around the regression line; the less scatter or “spread-outed-ness” of all of the y data points from the y-hat regression line. . Conversely, the higher the SEE the more dispersed, [more scattered, more spread-out] the y data points are around the regression line. Just like standard deviation.

11 OF 22
Below is figure 12.9 from the sixth edition of Statistics: A First Course
Notice how in (a) the data points are more clustered around the regression line. There is lower “average deviation” from this line. The SEE is lower in (a) than in (b). When you look at (b) the data points are less clustered around the regression line. There is higher average deviation from this line. The SEE is higher in (b) than in (a). So, avoiding going into a lot of mathematical stuff, just realize that the regression line or y-hat line draws a line through all of the data points that minimizes the error of estimating y using x. Estimating y using x is the whole point of regression. If we can estimate y using x then we can say that x “causes” y. A better way to look at it is “if we can account for a significant amount of ’variation in y using x’ then it is logical to assume that x ‘causes’ y.” If changes in y are accounted for by changes in x then we say “x causes y.” If you plug any x into the y-hat line equation then you can get an estimate for y. (There would be error in this estimate, but we won’t get into that in this class.) All regression does is test the null hypothesis that the slope of the regression line is equal to zero: H0: slope of y-hat = 0 or H0: B = 0 H1: slope of y-hat ≠ 0 H1: B ≠ 0 This makes sense: if the “least squares” regression line’s slope is not zero (or horizontal) then we would figure that the x (independent) variable can account for changes in the y (dependent) variable. If that doesn’t make sense, you probably didn’t understand the properties of the regression line. Make sure you understand it!!!! Ask questions if you do not. Essentially we are making an argument that if we could make a scatter plot of the whole population of each variable (X= population independent variable & Y= population dependent variable) there would be a “population least squares regression line” with it own slope (B). We test to see if the slope of that line = 0 (thus the H0: B = 0).

12 OF 22
Example of Simple Linear “Least Squares Regression
Here is the background for the example used for this exercise. Lifeguards regularly keep records of wave heights and number of surfers in the water for selected Oahu beaches. I would like to see whether there is a relationship between wave heights and number of surfers in the water at Waimea Bay. Waimea is one of the premiere big wave surf spots in the world, so one would expect more surfers in the water when the waves are big. Waimea is not a very good surf spot when the waves are smaller so one would expect fewer surfers in the water when the waves are smaller. I have two ratio-level variables: waveht = wave ht. in feet at Waimea Bay & surfers = # of surfers in the water at Waimea Bay. Pretend the data comes from randomly selecting observations from the lifeguards for 7 days in January and February of this winter (n=7).
Wave Ht. # of surfers 2 0 5 2 8 10 12 30 15 40 18 45 20 60
Step #1: Logical Relationship? The first step to any correlation or regression problem is to decide whether there is a logical relationship between the two variables. In this case there is a logical relationship between wave height and number of surfers in the water at Waimea. Since surfers go to Waimea to surf big waves it is likely that big waves “cause” people to surf Waimea. (In reality this might be best described as a curvilinear relationship as Waimea does close out become "unsurfable" when the waves get bigger than 30 feet, like on Jan. 28, 1998. But that is exceedingly rare.) Step #2: Draw a scatter plot to look for linear relationship. Figure 1: Scatter Plot of Wave Ht. and # of surfers in water at Waimea

13 OF 22
In this case it looks like we have a positive linear relationship. I would also expect this to be a direct cause and effect relationship, (and not a common-cause relationship). The size of the waves directly causes an increase in the amount of surfers in the water at Waimea Bay. Step #3: Do a regression test. For a regression analysis we can still use the familiar seven steps: 1. State null and alternative hypothesis. H0: B = 0 H1: B ≠ 0 2. State level of significance or α “alpha.” For this problem alpha =.05 3. Determine the test distribution to use – use Z if # of data points (x,y) >30 otherwise use t.
[If t is used: df=n-2 where n = # of data points (x,y)] In this case we have 7 pairs of data so n=7. Use a t distribution with df=n-2 or df=7-2=5 4. Define the rejection regions. And draw a picture! This regression test isTWO TAILED
tests so α/2 goes into each tail. In this case critical t value = 2.571 5. State the decision rule. Reject null if TR> 2.571 or TR< - 2.571 otherwise FTR.
14 OF 22
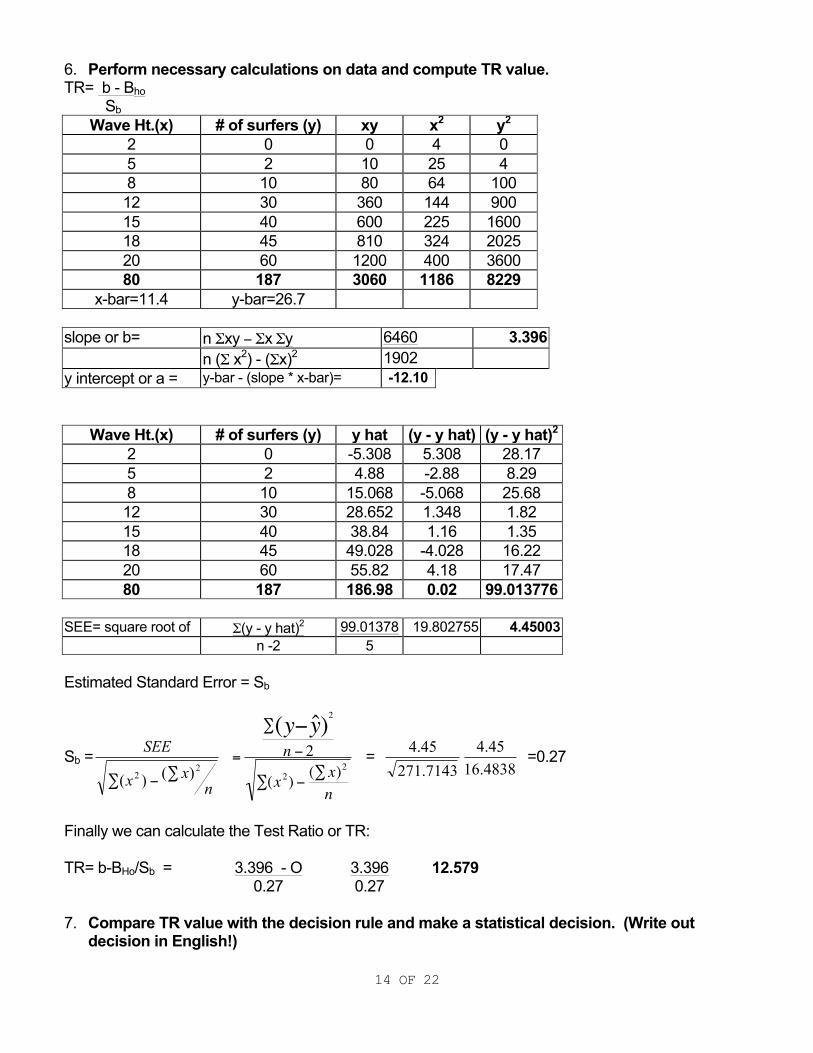
6. Perform necessary calculations on data and compute TR value. TR= b - Bho Sb
Wave Ht.(x) # of surfers (y) xy x2 y2 2 0 0 4 0 5 2 10 25 4 8 10 80 64 100 12 30 360 144 900 15 40 600 225 1600 18 45 810 324 2025 20 60 1200 400 3600 80 187 3060 1186 8229
x-bar=11.4 y-bar=26.7 slope or b= n Σxy − Σx Σy 6460 3.396
n (Σ x2) - (Σx)2 1902 y intercept or a = y-bar - (slope * x-bar)= -12.10
Wave Ht.(x) # of surfers (y) y hat (y - y hat) (y - y hat)2 2 0 -5.308 5.308 28.17 5 2 4.88 -2.88 8.29 8 10 15.068 -5.068 25.68 12 30 28.652 1.348 1.82 15 40 38.84 1.16 1.35 18 45 49.028 -4.028 16.22 20 60 55.82 4.18 17.47 80 187 186.98 0.02 99.013776
SEE= square root of Σ(y - y hat)2 99.01378 19.802755 4.45003
n -2 5 Estimated Standard Error = Sb
Sb =
nxx
SEE2
2 )()( ∑−∑
€
=
∑2
(y− ˆ y )n − 2
∑(x2) −
(∑ x)2
n
= 7143.27145.4
4838.1645.4 =0.27
Finally we can calculate the Test Ratio or TR: TR= b-BHo/Sb = 3.396 - O 3.396 12.579
0.27 0.27 7. Compare TR value with the decision rule and make a statistical decision. (Write out
decision in English!)

15 OF 22
Since 12.5 is greater than 2.571 we reject the null and conclude the alternative. We conclude that there is a slope to the population regression line and a meaningful regression relationship does exist between wave height and # of surfers in the water at Waimea Bay. We are 95% confident of this statement. Using the Computer Makes It So Much Easier...
Given all that tedious math in step 6, you can see why we always use the computer when performing a regression in the real world. The computer calculates the TR value, the p-value, the slope and the y intercept of the regression line for us. Below is a portion the SPSS output for this problem:
Coefficientsa Model Unstandardized
Coefficients Standardized Coefficients
t Sig. B Std. Error Beta 1 (Constant) -12.102 3.514 -3.444 .018
height of waves
3.396 .270 .985 12.581 .000
a. Dependent Variable: number of surfers in water • Write out the equation for the regression line using the computer output: y-hat = mx + b
m = slope and b = y intercept. In the output the slope (b) is the lower number under the “B” column: 3.396. The y intercept (b) is the top number under the same column: -12.101. Therefore our “least squares regression line” equation: y-hat = 3.396x - 12.101
• The TR value is lower number under the “T” column: 12.581. The slope (b)= 3.396 and is found
as described above. Sb is the lower number under the “Std. Error” column: .270 TR= b-BHo = 3.396 - O= 3.396= 12.58 Sb 0.270 0.270 Use p-value on the take home test for this problem! It’s easiest of all.
Thus far in this class I hope you have figured out that all seven steps lead to to the p-value. When you leave this class, you can skip the seven steps and just look at the p-value. Note whether the regression equation is significant by looking at the p-value. We find the p-value as the lower number under the “Sig.” column. If it is less than our level of significance (α) it is significant. If it is greater than our α it IS NOT significant. (Our p-value is not =.000! SPSS ran out of decimal points!) Our p value <.001 which is less than .05 and is SIGNIFICANT!!

16 OF 22
Decision rule for statistical significance using p-value
• If p-value < α or “alpha” it is significant! [Typically we use alpha =.05] • If p-value >= α or “alpha” it is NOT significant! [Typically we use alpha =.05]
So....
• If p-value < .05 ”it is significant! If p-value >= .05 it is NOT significant!
Step #4: Do a regression/correlation test to measure strength of association. See below

17 OF 22
Simple Linear Regression (and correlation)
Again avoiding the whole math gig, regression (specifically r r2) tells us exactly how much of the total variation in y that is accounted for by the introduction of the x variable. Using our example above, we could see how much of the variation in the number of surfers in the water at Waimea Bay is accounted for by variations in the height of the waves. To understand what this r2 thing means, we must go back to the regression line: y - axis . y* (single point) unexplained deviation (y* - y-hat) total deviation (y* - y-bar) explained deviation (y-hat - y-bar) y-bar y-bar 1 2 x- axis If we sum all of these ‘deviations’ then we can have a measure of ‘variation.’ total variation Σ( y* - y-bar)= explained variation Σ(y-hat - y-bar) + unexplained variation Σ(y* - y-hat).2
coefficient of determination = r2
The most important part of regression is a number called r2 = coefficient of determination. (The book covers this on pages 524-525 in the fifth edition and pages 552-554 in the sixth edition.) R2 is a ratio (or fraction) of the explained variation over the total variation. r2 = explained variation = SSR = Σ (y-hat - y-bar)2
total variation SST Σ (y* - y-bar)2
The r2 or “coefficient of determination” is a ratio or fraction that tells us the amount of total variation in the y variable explained by the x variable (using the regression line). In this class we will use SPSS to compute r2.
18 OF 22
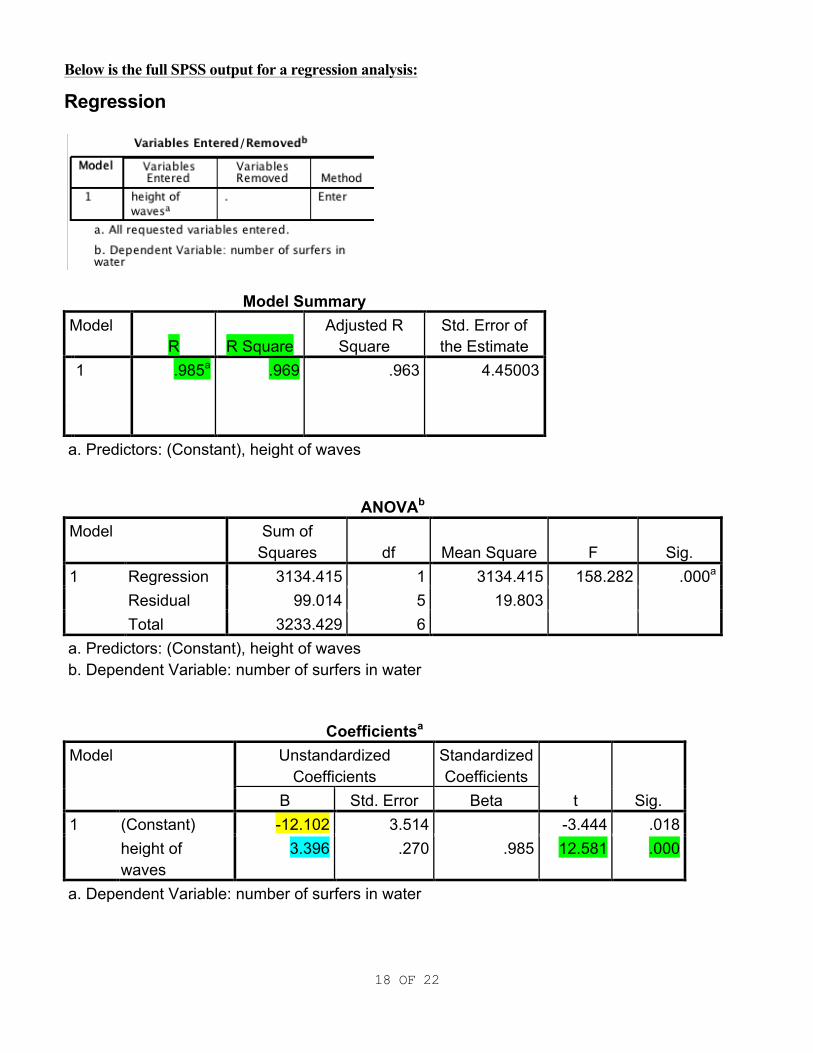
Below is the full SPSS output for a regression analysis:
Regression
Model Summary Model
R R Square Adjusted R
Square Std. Error of the Estimate
1
1
.985a .969 .963 4.45003
a. Predictors: (Constant), height of waves
ANOVAb Model Sum of
Squares df Mean Square F Sig. 1 Regression 3134.415 1 3134.415 158.282 .000a
Residual 99.014 5 19.803 Total 3233.429 6
a. Predictors: (Constant), height of waves b. Dependent Variable: number of surfers in water
Coefficientsa Model Unstandardized
Coefficients Standardized Coefficients
t Sig. B Std. Error Beta 1 (Constant) -12.102 3.514 -3.444 .018
height of waves
3.396 .270 .985 12.581 .000
a. Dependent Variable: number of surfers in water
19 OF 22
Look at the second box "Model Summary." For this example our r2 or “coefficient of determination” is under the R square column and r2 = .969 (can be rounded to .97). I highlighted this in green Finally we can explain the r2 value in English -- relating it to our variables!!! In this case we would say that “97% of the total variation in # of surfers in the water at Waimea Bay is explained by variations in wave height.” Or you could also say: “97% of the total variation in # of surfers in the water at Waimea Bay is explained by variations in the height of the waves at Waimea Bay.” Either one is correct, it just depends upon which makes the most sense to you. The regression line and interpreting its slope
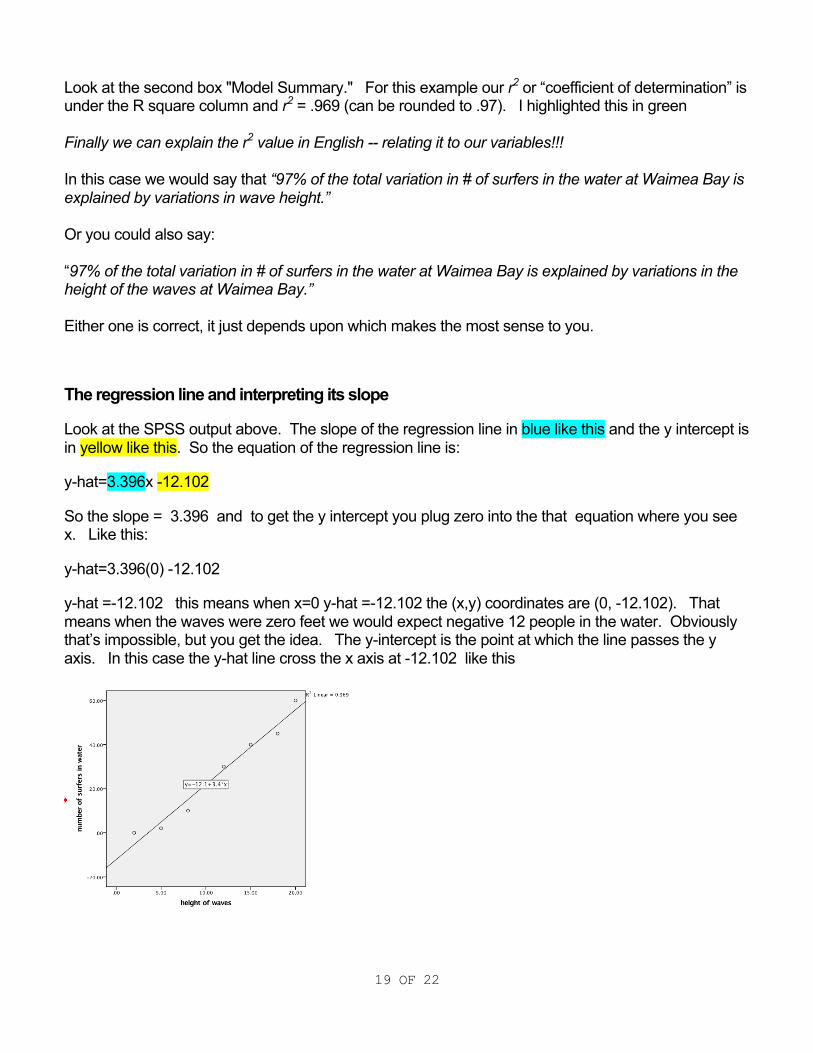
Look at the SPSS output above. The slope of the regression line in blue like this and the y intercept is in yellow like this. So the equation of the regression line is:
y-hat=3.396x -12.102
So the slope = 3.396 and to get the y intercept you plug zero into the that equation where you see x. Like this:
y-hat=3.396(0) -12.102
y-hat =-12.102 this means when x=0 y-hat =-12.102 the (x,y) coordinates are (0, -12.102). That means when the waves were zero feet we would expect negative 12 people in the water. Obviously that’s impossible, but you get the idea. The y-intercept is the point at which the line passes the y axis. In this case the y-hat line cross the x axis at -12.102 like this

20 OF 22
So what does the slope of 3.396 mean?
So for every one unit increase in x or height of waves, the number of the surfers in the water increases by 3.396. Obviously there is no such thing as 3.396 surfers. So let us round 3.396 to 3. So for every one foot increase in the waves the number of surfers in the water increases by about 3. When we increase the waves by ten feet we expect there to about 33.96 more surfers in the water (3.396x10=33.96).
So y-hat is an estimate for y given x. So if the waves are 10 feet we expect the number of surfers in the water to be
y-hat=3.396(10) -12.102
y-hat =33.96-12.102
y-hat=21.858
If the waves are 20 feet we expect the number of surfers in the water to be
y-hat=3.396(20) -12.102
y-hat =67.92-12.102
y-hat=55.818
So what’s the difference between 55.818 and 21.858? 55.818-21.859=33.96! See? That’s why above I said “When we increase the waves by ten feet we expect there to about 33.96 more surfers in the water.”
Correlation -- r is hard to understand in plain English.
coefficient of correlation = r
If we take the square root of r2 we get r = coefficient of correlation. The number itself is sort of meaningless when compared to r2. The r2 is something meaningful. Recall it is the percent of variation in y explained by x. So for our Waimea surfing example it was the percentage of variation in the number of surfers in the water explained by the variations in the height of the waves. So sadly, r is simply the square root of something meaningless. Then we add a sign – either positive or negative to it based upon the slope of the regression line. So r always falls somewhere between -1 and +1. The positive or negative value comes from the slope of the regression y-hat line. If the slope is negative, r is assigned a negative value. If slope is positive r is assigned a positive value. Each extreme is a “perfect correlation” and 0 implies “no correlation.” The closer r is to 1 or -1 the stronger the correlation. The stronger the correlation the more the scatter plot resembles a clustered ellipse. The sign of r tells us whether there is a

21 OF 22
positive or negative relationship between the x and y variables. Negative correlations imply negative slopes for regression line and positive correlations imply positive slopes. The “strength” of r actually depends upon previous research, so I will give you a contrived or “pretend” rule that we will use for this class only. But remember for the r or “coefficient of correlation” to be a meaningful number we must have a "significant correlation" (p<.05 or p< your alpha from step 2)! Recall the “sign” of r matters!
• 0.00< r <0.33 = “weak relationship“(the mathematical sign (+ or -) determines whether or not it’s a positive or negative relationship)
• 0.34< r <0.66 = “moderate relationship“(the mathematical sign (+ or -) determines whether or not it’s a positive or negative relationship)
• 0.67< r <1.0 = “strong relationship“(the mathematical sign (+ or -) determines whether or not it’s a positive or negative relationship)
While you can find all of this information in the SPSS regression output above, SPSS also has separate correlation output. Below is the SPSS output for a the correlation of these two variables:
Correlations
height of waves
number of surfers in water
height of waves Pearson Correlation 1 .985** Sig. (2-tailed) .000 N 7 7
number of surfers in water Pearson Correlation .985** 1 Sig. (2-tailed) .000 N 7 7
**. Correlation is significant at the 0.01 level (2-tailed). The “r” from the SPSS output above is the r or “coefficient of correlation.” In this case r = .98457. We can see that the R= .985 again and most importantly we can see the p-value for the correlation test in the second "Sig. (2-tailed)" box. In this case it is p=.000 which by now we all know "really means" that p<.001. Because the p<.001 the correlation is "significant" and .98457 is very close to a perfect correlation of +1 we can say represents "a very strong positive relationship." So in summary we see if the regression and correlation test are "significant" to tell us if there is a meaningful relationship between the two variables. Then we have two related numbers that tell us how closely related the two variables actually are: r and r2.

22 OF 22