
Lecture 2 Properties of Galaxies - Departamento de Astronomia · Lecture 2 Properties of Galaxies...
38
Lecture 2 Properties of Galaxies Observational Properties Photometric Properties • magnitudes and luminosities • colors (and color gradients) • surface brightness (and photometric diameters) • K-corrections • brightness profiles Spectroscopic Properties Physical Properties the real shape mass, luminosity and diameter gas fraction stellar populations chemical composition Correlations of Structural Parameters the Faber-Jackson relation (E) the Tully-Fisher relation (S) Astronomía Extragaláctica y Cosmología Observacional Depto. de Astronomía (UGto)
Transcript of Lecture 2 Properties of Galaxies - Departamento de Astronomia · Lecture 2 Properties of Galaxies...

Lecture 2 Properties of Galaxies
Observational PropertiesPhotometric Properties
• magnitudes and luminosities• colors (and color gradients)• surface brightness (and photometric diameters)• K-corrections• brightness profiles
Spectroscopic Properties
Physical Propertiesthe real shapemass, luminosity and diametergas fractionstellar populationschemical composition
Correlations of Structural Parametersthe Faber-Jackson relation (E)the Tully-Fisher relation (S)
Astronomía Extragaláctica y Cosmología ObservacionalDepto. de Astronomía (UGto)
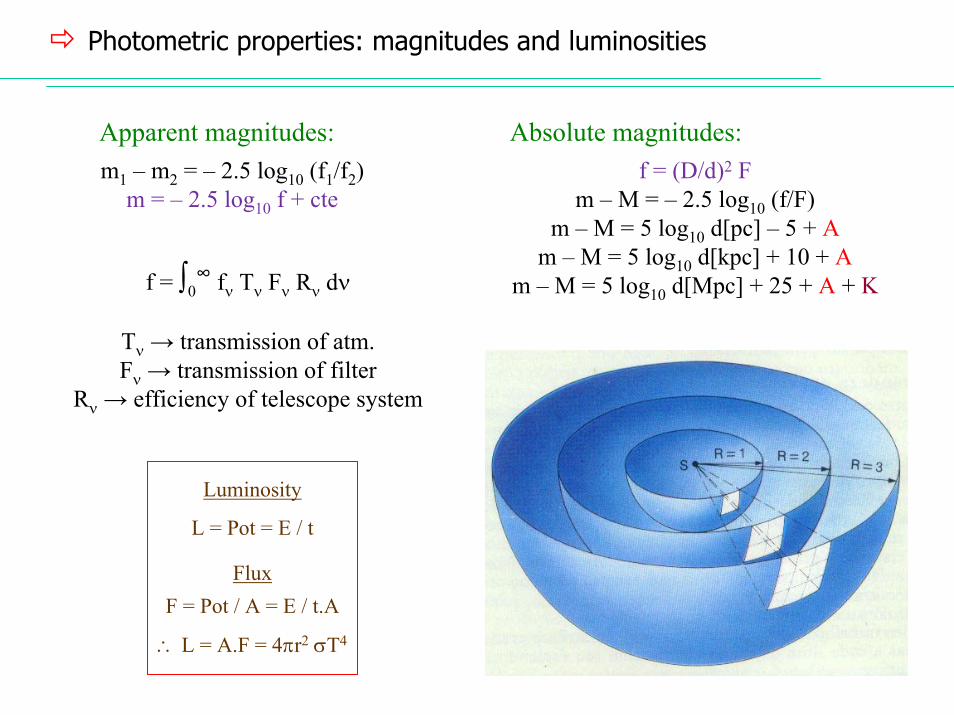
Photometric properties: magnitudes and luminosities
m1 – m2 = – 2.5 log10 (f1/f2)m = – 2.5 log10 f + cte
Apparent magnitudes:f = (D/d)2 F
m – M = – 2.5 log10 (f/F)m – M = 5 log10 d[pc] – 5 + A
m – M = 5 log10 d[kpc] + 10 + Am – M = 5 log10 d[Mpc] + 25 + A + K
Absolute magnitudes:
f = ∫0∞ fν Tν Fν Rν dν
Tν → transmission of atm.Fν → transmission of filter
Rν → efficiency of telescope system
Luminosity
L = Pot = E / t
FluxF = Pot / A = E / t.A
∴ L = A.F = 4πr2 σT4

Photometric properties: filters and photometric systems
UBVRIJHKLM Johnson-Cousins-Glass system
u g r i z SDSS system
[Fukugita et al. 1996, AJ 111, 1748]
[Johnson & Morgan 1953, ApJ 117, 313Cousins 1976, MNRAS 81, 25Glass 1974, MNASSA 33, 53]
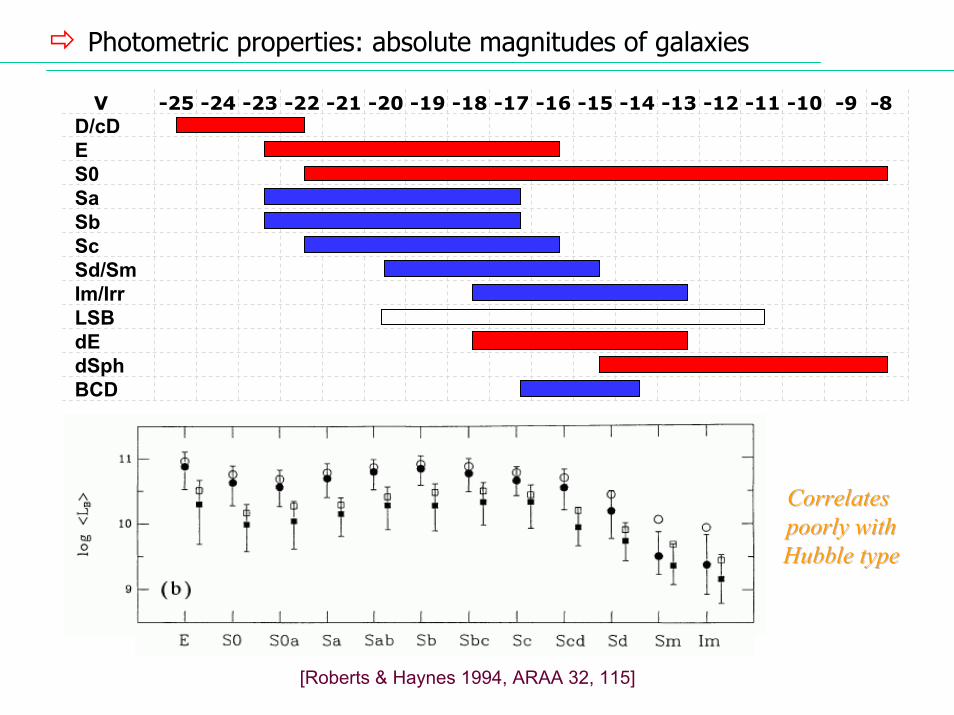
Photometric properties: absolute magnitudes of galaxies
V -25 -24 -23 -22 -21 -20 -19 -18 -17 -16 -15 -14 -13 -12 -11 -10 -9 -8D/cDES0SaSbScSd/SmIm/IrrLSBdEdSphBCD
Correlates Correlates poorly withpoorly withHubble typeHubble type
[Roberts & Haynes 1994, ARAA 32, 115]
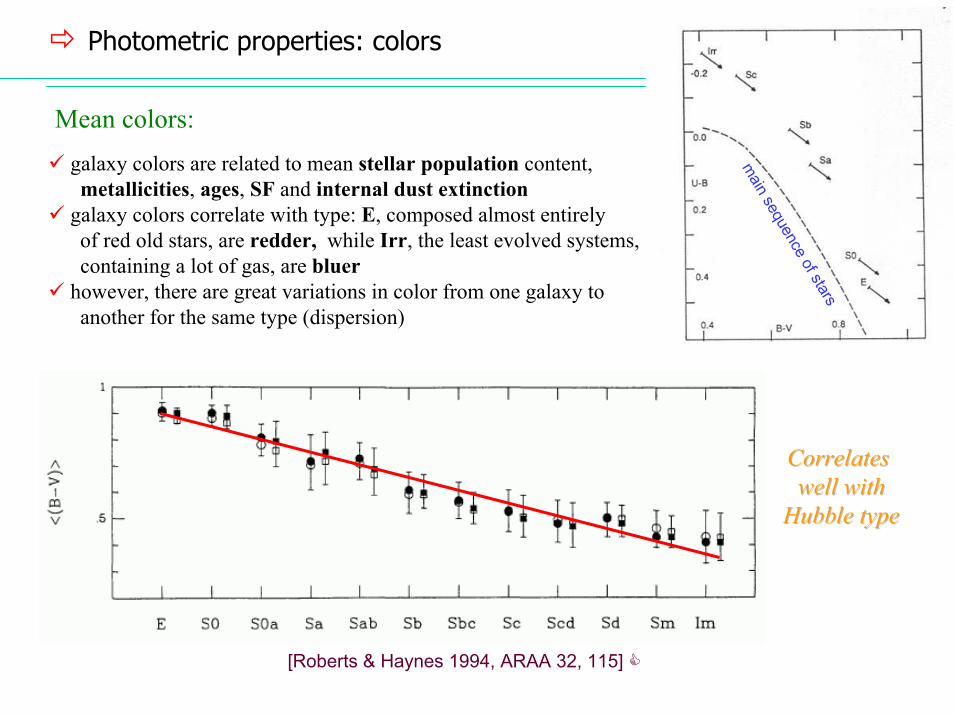
Photometric properties: colors
main sequence of stars
Mean colors:galaxy colors are related to mean stellar population content, metallicities, ages, SF and internal dust extinction
galaxy colors correlate with type: E, composed almost entirely of red old stars, are redder, while Irr, the least evolved systems,containing a lot of gas, are bluer
however, there are great variations in color from one galaxy to another for the same type (dispersion)
Correlates Correlates well withwell with
Hubble typeHubble type
[Roberts & Haynes 1994, ARAA 32, 115]
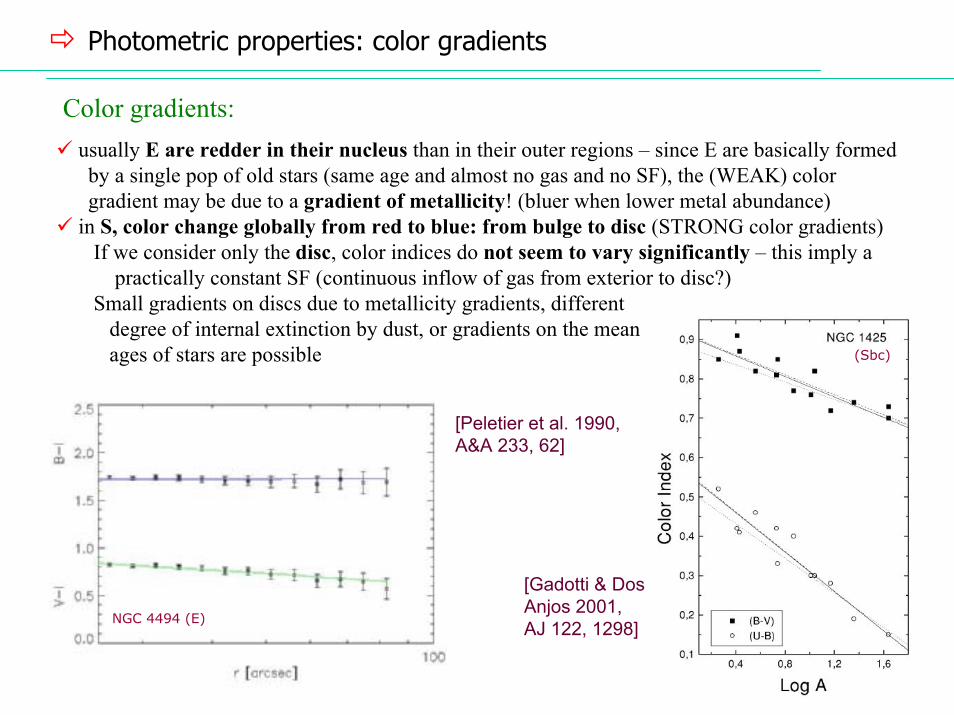
Photometric properties: color gradients
Color gradients:usually E are redder in their nucleus than in their outer regions – since E are basically formedby a single pop of old stars (same age and almost no gas and no SF), the (WEAK) color gradient may be due to a gradient of metallicity! (bluer when lower metal abundance)
in S, color change globally from red to blue: from bulge to disc (STRONG color gradients)If we consider only the disc, color indices do not seem to vary significantly – this imply a
practically constant SF (continuous inflow of gas from exterior to disc?)Small gradients on discs due to metallicity gradients, different
degree of internal extinction by dust, or gradients on the mean ages of stars are possible
NGC 4494 (E)
[Peletier et al. 1990, A&A 233, 62]
[Gadotti & Dos Anjos 2001, AJ 122, 1298]
(Sbc)
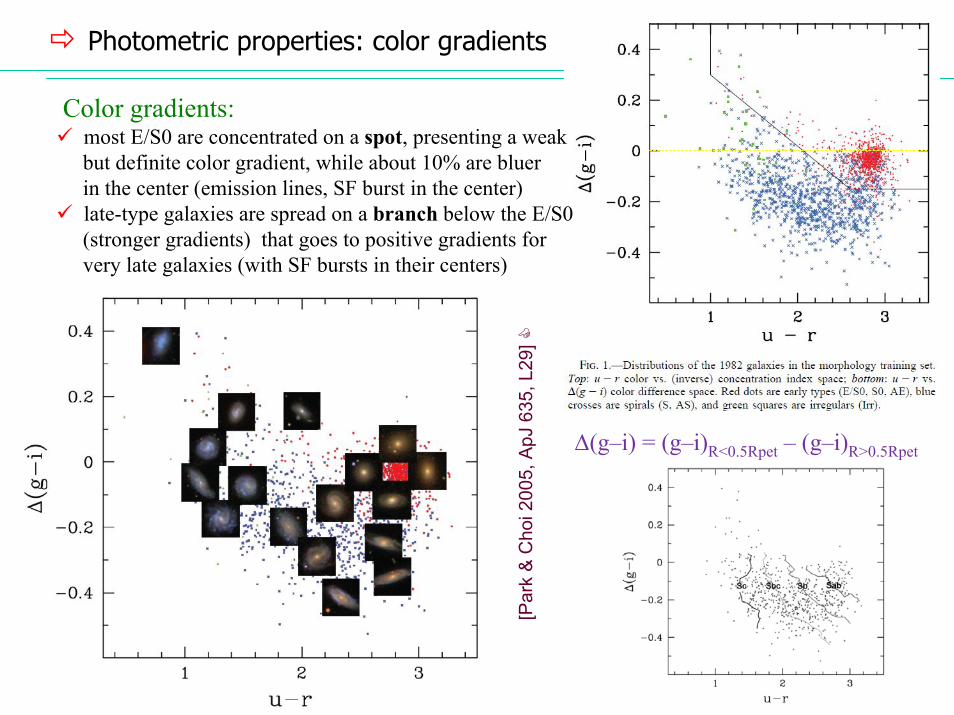
Color gradients:most E/S0 are concentrated on a spot, presenting a weakbut definite color gradient, while about 10% are bluerin the center (emission lines, SF burst in the center)late-type galaxies are spread on a branch below the E/S0(stronger gradients) that goes to positive gradients for very late galaxies (with SF bursts in their centers)
[Par
k &
Cho
i200
5, A
pJ63
5, L
29]
∆(g–i) = (g–i)R<0.5Rpet – (g–i)R>0.5Rpet
Photometric properties: color gradients

Photometric properties: surface brightness
Σ = – 2.5 log10 (f/Ω) + cteSurface brightness:
to first approximation, the Σ of an extended object is independent of its distance: f falls of as 1/d2 and also does the Ω in the same proportion
is measured in mag arcsec-2 (or µm, where m is themagnitude band)
Isophotes:curves that encircle areas of certain Σ (lines of equal Σ)
Isophotal (or photometric) diameter:diameter at which some particular Σ level is reached (semimajor axis of the corresponding isophote)
Holmberg radius → half diameter of galaxy at Σ = 26.5 µpgde Vaucouleurs radius → half diameter of galaxy at Σ = 25 µB, corrected to
face-on and of dust obscuration (called D25)[de Vaucouleurs et al. 1991, 3rd Reference Catalogue of Bright Galaxies]
Photometric properties: surface brightness
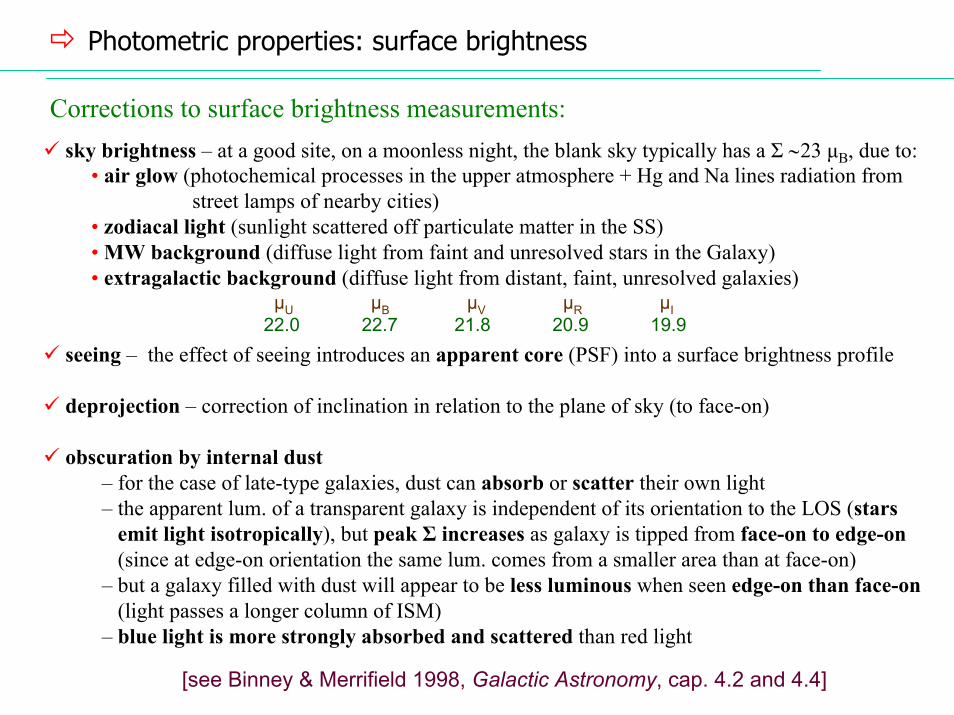
Corrections to surface brightness measurements:sky brightness – at a good site, on a moonless night, the blank sky typically has a Σ ∼23 µB, due to:
• air glow (photochemical processes in the upper atmosphere + Hg and Na lines radiation fromstreet lamps of nearby cities)
• zodiacal light (sunlight scattered off particulate matter in the SS)• MW background (diffuse light from faint and unresolved stars in the Galaxy)• extragalactic background (diffuse light from distant, faint, unresolved galaxies)
seeing – the effect of seeing introduces an apparent core (PSF) into a surface brightness profile
deprojection – correction of inclination in relation to the plane of sky (to face-on)
obscuration by internal dust– for the case of late-type galaxies, dust can absorb or scatter their own light– the apparent lum. of a transparent galaxy is independent of its orientation to the LOS (stars
emit light isotropically), but peak Σ increases as galaxy is tipped from face-on to edge-on(since at edge-on orientation the same lum. comes from a smaller area than at face-on)
– but a galaxy filled with dust will appear to be less luminous when seen edge-on than face-on(light passes a longer column of ISM)
– blue light is more strongly absorbed and scattered than red light
µU µB µV µR µI22.0 22.7 21.8 20.9 19.9
[see Binney & Merrifield 1998, Galactic Astronomy, cap. 4.2 and 4.4]
Photometric properties: K-corrections
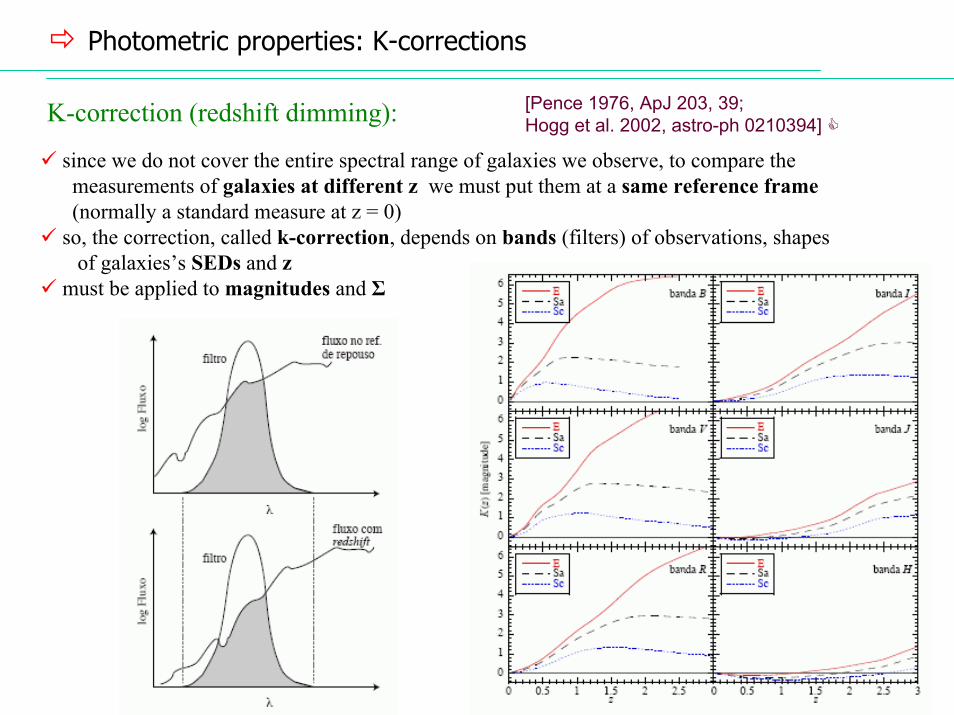
K-correction (redshift dimming):
since we do not cover the entire spectral range of galaxies we observe, to compare the measurements of galaxies at different z we must put them at a same reference frame(normally a standard measure at z = 0)
so, the correction, called k-correction, depends on bands (filters) of observations, shapes of galaxies’s SEDs and z
must be applied to magnitudes and Σ
[Pence 1976, ApJ 203, 39; Hogg et al. 2002, astro-ph 0210394]

Photometric properties: K-corrections
K-correction (redshift dimming):
Photometric properties: surface brightness profile for spheroids
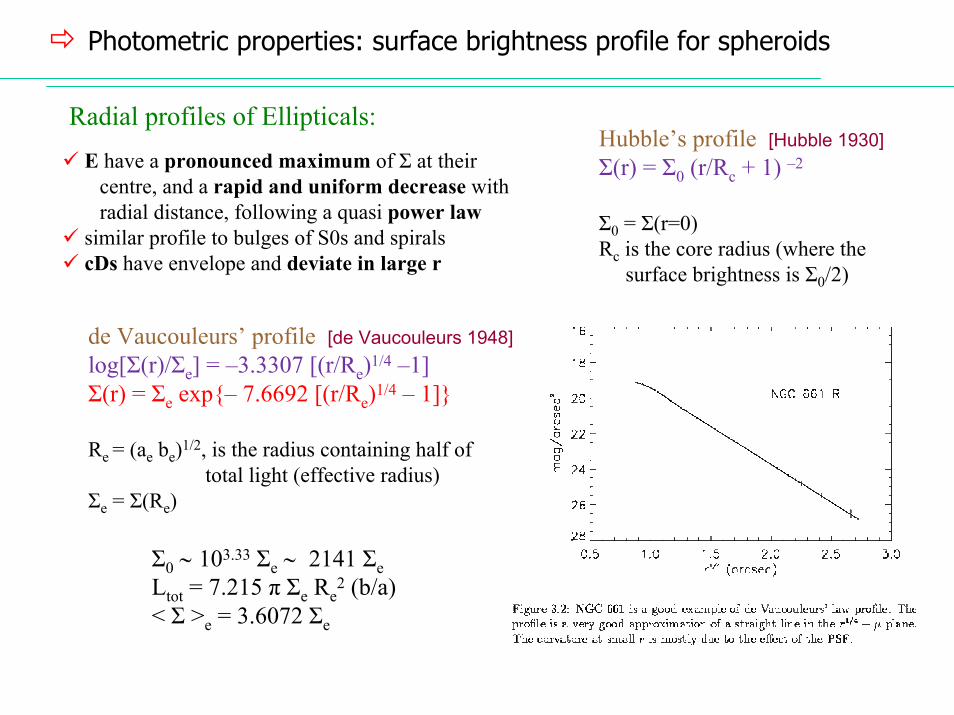
Radial profiles of Ellipticals:E have a pronounced maximum of Σ at their
centre, and a rapid and uniform decrease withradial distance, following a quasi power law
similar profile to bulges of S0s and spiralscDs have envelope and deviate in large r
Hubble’s profile [Hubble 1930]Σ(r) = Σ0 (r/Rc + 1) –2
Σ0 = Σ(r=0)Rc is the core radius (where the
surface brightness is Σ0/2)
de Vaucouleurs’ profile [de Vaucouleurs 1948]log[Σ(r)/Σe] = –3.3307 [(r/Re)1/4 –1]Σ(r) = Σe exp– 7.6692 [(r/Re)1/4 – 1]
Re = (ae be)1/2, is the radius containing half of total light (effective radius)
Σe = Σ(Re)
Σ0 ∼ 103.33 Σe ∼ 2141 ΣeLtot = 7.215 π Σe Re
2 (b/a)< Σ >e = 3.6072 Σe

Photometric properties: surface brightness profile for spheroids
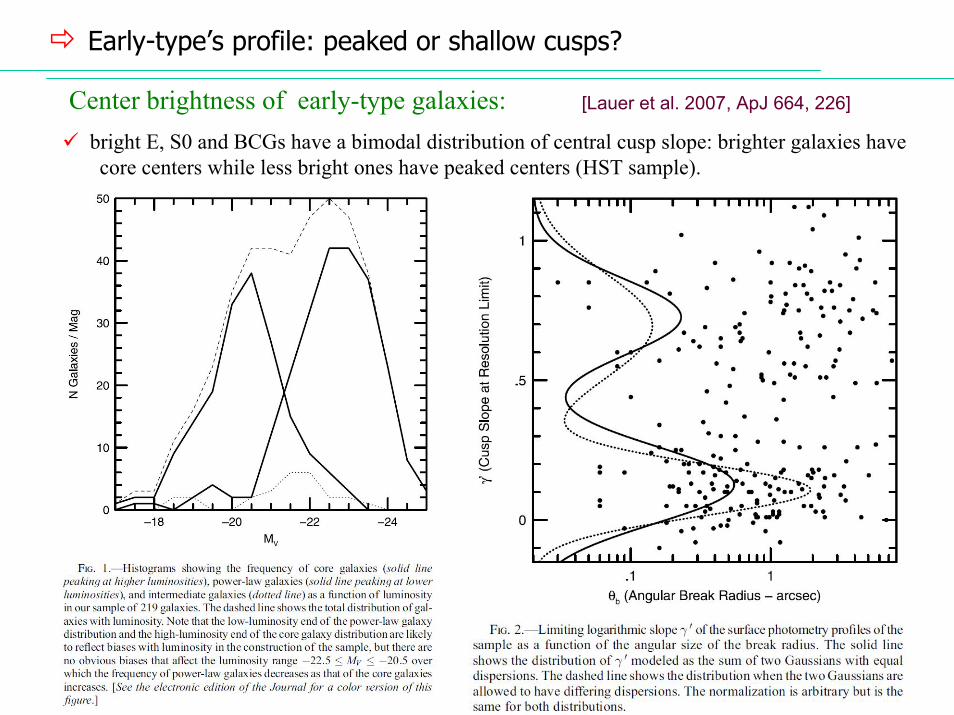
Early-type’s profile: peaked or shallow cusps?
Center brightness of early-type galaxies:bright E, S0 and BCGs have a bimodal distribution of central cusp slope: brighter galaxies havecore centers while less bright ones have peaked centers (HST sample).
[Lauer et al. 2007, ApJ 664, 226]

Photometric properties: surface brightness profile for discs
Radial profile of Spirals and Lenticulars:Since S are much more complex systems (bulge, bar, disc, spiral arms, rings, dust, ...), their
profiles also show a considerable variety and individuality of form.their profile can be decomposed on two main compenents: bulge (that closely resemble the
profile of ellipticals) and disc (that has an exponential profile)
Exponential profile [Freeman 1970]Σ(r) = Σ0 e-r/h
Σ0 = Σ(r=0), extrapolatedh is the disc scale length
Ldisc = 4π h2 Σ0< Σ >0 = 1.9016 Σ0
Bulge fraction (T = total luminosity)B/T = Re
2 Σe / (Re2 Σe + 0.28 h2 Σ0)
D/B = (B/T)−1 − 1

Photometric properties: surface brightness profile for discs
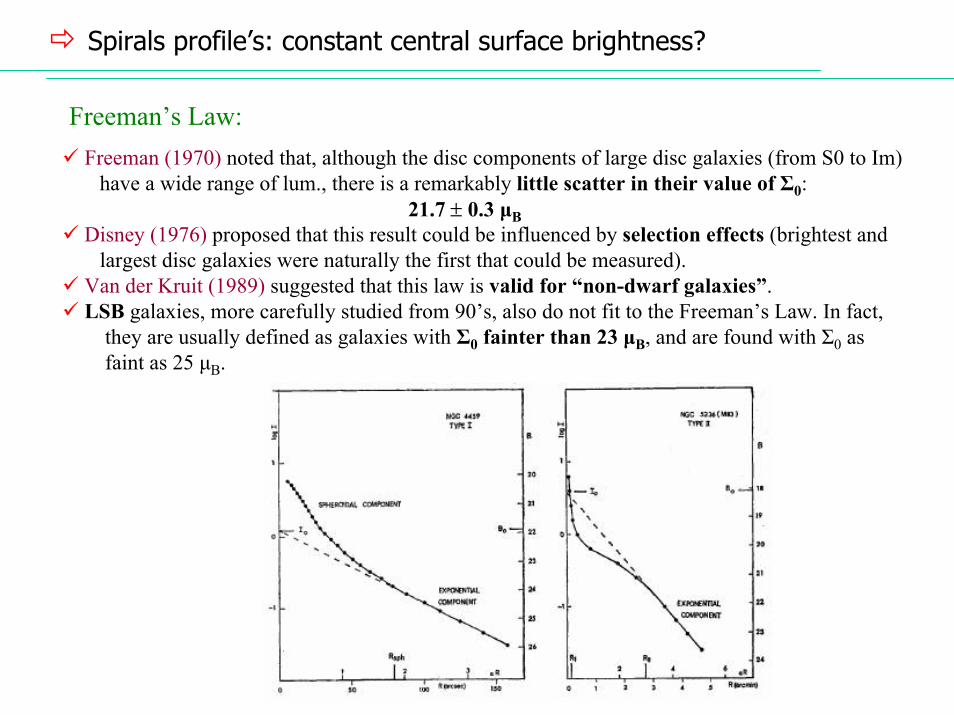
Spirals profile’s: constant central surface brightness?
Freeman’s Law:Freeman (1970) noted that, although the disc components of large disc galaxies (from S0 to Im)
have a wide range of lum., there is a remarkably little scatter in their value of Σ0:21.7 ± 0.3 µB
Disney (1976) proposed that this result could be influenced by selection effects (brightest andlargest disc galaxies were naturally the first that could be measured).
Van der Kruit (1989) suggested that this law is valid for “non-dwarf galaxies”.LSB galaxies, more carefully studied from 90’s, also do not fit to the Freeman’s Law. In fact,
they are usually defined as galaxies with Σ0 fainter than 23 µB, and are found with Σ0 asfaint as 25 µB.
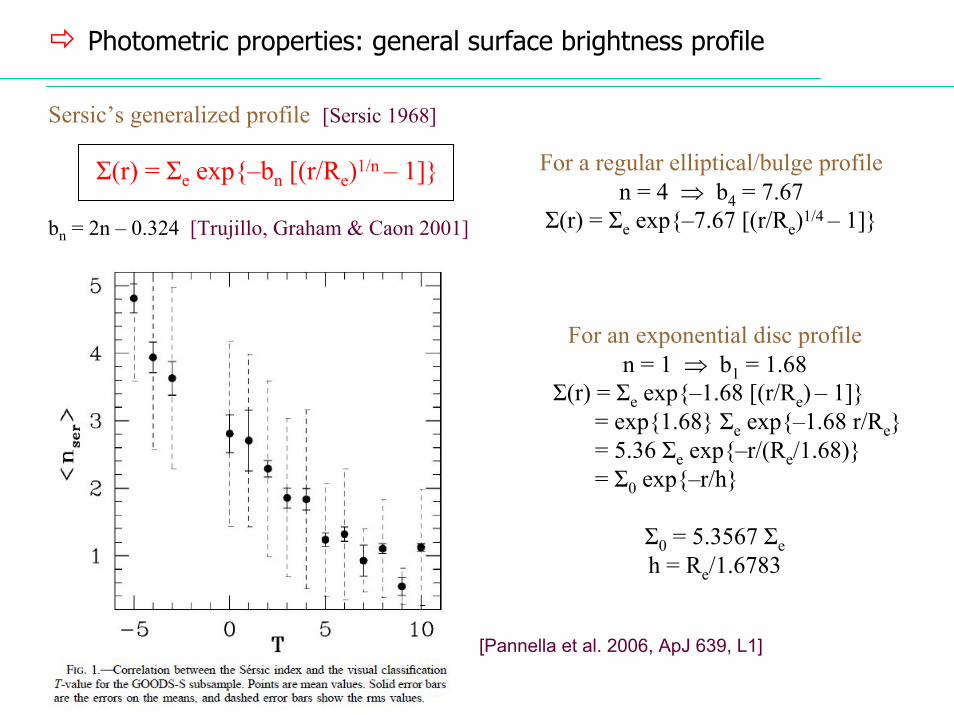
Photometric properties: general surface brightness profile
Sersic’s generalized profile [Sersic 1968]
Σ(r) = Σe exp–bn [(r/Re)1/n – 1]
bn = 2n – 0.324 [Trujillo, Graham & Caon 2001]
For a regular elliptical/bulge profilen = 4 ⇒ b4 = 7.67
Σ(r) = Σe exp–7.67 [(r/Re)1/4 – 1]
For an exponential disc profilen = 1 ⇒ b1 = 1.68
Σ(r) = Σe exp–1.68 [(r/Re) – 1] = exp1.68 Σe exp–1.68 r/Re= 5.36 Σe exp–r/(Re/1.68) = Σ0 exp–r/h
Σ0 = 5.3567 Σeh = Re/1.6783
[Pannella et al. 2006, ApJ 639, L1]

Spectroscopic properties
Galaxy spectra:integrated spectra of galaxies give us information mainly on the stellar populations that
compose the galaxy and on star formation (SF)classes of galaxy spectra are correlated with morphological classificationpopulation synthesis is the construction of a galaxy spectra from the combination of specific
proportions of different types of stellar spectra.
[Humason 1936] – first attempt to classify galaxy spectra: E (spectra close to G3.6)Sc (resembles F8.8)
Absorption spectra (early-type):• stellar population: old stars• no recent SF (very low cold gas)• Balmer break (λ < 4000) – opacity of stellar
photosphere increases fastly below this λ(presence of metals in different degrees of ionization)
• absorption lines (produced on the atm. of cold red giants): CaII K (λ3934), CaII H (λ3969),G (λ4304), Mgb (λ5175), Ca+Fe (λ5269), Na D (λ5893), etc
Emission spectra (late-type):• stellar population: rich in young OB stars• continuous SF (early S – decreases w/ time)
(very gas rich)• high UV continuum (indicative of SF)• emission lines (produced by the gas,
photoionized by energy from massive OB stars): OII (λ3727), Hβ (λ4861), OIII (λ4959, λ5007), Hα (λ6563), NII (λ6548, λ6584), SII (λ6717, λ6731), etc

Spectroscopic properties
K H
G
Mg
CaFeNaHβ
KH
G Mg NaHβ
Hα
SIIOII
NII Hα
SII
OII
NII
OIII
OIII
Hβ
KH
GMg
CaFeNaHβ
Hα
OII
KH
G
MgCaFe Na
Hβ
Hα
SIIOII
NIIOIII
OIII
Hβ
[Kennicutt 1992, ApJS 79, 255]

KH
G
Mg
CaFeNaHβ
Absorption spectra (early-type)
stellar spectra forcomparison

Hα
SII
OII
NII
OIII
OIII
Hβ
Emission spectra (late-type)
stellar spectra forcomparison
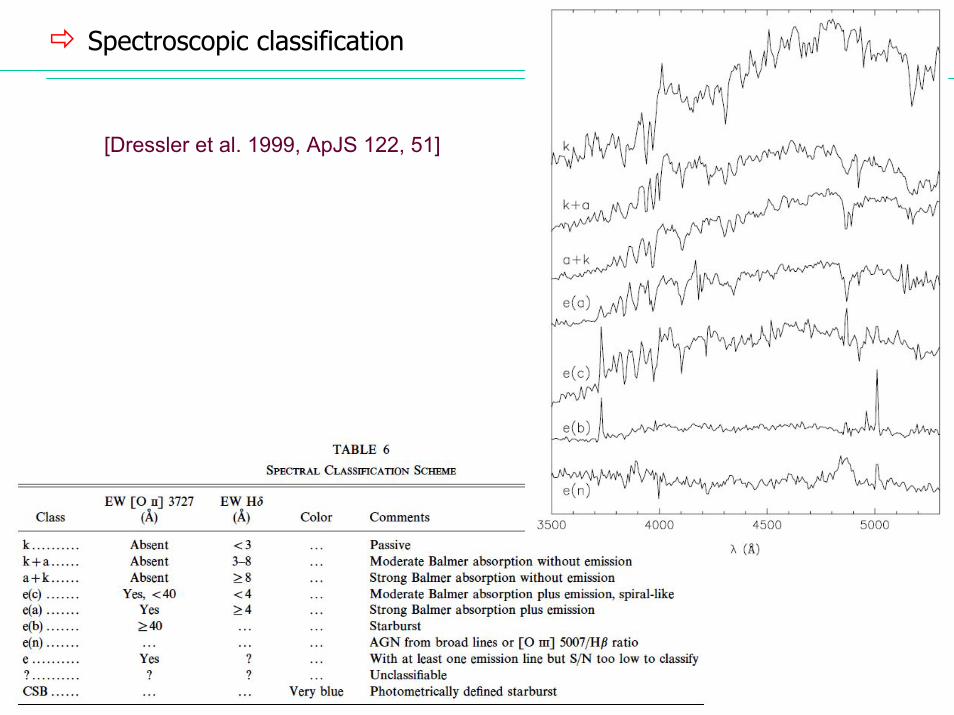
Spectroscopic classification
[Dressler et al. 1999, ApJS 122, 51]
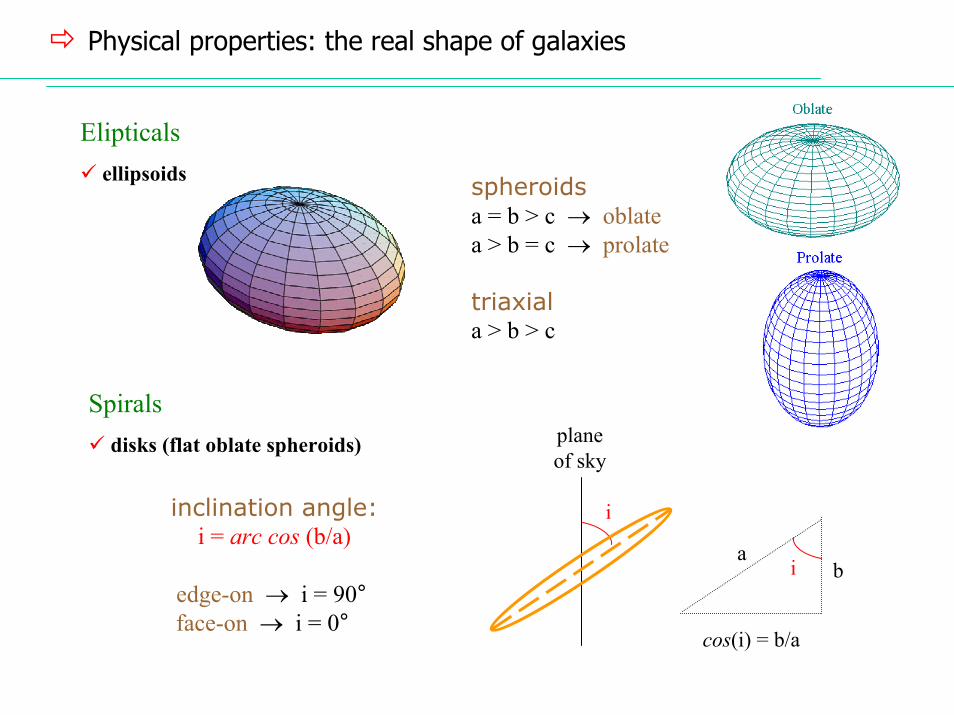
Physical properties: the real shape of galaxies
Elipticalsellipsoids spheroids
a = b > c → oblatea > b = c → prolate
triaxiala > b > c
Spiralsdisks (flat oblate spheroids) plane
of sky
i
ia
b
inclination angle:i = arc cos (b/a)
edge-on → i = 90°face-on → i = 0°
cos(i) = b/a

Physical properties: masses
Property E S Irr
Total mass (M ) 105 – 1013 108 – 1012 107 – 1010
Total luminosity (L ) 105 – 1011 109 – 1011 107 – 1010
Diameter (∅MW) 0.01 – 5 0.02 – 1.5 0.05 – 0.25
Correlates Correlates poorly withpoorly withHubble typeHubble type
Total masses:
M/L ratio:
[Roberts & Haynes 1994, ARAA 32, 115]

Physical properties: gas (HI + H2) fraction
Gas fraction:
Correlates Correlates well withwell with
Hubble typeHubble type
[Roberts & Haynes 1994, ARAA 32, 115]

Physical Properties: stellar content
[Baade 1940] – introduced the idea of stellar populations (discs × ellipticals/bulges)
Population II:E, bulges, haloscool red giantsgas and dust freeGlobular Clustersvery old (CM diagram)deficient in metals
Population I:discs (particularly spiral arms)hot blue supergiantsaccompained by gas and dustOpen Clustersyoung (CM diagram)higher metal abundances
Population III:zero metal

Physical Properties: stellar populations
Modern stellar populations:
Population typical stars velocity shape of system metal abundance dispersion (respect to H)
Halo pop. GC, red giants 130 spherical 0.003
Intermediate pop. II high vel. stars 50 intermediate 0.01
Disc pop. weak line stars 30 intermediate 0.02
Intermediate pop. I strong line stars 20 intermediate 0.03
Extreme pop. I blue supergiants 10 flat 0.04
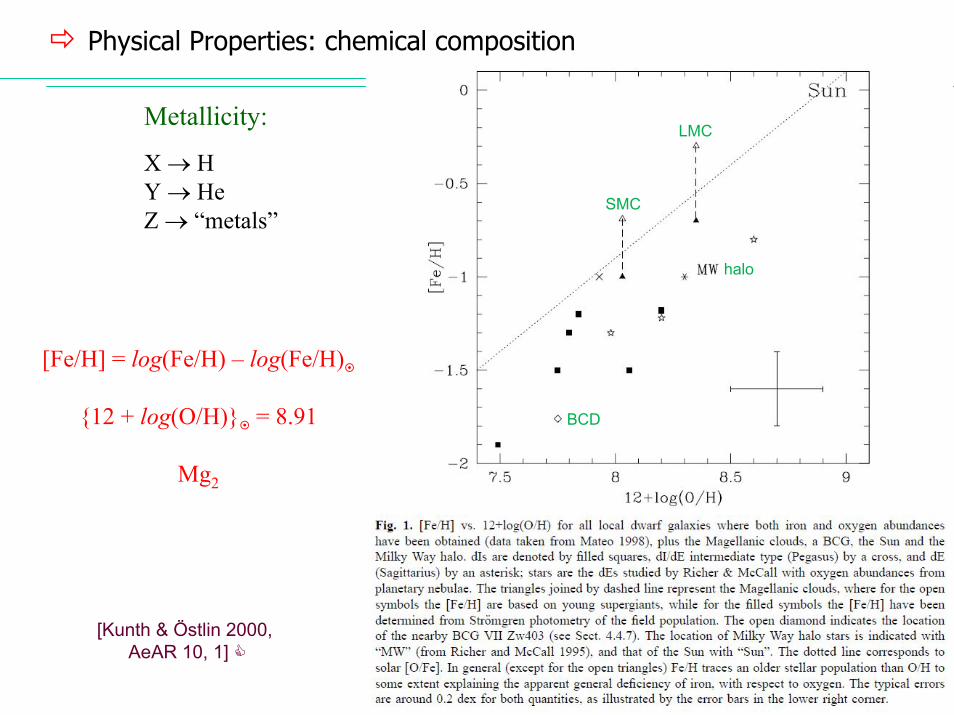
Physical Properties: chemical composition
LMC
SMC
halo
BCD
Metallicity:
X → HY → HeZ → “metals”
[Fe/H] = log(Fe/H) – log(Fe/H)
12 + log(O/H) = 8.91
Mg2
[Kunth & Östlin 2000, AeAR 10, 1]

Glob. Cl.
Stellar metallicity• absorption lines in the spectra of individual
stars (nearby galaxies)• Mg2 in the integrated spectra of distant
early-type galaxies• more mixed, but metallicity at the time of
formation and depends on population
[Mg/Fe]
Physical Properties: chemical composition
[Gol
ev&
Pru
gnie
l199
8, A
eAS
132,
255
]
Galaxies
Gas metallicity• O, N, S, Ne, Ar, Fe in optical emission lines
of HII regions or PNe• Fe in the X-ray spectra of hot ICM of clusters• absorption lines of QSO Lyα systems• up-to-date measure, but subjected to gradients and
contamination (winds from young massive stars)
[O/H]R23=(OII+OIII)/Hβ
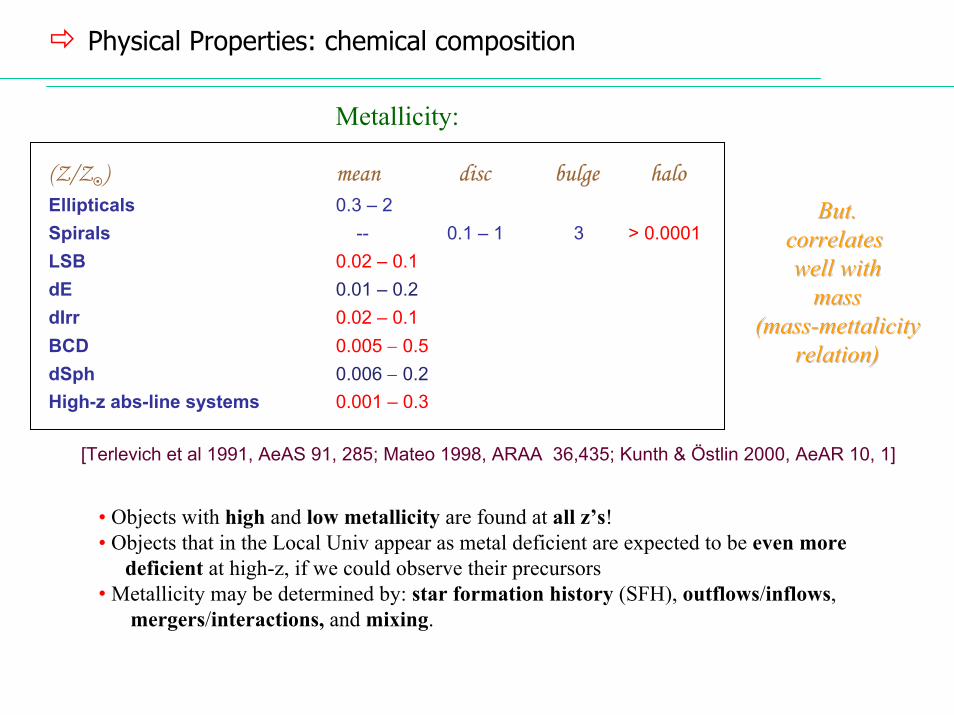
Physical Properties: chemical composition
Metallicity:
(Z/Z ) mean disc bulge halo Ellipticals 0.3 – 2Spirals -- 0.1 – 1 3 > 0.0001LSB 0.02 – 0.1dE 0.01 – 0.2dIrr 0.02 – 0.1BCD 0.005 − 0.5dSph 0.006 − 0.2High-z abs-line systems 0.001 – 0.3
But.But.correlates correlates well withwell with
massmass(mass(mass--mettalicitymettalicity
relation)relation)
[Terlevich et al 1991, AeAS 91, 285; Mateo 1998, ARAA 36,435; Kunth & Östlin 2000, AeAR 10, 1]
• Objects with high and low metallicity are found at all z’s!• Objects that in the Local Univ appear as metal deficient are expected to be even more
deficient at high-z, if we could observe their precursors• Metallicity may be determined by: star formation history (SFH), outflows/inflows,
mergers/interactions, and mixing.
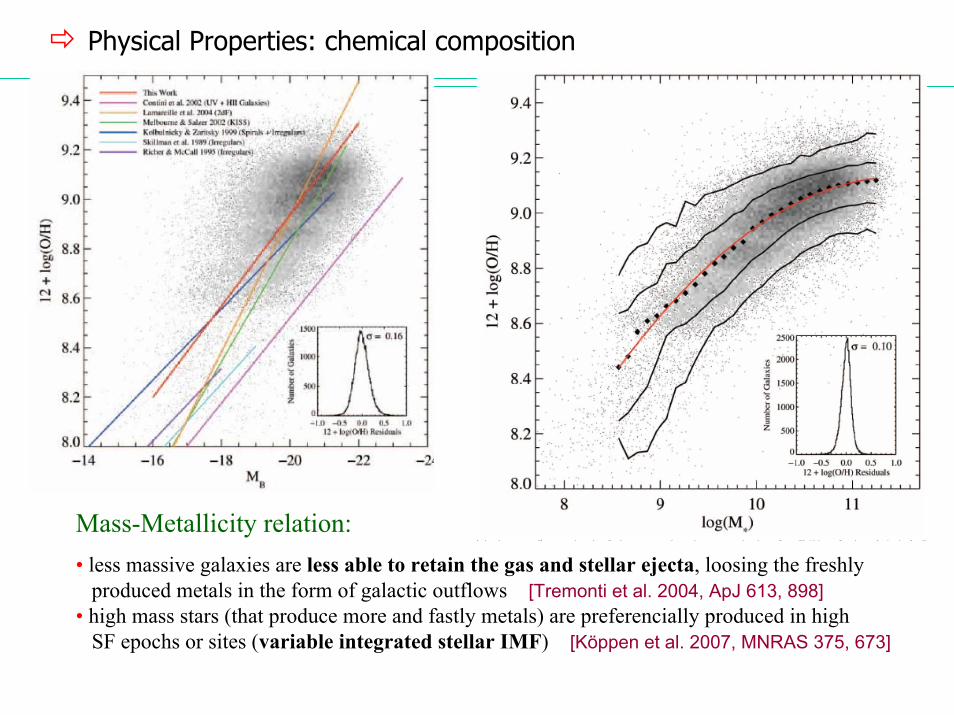
Physical Properties: chemical composition
Mass-Metallicity relation:• less massive galaxies are less able to retain the gas and stellar ejecta, loosing the freshly
produced metals in the form of galactic outflows [Tremonti et al. 2004, ApJ 613, 898]• high mass stars (that produce more and fastly metals) are preferencially produced in high
SF epochs or sites (variable integrated stellar IMF) [Köppen et al. 2007, MNRAS 375, 673]
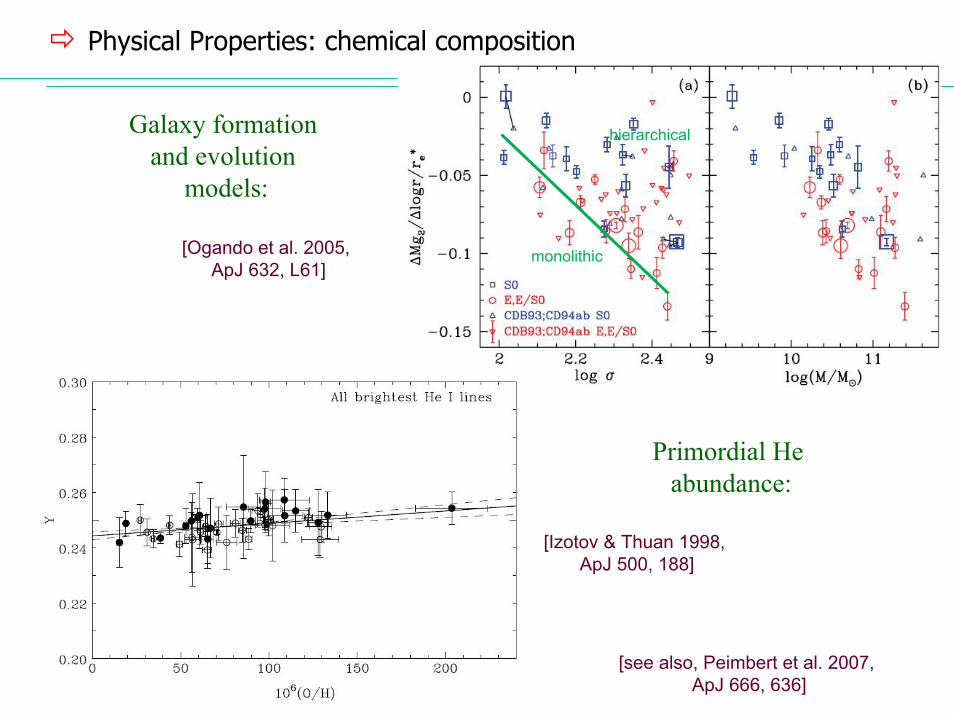
Physical Properties: chemical composition
Galaxy formation and evolution
models:
[Ogando et al. 2005, ApJ 632, L61]
monolithic
hierarchical
Primordial He abundance:
[Izotov & Thuan 1998, ApJ 500, 188]
[see also, Peimbert et al. 2007, ApJ 666, 636]
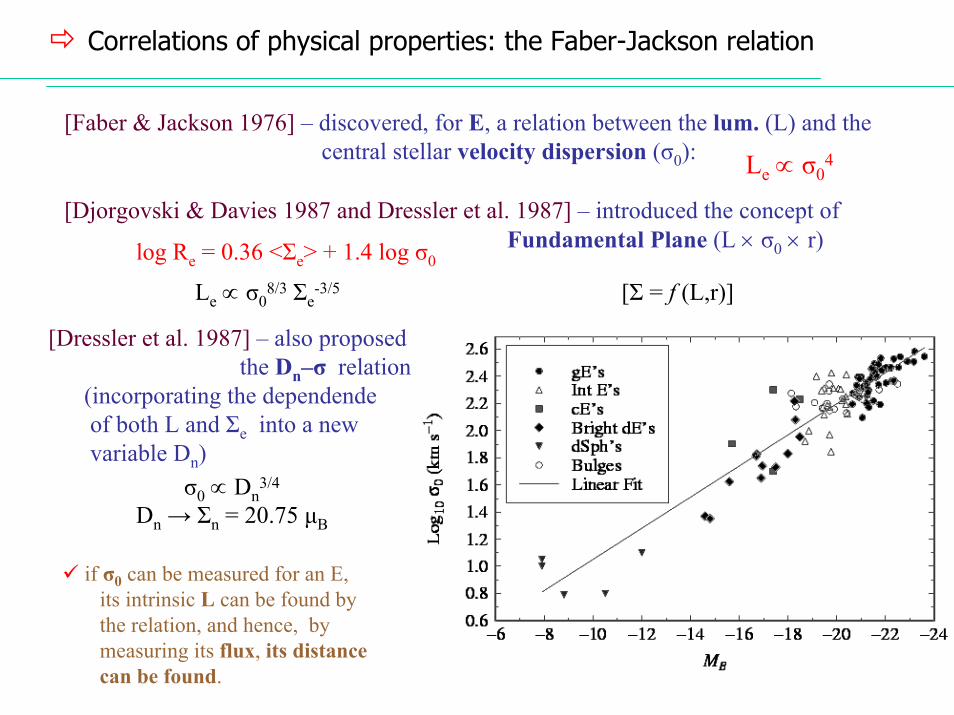
Correlations of physical properties: the Faber-Jackson relation
[Faber & Jackson 1976] – discovered, for E, a relation between the lum. (L) and the central stellar velocity dispersion (σ0): Le ∝ σ0
4
[Djorgovski & Davies 1987 and Dressler et al. 1987] – introduced the concept of Fundamental Plane (L × σ0 × r)log Re = 0.36 <Σe> + 1.4 log σ0
Le ∝ σ08/3 Σe
-3/5 [Σ = f (L,r)]
if σ0 can be measured for an E,its intrinsic L can be found bythe relation, and hence, by measuring its flux, its distancecan be found.
[Dressler et al. 1987] – also proposedthe Dn–σ relation
(incorporating the dependendeof both L and Σe into a newvariable Dn)
σ0 ∝ Dn3/4
Dn → Σn = 20.75 µB
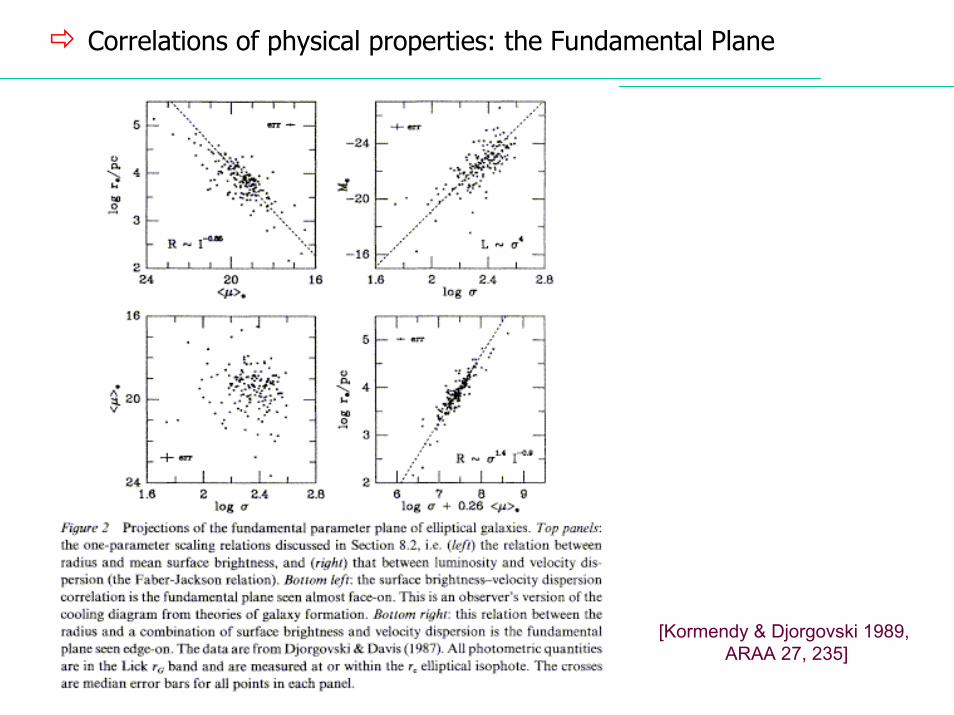
Correlations of physical properties: the Fundamental Plane
[Kormendy & Djorgovski 1989, ARAA 27, 235]
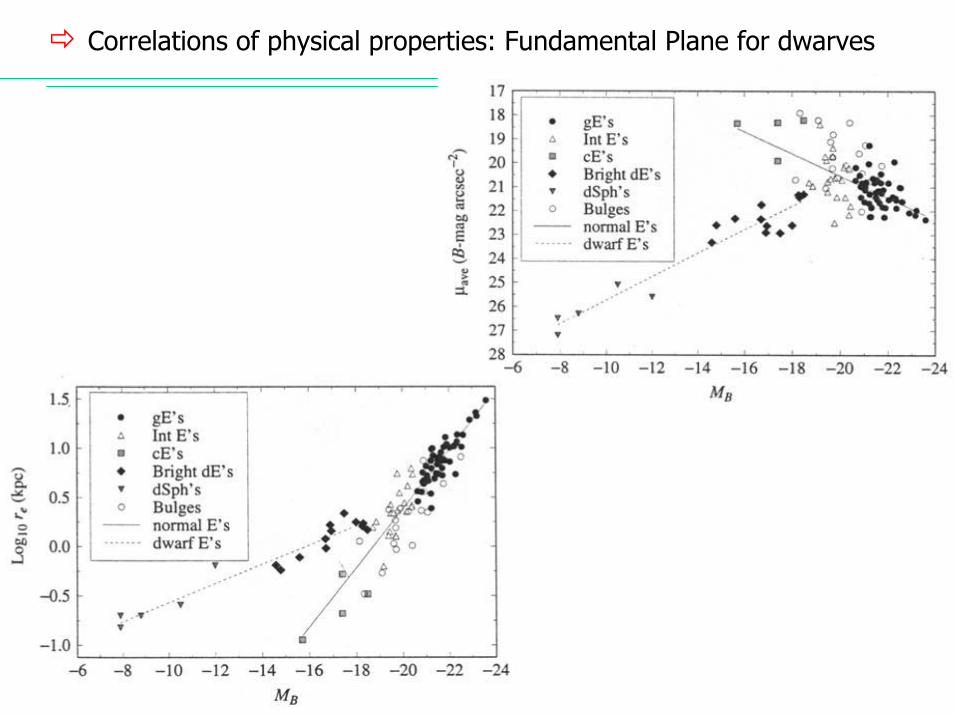
Correlations of physical properties: Fundamental Plane for dwarves

Correlations of physical properties: the Tully-Fisher relation
[Tully & Fisher 1977] – discovered, for S, a relation between the lum. (L) and thewidth of the 21-cm HI line profile (that is related to themaximum rotation velocity – Doppler broadening).LB ∝ Wα α = 2.5
if W can be measured for an S,its intrinsic L can be found bythe relation, and hence, by measuring its flux, its distancecan be found.
[Aaronson & Mould 1983] – α = 3.5 (B band)α = 4.3 (H band)
[Aaronson, Huchra & Mould 1979] – in the IR, the Tully-Fisher relation is more tightly correlated

References:
Papers and books:
E.P. Hubble 1930, ApJ 71, 231M. Humason 1936, ApJ 83, 10W. Baade 1940, ApJ 100, 137G. De Vaucouleurs 1948, Ann. Astrophys. 11, 247J.–L. Sersic 1968, “Atlas de Galaxias Australes” (Cordoba, Obs. Astronomico)K.C. Freeman 1970, ApJ 160, 811M. Disney 1976, Nature 263, 573S.M. Faber & R.E. Jackson 1976, ApJ 204, 668B. Tully & J.R. Fisher 1977, A&A 54, 661 M. Aaronson, J. Huchra & J. Mould 1979, ApJ 229, 1M. Aaronson & J. Mould 1983, ApJ 265, 1S. Djorgovski & M. Davis 1987, ApJ 313, 59A. Dressler et al. 1987, ApJ 313, 42P.C. van der Kruit 1989, In: “The Milky Way as a Galaxy”, eds. R. Buser & I. KingI. Trujillo et al. 2001, MNRAS 326, 869K. Rakos et al. 2003, Ap&SS, 284, 803J. Moustakas & R. Kennicutt 2006, ApJ 651, 155


![ENVIRONMENTAL PROPERTIES OF z~[1-3] AGN AND STARFORMING GALAXIES:](https://static.fdocuments.in/doc/165x107/56813224550346895d988756/environmental-properties-of-z1-3-agn-and-starforming-galaxies.jpg)


