Lecture 1a: Pulverised coal combustion carbon capture … · Lecture 1a: Pulverised coal combustion...
31
Lecture 1a: Pulverised coal combustion carbon capture and storage, GHG reduction and oxyfuel technology APP OFWG capacity building course, Thurs/Friday 5/6 February, 2009 Korean Electrical Power Research Institute (KEPRI), Daejeon, Korea Professor Terry Wall OFWG Project Leader and University of Newcastle, Australia
Transcript of Lecture 1a: Pulverised coal combustion carbon capture … · Lecture 1a: Pulverised coal combustion...

Lecture 1a: Pulverised coal combustion carbon capture and storage, GHG reduction and oxyfuel
technology
APP OFWG capacity building course, Thurs/Friday 5/6 February, 2009Korean Electrical Power Research Institute (KEPRI), Daejeon, Korea
Professor Terry Wall
OFWG Project Leader and University of Newcastle, Australia

Content
CCS technology comparisons
Carbon avoidance costs
Oxyfuel technology status
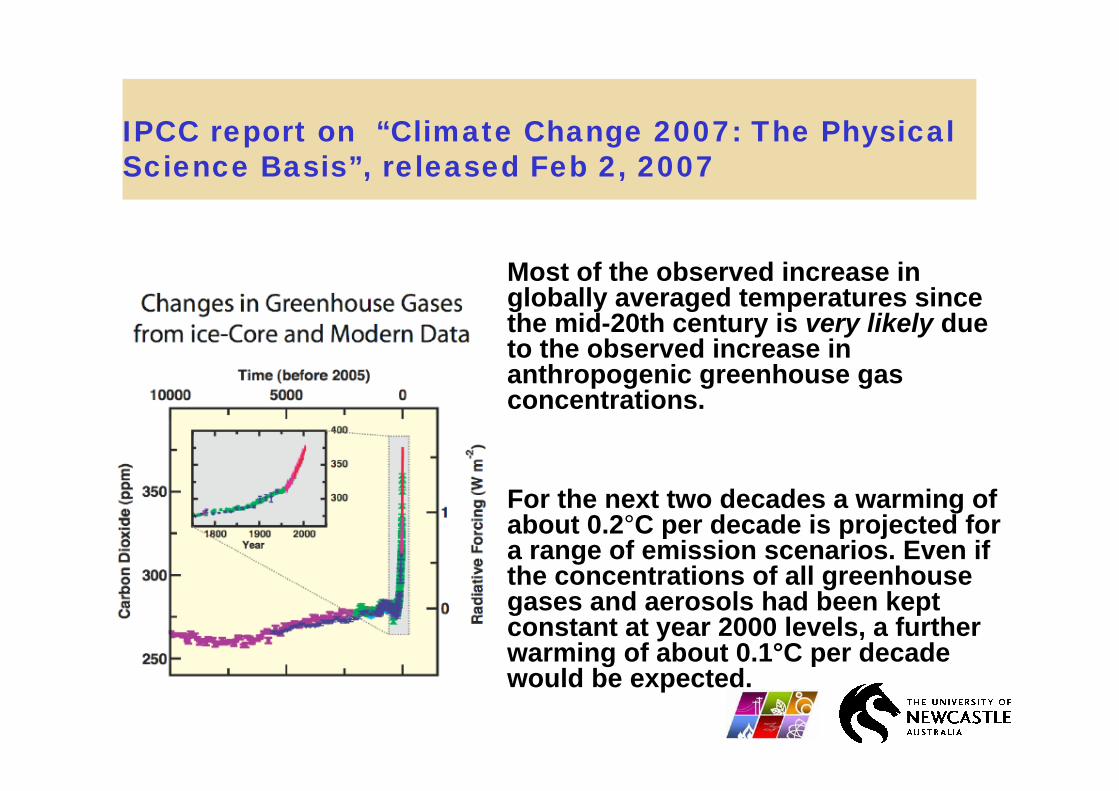
IPCC report on “Climate Change 2007: The Physical Science Basis”, released Feb 2, 2007
Most of the observed increase in globally averaged temperatures since the mid-20th century is very likely due to the observed increase in anthropogenic greenhouse gas concentrations.
For the next two decades a warming of about 0.2°C per decade is projected for a range of emission scenarios. Even if the concentrations of all greenhouse gases and aerosols had been kept constant at year 2000 levels, a further warming of about 0.1°C per decade would be expected.
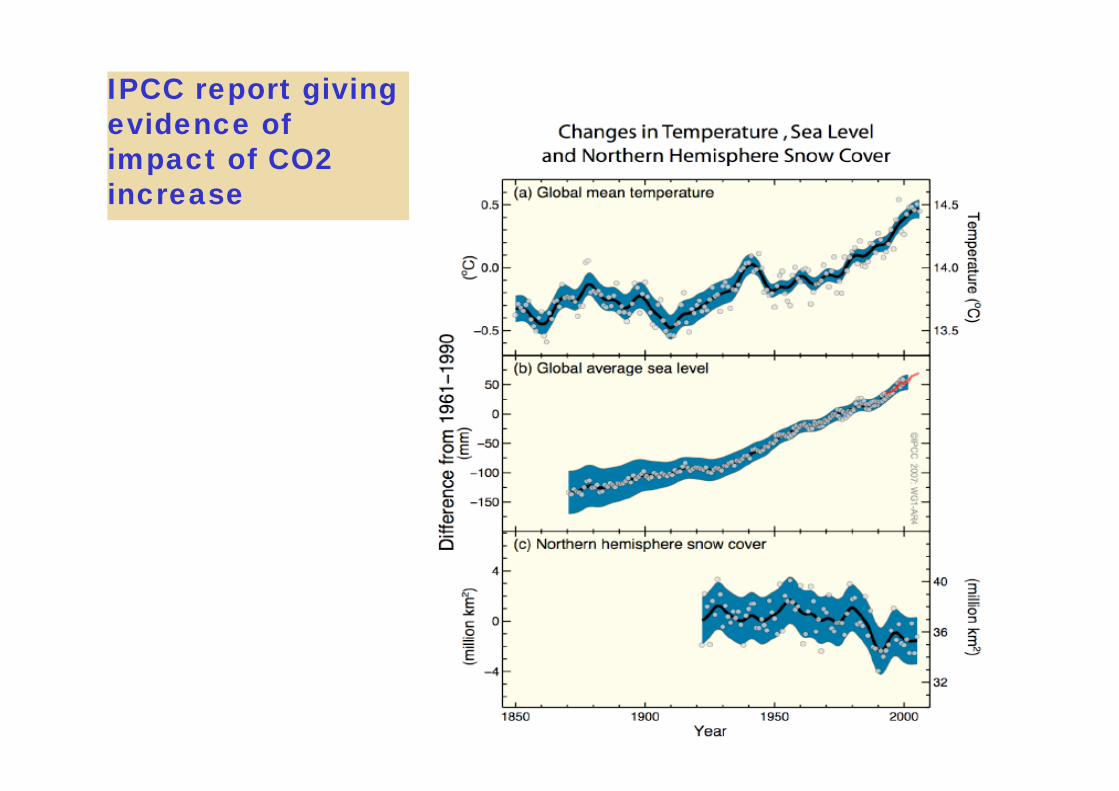
IPCC report giving evidence of impact of CO2 increase
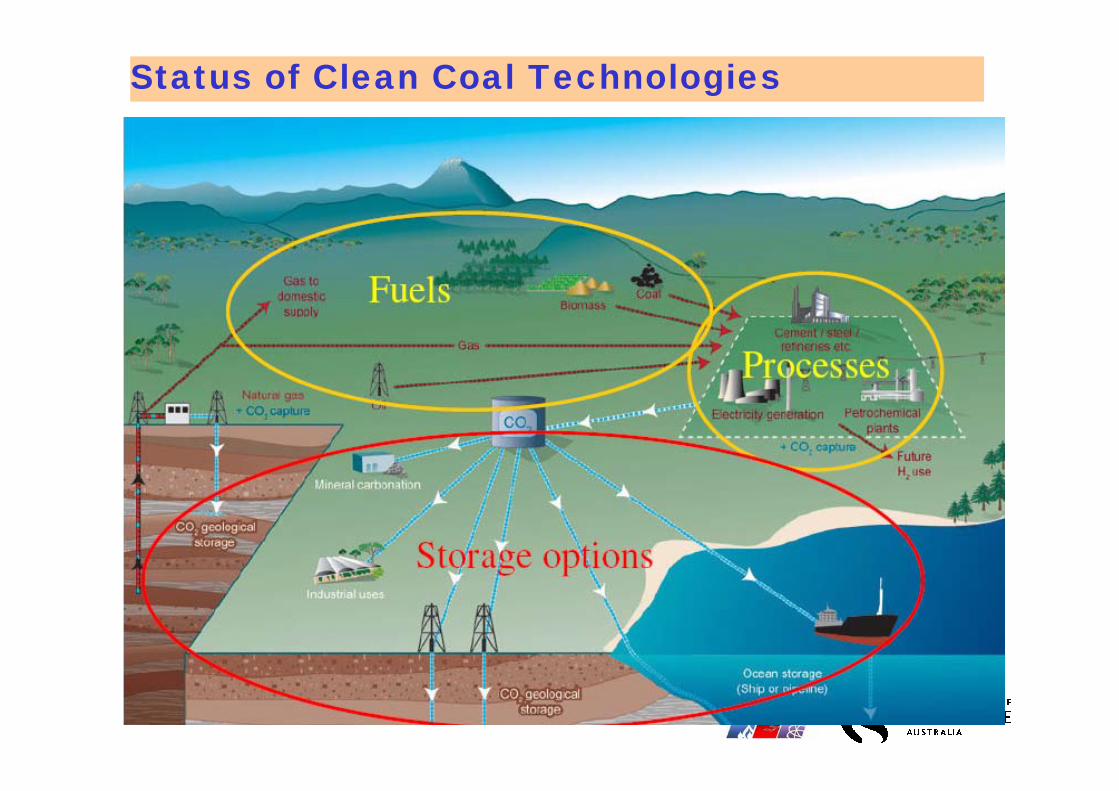
Status of Clean Coal Technologies

Reports other than IPCC
IEA CCS technology costs, 2003-5
Stern Report, 2007 – act now or costs greater later
MIT coal report, 2007 – coal needs CCS
McKinsey Report, 2007 – CCS costs in context
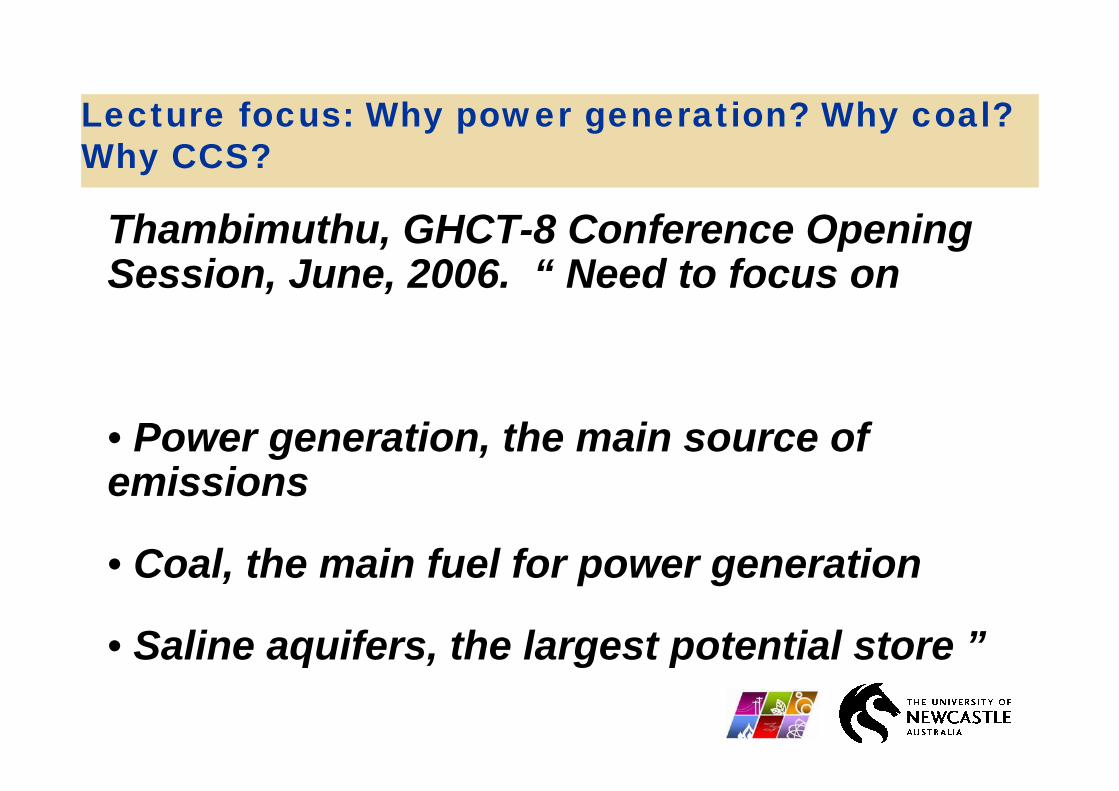
Lecture focus: Why power generation? Why coal? Why CCS?
Thambimuthu, GHCT-8 Conference Opening Session, June, 2006. “ Need to focus on
• Power generation, the main source of emissions
• Coal, the main fuel for power generation
• Saline aquifers, the largest potential store ”

CO2 storage capacity
Capacity
• In highly prospective and prospective areas, suitable saline aquifer formations, oil or gas fields, or coal beds, at least
• 2,000 GtCO2 ~ 150 years of worldwide CO2 from large stationary sources
Matching CO2 sources and storage sinks
• 30-60% of CO2 emissions from electricity generation and 30-40% of those from industry would be suitable for capture in the future
• IPCC study uses 1-8 US$/tCO2 for 250 km transport

Clean coal technologies in prospect, what is their status, and when might they be implemented?
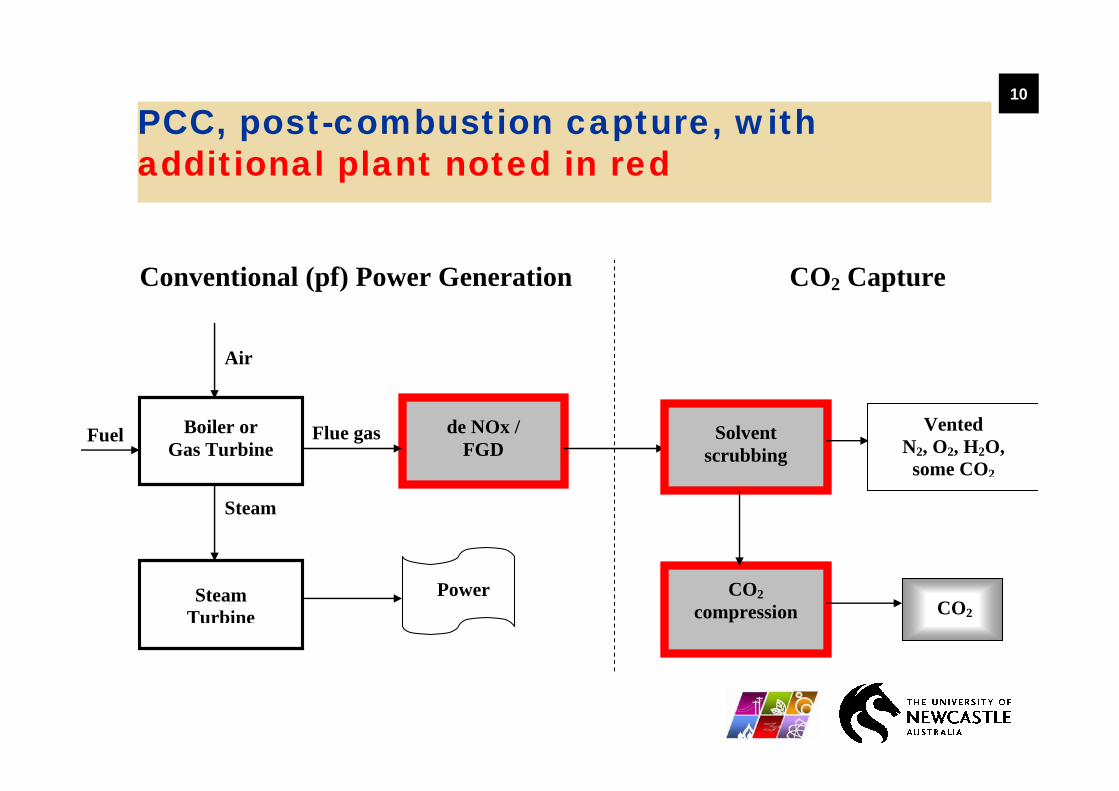
……. PCC: CO2 capture by scrubbing of the flue gas, here called post-combustion capture
IGCC-CCS: Integrated gasification combined cycle (IGCC) with a shift reactor to convert CO to CO2, which is often called pre-combustion capture
Oxyf: Oxy-fuel combustion, with combustion in oxygen rather than air
The first generation technologies – the most advanced
10
PCC, post-combustion capture, withadditional plant noted in red
Conventional (pf) Power Generation CO2 Capture
Boiler or Gas Turbine
de NOx / FGD
Steam Turbine
Solvent scrubbing
Steam
Air
Fuel
Power CO2 compression CO2
Vented N2, O2, H2O,
some CO2
Flue gas
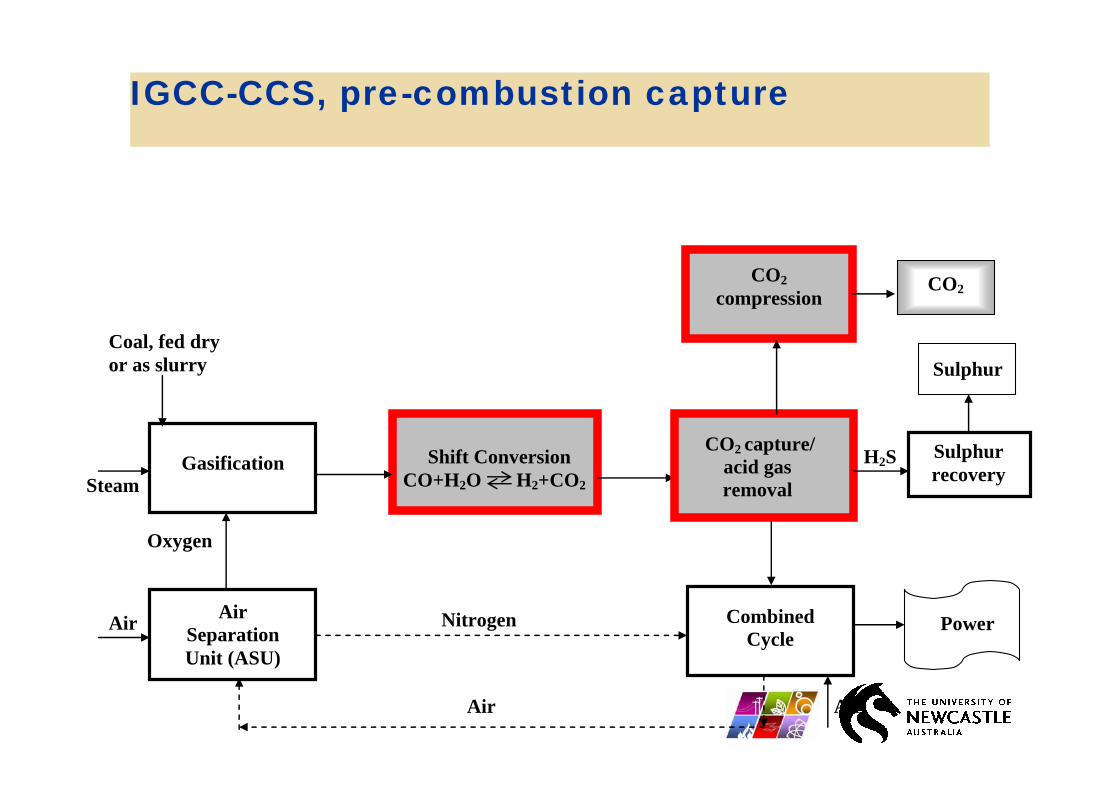
IGCC-CCS, pre-combustion capture
Gasification Shift Conversion CO+H2O H2+CO2
Air Separation Unit (ASU)
CO2 capture/ acid gas removal
Oxygen
Steam
Sulphur recovery
CO2 compression
Coal, fed dry or as slurry
H2S
CO2
Combined Cycle
Nitrogen Air Power
Air
Sulphur
Air

Oxy- fuel
Boiler or Gas Turbine
Ash removal / cooler /
condenser / FGD
Steam Turbine
Purification / compression
Steam
Oxygen
Fuel
Power
CO2 (SO2)
CO2 –rich Flue Gas
Air Separation unit (ASU)
Air
Recycled Flue Gas (RFG)
Nitrogen
Conc. Stream of CO2
Vent

Status: Examples of operating plants, www.co2captureandstorage.info
X*
X
X
X*
Coal
XXWeyburn*, Sleipner, In SalahStorage
XXKimberlinaOxyfX
X
X
4 power plants- USA, EU
Many refineries
IGCC
Storage
X
Capture
XWarrier Run*, Chiba*, Bellingham
PCC
PowerLocation Technology
Status: Some demonstrations of coal-fired integrated plants
2012
2014
2012
Futuregen (USA), 275 MWe
RWE (Germany), 400-450 MWe
Stanwell (Australia), 200 MWe
IGCC-CCS
2008
2009
Vattenfall (Germany), 30 MWt
Callide (Australia), 30 MWe
Oxyf
Post - 2009RWE (Germany)PCC

CCS options, with desirable characteristics indicated X
Demonstrated
XXOxyf
XIGCC-CCS
XXXPCC
Gives H2
No CO2capture
No O2supply
Can be applied to
slip-stream
For retrofit
Option

Zero emission technology (ZET) targets and CO2release
Emissions, from IEA (2005)
SO2 – 98-99 % removalNOx – 25-50 mg/m3Particulates – 1-10 mg/m3
CO2 release, g/kWh, from IEA technology reports (2003-2005)
Pf+FGD, without capture 710-910
PCC 117IGCC-CCS, dry 142IGCC-CCS, slurry 152Oxyfuel 92

Efficiency comparisons with and without capture, neglecting transport and storage
0
5
10
15
20
25
30
35
40
45
50
PCC IGCC-CCSslurry
IGCC-CCSdry
Oxyf
Technology
Effic
ienc
y, %
LH
V
With CCS
PCC IGCC IGCC Oxyf
-slurry -dry
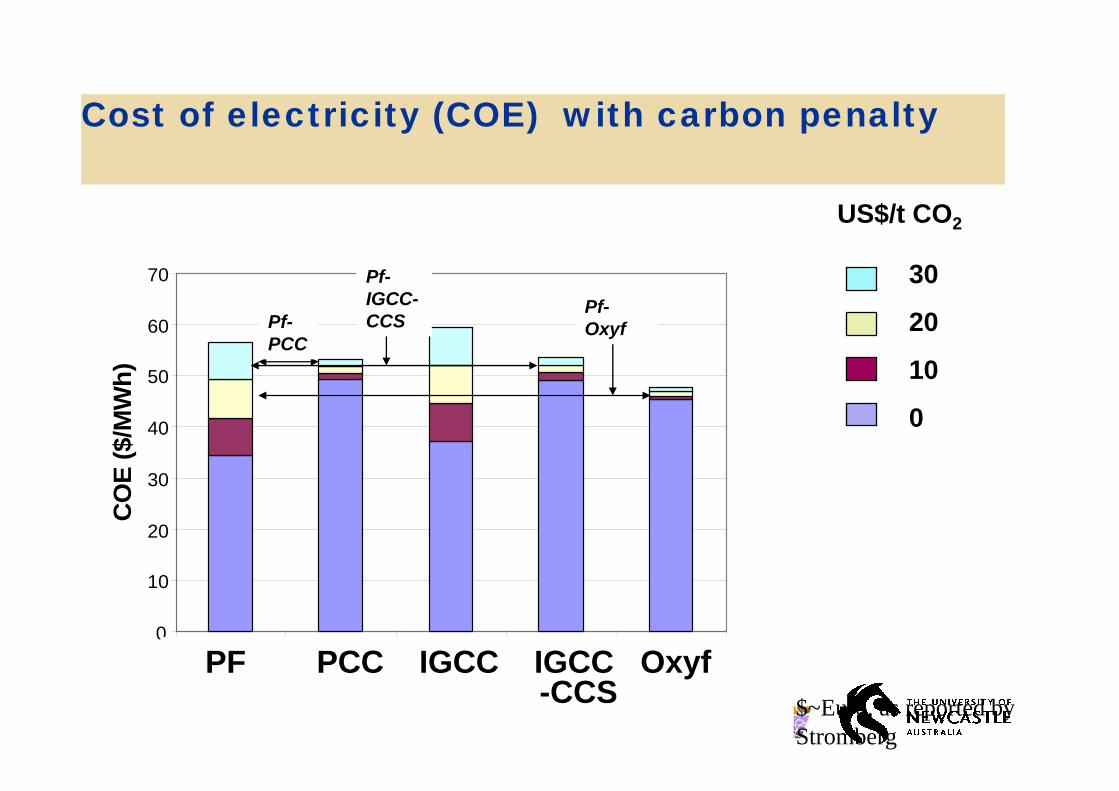
Cost of electricity (COE) with carbon penalty
0
10
20
30
40
50
60
70
Pf
PCC
IGCC IGCC-CCS Oxyf
Technology
CO
E ($
/MW
h) $30/t$20/t$10/tCOE
$~Euro, as reported by Stromberg
Pf-PCC
Pf-IGCC-CCS
Pf-Oxyf
PF PCC IGCC IGCC Oxyf-CCS
US$/t CO2
30
20
10
0
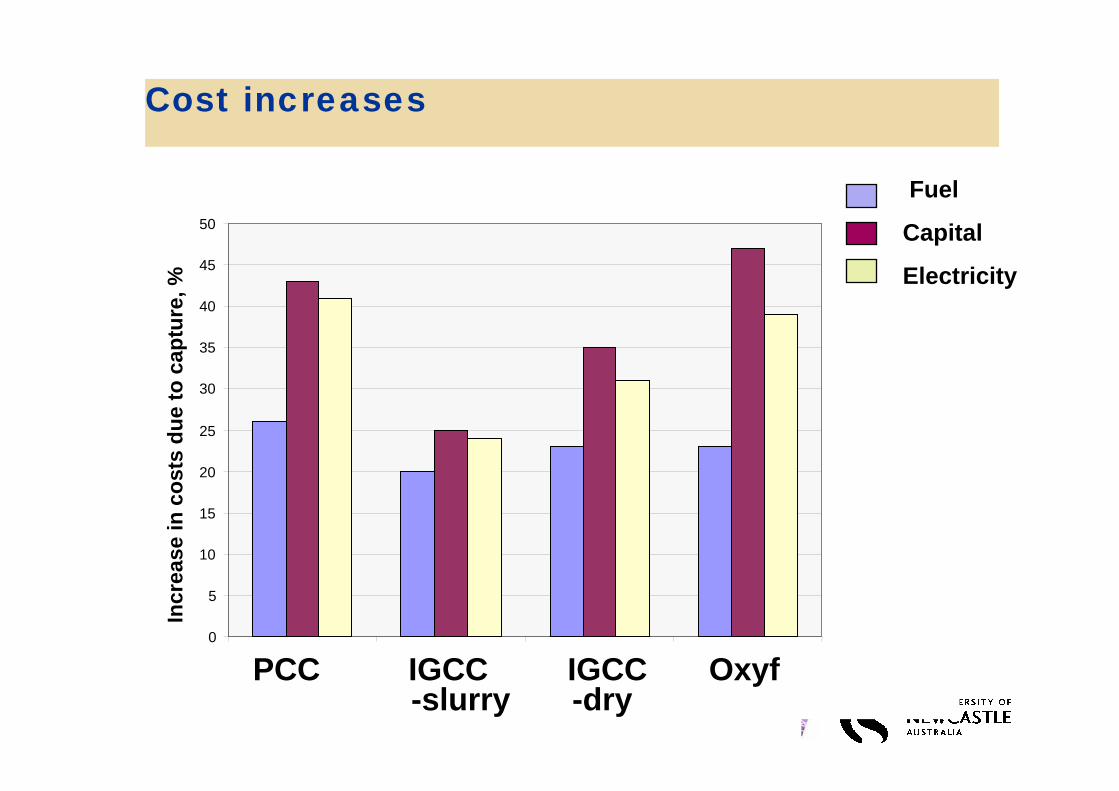
Cost increases
0
5
10
15
20
25
30
35
40
45
50
PCC IGCC-CCSslurry
IGCC-CCSdry
Oxyf
Technology
Incr
ease
in c
osts
due
to c
aptu
re, %
FuelCapitalElectricity
PCC IGCC IGCC Oxyf-slurry -dry
Fuel
Capital
Electricity
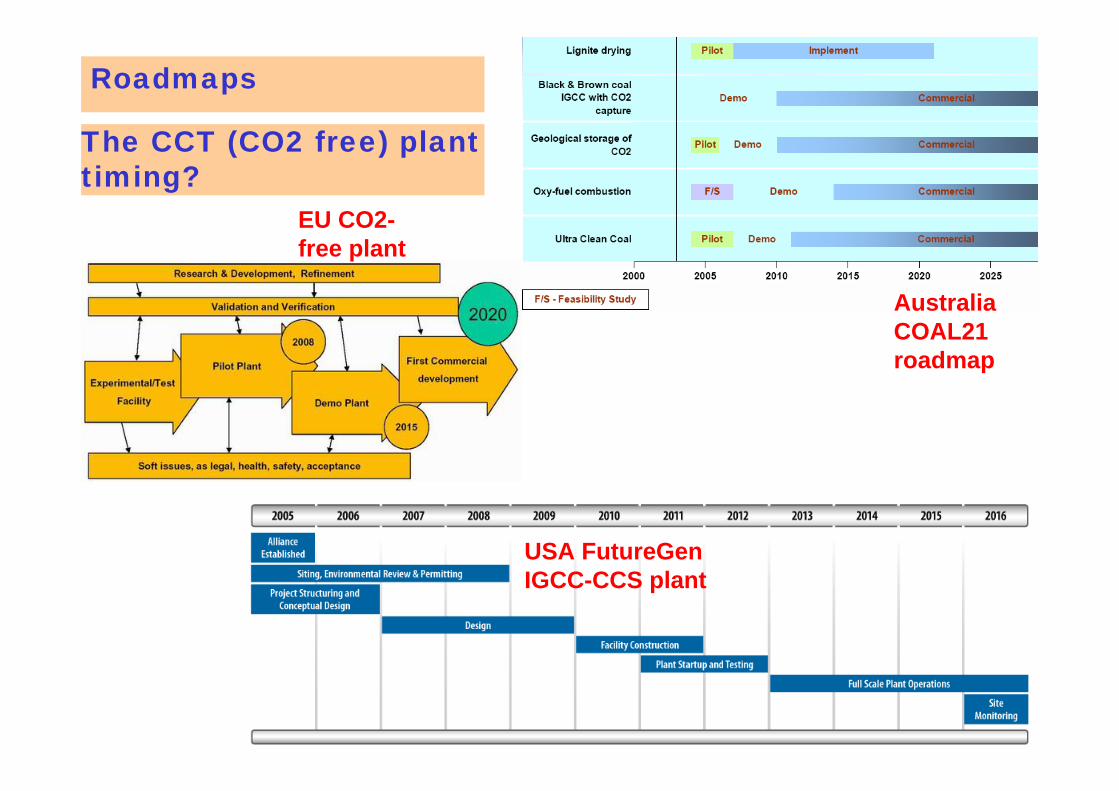
The CCT (CO2 free) plant timing?
EU CO2-free plant
Australia COAL21 roadmap
USA FutureGenIGCC-CCS plant
Roadmaps

CCS carbon avoidance costs – comparisons with other options

Global cost curve for GHG abatement opportunities in 2030 from McKinsey report commissioned by Vattenfall, January 2007

Marginal CO2 cost from McKinsey and global ppm from IPCC in 2050
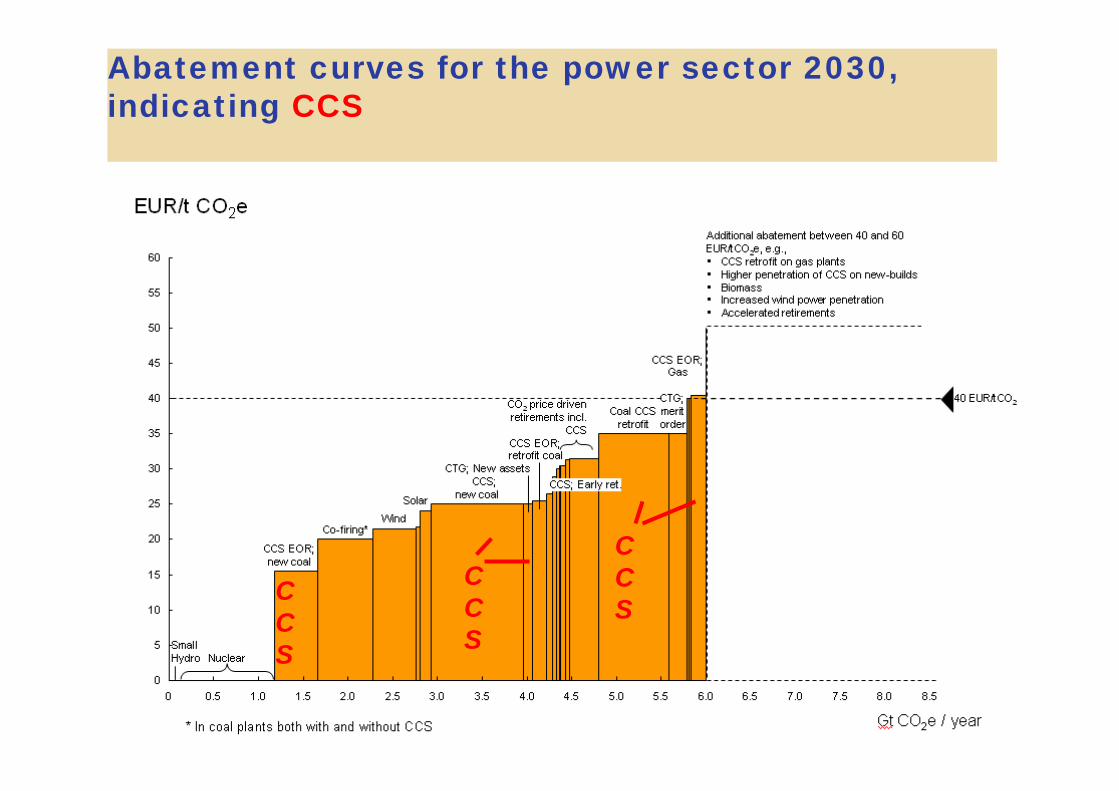
Abatement curves for the power sector 2030, indicating CCS
CCS
CCS
CCS

GHG global reductions in the power sector in 2030
Oxyfuel technology status
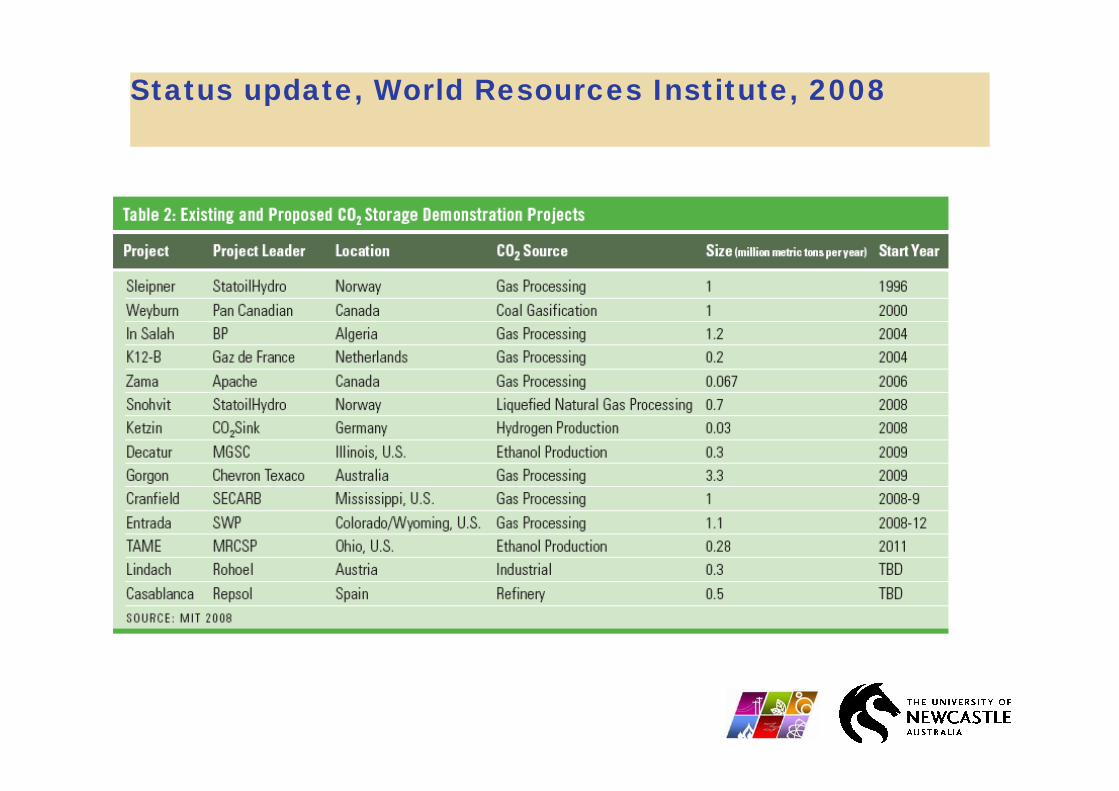
Status update, World Resources Institute, 2008

Pipeline gas quality, World Resources Institute, 2008
Pipeline type I Single use (eg future CCS)
II Multiple use
III Relaxed standard ( egWeyburn)

Costs,World Resources Institute,2008

Historical development of oxyfuel technology
Pearl Plant 22
ANL/BHP 0.2
ANL/EERC 1.0
IHI 0.5
IFRF 1.0
International Comb 11.7
CANMET 0.1
B&W/AL 0.4
JSIM/NEDO(Oil) 4.0
IVD-Stuttgart 0.2
PowerGen 0.3
Jupiter 6.7
0.2 RWE-NPOWER
ENEL 1.0
B&W 10
Callide A 30
Vattenfall 10
TOTAL(NG)10
Oxy-coal UK 13.3
CIUDEN 6.7CIUDEN 10
Jamestown 50
Vattenfall 250
Youngdong 100
Demonstration with CCS
Industrial scale without CCS
Pilot scale
0
1
10
100
1000
1980 1990 2000 2010 2020Year
MW
e (o
r MW
t/3)

IEA and G8 Workshop recommendation
“The G8 must act now to commit by 2010, to a diverse portfolio of at least 20 fully integrated industrial-scale demonstration projects (>1 Mtpa), with the expectation of supporting
technology learning and cost reduction, for the broad deployment of CCS by 2020”.
http://ccsassociation.org.uk/docs/2007/Press release on G8 workshop 29 Nov 2007.pdf
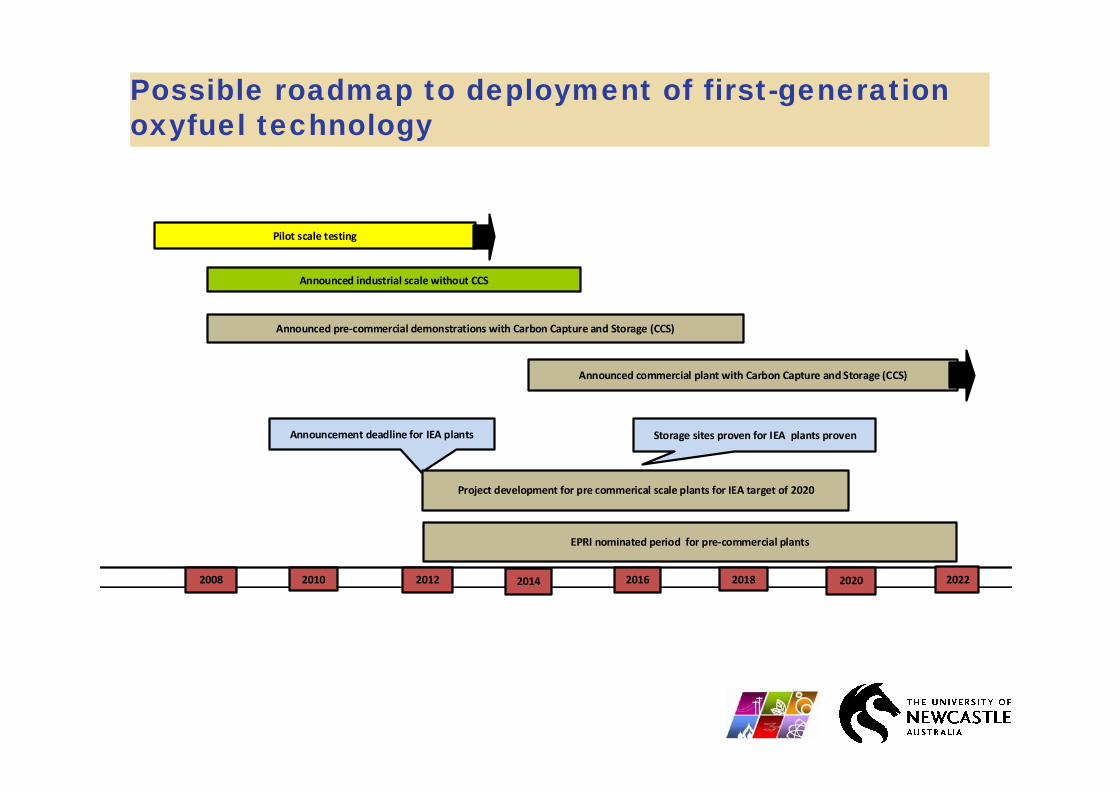
Possible roadmap to deployment of first-generation oxyfuel technology
2008 2010 2012 2014 2016 2018 2020
Pilot scale testing
Announced industrial scale without CCS
Announced pre‐commercial demonstrations with Carbon Capture and Storage (CCS)
Announcement deadline for IEA plants
Announced commercial plant with Carbon Capture and Storage (CCS)
Storage sites proven for IEA plants proven
2022
EPRI nominated period for pre‐commercial plants
Project development for pre commerical scale plants for IEA target of 2020


![Evaluation of a Flue Gas Desulphurisation (FGD)-Gypsum ... · Pulverised Coal Combustion (PCC) can be released as gas SeO. 2. and/ or as particulate Se [7-9]. However, when the flue](https://static.fdocuments.in/doc/165x107/5b2c82c07f8b9a163e8c0a9e/evaluation-of-a-flue-gas-desulphurisation-fgd-gypsum-pulverised-coal-combustion.jpg)