Lecture 16: Chapter 7, Section 2 Binomial Random Variables
32
©2011 Brooks/Cole, Cengage Learning Elementary Statistics: Looking at the Big Picture 1 Lecture 16: Chapter 7, Section 2 Binomial Random Variables Definition What if Events are Dependent? Center, Spread, Shape of Counts, Proportions Normal Approximation
Transcript of Lecture 16: Chapter 7, Section 2 Binomial Random Variables

©2011 Brooks/Cole, CengageLearning
Elementary Statistics: Looking at the Big Picture 1
Lecture 16: Chapter 7, Section 2Binomial Random Variables
DefinitionWhat if Events are Dependent?Center, Spread, Shape of Counts, ProportionsNormal Approximation

©2011 Brooks/Cole,Cengage Learning
Elementary Statistics: Looking at the Big Picture L16.2
Looking Back: Review
4 Stages of Statistics Data Production (discussed in Lectures 1-4) Displaying and Summarizing (Lectures 5-12) Probability
Finding Probabilities (discussed in Lectures 13-14) Random Variables (introduced in Lecture 15)
Binomial Normal
Sampling Distributions
Statistical Inference
©2011 Brooks/Cole,Cengage Learning
Elementary Statistics: Looking at the Big Picture L16.3
Definition (Review) Discrete Random Variable: one whose
possible values are finite or countablyinfinite (like the numbers 1, 2, 3, …)
Looking Ahead: To perform inference aboutcategorical variables, need to understandbehavior of sample proportion. A first step is tounderstand behavior of sample counts. We willeventually shift from discrete counts to a normalapproximation, which is continuous.

©2011 Brooks/Cole,Cengage Learning
Elementary Statistics: Looking at the Big Picture L16.4
DefinitionBinomial Random Variable counts sampled
individuals falling into particular category; Sample size n is fixed Each selection independent of others Just 2 possible values for each individual Each has same probability p of falling in
category of interest

©2011 Brooks/Cole,Cengage Learning
Elementary Statistics: Looking at the Big Picture L16.6
Example: A Simple Binomial Random Variable
Background: The random variable X is the count oftails in two flips of a coin.
Questions: Why is X binomial? What are n and p? Responses:
Sample size n fixed? Each selection independent of others? Just 2 possible values for each? Each has same probability p?
nancyp
Text Box
Practice: 7.24 p.307

©2011 Brooks/Cole,Cengage Learning
Elementary Statistics: Looking at the Big Picture L16.8
Example: A Simple Binomial Random Variable
Background: The random variable X is the count oftails in two flips of a coin.
Question: How do we display X? Response:
Looking Back: We already discussed and displayed this randomvariable when learning about probability distributions.
nancyp
Text Box
Practice: 7.32a p.308
©2011 Brooks/Cole,Cengage Learning
Elementary Statistics: Looking at the Big Picture L16.10
Example: Determining if R.V. is Binomial
Background: Consider following R.V.: Pick card from deck of 52, replace, pick another.
X=no. of cards picked until you get ace. Question: Is X binomial? Response:
nancyp
Text Box
Practice: 7.25b p.307

©2011 Brooks/Cole,Cengage Learning
Elementary Statistics: Looking at the Big Picture L16.12
Example: Determining if R.V. is Binomial
Background: Consider following R.V.: Pick 16 cards without replacement from deck of
52. X=no. of red cards picked. Question: Is X binomial? Response:
nancyp
Text Box
Practice: 7.25d p.307

©2011 Brooks/Cole,Cengage Learning
Elementary Statistics: Looking at the Big Picture L16.14
Example: Determining if R.V. is Binomial
Background: Consider following R.V.: Pick 16 cards with replacement from deck of 52.
W=no. of clubs, X=no. of diamonds, Y=no. ofhearts, Z=no. of spades. Goal is to report howfrequently each suit is picked.
Question: Are W, X, Y, Z binomial? Response:
nancyp
Text Box
Practice: 7.25a p.307

©2011 Brooks/Cole,Cengage Learning
Elementary Statistics: Looking at the Big Picture L16.16
Example: Determining if R.V. is Binomial
Background: Consider following R.V.: Pick with replacement from German deck of 32
(doesn’t include numbers 2-6), then from deck of52, back to deck of 32, etc. for 16 selectionsaltogether. X=no. of aces picked.
Question: Is X binomial? Response:

©2011 Brooks/Cole,Cengage Learning
Elementary Statistics: Looking at the Big Picture L16.18
Example: Determining if R.V. is Binomial
Background: Consider following R.V.: Pick 16 cards with replacement from deck of 52.
X=no. of hearts picked. Question: Is X binomial? Response:
fixed n = 16 selections independent (with replacement) just 2 possible values (heart or not) same p = 0.25 for all selections____
nancyp
Text Box
Practice: 7.25c p.307

©2011 Brooks/Cole,Cengage Learning
Elementary Statistics: Looking at the Big Picture L16.19
Requirement of IndependenceSnag: Binomial theory requires independence Actual sampling done without replacement
so selections are dependentResolution: When sampling without
replacement, selections are approximatelyindependent if population is at least 10n.

©2011 Brooks/Cole,Cengage Learning
Elementary Statistics: Looking at the Big Picture L16.21
Example: A Binomial Probability Problem
Background: The proportion of Americanswho are left-handed is 0.10. Of 44 presidents,7 have been left-handed (proportion 0.16).
Question: How can we establish if beingleft-handed predisposes someone to bepresident?
Response: Determine if 7 out of 44 (0.16) is_______________ when sampling at randomfrom a population where 0.10 fall in thecategory of interest.
nancyp
Text Box
Practice: 7.74 p.338

©2011 Brooks/Cole,Cengage Learning
Elementary Statistics: Looking at the Big Picture L16.22
Solving Binomial Probability Problems Use binomial formula or tables
Only practical for small sample sizes Use software
Won’t take this approach until later Use normal approximation for count X
Not quite: more interested in proportions Use normal approximation for proportion
Need mean and standard deviation…

©2011 Brooks/Cole,Cengage Learning
Elementary Statistics: Looking at the Big Picture L16.24
Example: Mean of Binomial Count, Proportion
Background: Based on long-run observedoutcomes, probability of being left-handed isapprox. 0.1. Randomly sample 100 people.
Questions: On average, what should be the count of lefties? proportion of lefties?
Responses: On average, we should get count of lefties _____ proportion of lefties _____
nancyp
Text Box
Practice: 7.27 p.308

©2011 Brooks/Cole,Cengage Learning
Elementary Statistics: Looking at the Big Picture L16.25
Mean and S.D. of Counts, ProportionsCount X binomial with parameters n, p has: Mean Standard deviationSample proportion has: Mean Standard deviation
Looking Back: Formulas for s.d. require independence:population at least 10n.

©2011 Brooks/Cole,Cengage Learning
Elementary Statistics: Looking at the Big Picture L16.27
Example: Standard Deviation of Sample Count
Background: Probability of being left-handedis approx. 0.1. Randomly sample 100 people.Sample count has mean 100(0.1)= 10,standard deviation
Question: How do we interpret these? Response: On average, expect
sample count =____ lefties.Counts vary; typical distance from 10 is ____.
nancyp
Text Box
Practice: 7.29c-d p.308

©2011 Brooks/Cole,Cengage Learning
Elementary Statistics: Looking at the Big Picture L16.29
Example: S.D. of Sample Proportion
Background: Probability of being left-handedis approx. 01. Randomly sample 100 people.Sample proportion has mean 0.l, standarddeviation
Question: How do we interpret these? Response: On average, expect
sample proportion = ____ lefties.Proportions vary; typical distance from 0.1 is
____
nancyp
Text Box
Practice: 7.29g-h p.308

©2011 Brooks/Cole,Cengage Learning
Elementary Statistics: Looking at the Big Picture L16.31
Example: Role of Sample Size in Spread
Background: Consider proportion of tails invarious sample sizes n of coinflips.
Questions: What is the standard deviation for n=1? n=4? n=16?
Responses: n=1: s.d.= n=4: s.d.= n=16: s.d.=
A Closer Look: Due to n in the denominator of formula for standarddeviation, spread of sample proportion____________ as n increases.
nancyp
Text Box
Practice: 7.34b p.309

©2011 Brooks/Cole,Cengage Learning
Elementary Statistics: Looking at the Big Picture L16.32
Shape of Distribution of Count, ProportionBinomial count X or proportion for
repeated random samples has shapeapproximately normal if samples are largeenough to offset underlying skewness.(Central Limit Theorem)
For a given sample size n, shapes are identicalfor count and proportion.
©2011 Brooks/Cole,Cengage Learning
Elementary Statistics: Looking at the Big Picture L16.34
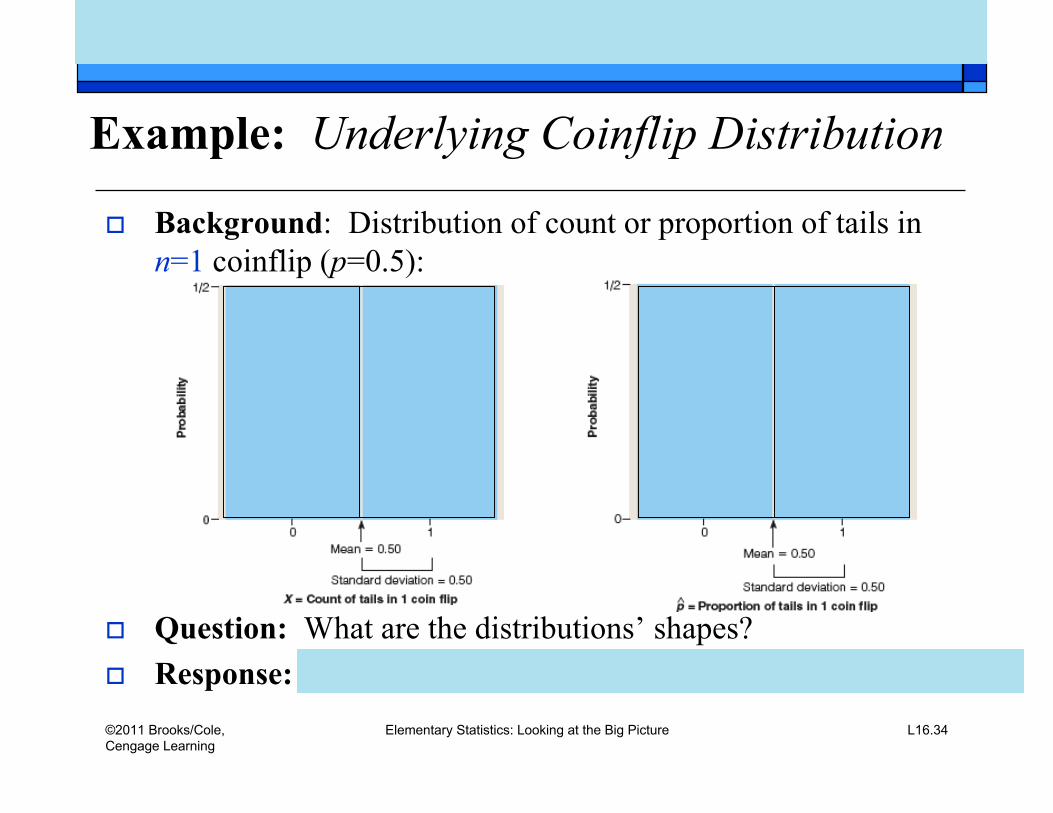
Example: Underlying Coinflip Distribution
Background: Distribution of count or proportion of tails inn=1 coinflip (p=0.5):
Question: What are the distributions’ shapes? Response:
nancyp
Text Box
Practice: 7.32a p.308

©2011 Brooks/Cole,Cengage Learning
Elementary Statistics: Looking at the Big Picture L16.36
Example: Distribution for 4 Coinflips
Background: Distribution of count or proportion of tails in n=4coinflips (p=0.5):
Question: What are the distributions’ shapes? Response:
nancyp
Text Box
Practice: 7.32b p.308

©2011 Brooks/Cole,Cengage Learning
Elementary Statistics: Looking at the Big Picture L16.37
Shift from Counts to Proportions Binomial Theory begins with counts Inference will be about proportions

©2011 Brooks/Cole,Cengage Learning
Elementary Statistics: Looking at the Big Picture L16.39
Example: Distribution of for 16 Coinflips
Background: Distribution of proportion of tails in n=16coinflips (p=0.5):
Question: What is the shape? Response:
nancyp
Text Box
Practice: 7.34c p.309

©2011 Brooks/Cole,Cengage Learning
Elementary Statistics: Looking at the Big Picture L16.41
Example:Underlying Distribution of Lefties
Background: Distribution of proportion of lefties (p=0.1)for samples of n=1:
Question: What is the shape? Response:

©2011 Brooks/Cole,Cengage Learning
Elementary Statistics: Looking at the Big Picture L16.43
Example: Dist of of Lefties for n= 16
Background: Distribution of proportion of lefties (p=0.1)for n=16:
Question: What is the shape? Response:
nancyp
Text Box
Practice: 7.32c p.309

©2011 Brooks/Cole,Cengage Learning
Elementary Statistics: Looking at the Big Picture L16.45
Example: Dist of of Lefties for n=100
Background: Distribution of proportion of lefties (p=0.1)for n=100:
Question: What is the shape? Response:
nancyp
Text Box
Practice: 7.35a-b p.309

©2011 Brooks/Cole,Cengage Learning
Elementary Statistics: Looking at the Big Picture L14.46
Rule of Thumb:Sample Proportion Approximately Normal
Distribution of is approximately normal if sample size n islarge enough relative to shape, determined by populationproportion p.
Require and
Together, these require us to have larger n for p close to 0 or 1(underlying distribution skewed right or left).

©2011 Brooks/Cole,Cengage Learning
Elementary Statistics: Looking at the Big Picture L16.48
Example: Applying Rule of Thumb
Background: Consider distribution of sampleproportion for various n and p:
n=4, p=0.5; n=20, p=0.5; n=20, p=0.1; n=20, p=0.9; n=100, p=0. Question: Is shape approximately normal? Response: Normal?
n=4, p=0.5 n=20, p=0.5 n=20, p=0.1 n=20, p=0.9 n=100, p=0.1[np=100(0.1)=10, n(1-p)=100(0.9)=90 both ≥ 10]
________ [np=4(0.5)=2<10]________ [np=20(0.5)=10=n(1-p)] No [________________________] No [________________________]________
nancyp
Text Box
Practice: 7.38 p.310

©2011 Brooks/Cole,Cengage Learning
Elementary Statistics: Looking at the Big Picture L16.50
Example: Solving the Left-handed Problem
Background: The proportion of Americans who are lefties is0.1. Consider P( ≥7/44=0.16) for a sample of 44 presidents.
Question: Can we use a normal approximation to find theprobability that at least 7 of 44 (0.16) are left-handed?
Response:
Prob
abili
ty
0.
0.
Actualprobabilityis 0.15
Approximatedprobability is0.10.
0.1 0.160.16
nancyp
Text Box
Practice: 7.35b p.309

©2011 Brooks/Cole,Cengage Learning
Elementary Statistics: Looking at the Big Picture L14.52
Example: From Count to Proportion and ViceVersa
Background: Consider these reports: In a sample of 87 assaults on police, 23 used weapons. 0.44 in sample of 25 bankruptcies were due to med. bills
Question: In each case, what are n, X, and ? Response:
First has n = ____, X = ____, = _____ Second has n = ____, = _____, X = __________
nancyp
Text Box
Practice: 7.29a-b p.308

©2011 Brooks/Cole,Cengage Learning
Elementary Statistics: Looking at the Big Picture L14.53
Lecture Summary(Binomial Random Variables)
Definition; 4 requirements for binomial R.V.s that do or don’t conform to requirements Relaxing requirement of independence Binomial counts, proportions
Mean Standard deviation Shape
Normal approximation to binomial