LECTURE 15 MEASUREMENT AND BEHAVIOR OF REAL GDP … · Nominal GDP • Nominal GDP: The market...
40
Economics 2 Professor Christina Romer Spring 2018 Professor David Romer LECTURE 15 MEASUREMENT AND BEHAVIOR OF REAL GDP March 8, 2018 I. MACROECONOMICS VERSUS MICROECONOMICS II. REAL GDP A. Definition B. Nominal GDP and real GDP C. A little about measuring GDP D. Facts 1. Strong upward trend 2. Huge differences across countries 3. Short-run fluctuations III. INFLATION A. Measurement B. Facts C. Why do we care about inflation? D. Adjusting for price changes E. Quality changes and new goods in calculating inflation IV. OVERVIEW OF MACRO FRAMEWORK AND LONG-RUN GROWTH A. Long-run trend and short-run fluctuations in real GDP B. Potential Output (Y*) C. The three key determinants of potential output D. The long-run consequences of small differences in growth rates
Transcript of LECTURE 15 MEASUREMENT AND BEHAVIOR OF REAL GDP … · Nominal GDP • Nominal GDP: The market...

Economics 2 Professor Christina Romer Spring 2018 Professor David Romer
LECTURE 15
MEASUREMENT AND BEHAVIOR OF REAL GDP
March 8, 2018
I. MACROECONOMICS VERSUS MICROECONOMICS
II. REAL GDP
A. Definition
B. Nominal GDP and real GDP
C. A little about measuring GDP
D. Facts
1. Strong upward trend
2. Huge differences across countries
3. Short-run fluctuations
III. INFLATION
A. Measurement
B. Facts
C. Why do we care about inflation?
D. Adjusting for price changes
E. Quality changes and new goods in calculating inflation
IV. OVERVIEW OF MACRO FRAMEWORK AND LONG-RUN GROWTH
A. Long-run trend and short-run fluctuations in real GDP
B. Potential Output (Y*)
C. The three key determinants of potential output
D. The long-run consequences of small differences in growth rates

LECTURE 15 Measurement and Behavior of Real GDP
March 8, 2018
Economics 2 Christina Romer Spring 2018 David Romer

Announcements
• Research reading for Tuesday, March 13 (by William Nordhaus):
• Read only the assigned pages.
• Read for approach and findings; think about relevance for the measurement of inflation and growth in standards of living.

I. MACROECONOMICS VERSUS MICROECONOMICS
Macroeconomics
• Definition:
• The study of the aggregate economy.
• Concerned with:
• Total output.
• Aggregate price level and inflation.
• The unemployment rate.
• The overall level of interest rates; the exchange rate; overall exports and imports.

II. REAL GDP

Real Gross Domestic Product (Real GDP)
• The market value of the final goods and services newly produced in a country during some period of time, adjusted for price changes.
• Note: In general, “real” means adjusted for price changes.

Nominal GDP
• Nominal GDP: The market value of the final goods and services newly produced in a country during some period of time, not adjusted for price changes.
• Thus, for the United States, it is measured in dollars.
• Example: Nominal GDP in 2017 = ∑ Pi,2017 • Qi,2017,i
where i represents each possible good in the economy (and ∑ is the symbol for a sum).
• Note that we use 2017 prices in computing 2017 nominal GDP, 2016 prices in computing 2016 nominal GDP, ….
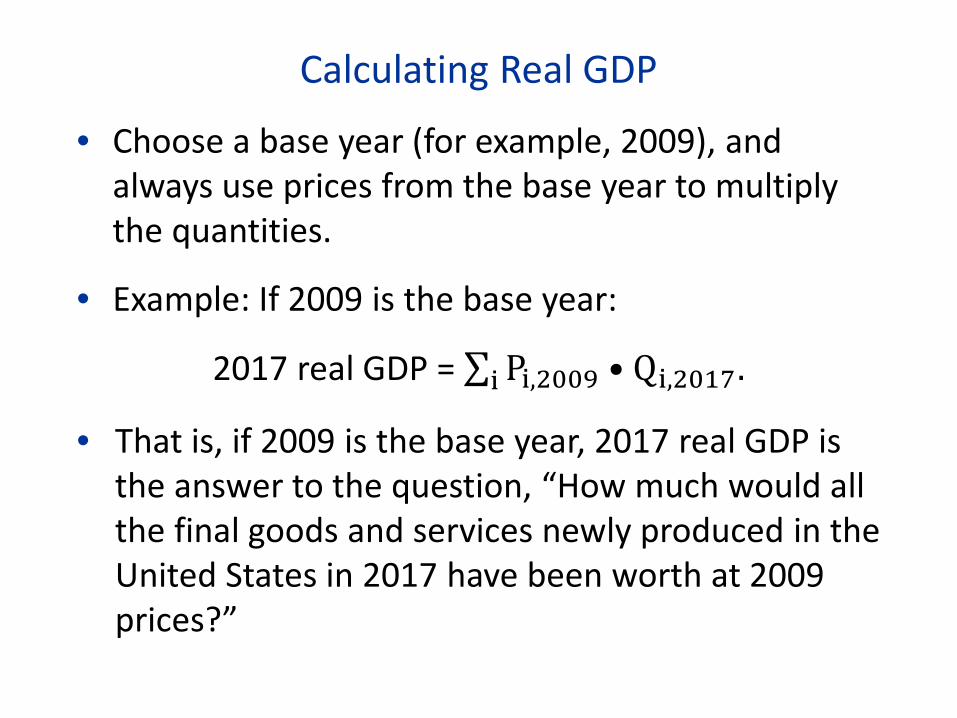
Calculating Real GDP
• Choose a base year (for example, 2009), and always use prices from the base year to multiply the quantities.
• Example: If 2009 is the base year:
2017 real GDP = ∑ Pi,2009 • Qi,2017.i
• That is, if 2009 is the base year, 2017 real GDP is the answer to the question, “How much would all the final goods and services newly produced in the United States in 2017 have been worth at 2009 prices?”

Growth Rate of Real GDP
• The percentage change in real GDP from one year to the next.

A Little about Measuring GDP
• Key points:
• Final goods and services.
• Newly produced.
• Within the country.
• In some period of time.

3 Approaches to Measuring GDP
• Expenditure: Use market prices and the quantities of final goods.
• Can divide into consumption (C), investment (I), government purchases (G), and net exports (NX).
• Production (value added): follow goods through each stage of production.
• Income: Income from producing new goods and services within the country.
• Can divide into labor income and capital income.

Real GDP in the United States, 1950–2017
Source: FRED (Federal Reserve Economic Data); data from Bureau of Economic Analysis.

Real GDP per Capita in the U.S., 1950–2017
Source: FRED; data from Bureau of Economic Analysis.

Real GDP per Capita over Time and Regions
Source: Bloom and Sachs, “Geography, Demography, and Economic Growth in Africa.”

U.S. Real GDP, 2004–2011
Source: FRED; data from Bureau of Economic Analysis.

U.S. Real GDP, 1929–1940
Source: FRED; data from Bureau of Economic Analysis.

U.S. Real GDP, 2011–2017
Source: FRED; data from Bureau of Economic Analysis.

The U.S. Unemployment Rate, 1948–2018
Source: FRED; data from Bureau of Labor Statistics.

III. INFLATION

Calculating the Consumer Price Index
• Choose a base year (for example, 1983), and find the basket of goods and services households purchased in 1983.
• Then the CPI in 2017 is:
CPI2017 = Price of 1983 market basket in 2017Price of 1983 market basket in 1983
• 100.
• That is, if 1983 is the base year, the 2017 CPI is the answer to the question, “By what ratio would households’ spending have to be higher in 2017 than it was in 1983 for them to buy the same things they bought in 1983?”

Calculating the Consumer Price Index—Algebra
• Choose a base year (for example, 1983), and always use quantities from the base year to multiply the prices.
• Then the CPI in 2017 is:
CPI2017 = ∑ Pi,2017 • Qi,1983i∑ Pi,1983 • Qi,1983i
• 100.

Inflation
• The percent change in a price index.
• Example: the inflation rate from 2016 to 2017 is:
π2017 = P2017 − P2016
P2016• 100.
• Note: If inflation is negative, we say there is “deflation.”

U.S. Inflation (Percent Change in the Price Index for Personal Consumption Expenditures), 1953–2017
Source: FRED; data from Bureau of Economic Analysis.

U.S. Inflation (Percent Change in the Price Index for Personal Consumption Expenditures), 1930–1933
Source: FRED; data from Bureau of Economic Analysis.

Why Do We Care about Inflation?
• An argument for not caring.
• Redistribution.
• Psychology.
• Efficiency.

Adjusting Variables for Price Changes • What would $X in Year A be equivalent to in terms
of Year B dollars?
$XPBPA
,
where PA and PB are the price index in year A and year B.

Adjusting Variables for Price Changes – Example • Example: What was Richard Nixon’s final salary
equivalent to in today’s dollars?
• His salary was $200,000; the CPI in August 1974 was 49.9; the CPI now is 249.2. Thus, $X•(PA/PB) is:
$200,000249.249.9
= $999,000.
• Today, the president’s salary is $400,000. So, the president’s real salary was much higher in 1974 than it is today.

Quality Changes and New Goods in Calculating Inflation
• If the quality of a good improves and its price rises, we try to take out the part of the price increase that is due to the quality improvement (and count only the remainder in calculating inflation).
• If there are new goods, we try to account for the fact that they give households a new way of obtaining utility.

Quality Changes, New Goods, and Real GDP
• We can think of real GDP as nominal GDP divided by a price index:
• If 2009 is the base year, define:
GDP Price Indext = ∑ Pi,t • Qi,ti
∑ Pi,2009 • Qi,ti. (∗)
• Then our earlier definition of real GDP implies:
Real GDPt =Nominal GDPt
GDP Price Indext.
• In practice, rather than using a simple price index like (*), we use a price index that tries to account for quality changes and new goods.
IV. OVERVIEW OF MACRO FRAMEWORK AND LONG-
RUN GROWTH

Two Key Topics of Macroeconomics
• The long-run trend in output.
• Short-run fluctuations (booms and recessions).

Real GDP in the United States, 1950–2017
Source: FRED (Federal Reserve Economic Data); data from Bureau of Economic Analysis.

In the Long Run, Output Is Determined by the Economy’s Available Resources
• Although recessions can cause resource use to be lower than normal, the economy does not remain depressed forever.
• Potential output (Y*): The amount of output that the economy produces when using its resources at normal rates.
• A better name for potential output might be “normal output.”

The Three Key Determinants of Potential Output
• Labor
• Capital
• Technology

Issues Relating to Potential Output
• The level of potential output per person.
• This is an indicator of standards of living.
• Why is potential output per person so much higher in some countries than in others?
• The growth rate of potential output per person over time.
• Small differences in normal growth can have large impacts on standards of living over time.

The Long-Run Consequences of Small Differences in Growth Rates
• Suppose countries A and B start with the same real income per capita.
• But annual growth in real income per capita is 1 percentage point higher in A than in B (for example, 1% vs. 0, or 2% vs. 1%).
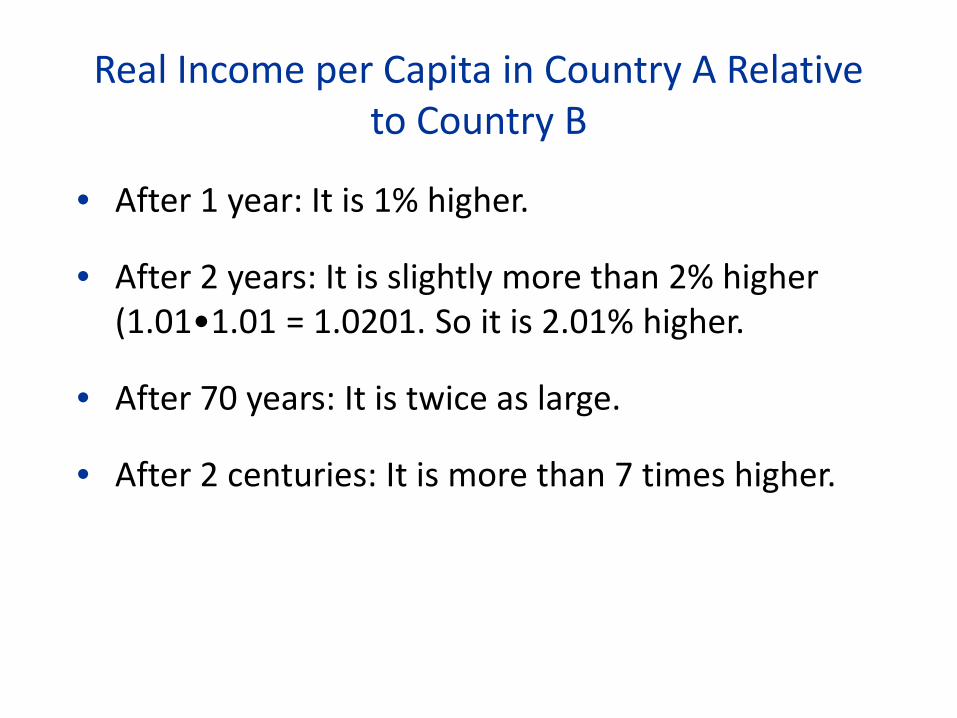
Real Income per Capita in Country A Relative to Country B
• After 1 year: It is 1% higher.
• After 2 years: It is slightly more than 2% higher (1.01•1.01 = 1.0201. So it is 2.01% higher.
• After 70 years: It is twice as large.
• After 2 centuries: It is more than 7 times higher.

Source: Charles Jones and Dietrich Vollrath, Economic Growth.

GDP per Capita in 8 Countries since 1870
Source: Frank, Bernanke, Antonovics, and Heffetz, Principles of Economics.