Lecture 14 – Parallel Performance Tools Parallel Performance Tools Parallel Computing CIS 410/510...
70
Lecture 14 – Parallel Performance Tools Parallel Performance Tools Parallel Computing CIS 410/510 Department of Computer and Information Science
-
Upload
martha-wilson -
Category
Documents
-
view
223 -
download
2
Transcript of Lecture 14 – Parallel Performance Tools Parallel Performance Tools Parallel Computing CIS 410/510...

Lecture 14 – Parallel Performance Tools
Parallel Performance Tools
Parallel Computing
CIS 410/510
Department of Computer and Information Science

Lecture 14 – Parallel Performance Tools
Performance and Debugging Tools
Performance Measurement and Analysis:
– Open|SpeedShop– HPCToolkit– Vampir– Scalasca– Periscope– mpiP– Paraver– PerfExpert– TAU
Modeling and prediction– Prophesy– MuMMI
Debugging– Stat
Autotuning Frameworks– Active Harmony
2Introduction to Parallel Computing, University of Oregon, IPCC

Lecture 14 – Parallel Performance Tools
Performance Tools Matrix
TOOL Profiling Tracing Instrumentation SamplingScalasca X X X XHPCToolkit X X XVampir X XOpen|SpeedShop X X X XPeriscope X XmpiP X X XParaver X X XTAU X X X X
3Introduction to Parallel Computing, University of Oregon, IPCC

Lecture 14 – Parallel Performance Tools
Open|SpeedShop
Krell Institute (USA)
http://www.openspeedshop.org
4Introduction to Parallel Computing, University of Oregon, IPCC

Lecture 14 – Parallel Performance Tools 5
Open|SpeedShop Tool Set Open Source Performance Analysis Tool Framework
❍ Most common performance analysis steps all in one tool❍ Combines tracing and sampling techniques❍ Extensible by plugins for data collection and representation❍ Gathers and displays several types of performance information
Flexible and Easy to use❍ User access through:
GUI, Command Line, Python Scripting, convenience scripts Scalable Data Collection
❍ Instrumentation of unmodified application binaries❍ New option for hierarchical online data aggregation
Supports a wide range of systems❍ Extensively used and tested on a variety of Linux clusters❍ Cray XT/XE/XK and Blue Gene L/P/Q support
Introduction to Parallel Computing, University of Oregon, IPCC
Lecture 14 – Parallel Performance Tools
srun –n4 –N1 smg2000 –n 65 65 65 osspcsamp “srun –n4 –N1 smg2000 –n 65 65 65” MPI Application
Post-mortemO|SS
Open|SpeedShop Workflow
6Introduction to Parallel Computing, University of Oregon, IPCC

Lecture 14 – Parallel Performance Tools
Central Concept: Experiments Users pick experiments:
❍ What to measure and from which sources?❍ How to select, view, and analyze the resulting data?
Two main classes:❍ Statistical Sampling
◆periodically interrupt execution and record location◆useful to get an overview ◆ low and uniform overhead
❍ Event Tracing (DyninstAPI)◆gather and store individual application events◆provides detailed per event information◆can lead to huge data volumes
O|SS can be extended with additional experiments7Introduction to Parallel Computing, University of Oregon, IPCC

Lecture 14 – Parallel Performance Tools 8
Performance Analysis in Parallel How to deal with concurrency?
❍ Any experiment can be applied to parallel application◆ Important step: aggregation or selection of data
❍ Special experiments targeting parallelism/synchronization O|SS supports MPI and threaded codes
❍ Automatically applied to all tasks/threads❍ Default views aggregate across all tasks/threads❍ Data from individual tasks/threads available❍ Thread support (incl. OpenMP) based on POSIX threads
Specific parallel experiments (e.g., MPI)❍ Wraps MPI calls and reports
◆ MPI routine time◆ MPI routine parameter information
❍ The mpit experiment also store function arguments and return code for each call
Introduction to Parallel Computing, University of Oregon, IPCC

Lecture 14 – Parallel Performance Tools
HPCToolkit
John Mellor-Crummey
Rice University (USA)
http://hpctoolkit.org
9Introduction to Parallel Computing, University of Oregon, IPCC
Lecture 14 – Parallel Performance Tools
HPCToolkit Integrated suite of tools for measurement and
analysis of program performance Works with multilingual, fully optimized
applications that are statically or dynamically linked
Sampling-based measurement methodology Serial, multiprocess, multithread applications
10Introduction to Parallel Computing, University of Oregon, IPCC

Lecture 14 – Parallel Performance Tools
HPCToolkit
• Performance Analysis through callpath sampling– Designed for low overhead– Hot path analysis– Recovery of program structure from binary
Image by John Mellor-Crummey
11Introduction to Parallel Computing, University of Oregon, IPCC
Lecture 14 – Parallel Performance Tools
HPCToolkit DESIGN PRINCIPLES
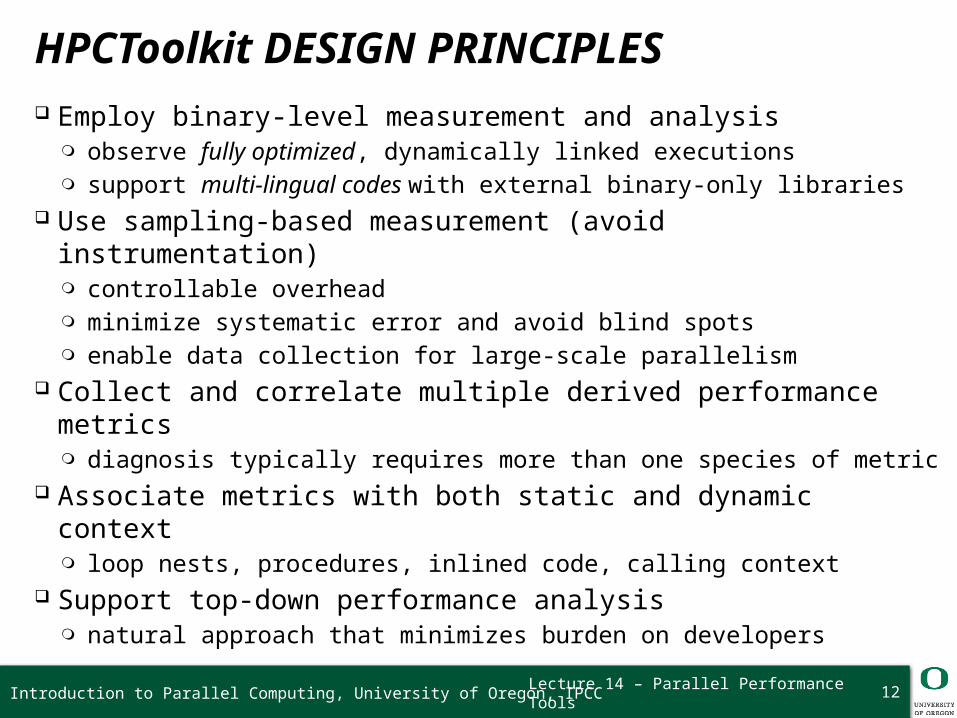
Employ binary-level measurement and analysis❍ observe fully optimized, dynamically linked executions ❍ support multi-lingual codes with external binary-only libraries
Use sampling-based measurement (avoid instrumentation)❍ controllable overhead❍ minimize systematic error and avoid blind spots❍ enable data collection for large-scale parallelism
Collect and correlate multiple derived performance metrics❍ diagnosis typically requires more than one species of metric
Associate metrics with both static and dynamic context❍ loop nests, procedures, inlined code, calling context
Support top-down performance analysis❍ natural approach that minimizes burden on developers
12Introduction to Parallel Computing, University of Oregon, IPCC

Lecture 14 – Parallel Performance Tools 13
HPCToolkit Workflow
app. source
optimized
binary
compile & link call stack profile
profile execution
[hpcrun]
binary analysis[hpcstruct]
interpret profilecorrelate w/ source
[hpcprof/hpcprof-mpi]
database
presentation[hpcviewer/
hpctraceviewer]
program structure
Introduction to Parallel Computing, University of Oregon, IPCC

Lecture 14 – Parallel Performance Tools 14
HPCToolkit Workflow
For dynamically-linked executables on stock Linux❍ compile and link as you usually do: nothing special needed
For statically-linked executables (e.g. for Blue Gene, Cray)❍ add monitoring by using hpclink as prefix to your link line
• uses “linker wrapping” to catch “control” operations– process and thread creation, finalization, signals, ...
app. source
optimized
binary
compile & link call stack profile
profile execution
[hpcrun]
binary analysis[hpcstruct]
interpret profilecorrelate w/ source
[hpcprof/hpcprof-mpi]
database
presentation[hpcviewer/
hpctraceviewer]
program structure
Introduction to Parallel Computing, University of Oregon, IPCC

Lecture 14 – Parallel Performance Tools 15
HPCToolkit Workflow
Measure execution unobtrusively❍ launch optimized application binaries
• dynamically-linked applications: launch with hpcrun to measure• statically-linked applications: measurement library added at link time
– control with environment variable settings
❍ collect statistical call path profiles of events of interest
app. source
optimized
binary
compile & link call stack profile
profile execution
[hpcrun]
binary analysis[hpcstruct]
interpret profilecorrelate w/ source
[hpcprof/hpcprof-mpi]
database
presentation[hpcviewer/
hpctraceviewer]
program structure
Introduction to Parallel Computing, University of Oregon, IPCC

Lecture 14 – Parallel Performance Tools 16
HPCToolkit Workflow
Analyze binary with hpcstruct: recover program structure❍ analyze machine code, line map, debugging information❍ extract loop nesting & identify inlined procedures❍ map transformed loops and procedures to source
app. source
optimized
binary
compile & link call stack profile
profile execution
[hpcrun]
binary analysis[hpcstruct]
interpret profilecorrelate w/ source
[hpcprof/hpcprof-mpi]
database
presentation[hpcviewer/
hpctraceviewer]
program structure
Introduction to Parallel Computing, University of Oregon, IPCC

Lecture 14 – Parallel Performance Tools 17
HPCToolkit Workflow
Combine multiple profiles❍ multiple threads; multiple processes; multiple executions
Correlate metrics to static & dynamic program structure
app. source
optimized
binary
compile & link call stack profile
profile execution
[hpcrun]
binary analysis[hpcstruct]
interpret profilecorrelate w/ source
[hpcprof/hpcprof-mpi]
database
presentation[hpcviewer/
hpctraceviewer]
program structure
Introduction to Parallel Computing, University of Oregon, IPCC

Lecture 14 – Parallel Performance Tools 18
HPCToolkit Workflow
Presentation❍ explore performance data from multiple perspectives
• rank order by metrics to focus on what’s important• compute derived metrics to help gain insight
– e.g. scalability losses, waste, CPI, bandwidth
❍ graph thread-level metrics for contexts❍ explore evolution of behavior over time
app. source
optimized
binary
compile & link call stack profile
profile execution
[hpcrun]
binary analysis[hpcstruct]
interpret profilecorrelate w/ source
[hpcprof/hpcprof-mpi]
database
presentation[hpcviewer/
hpctraceviewer]
program structure
Introduction to Parallel Computing, University of Oregon, IPCC

Lecture 14 – Parallel Performance Tools 19
Analyzing results with hpcviewer
Callpath tohotspot
associatedsource code
Image by John Mellor-Crummey
Introduction to Parallel Computing, University of Oregon, IPCC

Lecture 14 – Parallel Performance Tools
Vampir
Wolfgang NagelZIH, Technische Universität Dresden (Germany)
http://www.vampir.eu
20Introduction to Parallel Computing, University of Oregon, IPCC

Lecture 14 – Parallel Performance Tools
Mission Visualization of dynamics
of complex parallel processes Requires two components
❍ Monitor/Collector (Score-P)❍ Charts/Browser (Vampir)
Typical questions that Vampir helps to answer:❍ What happens in my application execution during a given time in a
given process or thread?❍ How do the communication patterns of my application execute on
a real system?❍ Are there any imbalances in computation, I/O or memory usage
and how do they affect the parallel execution of my application?21Introduction to Parallel Computing, University of Oregon, IPCC

Lecture 14 – Parallel Performance Tools
Event Trace Visualization with Vampir
• Alternative and supplement to automatic analysis• Show dynamic run-time behavior graphically at
any level of detail• Provide statistics and performance metrics
Timeline charts– Show application activities and
communication along a time axis
Summary charts– Provide quantitative results for the
currently selected time interval
22Introduction to Parallel Computing, University of Oregon, IPCC

Lecture 14 – Parallel Performance Tools
Vampir – Visualization Modes (1)
Directly on front end or local machine
% vampir
Score-PTraceFile
(OTF2)
Vampir 8CPU CPU
CPU CPUCPU CPU
CPUCPU
Multi-CoreProgram
Thread parallelSmall/Medium sized
trace
23Introduction to Parallel Computing, University of Oregon, IPCC

Lecture 14 – Parallel Performance Tools
Vampir – Visualization Modes (2)On local machine with remote VampirServer
Score-P
Vampir 8
TraceFile
(OTF2)
VampirServer
CPU CPU CPU CPU
CPU CPU CPU CPU
CPU CPU CPU CPU
CPU CPU CPU CPU
CPU CPU CPU CPU
CPU CPU CPU CPU
CPU CPU CPU CPU
CPU CPU CPU CPU
CPU CPU CPU CPU
CPU CPU CPU CPU
CPU CPU CPU CPU
CPU CPU CPU CPU
Many-CoreProgram
Large Trace File(stays on remote
machine)
MPI parallel application
LAN/WAN
% vampirserver start –n 12 % vampir
24Introduction to Parallel Computing, University of Oregon, IPCC

Lecture 14 – Parallel Performance Tools
Main Displays of Vampir Timeline Charts:
❍ Master Timeline
❍ Process Timeline
❍ Counter Data Timeline
❍ Performance Radar Summary Charts:
❍ Function Summary
❍ Message Summary
❍ Process Summary
❍ Communication Matrix View25Introduction to Parallel Computing, University of Oregon, IPCC

Lecture 14 – Parallel Performance Tools
Visualization of the NPB-MZ-MPI / BT trace% vampir scorep_bt-mz_B_4x4_trace
Master Timeline
Navigation Toolbar
Function Summary
Function Legend
26Introduction to Parallel Computing, University of Oregon, IPCC

Lecture 14 – Parallel Performance Tools
Visualization of the NPB-MZ-MPI / BT traceMaster Timeline
Detailed information about functions,
communication and synchronization events
for collection of processes.
27Introduction to Parallel Computing, University of Oregon, IPCC

Lecture 14 – Parallel Performance Tools
Visualization of the NPB-MZ-MPI / BT trace
Detailed information about different levels of
function calls in a stacked bar chart for an
individual process.
Process Timeline
28Introduction to Parallel Computing, University of Oregon, IPCC

Lecture 14 – Parallel Performance Tools
Visualization of the NPB-MZ-MPI / BT traceTypical program phases
Initialisation Phase
Computation Phase
29Introduction to Parallel Computing, University of Oregon, IPCC

Lecture 14 – Parallel Performance Tools
Visualization of the NPB-MZ-MPI / BT trace
Detailed counter information over time
for an individual process.
Counter Data Timeline
30Introduction to Parallel Computing, University of Oregon, IPCC

Lecture 14 – Parallel Performance Tools
Visualization of the NPB-MZ-MPI / BT tracePerformance Radar
Detailed counter information over time
for a collection of
processes.
31Introduction to Parallel Computing, University of Oregon, IPCC

Lecture 14 – Parallel Performance Tools
Visualization of the NPB-MZ-MPI / BT trace
MPI communication
results in lower floating point operations.
Zoom in: Computation Phase
32Introduction to Parallel Computing, University of Oregon, IPCC

Lecture 14 – Parallel Performance Tools
Vampir Summary Vampir & VampirServer
❍ Interactive trace visualization and analysis❍ Intuitive browsing and zooming❍ Scalable to large trace data sizes (20 TByte)❍ Scalable to high parallelism (200000 processes)
Vampir for Linux, Windows and Mac OS X Vampir does neither solve your problems
automatically nor point you directly at them Rather it gives you FULL insight into the
execution of your application
33Introduction to Parallel Computing, University of Oregon, IPCC

Lecture 14 – Parallel Performance Tools
Scalasca
Bernd Mohr and Felix Wolf
Jülich Supercomputing Centre (Germany)
German Research School for Simulation Sciences
http://www.scalasca.org
34Introduction to Parallel Computing, University of Oregon, IPCC

Lecture 14 – Parallel Performance Tools
Scalable parallel performance-analysis toolset❍ Focus on communication and synchronization
Integrated performance analysis process❍ Callpath profiling
◆performance overview on callpath level
❍ Event tracing◆in-depth study of application behavior
Supported programming models ❍ MPI-1, MPI-2 one-sided communication ❍ OpenMP (basic features)
Available for all major HPC platforms35Introduction to Parallel Computing, University of Oregon, IPCC

Lecture 14 – Parallel Performance Tools
Scalasca Project: Objective Development of a scalable performance analysis
toolset for most popular parallel programming paradigms
Specifically targeting large-scale parallel applications❍ 100,000 – 1,000,000 processes / thread❍ IBM BlueGene or Cray XT systems
Latest release:❍ Scalasca v2.0 with Score-P support (August 2013)
36Introduction to Parallel Computing, University of Oregon, IPCC

Lecture 14 – Parallel Performance Tools
Scalasca: Automatic Trace Analysis Idea
❍ Automatic search for patterns of inefficient behavior❍ Classification of behavior and quantification of
significance
❍ Guaranteed to cover the entire event trace❍ Quicker than manual/visual trace analysis❍ Parallel replay analysis online
37
Callpath
Pro
pert
y
Location
Low-levelevent trace
High-levelresult
Analysis
Introduction to Parallel Computing, University of Oregon, IPCC

Lecture 14 – Parallel Performance Tools
Scalasca trace analysis
38
Scalasca Workflow
Instr.targetapplication
Measurementlibrary
HWCParallel wait-state search
Wait-state report
Local event traces
Summary report
Optimized measurement configuration
Instrumenter compiler / linker
Instrumented executable
Source modules
Repo
rt
man
ipul
ation
Which problem? Where in the program?
Which process?
Introduction to Parallel Computing, University of Oregon, IPCC

Lecture 14 – Parallel Performance Tools
Callpath Profile: Computation
Executiontime excl.MPI comm
Just 30% ofsimulation
Widelyspreadin code
Widelyspreadin code
Widelyspreadin code
39Introduction to Parallel Computing, University of Oregon, IPCC

Lecture 14 – Parallel Performance Tools
Callpath Profile: P2P Messaging
P2P comm66% of
simulation Primarilyin scatter& gather
Primarilyin scatter& gather
MPI point-to-point communic-ation time
40Introduction to Parallel Computing, University of Oregon, IPCC

Lecture 14 – Parallel Performance Tools
Callpath Profile: P2P Synchronization
Masses ofP2P sync.
operations
Processesall equally
responsible
Point-to-point msgsw/o data
41Introduction to Parallel Computing, University of Oregon, IPCC

Lecture 14 – Parallel Performance Tools
Scalasca Approach to Performance Dynamics
Overview
• Capture overview of performance dynamics via time-series profiling• Time and count-based metrics
Focus
• Identify pivotal iterations - if reproducible
In-depth
analysi
s
• In-depth analysis of these iterations via tracing• Analysis of wait-state formation• Critical-path analysis• Tracing restricted to iterations of interest
New
42Introduction to Parallel Computing, University of Oregon, IPCC

Lecture 14 – Parallel Performance Tools 43
Tuning and Analysis Utilities (20+ year project) Performance problem solving framework for HPC
❍ Integrated, scalable, flexible, portable❍ Target all parallel programming / execution paradigms
Integrated performance toolkit❍ Multi-level performance instrumentation❍ Flexible and configurable performance measurement❍ Widely-ported performance profiling / tracing system❍ Performance data management and data mining❍ Open source (BSD-style license)
Broad use in complex software, systems, applications
http://tau.uoregon.edu
TAU Performance System®
Introduction to Parallel Computing, University of Oregon, IPCC

Lecture 14 – Parallel Performance Tools
TAU History1992-1995: Malony and Mohr work with Gannon on DARPA pC++ project work. TAU is
born. [parallel profiling, tracing, performance extrapolation]
1995-1998: Shende works on Ph.D. research on performance mapping. TAU v1.0 released. [multiple languages, source analysis, automatic instrumentation]
1998-2001: Significant effort in Fortran analysis and instrumentation, work with Mohr on POMP, Kojak tracing integration, focus on automated performance analysis. [performance diagnosis, source analysis, instrumentation]
2002-2005: Focus on profiling analysis tools, measurement scalability, and perturbation compensation. [analysis, scalability, perturbation analysis, applications]
2005-2007: More emphasis on tool integration, usability, and data presentation. TAU v2.0 released. [performance visualization, binary instrumentation, integration, performance diagnosis and modeling]
2008-2011: Add performance database support, data mining, and rule-based analysis. Develop measurement/analysis for heterogeneous systems. Core measurement infrastructure integration (Score-P). [database, data mining, expert system, heterogeneous measurement, infrastructure integration]
2012-present: Focus on exascale systems. Improve scalability. Add hybrid measurement support, extend heterogeneous and mixed-mode, develop user-level threading. Apply to petascale / exascale applications. [scale, autotuning, user-level]
44Introduction to Parallel Computing, University of Oregon, IPCC

Lecture 14 – Parallel Performance Tools 45
• Node: physically distinct shared memory machine– Message passing node interconnection network
• Context: distinct virtual memory space within node• Thread: execution threads (user/system) in context
General Target Computation Model in TAU
memory memory
Node Node Node
VMspace
Context
SMP
Threads
node memory
…
…
Interconnection Network Inter-node messagecommunication
*
*
physicalview
modelview
Introduction to Parallel Computing, University of Oregon, IPCC

Lecture 14 – Parallel Performance Tools 46
TAU is a parallel performance framework and toolkit Software architecture provides separation of concerns
❍ Instrumentation | Measurement | Analysis
TAU Architecture
Introduction to Parallel Computing, University of Oregon, IPCC

Lecture 14 – Parallel Performance Tools
TAU’s (primary) methodology for parallel performance observation is based on the insertion of measurement probes into application, library, and runtime system❍ Code is instrumented to make visible certain events❍ Performance measurements occur when events are triggered❍ Known as probe-based (direct) measurement
Performance experimentation workflow❍ Instrument application and other code components❍ Link / load TAU measurement library❍ Execute program to gather performance data❍ Analysis performance data with respect to events❍ Analyze multiple performance experiments
Extended TAU’s methodology and workflow to support sampling-based techniques
TAU Observation Methodology and Workflow
47Introduction to Parallel Computing, University of Oregon, IPCC

Lecture 14 – Parallel Performance Tools
Instrumentation❍ Fortran, C, C++, OpenMP, Python, Java, UPC, Chapel❍ Source, compiler, library wrapping, binary rewriting❍ Automatic instrumentation
Measurement❍ Internode: MPI, OpenSHMEM, ARMCI, PGAS, DMAPP❍ Intranode: Pthreads, OpenMP, hybrid, …❍ Heterogeneous: GPU, MIC, CUDA, OpenCL, OpenACC, …❍ Performance data (timing, counters) and metadata❍ Parallel profiling and tracing (with Score-P integration)
Analysis❍ Parallel profile analysis and visualization (ParaProf)❍ Performance data mining / machine learning (PerfExplorer)❍ Performance database technology (TAUdb)❍ Empirical autotuning
TAU Components
48Introduction to Parallel Computing, University of Oregon, IPCC

Lecture 14 – Parallel Performance Tools
Direct and indirect performance instrumentation❍ Direct instrumentation of program (system) code (probes)❍ Indirect support via sampling or interrupts
Support for standard program code events❍ Routines, classes and templates❍ Statement-level blocks, loops❍ Interval events (start/stop)
Support for user-defined events❍ Interval events specified by user❍ Atomic events (statistical measurement at a single point)❍ Context events (atomic events with calling path context)
Provides static events and dynamic events Instrumentation optimization
TAU Instrumentation Approach
49Introduction to Parallel Computing, University of Oregon, IPCC
Lecture 14 – Parallel Performance Tools
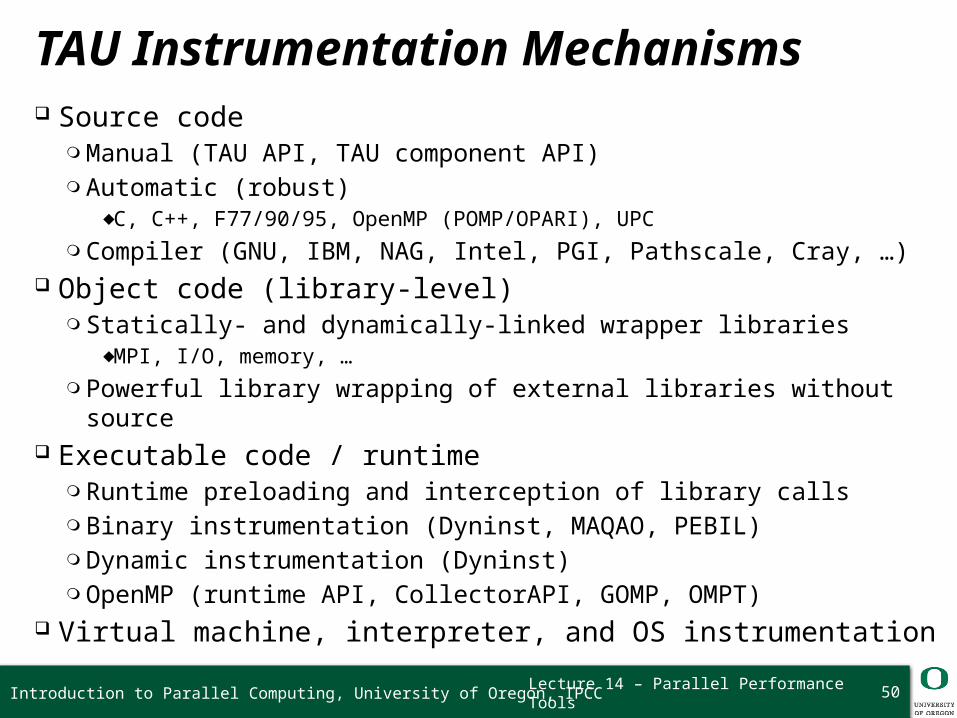
Source code❍ Manual (TAU API, TAU component API)❍ Automatic (robust)
◆ C, C++, F77/90/95, OpenMP (POMP/OPARI), UPC
❍ Compiler (GNU, IBM, NAG, Intel, PGI, Pathscale, Cray, …) Object code (library-level)
❍ Statically- and dynamically-linked wrapper libraries◆ MPI, I/O, memory, …
❍ Powerful library wrapping of external libraries without source Executable code / runtime
❍ Runtime preloading and interception of library calls❍ Binary instrumentation (Dyninst, MAQAO, PEBIL)❍ Dynamic instrumentation (Dyninst)❍ OpenMP (runtime API, CollectorAPI, GOMP, OMPT)
Virtual machine, interpreter, and OS instrumentation
TAU Instrumentation Mechanisms
50Introduction to Parallel Computing, University of Oregon, IPCC

Lecture 14 – Parallel Performance Tools
Preprocessor substitution❍ Header redefines a routine with macros (only C and C++)❍ Tool-defined header file with same name takes precedence❍ Original routine substituted by preprocessor callsite
Preloading a library at runtime❍ Library preloaded in the address space of executing application
intercepts calls from a given library❍ Tool wrapper library defines routine, gets address of global symbol
(dlsym), internally calls measured routine Linker-based substitution
❍ Wrapper library defines wrapper interface◆ wrapper interface then which calls routine
❍ Linker is passed option to substitute all references from applications object code with tool wrappers
Instrumentation for Wrapping External Libraries
51Introduction to Parallel Computing, University of Oregon, IPCC
Lecture 14 – Parallel Performance Tools
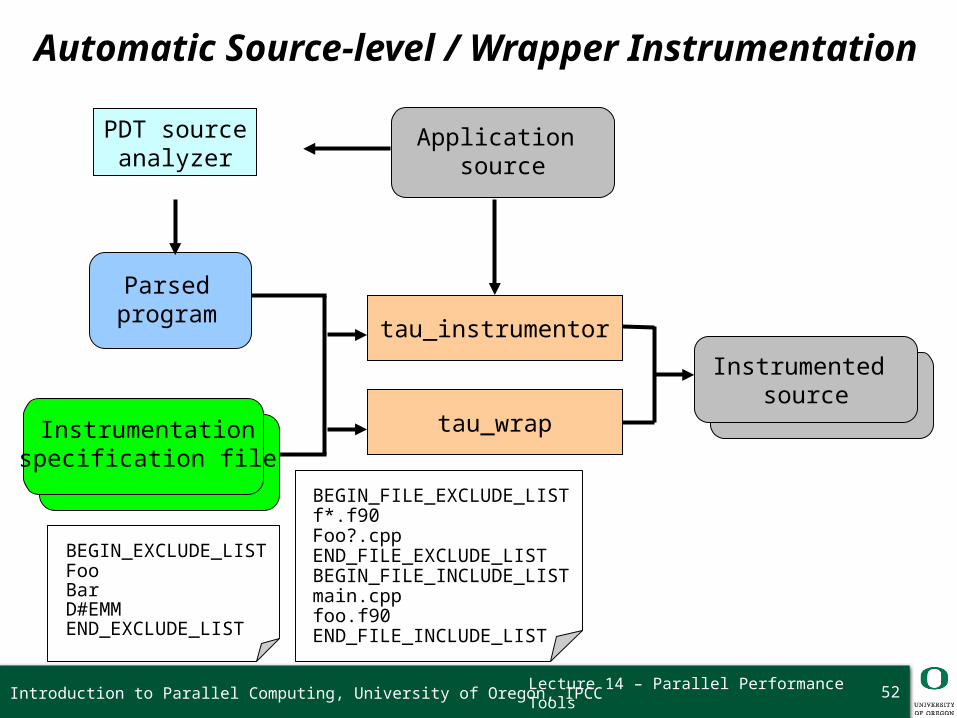
Automatic Source-level / Wrapper Instrumentation
tau_instrumentor
Parsedprogram
Instrumentationspecification file
Instrumented source
PDT sourceanalyzer
Application source
BEGIN_EXCLUDE_LISTFooBarD#EMMEND_EXCLUDE_LIST
BEGIN_FILE_EXCLUDE_LISTf*.f90Foo?.cpp END_FILE_EXCLUDE_LISTBEGIN_FILE_INCLUDE_LISTmain.cppfoo.f90END_FILE_INCLUDE_LIST
tau_wrap
52Introduction to Parallel Computing, University of Oregon, IPCC

Lecture 14 – Parallel Performance Tools
Uses standard MPI Profiling Interface❍ Provides name shifted interface (weak bindings)
◆ MPI_Send = PMPI_Send
Create TAU instrumented MPI library❍ Interpose between MPI and TAU
◆ -lmpi replaced by –lTauMpi –lpmpi –lmpi❍ No change to the source code, just re-link application!
Can we interpose MPI for compiled applications?❍ Avoid re-compilation or re-linking❍ Requires shared library MPI
◆ uses LD_PRELOAD for Linux
❍ Approach will work with other shared libraries (see later slide)❍ Use TAU tau_exec (see later slide)
% mpirun -np 4 tau_exec a.out
MPI Wrapper Interposition Library
53Introduction to Parallel Computing, University of Oregon, IPCC

Lecture 14 – Parallel Performance Tools
TAU has been a long-time user of DyninstAPI Using DyninstAPI’s binary re-writing capabilities,
created a binary re-writer tool for TAU (tau_run)❍ Supports TAU's performance instrumentation❍ Works with TAU instrumentation selection
◆ files and routines based on exclude/include lists
❍ TAU’s measurement library (DSO) is loaded by tau_run❍ Runtime (pre-execution) and binary re-writing supported
Simplifies code instrumentation and usage greatly!% tau_run a.out –o a.inst% mpirun –np 4 ./a.inst
Support PEBIL and MAQAO binary instrumentation
Binary Instrumentation
54Introduction to Parallel Computing, University of Oregon, IPCC
Lecture 14 – Parallel Performance Tools
Library Interposition
• Simplify TAU usage to assess performance properties– Application, I/O, memory, communication
• Designed a new tool that leverages runtime instrumentation by pre-loading measurement libraries
• Works on dynamic executables (default under Linux)• Substitutes routines (e.g., I/O, MPI, memory
allocation/deallocation) with instrumented calls– Interval events (e.g., time spent in write())– Atomic events (e.g., how much memory was allocated)
55Introduction to Parallel Computing, University of Oregon, IPCC

Lecture 14 – Parallel Performance Tools
Library wrapping – tau_gen_wrapper
How to instrument an external library without source?❍ Source may not be available❍ Library may be too cumbersome to build (with instrumentation)
Build a library wrapper tools❍ Used PDT to parse header files❍ Generate new header files with instrumentation files❍ Three methods: runtime preloading, linking, redirecting headers
Add to TAU_OPTIONS environment variable:–optTauWrapFile=<wrapperdir>/link_options.tau
Wrapped library❍ Redirects references at routine callsite to a wrapper call❍ Wrapper internally calls the original❍ Wrapper has TAU measurement code
56Introduction to Parallel Computing, University of Oregon, IPCC
Lecture 14 – Parallel Performance Tools
Portable and scalable parallel profiling solution❍ Multiple profiling types and options❍ Event selection and control (enabling/disabling, throttling)❍ Online profile access and sampling❍ Online performance profile overhead compensation
Portable and scalable parallel tracing solution❍ Trace translation to OTF, EPILOG, Paraver, and SLOG2❍ Trace streams (OTF) and hierarchical trace merging
Robust timing and hardware performance support Multiple counters (hardware, user-defined, system) Metadata (hardware/system, application, …)
TAU Measurement Approach
57Introduction to Parallel Computing, University of Oregon, IPCC

Lecture 14 – Parallel Performance Tools
Parallel profiling❍ Function-level, block-level, statement-level❍ Supports user-defined events and mapping events❍ Support for flat, callgraph/callpath, phase profiling❍ Support for parameter and context profiling❍ Support for tracking I/O and memory (library wrappers)❍ Parallel profile stored (dumped, shapshot) during execution
Tracing❍ All profile-level events❍ Inter-process communication events❍ Inclusion of multiple counter data in traced events
TAU Measurement Mechanisms
58Introduction to Parallel Computing, University of Oregon, IPCC
Lecture 14 – Parallel Performance Tools
Flat profiles❍ Metric (e.g., time) spent in an event (callgraph nodes)❍ Exclusive/inclusive, # of calls, child calls
Callpath profiles (Calldepth profiles)❍ Time spent along a calling path (edges in callgraph)❍ “main=> f1 => f2 => MPI_Send” (event name)❍ TAU_CALLPATH_DEPTH environment variable
Phase profiles❍ Flat profiles under a phase (nested phases are allowed)❍ Default “main” phase❍ Supports static or dynamic (per-iteration) phases
Parameter and context profiling
Parallel Performance Profiling
59Introduction to Parallel Computing, University of Oregon, IPCC

Lecture 14 – Parallel Performance Tools
Analysis of parallel profile and trace measurement Parallel profile analysis (ParaProf)
❍ Java-based analysis and visualization tool❍ Support for large-scale parallel profiles
Performance data management (TAUdb) Performance data mining (PerfExplorer) Parallel trace analysis
❍ Translation to VTF (V3.0), EPILOG, OTF formats❍ Integration with Vampir / Vampir Server (TU Dresden)
Integration with CUBE browser (Scalasca, UTK / FZJ) Scalable runtime fault isolation with callstack debugging Efficient parallel runtime bounds checking
Performance Analysis
60Introduction to Parallel Computing, University of Oregon, IPCC

Lecture 14 – Parallel Performance Tools
Profile Analysis Framework
61Introduction to Parallel Computing, University of Oregon, IPCC

Lecture 14 – Parallel Performance Tools
Provide an open, flexible framework to support common data management tasks❍ Foster multi-experiment performance evaluation
Extensible toolkit to promote integration and reuse across available performance tools❍ Supported multiple
profile formats:TAU, CUBE, gprof,mpiP, psrun, …
❍ Supported DBMS:PostgreSQL, MySQL,Oracle, DB2,Derby, H2
Performance Data Management (TAUdb)
62Introduction to Parallel Computing, University of Oregon, IPCC
Lecture 14 – Parallel Performance Tools
Parallel performance profiles Timer and counter measurements with 5 dimensions
❍ Physical location: process / thread❍ Static code location: function / loop / block / line❍ Dynamic location: current callpath and context (parameters)❍ Time context: iteration / snapshot / phase❍ Metric: time, HW counters, derived values
Measurement metadata❍ Properties of the experiment❍ Anything from name:value pairs to nested, structured data❍ Single value for whole experiment or full context (tuple of
thread, timer, iteration, timestamp)
TAUdb Database Schema
63Introduction to Parallel Computing, University of Oregon, IPCC

Lecture 14 – Parallel Performance Tools
ParaProf❍ Parallel profile analyzer
◆visual pprof
❍ 2, 3+D visualizations❍ Single and comparative
experiment analysis PerfExplorer
❍ Data mining framework◆Clustering, correlation
❍ Multi-experiment analysis❍ Scripting engine❍ Expert system
64
TAUdb Tool Support
Introduction to Parallel Computing, University of Oregon, IPCC
Lecture 14 – Parallel Performance Tools 65
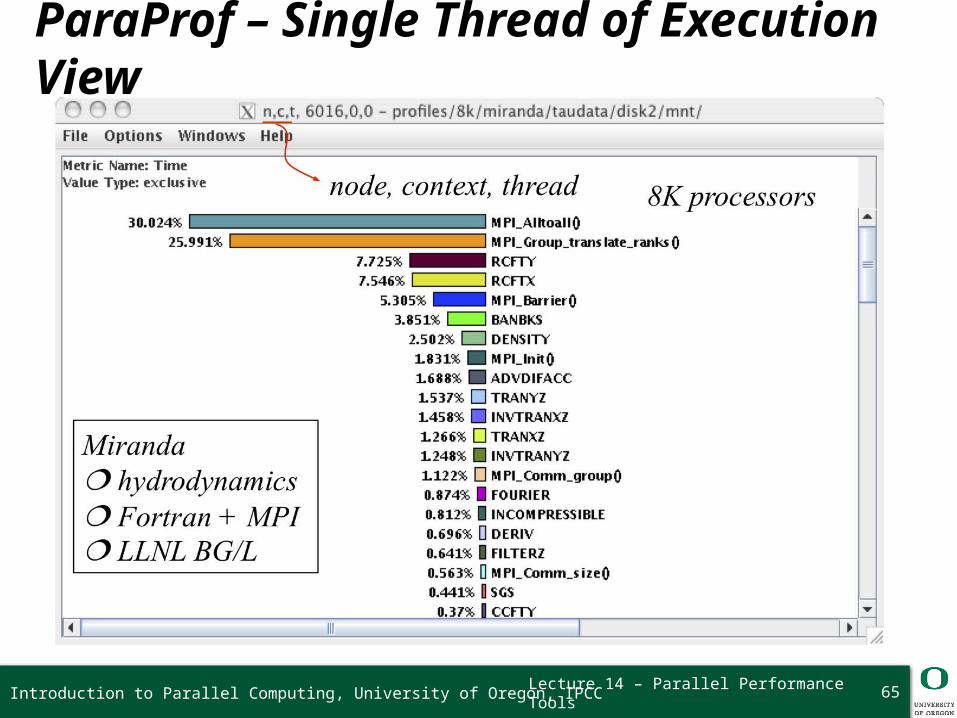
ParaProf – Single Thread of Execution View
Introduction to Parallel Computing, University of Oregon, IPCC

Lecture 14 – Parallel Performance Tools 66
ParaProf – Full Profile / Comparative Views
Introduction to Parallel Computing, University of Oregon, IPCC
Lecture 14 – Parallel Performance Tools
How to explain performance? Should not just redescribe the performance results Should explain performance phenomena
❍ What are the causes for performance observed?❍ What are the factors and how do they interrelate?❍ Performance analytics, forensics, and decision support
Need to add knowledge to do more intelligent things❍ Automated analysis needs good informed feedback❍ Performance model generation requires interpretation
Build these capabilities into performance tools❍ Support broader experimentation methods and refinement❍ Access and correlate data from several sources❍ Automate performance data analysis / mining / learning❍ Include predictive features and experiment refinement
67Introduction to Parallel Computing, University of Oregon, IPCC
Lecture 14 – Parallel Performance Tools
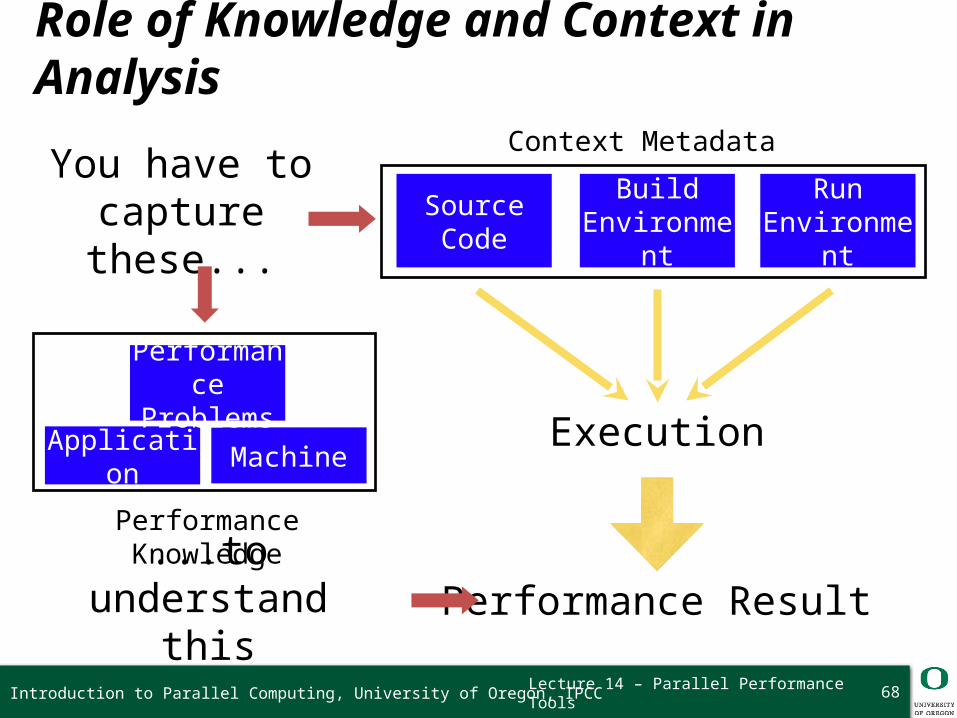
Role of Knowledge and Context in Analysis
Performance Knowledge
SourceCode
Build Environme
nt
Run Environme
nt
Performance Result
Execution
You have to capture these...
...to understand this
Application
Machine
Performance
Problems
Context Metadata
68Introduction to Parallel Computing, University of Oregon, IPCC

Lecture 14 – Parallel Performance Tools
Score-P Architecture
Application (MPI, OpenMP, hybrid)
Score-P measurement infrastructure
Online interfaceEvent traces (OTF2)
Vampir Scalasca PeriscopeTAU
Hardware counter (PAPI)
Instrumentation
Call-path profiles (CUBE4)
MPI wrapper
Compiler TAU instrumentor OPARI 2 COBI
TAU adaptor
supp
lem
enta
lin
stru
men
tatio
n+
mea
sure
men
tsu
ppor
tTAU
Introduction to Parallel Computing, University of Oregon, IPCC 69

Lecture 14 – Parallel Performance Tools
For More Information … TAU Website
http://tau.uoregon.edu❍ Software❍ Release notes❍ Documentation
HPC Linuxhttp://www.hpclinux.com ❍ Parallel Tools “LiveDVD”❍ Boot up on your laptop or desktop❍ Includes TAU and variety of other packages❍ Include documentation and tutorial slides
Introduction to Parallel Computing, University of Oregon, IPCC 70
![MPInside: a Performance Analysis and Diagnostic Tool for ... · Parallel applications, MPI, Performance analysis, Performance modeling. 1. INTRODUCTION Analysis tools for MPI [1]](https://static.fdocuments.in/doc/165x107/5f61c10d0ab10d377a2a38a2/mpinside-a-performance-analysis-and-diagnostic-tool-for-parallel-applications.jpg)


![Parallel Programming Oracle Developer Tools[1]](https://static.fdocuments.in/doc/165x107/547738055806b555068b4601/parallel-programming-oracle-developer-tools1.jpg)