Lecture 13 - Working Capital Management and Credit Issues
60
Lecture 13 - Working Capital Management and Credit Issues
-
Upload
kelsey-lamb -
Category
Documents
-
view
17 -
download
1
description
Lecture 13 - Working Capital Management and Credit Issues. Basic Definitions. Gross working capital: Total current assets. Net working capital: Current assets - Current liabilities. Net operating working capital (NOWC): Operating CA – Operating CL = - PowerPoint PPT Presentation
Transcript of Lecture 13 - Working Capital Management and Credit Issues

Lecture 13 - Working Capital Management
and Credit Issues

2
BASIC DEFINITIONS
Gross working capital: Total current assets.
Net working capital: Current assets - Current liabilities.
Net operating working capital (NOWC):
Operating CA – Operating CL =
(Cash + Inv. + A/R) – (Accruals + A/P)
Working capital management: Includes both establishing working capital policy and then the day-to-day control of cash, inventories, receivables, accruals, and accounts payable.
Working capital policy:
The level of each current asset.
How current assets are financed.

3
WORKING CAPITAL
Simple Cycle of operations
Cash
Finished goodsinventory
ReceivablesRaw materials
inventory

Example: Selected Ratios for SKI
SKI Industry
Current 1.75x 2.25x
Quick 0.83x 1.20x
Debt/Assets 58.76% 50.00%
Turnover of Cash 16.67x 22.22x
DSO(365-day year) 45.63 32.00
Inv. Turnover 4.82x 7.00x
F.A. Turnover 11.35x 12.00x
T.A. Turnover 2.08x 3.00x
Profit Margin 2.07% 3.50%
ROE 10.45% 21.00%
Payables deferral 30.00 33.00
4

5
HOW DOES SKI’S WORKING CAPITAL POLICY COMPARE WITH THE INDUSTRY?
Working capital policy is reflected in a firm’s current ratio, quick ratio, turnover of cash and securities, inventory turnover, and DSO.
These ratios indicate SKI has large amounts of working capital relative to its level of sales. Thus, SKI is following a relaxed policy.
A relaxed policy may be appropriate if it reduces risk more than profitability.
However, SKI is much less profitable than the average firm in the industry. This suggests that the company probably has excessive working capital.

Cash Conversion Cycle
The cash conversion cycle focuses on the time between payments made for materials and labor and payments received from sales:
Cash
Conversion =Cycle
Inventory
Conversion +
Period
Receivables
Collection -Period
Payables
Deferral .Period
6
CCC = + –
CCC = + 45.6 – 30 = 75.7 + 45.6 – 30 = 91.3 days.
Days per yearInv. turnover
Payablesdeferralperiod
Days salesoutstanding
3654.82

7

8
CASH MANAGEMENT: CASH DOESN’T EARN INTEREST, SO WHY HOLD IT?
Transactions: Must have some cash to pay current bills.
Precaution: “Safety stock.” But lessened by credit line and marketable securities.
Compensating balances: For loans and/or services provided.
Speculation: To take advantage of bargains, to take discounts, and so on. Reduced by credit line, marketable securities.
WHAT’S THE GOAL OF CASH MANAGEMENT?
To have sufficient cash on hand to meet the needs listed above.
However, since cash is a non-earning asset, to have not one dollar more than needed.

9
WAYS TO MINIMIZE CASH HOLDINGS
Use lockboxes.
A service offered by banks to companies in which the company receives payments by mail to a post office box and the bank picks up the payments several times a day, deposits them into the company's account, and notifies the company of the deposit. This enables the company to put the money to work as soon as it's received, but the amounts must be large in order for the value obtained to exceed the cost of the service.
Insist on wire transfers from customers.

10
WAYS TO MINIMIZE CASH HOLDINGS
Synchronize inflows and outflows.
Use a remote disbursement account.
Increase forecast accuracy to reduce the need for a cash “safety stock.”
Hold marketable securities instead of a cash “safety stock.”
Negotiate a line of credit (also reduces need for a “safety stock”).

11
CASH BUDGET: THE PRIMARY CASH MANAGEMENT TOOL
Purpose: Uses forecasts of cash inflows, outflows, and ending cash balances to predict loan needs and funds available for temporary investment.
Timing: Daily, weekly, or monthly, depending upon budget’s purpose. Monthly for annual planning, daily for actual cash management.

12
DATA REQUIRED FOR CASH BUDGET
Sales forecast.
Information on collections delay.
Forecast of purchases and payment terms.
Forecast of cash expenses: wages, taxes, utilities, and so on.
Initial cash on hand.
Target cash balance.

SKI’s Cash Budget for January and February
Net Cash InflowsJanuary February
Collections $67,651.95 $62,755.40
Purchases 44,603.75 36,472.65
Wages 6,690.56 5,470.90
Rent 2,500.00 2,500.00
Total Payments $53,794.31 $44,443.55
Net CF $13,857.64 $18,311.85
January February
Cash at start if no borrowing $3,000.00 $16,857.64
Net CF (slide 13) 13,857.64 18,311.85
Cumulative cash $16,857.64 $35,169.49
Less: target cash 1,500.00 1,500.00
Surplus $15,357.64 $33,669.49
13
14
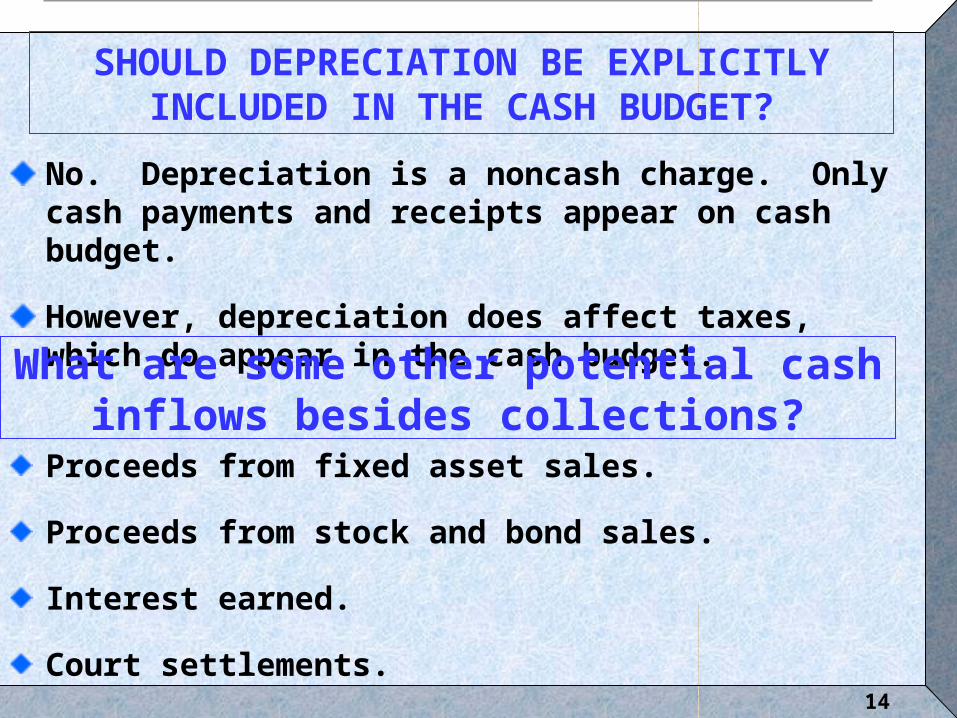
SHOULD DEPRECIATION BE EXPLICITLY INCLUDED IN THE CASH BUDGET?
No. Depreciation is a noncash charge. Only cash payments and receipts appear on cash budget.
However, depreciation does affect taxes, which do appear in the cash budget.
What are some other potential cash inflows besides collections?
Proceeds from fixed asset sales.
Proceeds from stock and bond sales.
Interest earned.
Court settlements.

15
HOW COULD BAD DEBTS BE WORKED INTO THE CASH BUDGET?
Collections would be reduced by the amount of bad debt losses.
For example, if the firm had 3% bad debt losses, collections would total only 97% of sales.
Lower collections would lead to lower surpluses and higher borrowing requirements.

16
WHY MIGHT A COMPANY WANT TO MAINTAIN A RELATIVELY HIGH AMOUNT OF CASH?
If sales turn out to be considerably less than expected, it could face a cash shortfall.
A company may choose to hold large amounts of cash if it does not have much faith in its sales forecast, or if it is very conservative.
The cash may be there, in part, to fund a planned fixed asset acquisition.
17
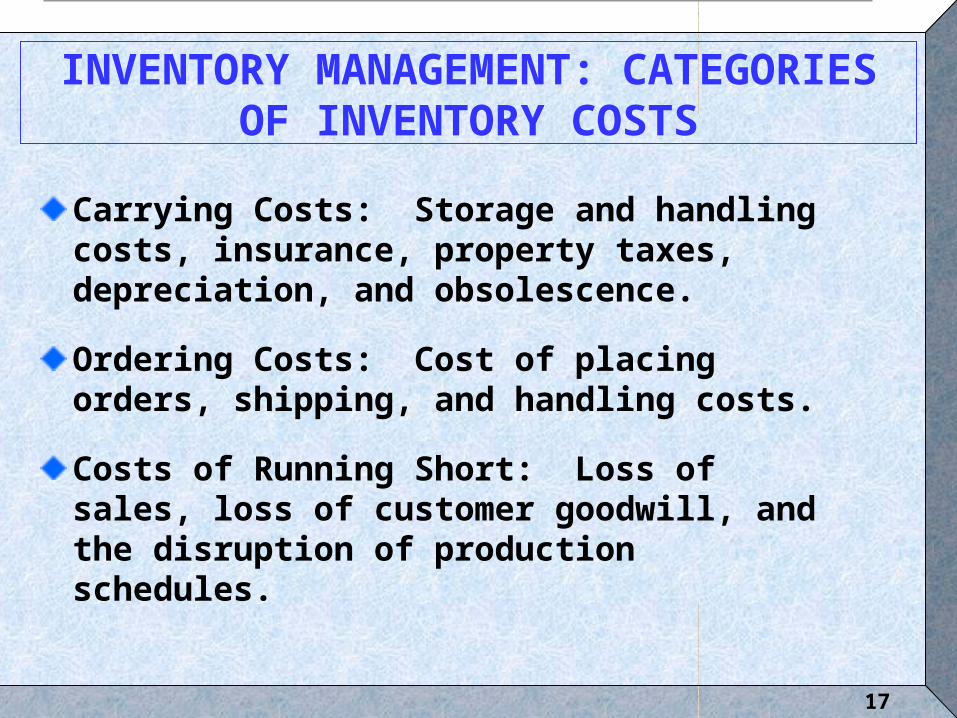
INVENTORY MANAGEMENT: CATEGORIES OF INVENTORY COSTS
Carrying Costs: Storage and handling costs, insurance, property taxes, depreciation, and obsolescence.
Ordering Costs: Cost of placing orders, shipping, and handling costs.
Costs of Running Short: Loss of sales, loss of customer goodwill, and the disruption of production schedules.

18
IS SKI HOLDING TOO MUCH INVENTORY?
SKI’s inventory turnover (4.82) is considerably lower than the industry average (7.00). The firm is carrying a lot of inventory per dollar of sales.
By holding excessive inventory, the firm is increasing its operating costs which reduces its NOPAT. Moreover, the excess inventory must be financed, so EVA is further lowered.

19
IF SKI REDUCES ITS INVENTORY, WITHOUT ADVERSELY AFFECTING SALES, WHAT EFFECT WILL THIS HAVE
ON ITS CASH POSITION?
Short run: Cash will increase as inventory purchases decline.
Long run: Company is likely to then take steps to reduce its cash holdings.
20
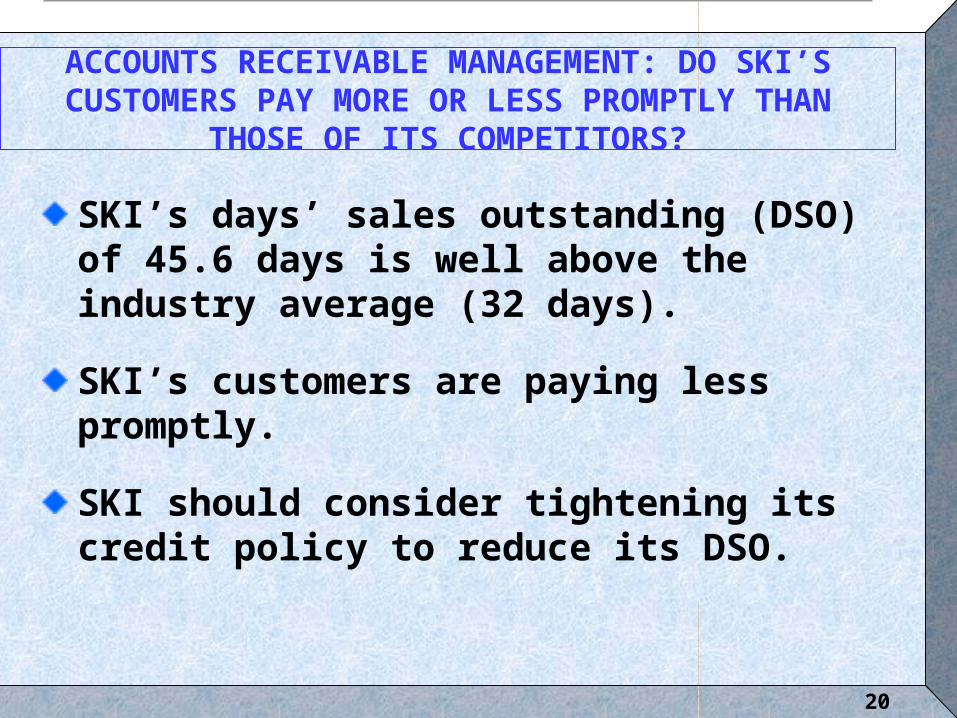
ACCOUNTS RECEIVABLE MANAGEMENT: DO SKI’S CUSTOMERS PAY MORE OR LESS PROMPTLY THAN
THOSE OF ITS COMPETITORS?
SKI’s days’ sales outstanding (DSO) of 45.6 days is well above the industry average (32 days).
SKI’s customers are paying less promptly.
SKI should consider tightening its credit policy to reduce its DSO.

21
ELEMENTS OF CREDIT POLICY
Cash Discounts: Lowers price. Attracts new customers and reduces DSO.
Credit Period: How long to pay? Shorter period reduces DSO and average A/R, but it may discourage sales.
Credit Standards: Tighter standards reduce bad debt losses, but may reduce sales. Fewer bad debts reduces DSO.
Collection Policy: Tougher policy will reduce DSO, but may damage customer relationships.

22
DOES SKI FACE ANY RISK IF IT TIGHTENS ITS CREDIT POLICY?
YES! A tighter credit policy may discourage sales. Some customers may choose to go elsewhere if they are pressured to pay their bills sooner.
If SKI succeeds in reducing DSO without adversely affecting sales, what effect would this have on its cash position?
Short run: If customers pay sooner, this increases cash holdings.
Long run: Over time, the company would hopefully invest the cash in more productive assets, or pay it out to shareholders. Both of these actions would increase EVA.

23
WHAT IS TRADE CREDIT?
Trade credit is credit furnished by a firm’s suppliers.
Trade credit is often the largest source of short-term credit, especially for small firms.
Spontaneous, easy to get, but cost can be high.

24
SKI BUYS $506,985 NET, ON TERMS OF 1/10, NET 30, AND PAYS ON DAY 40. FIND FREE AND COSTLY TRADE CREDIT.
Net daily purchases = $506,985/365 = $1,389.
Annual gross purchases = $506,985/(1-0.01) = $512,106
Gross/Net Breakdown
Company buys goods worth $506,985. That’s the cash price.
They must pay $5,121 more if they don’t take discounts.
Think of the extra $5,121 as a financing cost similar to the interest on a loan.
Want to compare that cost with the cost of a bank loan.

Payables level if don’t take discount: Payables = $1,389(40) = $55,560.
Total trade credit = $55,560 Free trade credit = 13,890 Costly trade credit = $41,670
Free and Costly Trade Credit
Payables level if take discount: Payables = $1,389(10) = $13,890.
25

Nominal Cost of Costly Trade Credit
But the $5,121 is paid all during the year, not at year-end, so EAR rate is higher.
Firm loses 0.01($512,106) = $5,121 of discounts to obtain $41,670 in extra trade credit, so:
rNom = = 0.1229 = 12.29%.$5,121
$41,670
26

Nominal Cost Formula, 1/10, net 40
Pays 1.01% 12.167 times per year.
rNom = Discount %
1 - Discount %
× 365 days
Days
Taken
Discount
Period-
=1
99×
365
30= 0.0101 × 12.1667
= 0.1229 = 12.29%
27

28
EFFECTIVE ANNUAL RATE, 1/10, NET 40
Periodic rate = 0.01/0.99 = 1.01%.
Periods/year = 365/(40 – 10)
= 12.1667.
EAR = (1 + Periodic rate)n – 1.0
= (1.0101)12.1667 – 1.0
= 13.01%.
29
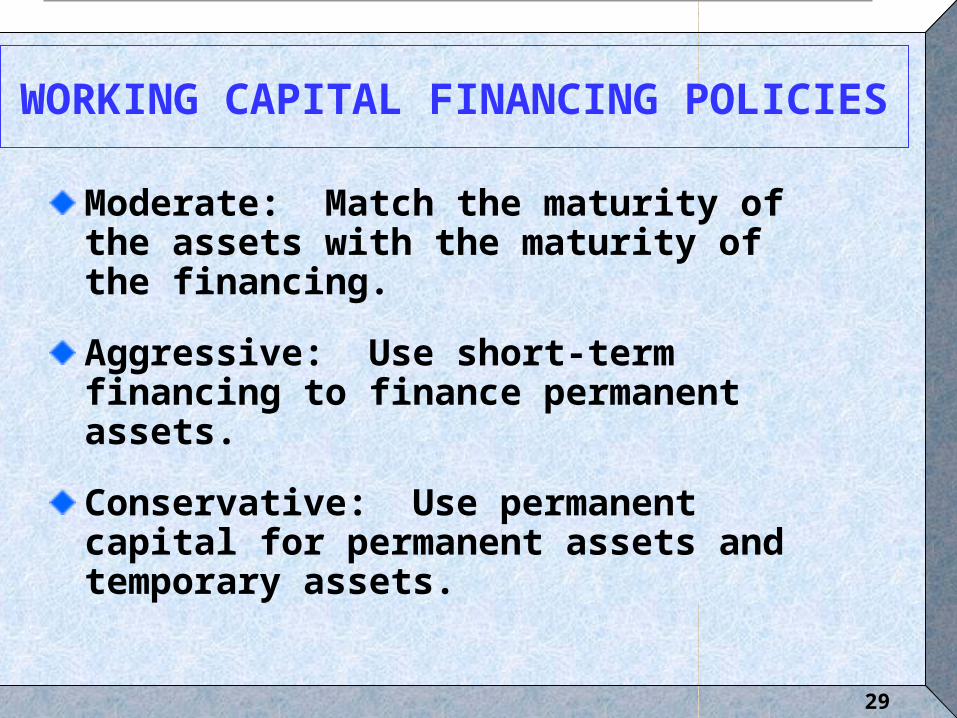
WORKING CAPITAL FINANCING POLICIES
Moderate: Match the maturity of the assets with the maturity of the financing.
Aggressive: Use short-term financing to finance permanent assets.
Conservative: Use permanent capital for permanent assets and temporary assets.

30

31
WHAT ARE THE ADVANTAGES OF SHORT-TERM DEBT VS. LONG-TERM DEBT?
Low cost-- yield curve usually slopes upward.
Can get funds relatively quickly.
Can repay without penalty.
What are the disadvantages of short-term debt vs. long-term debt?
Higher risk. The required repayment comes quicker, and the company may have trouble rolling over loans.

32
COMMERCIAL PAPER (CP)
Short term notes issued by large, strong companies. SKI couldn’t issue CP--it’s too small.
CP trades in the market at rates just above T-bill rate.
CP is bought with surplus cash by banks and other companies, then held as a marketable security for liquidity purposes.

33
TOPICS IN WORKING CAPITAL
MANAGEMENT

34
TIC = Total carrying costs+ total ordering costs
TIC = CP(Q/2) + F(S/Q).
C = Annual carrying costs (% of inv.).
P = Purchase price per unit.
Q = Number of units per order.
F = Fixed costs per order.
S = Annual usage in units.

35
36
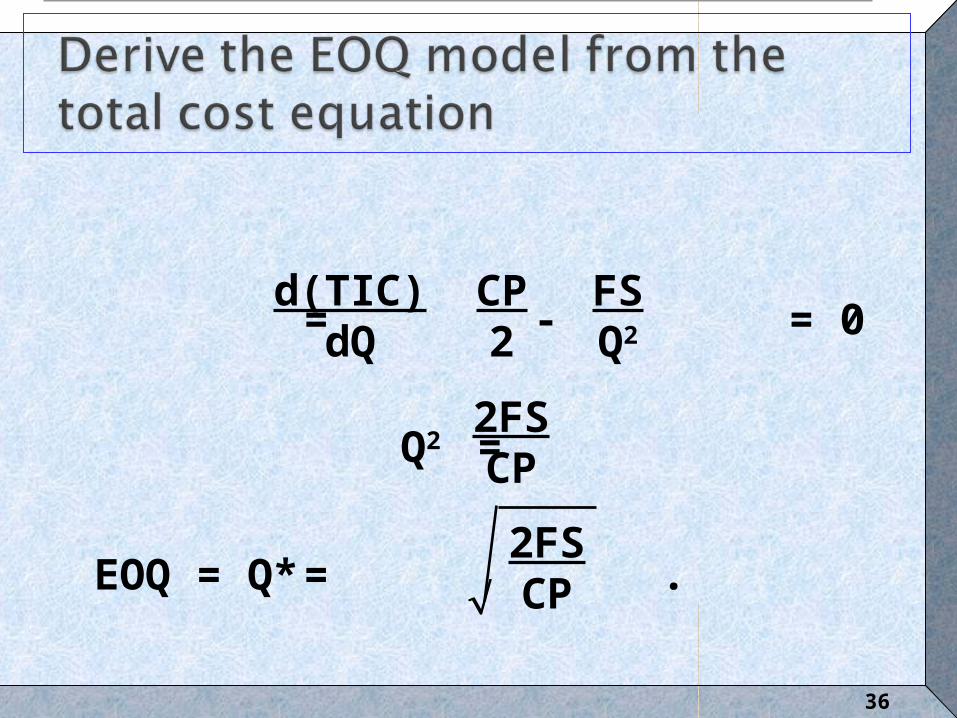
= - = 0
Q2 =
EOQ = Q* = .2FSCP
d(TIC)dQ
CP2
FSQ2
2FSCP

37
P = $200.
F = $1,000.
S = 5,000.
C = 0.2.
Minimum order size = 250.

38
EOQ =
=
= 250,000 = 500 units.
2($1,000)(5,000)0.2($200)
$10,000,00040
39
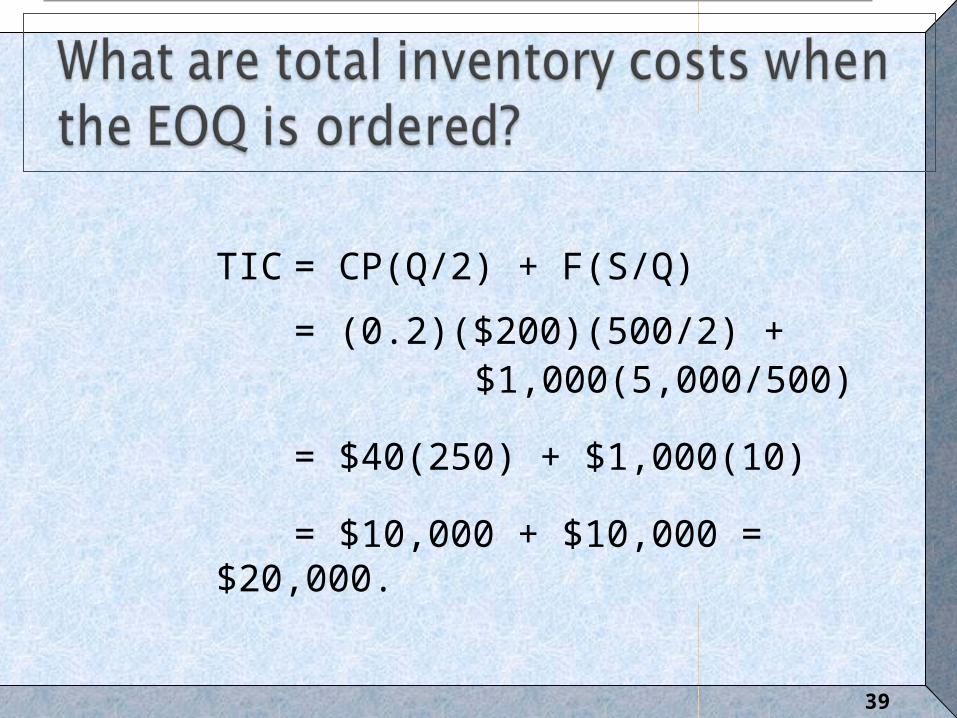
TIC = CP(Q/2) + F(S/Q)
= (0.2)($200)(500/2) + $1,000(5,000/500)
= $40(250) + $1,000(10)
= $10,000 + $10,000 = $20,000.
40
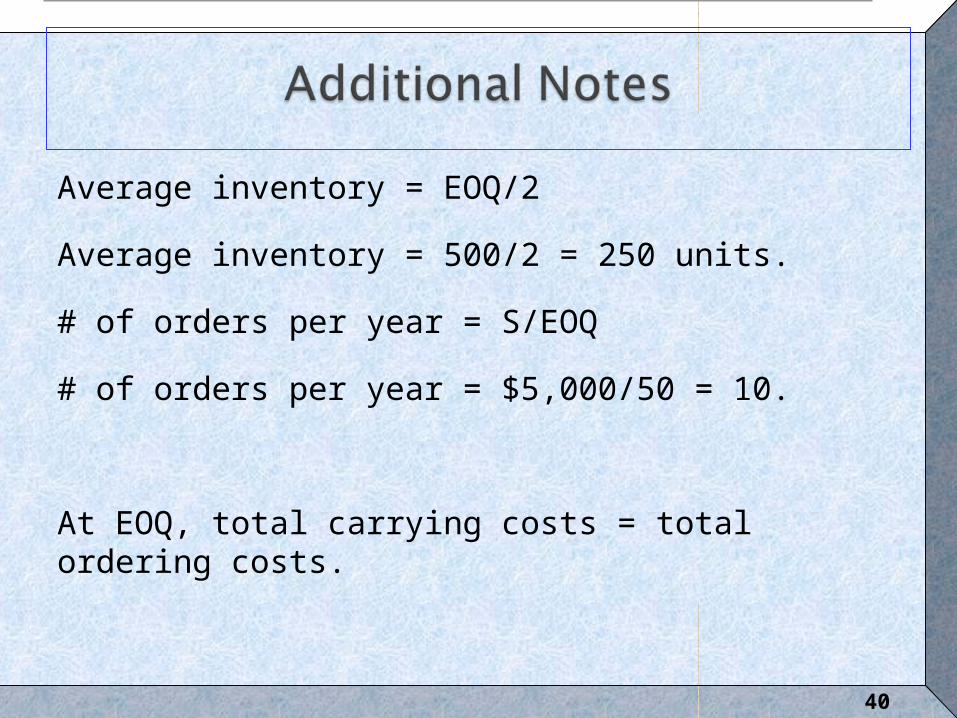
Average inventory = EOQ/2
Average inventory = 500/2 = 250 units.
# of orders per year = S/EOQ
# of orders per year = $5,000/50 = 10.
At EOQ, total carrying costs = total ordering costs.

41
400 units:
TIC = CP(Q/2) + F(S/Q)
= 0.2($200)(400/2) + $1,000(5,000/400)
= $8,000 + $12,500 = $20,500.
Added cost = $20,500 - $20,000 = $500.

42
TIC = CP(Q/2) + F(S/Q)
TIC = 0.2($200)(600/2) + $1,000(5,000/600)
= $12,000 +$8,333 = $20,333.
Added cost = $20,333 - $20,000 = $333.

43
At any quantity ≠ EOQ, total inventory costs are higher than necessary.
The added cost of not ordering the EOQ is not large if the quantity ordered is close to EOQ.
If Q < EOQ, then total carrying costs decrease, but ordering costs increase.
If Q > EOQ, total carrying costs increase, but ordering costs decrease.

44
Weekly usage rate = 5,000/52 = 96 units.
If order lead time = 2 weeks, firm must reorder when:
Inventory level = 2(96) = 192 units.

45
Without safety stocks, the firm’s total inventory costs = $20,000.
Cost of carrying additional 200 units = CP(Safety stock)= 0.2($200)(200) = $8,000.
Total inventory costs = $20,000 + $8,000
TIC = $28,000.

46
Average inventory = (500/2) + 20 = 450 units.
TIC = CP(Avg. Inv.) + F(S/Q)
= 0.2($200)(450) + $1,000(5,000/500)
= $18,000 + $10,000
= $28,000.

47
Reorder point = 200 + 192 = 392 units.The firm’s normal 96 unit usage could rise to 392/2 = 196 units per week.
Or the firm could operate for 392/96 = 4 weeks while awaiting delivery of an order.

48
Discount affects operating inventory only.
Discount price = $200(0.99) = $198.
TIC= CP(Q/2) + F(S/Q)
TIC = 0.2($198)(1,000/2) +1,000(5,000/1,000)
TIC = $19,800 + $5,000 = $24,800.
Savings = 0.01($200)(5,000) = $10,000Added costs = $24,800 - $20,000 = $ 4,800Net savings = $10,000 - $4,800 = $ 5,200

49
Just-in-time system: Eliminates the need for using EOQ.
Use of air freight for deliveries: Reduces the need for safety stock.
Computerized inventory control system: Reduces safety stocks.
Flexibility designed plants: Reduces inventory holdings of final goods.

50
The EOQ model can be applied to cash management if you view cash as an operating assets, just like inventory.
In this view, cash has a carrying cost, which is the opportunity cost for investing the funds, and an order cost, which is the cost per transaction of liquidating marketable securities and transferring the money to a checking account.

51
C = cash raised each time by selling securities or borrowing
r = opportunity cost of holding cash—equal to the rate of return on marketable securities or cost of borrowing
T = total amount of cash needed for transactions during the year
F = fixed per transaction cost of selling securities or obtaining a loan

52

53
Holding cost = (average cash balance) x (opportunity cost rate)
Average cash balance = C/2
Holding cost = C/2 x r = rC/2
T = total new cash needed in the year T/C = number of transactions (T/C)(F) = FT/C = total cost of all of the
transactions
54
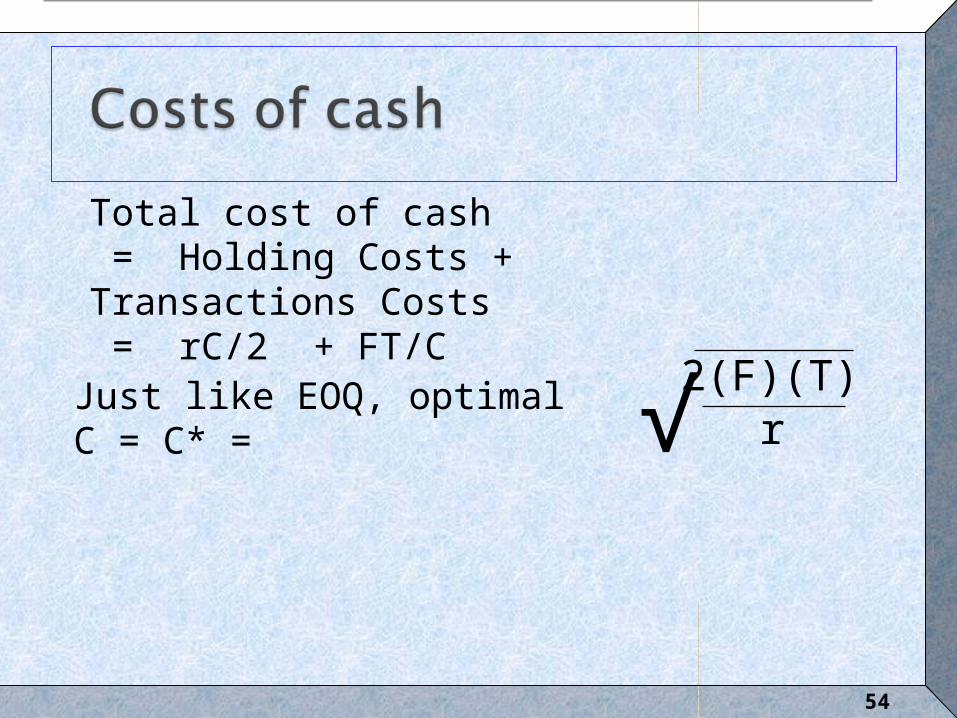
Total cost of cash = Holding Costs + Transactions Costs = rC/2 + FT/C
Just like EOQ, optimal C = C* = 2(F)(T)r√

55
Total cash outflows per week = $500,000 per month.
Total cash inflows from operations = $400,000 per month.
Net cash needs = $500,000 - $400,000=
$100,000 per month, or $1,200,000 each year.

56
r = 7% = rate the firm can earn on its marketable securities
Transaction/order costs = $32 per transaction (F)
C*= 2(32)(1200000)
0.07√ = $33,123

57
The optimal "order size" is $33,123, so the firm will liquidate marketable securities, or borrow from the bank, in blocks of $33,123. This is approximately $1,200,000/33,123 = 36 times a year, or about every week and a half.

58
F, r C*
$32, 7% $33,123
$50, 7% $41,404
$32, 5% $39,192
Higher order costs, lower carrying costs increase the optimal order size.

59

60