Lecture 12: Project Strategic Issues - MIT OpenCourseWare
88
ESD.36 System Project Management Instructor(s) + - October 18, 2012 Strategic Project Management Dr. James Lyneis Lecture 12
Transcript of Lecture 12: Project Strategic Issues - MIT OpenCourseWare

ESD.36 System Project Management
Instructor(s)
+
-
October 18, 2012
Strategic Project Management
Dr. James Lyneis
Lecture 12

+
-
2
Today’s Agenda
• Strategic Project Management
• Example 1: Project Preparation
• Example 2: Project Planning
• Example 3: Project Execution

+
-
3
System Project Management ESD.36 Framework
Project
Preparation Project
Planning
Project
Adaptation
Project
Monitoring
Enterprise has chosen what product or system to develop
Project
Learning
Project Completion
Next Project
Project Control
Doing the Right Job
Doing the Job Right

+
-
4
What is corporate strategy as it applies to projects and the project portfolio, versus “strategy” as it applies to an individual project ?

+
-
5
Corporate Strategy for the Project
Determining the fit of the project to business objectives (the “mission” – doing the right job)
features / scope of end product
schedule milestones (time to market)
delivered quality (defects)
resources & budget (development cost)
And the mix/timing of “projects” necessary to achieve corporate strategy
Operationally, “projects” implement corporate strategy.

+
-
6
Strategic Project Management
Understanding how project “design” decisions affect project performance … Scope/schedule/ ... (i.e., mission feasibility)
Organization, process, ...
Buffers, phase overlap, ...
Staffing strategies, schedule slip, ...
...
… and how they affect other current projects (portfolio issues), and future projects.
Learning from past projects.
Operationally, “day-to-day project decisions” implement project strategy.

+
-
7
Example: Strategic/Tactical vs Operational Staffing Decisions
Strategic/Tactical Hire experienced staff rather than inexperienced
Start with all of staff you need or gradually build
How much training for inexperienced staff
….
Operational Who specifically and with what experience
How many, and/or at what ramp up
When, what programs, etc.

+
-
8
System Project Management ESD.36 Framework
Project
Preparation Project
Planning
Project
Adaptation
Project
Monitoring
Enterprise has chosen what product or system to develop
Project
Learning
Project Completion
Next Project
Project Control
Doing the Right Job
Doing the Job Right
Strategic
Project
Management
Corporate Strategy

+
-
DISCUSSION?
9
+
-
10
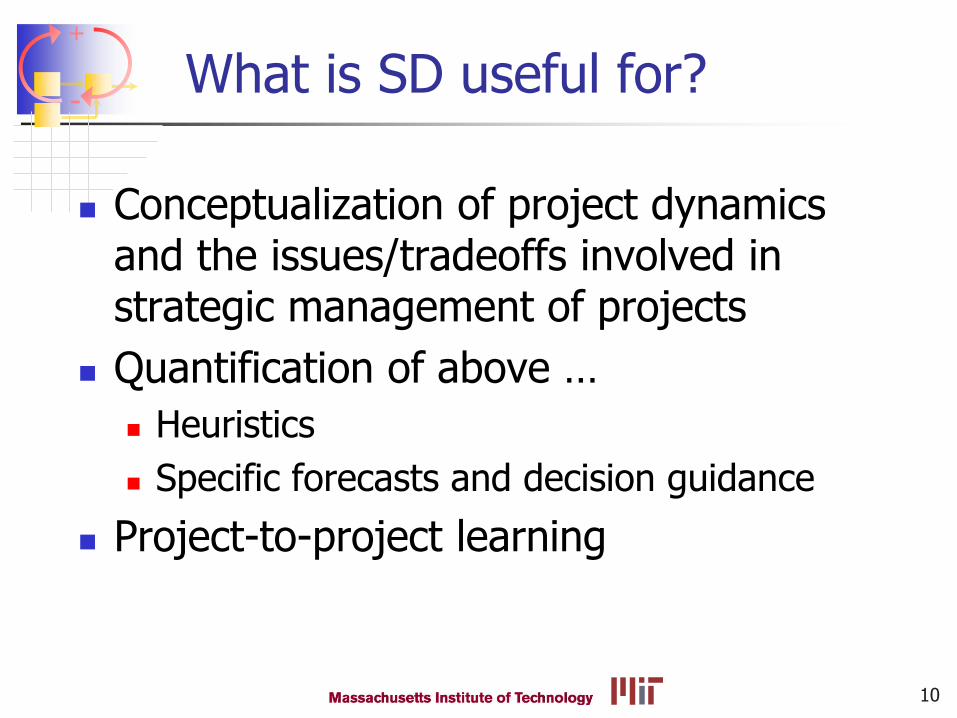
What is SD useful for?
Conceptualization of project dynamics and the issues/tradeoffs involved in strategic management of projects
Quantification of above …
Heuristics
Specific forecasts and decision guidance
Project-to-project learning
+
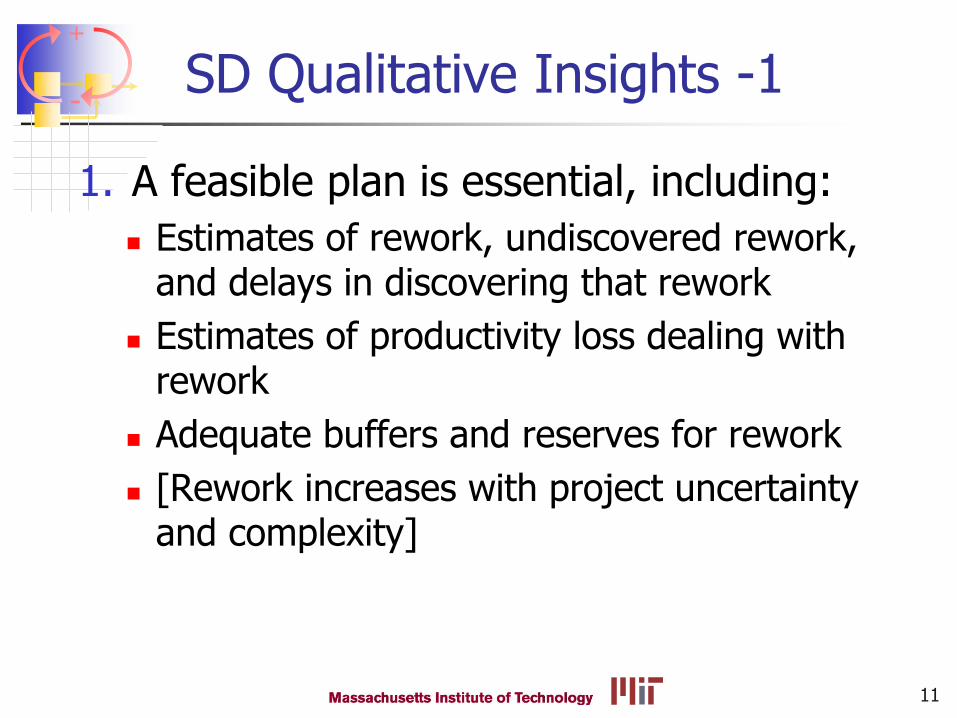
- SD Qualitative Insights -1
1. A feasible plan is essential, including:
Estimates of rework, undiscovered rework, and delays in discovering that rework
Estimates of productivity loss dealing with rework
Adequate buffers and reserves for rework
[Rework increases with project uncertainty and complexity]
11

+
- SD Qualitative Insights – 2
2. A feasible plan recognizes the “iron triangle”; there will be multiple “feasible” plans depending on priorities.
3. Tradeoffs in the plan can often be improved by changes in project structure and organization to reduce rework and delays in discovering rework.
12

+
- SD Qualitative Insights – 3
4. Attempts to achieve an infeasible plan via project control actions lead to “vicious circle” side effects which increase project cost and duration.
On complex projects, these costs usually exceed the “direct” costs of infeasibility
5. Project “changes,” and risks which materialize, are fundamentally the same as an infeasible plan. (Lecture 13)
13

+
- SD Qualitative Insights – 4
6. Project managers need buffers and/or flexibility (e.g., slip schedule, cut scope, ship with “bugs”) to respond to changes and uncertainties. These have costs that need to be evaluated; the importance of different tradeoffs differs by project. (Lecture 13)
7. The costs of project control can be minimized by understanding the sources of the vicious circles. The timing, magnitude, and duration of different controls affects performance.
14

+
-
15
SD Perspective: Typical project dynamics result in schedule &/or budget overrun ...
Project Staffing
Time
Typical Plan
What can we do to avoid/minimize the dynamics ...
… in project preparation and planning? … in project execution and adaptation?

+
-
OriginalWork to Do Work Done
UndiscoveredRework
Progressx
Fraction Correctand Complete
Time to Discover Rework
Rework toDo
ReworkDiscovery
- +
Productivity
EffortApplied
Rework
ProgressRework
Generation
++ -
ScopeGrowth
Changes
InfeasiblePlan
16
How Does It Get Started? Uncertainty & Complexity
These are characteristics of “complex” (vs. “simple”) projects
Other Risks

+
- Example Project
Scope = 1000 Tasks
Scheduled Completion Date = 30 (Month)
Staff = 40 (Implied budget of 1200 person- months, including 200 tasks estimated rework)
Normal Quality = 0.85
Productivity = 1 task/month/person
17
Note: Infeasible Plan

+
-
Staff & Progress
2,000 Tasks100 People
1,000 Tasks50 People
0 Tasks0 People
0 6 12 18 24 30 36 42 48 54 60Time (Month)
Work Done : Variable Fraction Correct Tasks
Cumulative Work Done : Variable Fraction Correct Tasks
Staff : Variable Fraction Correct People
Project Behavior
18
Cost = 1570 person-months, Finish 39.25
Work Done Staff
Total Tasks = 1570
How do we change & manage the project to improve its performance?

+
-
19
Today’s Agenda
• Strategic Project Management
• Example 1: Project Preparation
Developing a Consistent Plan • Example 2: Project Planning
• Example 3: Project Execution

+
-
20
A Consistent (Feasible) Project Avoids the Dynamics
“SD Class 3” Model With: Scope = 1000 (tasks)
Scheduled Completion Date = 35 (month) [versus 30 in Class 3 model]
Delivered Quality > 99%
Normal Fraction Correct = 0.85
Staff = 50 (people) [Versus 40 staff ; Implying a budget of 1750 person-months, versus 1200 person-months]
Estimated Rework = 750 tasks [versus 200]

+
-
Staff & Progress
60 People1,000 Tasks
30 People500 Tasks
0 People0 Tasks
0 6 12 18 24 30 36 42 48 54 60Time (Month)
Staff for Output : SD4 Feasible Plan1 PeopleWork Done : SD4 Feasible Plan1 Tasks
A Consistent Project Avoids the Dynamics
21
Work Done Staff
Basic Behaviour
1,000 Tasks1,000 Tasks1,000 Tasks
500 Tasks500 Tasks500 Tasks
0 Tasks0 Tasks0 Tasks
0 6 12 18 24 30 36 42 48 54 60Time
Work to Do : SD4 Feasible Plan1 Tasks
Work Done : SD4 Feasible Plan1 Tasks
Undiscovered Rework : SD4 Feasible Plan1 Tasks
Done
Undiscovered Rework
To Do
Plan fully accounts for rework tasks; Schedule and staffing plan reflect rework cycle

+
-
Fraction Correct and Complete
1
0.75
0.5
0.25
0
0 6 12 18 24 30 36 42 48 54 60Time (Month)
Fra
ctio
nFraction Correct and Complete : SD4 Feasible Plan1
Effect of Experience on Fraction Correct : SD4 Feasible Plan1
Effect of Undiscovered Rework on Fraction Correct : SD4 Feasible Plan1
"Effect of Intensity/Hours on Fraction Correct" : SD4 Feasible Plan1
Productivity
1.2
1.1
1
0.9
0.8
0 6 12 18 24 30 36 42 48 54 60Time (Month)
Ta
sk/(
Pe
rso
n*M
on
th)
Productivity : SD4 Feasible Plan1
Effect of Experience on Productivity : SD4 Feasible Plan1
"Effect of Intensity/Hours on Productivity" : SD4 Feasible Plan1
Normal design evolution accounted for in plan
22
Productivity
Effect of Experience Fraction Correct
Effect of Undiscovered Rework
Effect of Experience

+
-
Staff for Output
100
75
50
25
0
0 6 12 18 24 30 36 42 48 54 60Time (Month)
People
Staff for Output : SD4 Infeasible Plan Control
Staff for Output : SD4 Infeasible Plan No Control
Staff for Output : SD4 Feasible Plan1
Infeasible projects initiate the dynamics when management responds …
23
Feasible Plan
Trying to achieve inconsistent objectives can lead to disaster …
Infeasible, No Control
Infeasible, Control

+
-
OriginalWork to Do Work Done
UndiscoveredRework
Progressx
Fraction Correctand Complete
Time to Discover Rework
Rework toDo
ReworkDiscovery
- +
Productivity
EffortApplied
Rework
ProgressRework
Generation
++ -
ScopeGrowth
Changes
InfeasiblePlan
24
What do we expect? Uncertainty & Complexity Other Risks
Project Staffing
Time
Expectation:
Infeasible
plan
Feasible Plan

+
- But when management reacts
25
OriginalWork to Do Work Done
UndiscoveredRework
Progressx
Quality
Time to Discover Rework
Rework toDo
ReworkDiscovery
- +
Productivity
EffortApplied
Rework
ProgressRework
Generation
++ -
Known WorkRemaining
TimeRemaining
Effort Needed
+-
Deadline
+
+
+
People Overtime
Work Intensisty
Resources:
+
+
AddResources
ScopeGrowth
Changes
InfeasiblePlan
+ ! & !
QualityProductivity
Effort Applied
Known WorkRemaining
Time Remaining
Effort Needed+ -
Deadline
+
Overtime
Add People
Work Intensity
Work Faster or"Slack Off"
Work More
Workforce
Hiring
+
+
+
+
++
+
Original Work
to DoWork Done
Undiscovered
Rework
Progressx
Rework to Do
Rework Discovery
+
Rework
Progress ReworkGeneration
++
+
+
+
Fatigue
ExperienceCongestion &
CommunicationDifficulties
+
ExperienceDilution
+
Too Big toManage
Burnout
+-
-
---
+-
+
+
+
Haste MakesWaste
Morale
Hopelessness
+
+
IncreasedTurnover
+
Unknown Errors
in Prior Work +Errors Build
Errors
Errors CreateMore Work
Overlap &
Concurrence +Haste Creates
Out-of-Sequence Work
Scope Growth
+
-
-
-
+
+

+
-
Effect of Experience on Fraction Correct
1
0.9
0.8
0.7
0.6
0 6 12 18 24 30 36 42 48 54 60Time (Month)
Dim
en
sio
nle
ss
Effect of Experience on Fraction Correct : SD4 Infeasible Plan Control
Effect of Experience on Fraction Correct : SD4 Infeasible Plan No Control
Effect of Experience on Fraction Correct : SD4 Feasible Plan1
Trying to achieve infeasible plan …
26
Feasible
Plan
Effect of Experience on Fraction Correct
Infeasible, Control

+
-
Effect of Undiscovered Rework on Fraction Correct
1
0.85
0.7
0.55
0.4
0 6 12 18 24 30 36 42 48 54 60Time (Month)
Dim
en
sio
nle
ss
Effect of Undiscovered Rework on Fraction Correct : SD4 Infeasible Plan Control
Effect of Undiscovered Rework on Fraction Correct : SD4 Infeasible Plan No Control
Effect of Undiscovered Rework on Fraction Correct : SD4 Feasible Plan1
Which snowballs via “errors on errors” feedback …
27
Feasible
Plan
Effect of “Errors on Errors”
Infeasible, No Control
Infeasible, Control

+
-
28
With end result worse (schedule/cost) than if project budgeted higher at start!
Test
Infeasible Plan Targets
Infeasible, No Control
Infeasible, with control)
Feasible Plan 1
Feasible Plan 2
Finish Cost(person-mos)
30 1200
39.25 1570
36.25 2148
33.75 1615
30.125 1650
Note: Feasible Plan 1 (Initial Staff 50, Schedule 35, Budget 1750); Feasible Plan 2 (Initial Staff 60, Schedule 30, Budget 1800)
Best choice depends on corporate strategy.

+
-
29
The “Iron Triangle”
Project
Scope Cost
Schedule
There are alternative feasible plans that reflect project priorities

+
- Survey Question 1
Does your organization plan for rework in establishing project budgets and baselines?
1. Yes, we explicitly try to estimate the expected amount of rework
2. Yes, but only by adding a “management reserve”
3. No
30

+
-
31
Survey Question
Do you feel that on the typical project in your organization, budget and schedule are …
1. More than is needed __________
2. Tight, but manageable __________
3. Insufficient enough that the vicious circles are significant __________

+
-
32
Why Won’t We Develop a Realistic Plan?
Then why add resources when situation realized?

+
- Getting a Feasible Plan
Use a model
Use data from prior projects (learning!), and calibration, to estimate:
Normal Productivity
Normal Fraction Correct and Complete
Time to Discover Rework
Total rework and undiscovered rework profile
Strength of effects …
Include buffers and have a sound project control plan (see example 3)
33

+
- SD Qualitative Insights Review
1. A feasible plan is essential, including:
Estimates of rework, undiscovered rework, and delays in discovering that rework
Estimates of productivity loss dealing with rework
Adequate buffers and reserves for rework
[Rework increases with project uncertainty and complexity]
2. A feasible plan recognizes the “iron triangle”; there will be multiple “feasible” plans depending on priorities.
4. Attempts to achieve an infeasible plan via project control actions lead to “vicious circle” side effects which increase project cost and duration.
34

+
- SD Qualitative Insights – 2
2. A feasible plan recognizes the “iron triangle”; there will be multiple “feasible” plans depending on priorities.
3. Tradeoffs in the plan can often be improved by changes in project structure and organization to reduce rework and delays in discovering rework.
35

+
-
36
Today’s Agenda
• Strategic Project Management
• Example 1: Project Preparation
• Example 2: Project Planning
Deciding on the Process Model • Example 3: Project Execution

+
-
37
What Increases Cost & Schedule?
Uncertainty that reduces fraction complete and correct.
Technical complexity
Uncertainty about customer requirements

+
-
38
Strategic Project Planning
What changes in process, organization, etc. might help deal with technical or customer uncertainties?
Increase planned design iterations?
Autonomous (dedicated) integrated product team vs. functional?
Waterfall vs. d/b/t iterative vs. spiral vs. …?
More phase overlap and concurrency?
How do we assess what process model is right for out project?

+
-
39
How do we assess what process model is right for our project?
Determining Impact on Dynamics:
1. Model project with current processes, policies, …
2. Specify direct impacts of alternatives on -- Scope (added tasks)
Productivity
Fraction correct and complete
Rework discovery
Strength of productivity and FCC effects
...
[Secondary impacts assessed via simulation]
3. Simulate and compare performance
4. Test sensitivity to uncertain assumptions
+
-
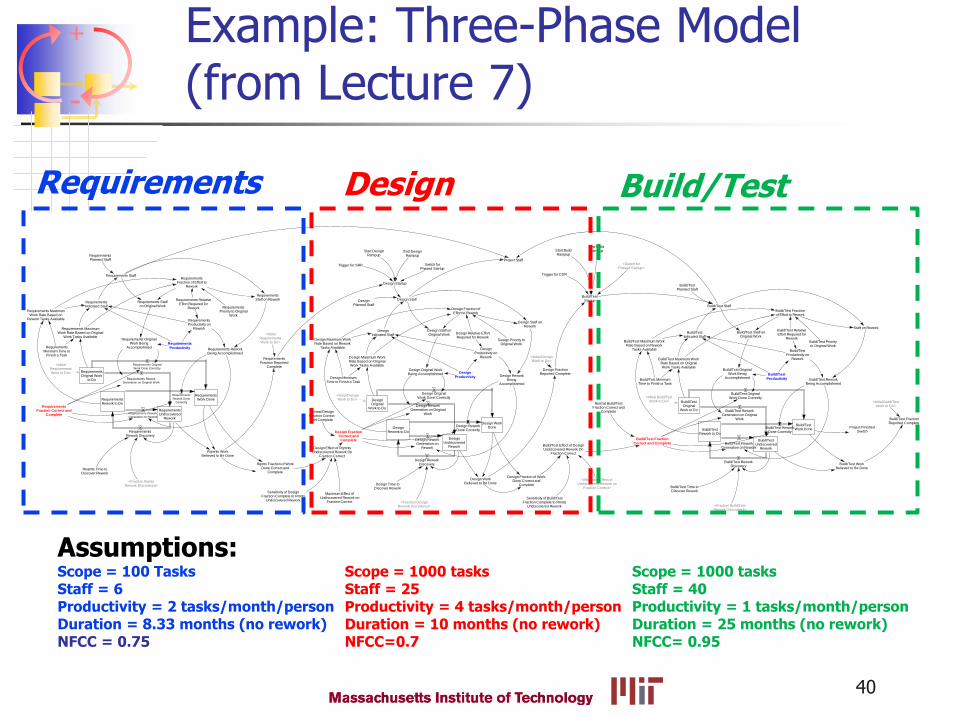
Example: Three-Phase Model (from Lecture 7)
40
RequirementsFraction Reported
Complete
Design Startup
Project Staff
Design FractionReported Complete
Build/TestStartup
Trigger for SRR
Trigger for CDR
Switch forPhased Startup
<Switch forPhased Startup>
Reqmts Time toDiscover Rework
Design Time toDiscover Rework Build/Test Time to
Discover Rework
Build/Test FractionReported Complete
Normal DesignFraction Correctand Complete
Design Effect of RqmntsUndiscovered Rework On
Fraction Correct
Rqmts Fraction of WorkDone Correct and
Complete
Rqmnts WorkBelieved to Be Done
Sensitivity of DesignFraction Complete to Rmnts
Undiscovered Rework
Maximum Effect ofUndiscovered Rework on
Fraction Correct
Build/Test Effect of DesignUndiscovered Rework On
Fraction Correct
Design Fraction of WorkDone Correct and
Complete
Design WorkBelieved to Be Done
Sensitivity of Build/TestFraction Complete to Rmnts
Undiscovered Rework
Normal Build/TestFraction Correct and
Complete
<Maximum Effect ofUndiscovered Rework on
Fraction Correct>
Build/Test WorkBelieved to Be Done
Start DesignRampup
End DesignRampup
Start BuildRampup
End BuildRampup
<Fraction RqmtsRework Discovered>
<Fraction DesignRework Discovered> <Fraction Build/Test
Rework Discovered>
RequirementsOriginal Work
to Do
RequirementsWork Done
RequirementsUndiscovered
Rework
Requirements Original
Work Done Correctly
Requirements Rework
Generation on Original Work
RequirementsFraction Correct and
Complete
Requirements Staff
Requirements
Productivity
RequirementsPlanned Staff
RequirementsMinimum Time to
Finish a Task
RequirementsFraction of Effort to
Rework
Requirements OriginalWork Being
AccomplishmedRequirements ReworkBeing Accomplishmed
Requirements MaximumWork Rate Based on Original
Work Tasks Available
RequirementsRework to Do
RequirementsRework Discovery
Requirements Rework
Generation on Rework
RequirementsStaff on Rework
RequirementsProductivity on
Rework
Requirements RelativeEffort Required for
Rework
Requirements Staffon Original Work
Requirements
Rework Done
Correctly
<InitialRequirementsWork to Do>
RequirementsIndicated Staff
Requirements MaximumWork Rate Based on
Rework Tasks Available
RequirementsPriority to Original
Work
<InitialRequirementsWork to Do>
DesignOriginal
Work to Do
Design WorkDone
DesignUndiscovered
Rework
Design OriginalWork Done Correctly
Design ReworkGeneration on Original
Work
Design FractionCorrect andComplete
Design Staff
Design
Productivity
DesignPlanned Staff
Design MinimumTime to Finish a Task
Design Fraction ofEffort to Rework
Design Original WorkBeing Accomplishmed
Design ReworkBeing
Accomplishmed
Design Maximum WorkRate Based on OriginalWork Tasks Available
DesignRework to Do
Design ReworkDiscovery
Design ReworkGeneration on
Rework
Design Staff onRework
DesignProductivity on
Rework
Design Relative EffortRequired for Rework
Design Staff onOriginal Work
Design ReworkDone Correctly
<Initial DesignWork to Do>
DesignIndicated Staff
Design Maximum WorkRate Based on Rework
Tasks Available
Design Priority toOriginal Work
<Initial DesignWork to Do>
Build/TestOriginal
Work to Do
Build/TestWork Done
Build/TestUndiscovered
Rework
Build/Test OriginalWork Done Correctly
Build/Test ReworkGeneration on Original
Work
Build/Test Fraction
Correct and Complete
Build/Test Staff
Build/Test
Productivity
Project FinishedSwitch
Build/TestPlanned Staff
Build/Test MinimumTime to Finish a Task
Build/Test Fractionof Effort to Rework
Build/Test OriginalWork Being
AccomplishmedBuild/Test Rework
Being Accomplishmed
Build/Test Maximum WorkRate Based on OriginalWork Tasks Available
Build/TestRework to Do
Build/Test ReworkDiscovery
Build/Test ReworkGeneration on Rework
Staff on Rework
Build/TestProductivity on
Rework
Build/Test RelativeEffort Required for
Rework
Build/Test Staff onOriginal Work
Build/Test ReworkDone Correctly
<Initial Build/TestWork to Do>
Build/TestIndicated Staff
Build/Test Maximum WorkRate Based on Rework
Tasks Available
Build/Test Priorityto Original Work
<Initial Build/TestWork to Do>
Requirements Design Build/Test
Assumptions: Scope = 100 Tasks Scope = 1000 tasks Scope = 1000 tasks Staff = 6 Staff = 25 Staff = 40 Productivity = 2 tasks/month/person Productivity = 4 tasks/month/person Productivity = 1 tasks/month/person Duration = 8.33 months (no rework) Duration = 10 months (no rework) Duration = 25 months (no rework) NFCC = 0.75 NFCC=0.7 NFCC= 0.95

+
-
Rework Discovery Assumptions (similar to CityCar HW#3)
60% of rework discoverable in design
One design planned iteration & limited design review
Fraction of Rework Discovered in First Iteration =
30%
Fraction of Rework Discovered in Later Design Iterations = 70% two iterations, 95% three iterations (note: derivable via DSM and signal flow graph simulation?)
Tasks repeated per iteration = 25%
Build starts when design is 70% reported complete
41

+
-
Project Staff
80
60
40
20
0
0 6 12 18 24 30 36 42 48 54 60Time (Month)
Pe
op
leRequirements Staff : Three P Four Stock V5 Base
Design Staff : Three P Four Stock V5 Base
"Build/Test Staff" : Three P Four Stock V5 Base
Project Staff : Three P Four Stock V5 Base
Work Done
1,000
750
500
250
0
0 6 12 18 24 30 36 42 48 54 60Time (Month)
Ta
sk
Requirements Work Done : Three P Four Stock V5 Base
Design Work Done : Three P Four Stock V5 Base
"Build/Test Work Done" : Three P Four Stock V5 Base
Simulation results for current processes …
Requirements
Design
Build/Test
Requirements Design
Build/Test Total
42
No rework finish
Design “done”

+
-
Design Stocks
1,000
750
500
250
-0.0002
0 6 12 18 24 30 36 42 48 54 60Time (Month)
Ta
sk
Design Original Work to Do : Three P Four S V5 BNFCC 0pt95 Sens 0pt75 Middle One Iter New5
Design Undiscovered Rework : Three P Four S V5 BNFCC 0pt95 Sens 0pt75 Middle One Iter New5
Design Rework to Do : Three P Four S V5 BNFCC 0pt95 Sens 0pt75 Middle One Iter New5
Design Work Done : Three P Four S V5 BNFCC 0pt95 Sens 0pt75 Middle One Iter New5
43
Original Work
Undiscovered Rework
Rework
Work Done
0
Design “done”
Fraction Design Rework Discovered
1
0.75
0.5
0.25
0
0 6 12 18 24 30 36 42 48 54 60Time (Month)
Fra
ctio
n
Fraction Design Rework Discovered : Three P Four S V5 BNFCC 0pt95 Sens 0pt75 Middle One Iter New5
Discovery by build
Discovery by design
Can we improve performance by shifting more rework discovery to design?

+
-
Sources of Rework – Categories (from Lecture 7)
1. Classical “Quality” or design misexecution from people or technical coupling. Discoverable by further design work such as iteration, review.
2. Technical complexity/novelty; customer uncertainty. Discoverable by build/test work, including d/b/t iterations.
3. Knock-on Rework Work done “correctly” but ultimately needing rework. Discoverable by both.
44

+
- Example: Planned Design Iterations
45
DesignOriginal
Work to Do
Design WorkDone
DesignUndiscovered
Rework
Design Original Work Done Correctly
Design ReworkGeneration on Original
Work
Design FractionCorrect andComplete
Design Staff
Design Productivity
Design Original WorkBeing Accomplishmed
Design ReworkBeing
Accomplishmed
DesignRework to Do
Design ReworkDiscovery
Design ReworkGeneration on
Rework
Design Staff onRework
Design Staff onOriginal Work
<Build/Test InitialWork to Do>
Build/TestOriginal
Work to Do
Build/TestWork Done
Build/TestUndiscovered
Rework
Build/Test Original Work Done Correctly
Build/Test ReworkGeneration on Original
Work
Build/Test Fraction
Correct and Complete
Build/Test Staff
Build/Test Productivity
Build/test OriginalWork Being
AccomplishmedBuild/Test Rework
Being Accomplishmed
Build/TestRework to Do
Build/Test ReworkDiscovery
Build/Test ReworkGeneration on Rework
Build/Test Staffon Rework
Build/Test Staff onOriginal Work
<Build/Test InitialWork to Do>
Design FractionReported Complete
Design Fraction of WorkDone Correct and
Complete
Build/Test FractionReported Complete
1. Add iteration tasks
2. Which discover more rework in design
Rework discovered in Build/Test
Rework discovered in Design

+
-
Design Staff
40
30
20
10
0
0 6 12 18 24 30 36 42 48 54 60Time (Month)
Pe
op
leDesign Staff : Three P Four S V5 BNFCC 0pt95 Sens 0pt75 Middle One Three New5
Design Staff : Three P Four S V5 BNFCC 0pt95 Sens 0pt75 Middle One Two New5
Design Staff : Three P Four S V5 BNFCC 0pt95 Sens 0pt75 Middle One Iter New5
Increasing design iterations …
Design Cumulative Original Work Done
2,000
1,500
1,000
500
0
0 6 12 18 24 30 36 42 48 54 60Time (Month)
Ta
sks
Design Cumulative Original Work Done : Three P Four S V5 BNFCC 0pt95 Sens 0pt75 Middle One Three New5
Design Cumulative Original Work Done : Three P Four S V5 BNFCC 0pt95 Sens 0pt75 Middle One Two New5
Design Cumulative Original Work Done : Three P Four S V5 BNFCC 0pt95 Sens 0pt75 Middle One Iter New5
46
One
Three Two
One
Three
Two
… increases design original work, but reduces downstream rework.

+
-
… pushes more rework discovery into design
47
Selected Variables
2
1.5
1
0.5
0
0 6 12 18 24 30 36 42 48 54 60Time (Month)
Fra
ctio
n
Fraction Design Rework Discovered : Three P Four S V5 BNFCC 0pt95 Sens 0pt75 Middle One Three New5
Fraction Design Rework Discovered : Three P Four S V5 BNFCC 0pt95 Sens 0pt75 Middle One Two New5
Fraction Design Rework Discovered : Three P Four S V5 BNFCC 0pt95 Sens 0pt75 Middle One Iter New5
One Three
Two
Fraction of Design Rework Discovered Over Time

+
-
Three iterations discovers all the “discoverable” rework
48
Fraction Rework Discovered by Design as Fraction of Max
1
0.75
0.5
0.25
0
0 6 12 18 24 30 36 42 48 54 60Time (Month)
Fra
ctio
n
Fraction Rework Discovered by Design as Fraction of Max : Three P Four S V5 BNFCC 0pt95 Sens 0pt75 Middle One Three New5
Fraction Rework Discovered by Design as Fraction of Max : Three P Four S V5 BNFCC 0pt95 Sens 0pt75 Middle One Two New5
Fraction Rework Discovered by Design as Fraction of Max : Three P Four S V5 BNFCC 0pt95 Sens 0pt75 Middle One Iter New5
One
Three
Two
Derivable via DSM and signal flow graph simulation?

+
-
Increasing rework discovered in design reduces rework left for build …
49
Fraction Rework Discovered by Design
1
0.75
0.5
0.25
0
0 6 12 18 24 30 36 42 48 54 60Time (Month)
Fra
ctio
n
Fraction Rework Discovered by Design : Three P Four S V5 BNFCC 0pt95 Sens 0pt75 Middle One Three New5
Fraction Rework Discovered by Design : Three P Four S V5 BNFCC 0pt95 Sens 0pt75 Middle One Two New5
Fraction Rework Discovered by Design : Three P Four S V5 BNFCC 0pt95 Sens 0pt75 Middle One Iter New5
Fraction Rework Discovered By Build
0.8
0.6
0.4
0.2
0
0 6 12 18 24 30 36 42 48 54 60Time (Month)
Fra
ctio
n
Fraction Rework Discovered By Build : Three P Four S V5 BNFCC 0pt95 Sens 0pt75 Middle One Three New5
Fraction Rework Discovered By Build : Three P Four S V5 BNFCC 0pt95 Sens 0pt75 Middle One Two New5
Fraction Rework Discovered By Build : Three P Four S V5 BNFCC 0pt95 Sens 0pt75 Middle One Iter New5
One
Three
Two
One
Three
Two

+
-
Cumulative Build Rework
600
450
300
150
0
0 6 12 18 24 30 36 42 48 54 60Time (Month)
Ta
sks
Cumulative Build Rework : Three P Four S V5 BNFCC 0pt95 Sens 0pt75 Middle One Three New5
Cumulative Build Rework : Three P Four S V5 BNFCC 0pt95 Sens 0pt75 Middle One Two New5
Cumulative Build Rework : Three P Four S V5 BNFCC 0pt95 Sens 0pt75 Middle One Iter New5
Improving build “quality” and reducing build rework
Build/Test Fraction Correct and Complete
1
0.75
0.5
0.25
0
0 6 12 18 24 30 36 42 48 54 60Time (Month)
Fra
ctio
n
"Build/Test Fraction Correct and Complete" : Three P Four S V5 BNFCC 0pt95 Sens 0pt75 Middle One Three New5
"Build/Test Fraction Correct and Complete" : Three P Four S V5 BNFCC 0pt95 Sens 0pt75 Middle One Two New5
"Build/Test Fraction Correct and Complete" : Three P Four S V5 BNFCC 0pt95 Sens 0pt75 Middle One Iter New5
50
One
Three
Two
One
Three
Two -13.1%
-26.6%

+
- With the “Base Case” Assumptions …
51
… the increasing design cost indicates two iterations are “optimal”.
What assumptions impact this tradeoff?
While build effort is reduced with more design iterations …

+
- Assumptions
Fraction of design tasks that need to be repeated per iteration
Relative cost of build/test versus design
When build starts (overlap with design)
52

+
-
The benefits of design iteration increase the higher build cost
53
0.5 1 1.25 1.5 1.75 2 3
One Iteration 1187 1903 2261 2619 2977 3335 4767
Two Iterationss 1199 1.01% 1887 -0.84% 2231 -1.33% 2575 -1.68% 2919 -1.95% 3263 -2.16% 4639 -2.69%
Three Iterations 1243.5 4.76% 1904 0.05% 2234 -1.18% 2565 -2.08% 2895 -2.76% 3225 -3.30% 4546 -4.64%
Build Cost Multiplier
Cumulative Effort (Person-Months)
Increasing Build Cost

+
-
Build is starting before design rework is fully discovered
One Iteration
Build FCC from Design
1
0.75
0.5
0.25
0
0 6 12 18 24 30 36 42 48 54 60Time (Month)
Dim
en
sio
nle
ss
"Build/Test Effect of Design Undiscovered Rework On Fraction Correct" : Three P Four S V5 BNFCC 0pt95 Sens 0pt75 Middle One Iter New5
Fraction of Released Design Work Correct and Complete : Three P Four S V5 BNFCC 0pt95 Sens 0pt75 Middle One Iter New5
"Build/Test Startup" : Three P Four S V5 BNFCC 0pt95 Sens 0pt75 Middle One Iter New5
Three Iterations
Build FCC from Design
1
0.75
0.5
0.25
0
0 6 12 18 24 30 36 42 48 54 60Time (Month)
Dim
en
sio
nle
ss
"Build/Test Effect of Design Undiscovered Rework On Fraction Correct" : Three P Four S V5 BNFCC 0pt95 Sens 0pt75 Middle One Three New5
Fraction of Released Design Work Correct and Complete : Three P Four S V5 BNFCC 0pt95 Sens 0pt75 Middle One Three New5
"Build/Test Startup" : Three P Four S V5 BNFCC 0pt95 Sens 0pt75 Middle One Three New5
54
Build/Test Ramp-up
Build/Test Ramp-up
Effect of Design Undiscovered Rework on Fraction Correct
Delaying build with one iteration will have less benefit because build needed to discover rework.
Iterations 2 & 3 occurring months 18-24
+
- Benefits of delaying build start
55
"Middle" Project "New5 Results"Cum Design Build Total
Test Build Rework Effort Effort Effort Finish
One Iteration 425.16 404.4 1432 1903 51.6875
Two Iterations 369.38 -13.1% 444.45 1376 1887 -0.84% 52.875
Three Iterations, Start 70% 311.86 -26.6% 516 1321 1904 0.05% 54.8125
Three Iterations, Start 60% 337.67 -20.6% 516 1353 1935 1.68% 53.5
Three Iterations, Start 70% 311.86 -26.6% 516 1321 1904 0.05% 54.8125
Three Iterations, Start 80% 285.49 -32.9% 516 1291 1874 -1.52% 55.4375
Three Iterations, Start 90% 271.99 -36.0% 516 1275 1857 -2.42% 56
Two Iteration, Start 60% 386.26 -9.1% 444.45 1396 1907 0.21% 51.125
Two Iteration, Start 70% 369.4 -13.1% 444.45 1376 1887 -0.84% 52.875
Two Iteration, Start 80% 359 -15.6% 444.45 1364 1875 -1.47% 53.4375
Two Iteration, Start 90% 348.72 -18.0% 444.45 1353 1864 -2.05% 54.0625
Three iterations, start at 90% “optimal” cost, but finish is later.

+
-
Other Factors Affection Desirability of More Planned Iterations
Normal amount of rework
Amount of rework discoverable in design (vs in build/test)
Additional rework discovered per iteration
…
56

+
- Developing Heuristics by Project Type
Parameter “Novel” “Repeat” “Mature”
Normal FCC 0.6 0.7 0.8
Frac Discoverable (examples) in Design 0.3 0.6 0.9
Frac Discoverable First Iteration Depends on product & organization:
Frac Discoverable analyze projects, use DSM & Later Iterations signal flow graph simulation to
Tasks Repeated estimate.
# Iterations 1 3 2
Build Start When planned iterations done. Use simulation to develop heuristics by project type.
57

+
- Summary
1. Under almost all situations, two design iterations are most cost effective. The benefits of multiple iterations increases the more design rework that can be discovered by design. Hence, multiple iterations makes more sense for “Repeat” and “Middle” projects than for “Novel” projects.
2. The start of build should be delayed until the design effort has executed all of the planned iterations.
3. The benefits of additional design iteration increases the higher build/test costs are relative to design costs.
58
+
-
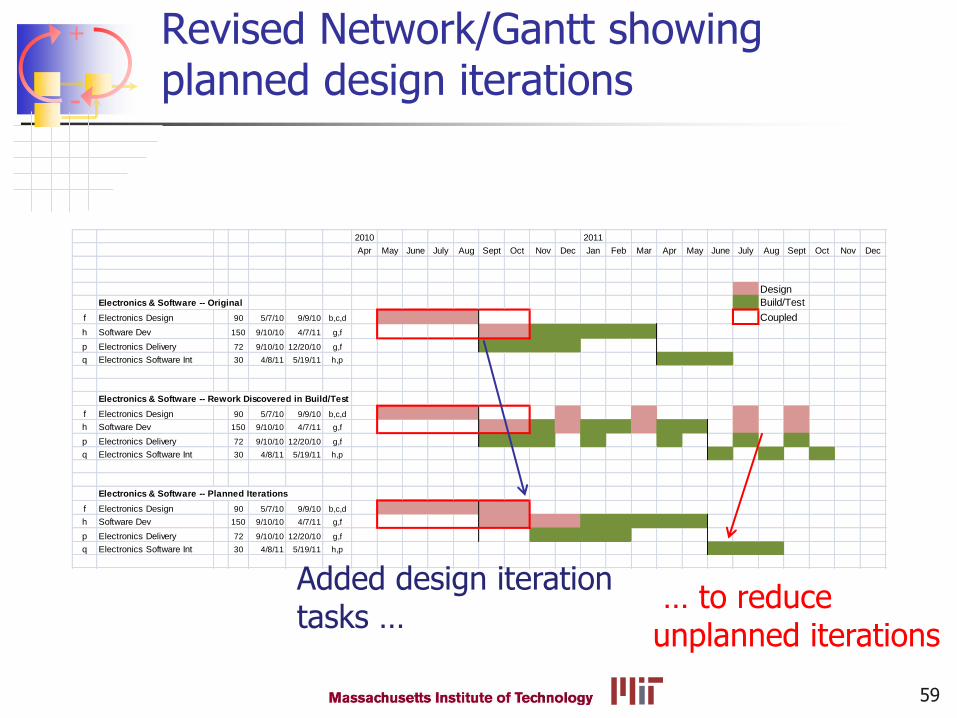
Revised Network/Gantt showing planned design iterations
2010 2011
Apr May June July Aug Sept Oct Nov Dec Jan Feb Mar Apr May June July Aug Sept Oct Nov Dec
Design
Electronics & Software -- Original Build/Test
f Electronics Design 90 5/7/10 9/9/10 b,c,d Coupled
h Software Dev 150 9/10/10 4/7/11 g,f
p Electronics Delivery 72 9/10/10 12/20/10 g,f
q Electronics Software Int 30 4/8/11 5/19/11 h,p
Electronics & Software -- Rework Discovered in Build/Test
f Electronics Design 90 5/7/10 9/9/10 b,c,d
h Software Dev 150 9/10/10 4/7/11 g,f
p Electronics Delivery 72 9/10/10 12/20/10 g,f
q Electronics Software Int 30 4/8/11 5/19/11 h,p
Electronics & Software -- Planned Iterations
f Electronics Design 90 5/7/10 9/9/10 b,c,d
h Software Dev 150 9/10/10 4/7/11 g,f
p Electronics Delivery 72 9/10/10 12/20/10 g,f
q Electronics Software Int 30 4/8/11 5/19/11 h,p
59
Added design iteration tasks …
… to reduce unplanned iterations

+
- SD Qualitative Insights – 2
3. Tradeoffs in the plan can often be improved by changes in project structure and organization to reduce rework and delays in discovering rework.
See textbook Chapter SD4 for other examples.
60

+
-
61
Today’s Agenda
• Strategic Project Management
• Example 1: Project Preparation
• Example 2: Project Planning
• Example 3: Project Execution
Deciding on Project Controls

+
- SD Qualitative Insights – 4
6. Project managers need buffers and/or flexibility (e.g., slip schedule, cut scope, ship with “bugs”) to respond to changes and uncertainties. These have costs that need to be evaluated; the importance of different tradeoffs differs by project. (Lecture 13)
7. The costs of project control can be minimized by understanding the sources of the vicious circles. The timing, magnitude, and duration of different controls affects performance.
62

+
-
63
Strategic Control Issues
Incorporating rework estimates in planning and progress monitoring (see Chapter SD4.4).
How much to rely on “work intensity” vs. overtime vs. adding staff?
Should you slip the schedule? Early or late?
Should you pay extra for experience when adding staff?
How much training (delay in adding staff, but higher productivity and quality)?
A Strategic View – Deciding in advance the best way to handle problems if they arise

+
- Project Resource Control
You’ve misplanned, either because you don’t include rework estimates or because this particular project has unusually high levels ….
Or
Scope growth occurred on the project
Other risks/problems materialized
What do you do? (note – these are “permanent” impacts, not temporary
delays on isolated parts) 64

+
-
Project Control
QualityProductivity
Effort Applied
Known WorkRemaining
Time Remaining
Effort Needed+ -
Deadline
+
Overtime
Add People
Work Intensity
Work Faster or"Slack Off"
Work More
Workforce
Hiring
+
+
+
+
++
+
Original Work
to DoWork Done
Undiscovered
Rework
Progressx
Rework to Do
Rework Discovery
+
Rework
Progress ReworkGeneration
++
+
+
+
Fatigue
ExperienceCongestion &
CommunicationDifficulties
+
ExperienceDilution
+
Too Big toManage
Burnout
+-
-
---
+-
+
+
+
Haste MakesWaste
Morale
Hopelessness
+
+
IncreasedTurnover
+
Unknown Errors
in Prior Work +Errors Build
Errors
Errors CreateMore Work
Overlap &
Concurrence +Haste Creates
Out-of-Sequence Work
ScopeGrowth
+
-
-
-
+
+
Changes
InfesaiblePlan
“So the best thing to do is to do nothing, right?”
+ ! & !
65
No – the costs of project control can be minimized by understanding the sources of the vicious circles. The timing, magnitude, and duration of different controls affects performance.

+
- What do you do? 2012
66
What You Do at 30%First Second Third Fourth Fifth Sixth
Add People 10.6% 52.2% 17.1% 11.6% 14.3% 25.0%
Longer Hours 31.9% 23.9% 26.8% 16.3% 7.1% 0.0%
Intensity 25.5% 13.0% 19.5% 23.3% 21.4% 0.0%
Slip 17.0% 8.7% 19.5% 23.3% 26.2% 25.0%
Cut Scope 14.9% 2.2% 17.1% 25.6% 31.0% 50.0%
Other 0.0% 0.0% 0.0% 0.0% 0.0% 0.0%
Total 100.0% 100.0% 100.0% 100.0% 100.0% 100.0%
What You Do at 65%First Second Third Fourth Fifth Sixth
Add People 16.7% 50.0% 31.1% 9.5% 8.9% 25.0%
Longer Hours 35.4% 29.2% 17.8% 9.5% 13.3% 0.0%
Intensity 16.7% 8.3% 26.7% 21.4% 22.2% 0.0%
Slip 8.3% 10.4% 15.6% 38.1% 24.4% 50.0%
Cut Scope 22.9% 2.1% 8.9% 21.4% 31.1% 25.0%
Other 0.0% 0.0% 0.0% 0.0% 0.0% 0.0%
Total 100.0% 100.0% 100.0% 100.0% 100.0% 100.0%

+
- % Specifying 1st or 2nd Choice
What You Do?At 30% At 65%
Add People 40.8% 34.7%
Longer Hours 24.3% 23.5%
Intensity 21.4% 19.4%
Slip 5.8% 11.2%
Cut Scope 7.8% 11.2%
Other 0.0% 0.0%
Total 100.0% 100.0%
67
2011
What You Do?At 30% At 65%
Add People 31.2% 33.3%
Longer Hours 28.0% 32.3%
Intensity 19.4% 12.5%
Slip 12.9% 9.4%
Cut Scope 8.6% 12.5%
Other 0.0% 0.0%
2012

+
-
68
Brooks’ Law
"Adding manpower to a late software
project makes it later." Brooks,
Frederick P. Jr. The Mythical Man-
Month. Reading, MA, Addison Wesley,
1995.
Homework 5 Analysis: Under what
conditions is this true.
+
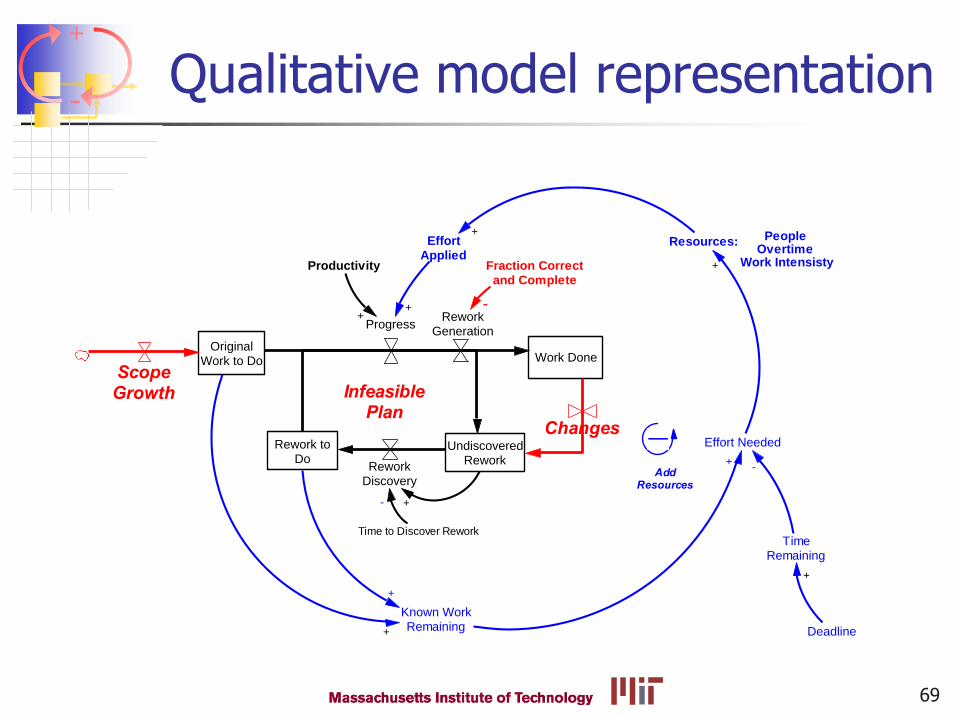
- Qualitative model representation
69
OriginalWork to Do Work Done
UndiscoveredRework
Progressx
Fraction Correctand Complete
Time to Discover Rework
Rework toDo
ReworkDiscovery
- +
Productivity
EffortApplied
Rework
ProgressRework
Generation
++ -
Known WorkRemaining
TimeRemaining
Effort Needed
+-
Deadline
+
+
+
People Overtime
Work Intensisty
Resources:
+
+
AddResources
ScopeGrowth
Changes
InfeasiblePlan

+
- Project Control
70
1. Project control is driven by estimates of how much effort is left ...
2. Estimates are based on work to do and productivity (undiscovered rework?)
Estimated EffortRemaining
(Person-Months)
Work to Do(Tasks)
Average Productivity(Tasks/Month/Person)
+
-

+
-
Estimated EffortRemaining
(Person-Months)
Work to Do(Tasks)
Average Productivity(Tasks/Month/Person)
Staff Required toComplete on
Schedule
Time Remaining
Staff
+
+-
+
ScheduledCompletion Date
+
-
Project Control -- Staffing
71
How many people do I need to get the job done on time?
Staff Required = Estimated Effort Remaining / Time Remaining [People]

+
- Project Control – Schedule
72
How many people do I need to get the job done on time?
When Can I finish with the current staff?
Indicated Completion Date = Time + (Estimated Effort Remaining/Staff) [Month]
Estimated EffortRemaining
(Person-Months)
Work to Do(Tasks)
Average Productivity(Tasks/Month/Person)
Staff Required toComplete on
Schedule
Time Remaining
Staff
IndicatedCompletion Date
+
++
-
+
ScheduledCompletion Date
+
-
-

+
- Project Control
Based on Staff Required and Indicated Completion Date, three options:
1. Add Staff
2. Explicitly Slip Schedule
3. Exert “Schedule Pressure” (Work Intensity and Extra Hours)
73

+
-
Estimated EffortRemaining
(Person-Months)Work to Do
(Tasks)
Average Productivity(Tasks/Month/Person)
Staff Required toComplete on
Schedule
Time Remaining
Staff
IndicatedCompletion Date
+
+
+-
+
ScheduledCompletion Date
+
-
-
Work/SchedulePressure
+
-
+
Actions Determined By …
74
“Willingness to Hire (0 -1)”
“Willingness to Slip (0-1)”
“Willingness to Use Intensity & Extra Hours (0-1)

+
- Testing Brook’s Law?
75
New Staff ExperiencedStaffStaff Hired Staff Gaining
ExperienceStaff Leaving
Staff LevelRequired
Willingness toHire
Effect of Experienceon Productivity and
Quality
RelativeExperience of New
Staff
40 0 6 months
0.0
What uncertainties would you test sensitivity to?
Effect = (New Staff * Relative Experience + Experienced Staff) / Staff Level

+
- Options
Add Staff
Work OT
Increase “intensity”
Slip Schedule
Some Combination
76

+
- Discussion – Resource Controls
Relative impact on fraction correct (and productivity)
Relative delays
Can work intensity be sustained?
Limits – greater for OT than WI?
77

+
-
78
Equivalent Staff FCC/PDY
Step Change in Overtime – Impact on …
Net Output
1

+
- Step Change in Staff– Impact on …
79
Equivalent Staff FCC/PDY
Net Output
1
+
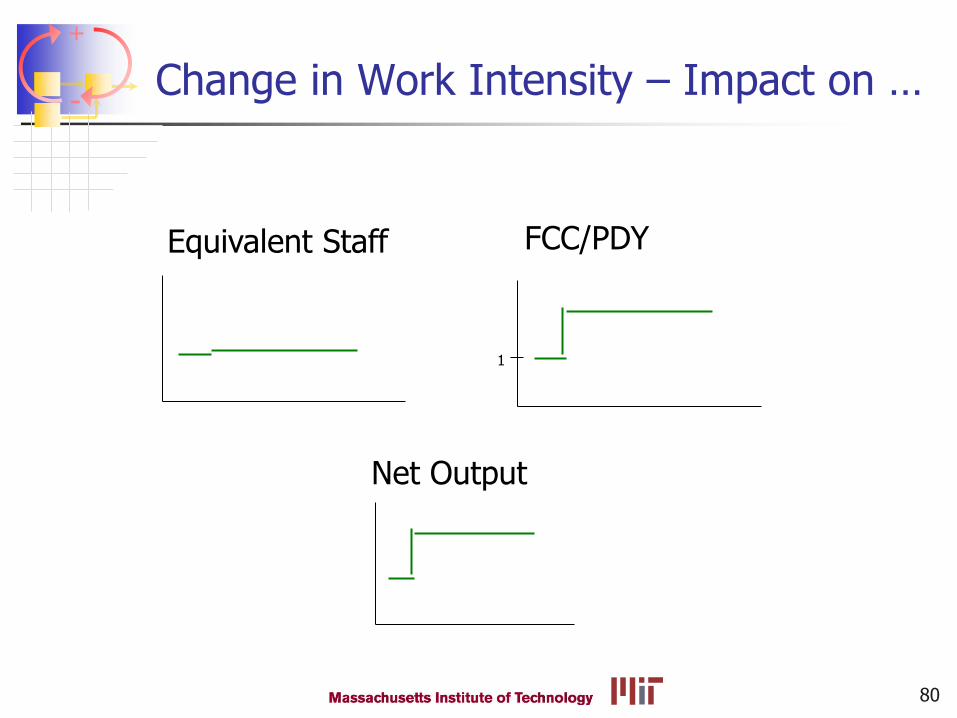
- Change in Work Intensity – Impact on …
80
Equivalent Staff FCC/PDY
Net Output
1

+
- Project Control – Discussion Points
What should you do when a project gets behind schedule?
• When in the project should you use overtime (and/or for how long)?
• When do you?
• When in the project should you hire?
• When do you?
• Does it ever pay to work more “intensely” (cut corners, etc.)?
• Do you?
• When should you use buffers & slack? Slip Schedule? (as soon as recognized, or try to make up schedule?)
81

+
- Lessons -- Control
7. The costs of project control can be minimized by understanding the sources of the vicious circles. The timing, magnitude, and duration of different controls affects performance.
Lowest direct cost strategy – slip schedule
If need to meet schedule, lowest cost strategy depends on … When during project problem recognized
Limits of different resources
Size and timing of secondary impacts of control
May not always be able to achieve the schedule by adding more resources, but it will always cost you more.
82
+
- Next SD Class:
Case Examples of …
Change management & disputes
Risk management
Project-to-Project Learning
Multi-project dynamics
83

+
-
84
RW
WF
RW OT
RW
WI
Resources Needed

+
-
85
Equivalent Staff FCC/PDY
Step Change in Overtime – Impact on …
Net Output
1
1
FCC & PDY

+
- Step Change in Staff– Impact on …
86
Equivalent Staff FCC/PDY
Net Output
1
1
FCC & PDY

+
- Change in Work Intensity – Impact on …
87
Equivalent Staff FCC/PDY
Net Output
1
1
PDY
FCC

MIT OpenCourseWarehttp://ocw.mit.edu
ESD.36 System Project ManagementFall 2012
For information about citing these materials or our Terms of Use, visit: http://ocw.mit.edu/terms.