LECTURE 10 AC Circuits and Sampling Labs. Schedule Change AC Circuits will be Monday and Tuesday...
28
LECTURE 10 AC Circuits and Sampling Labs
-
date post
19-Dec-2015 -
Category
Documents
-
view
221 -
download
2
Transcript of LECTURE 10 AC Circuits and Sampling Labs. Schedule Change AC Circuits will be Monday and Tuesday...

LECTURE 10
AC Circuits
and
Sampling Labs

Schedule Change
• AC Circuits will be Monday and Tuesday
• Sampling Lab will be Wednesday and Thursday

Outline– AC Ciruits
• Safety for circuits with >50 volts
• Prelab material
• Lab tests
• Results

Basic electrical safety
• Electrical injuries due to tissue heating, nerve system disruption, reflex actions, arc burns.
• 5 ma is the “let go” current
• Path of current through the body is important
• Body impedance is primarily in the skin

Laboratory Safety Procedures
• Eye safety– goggles
• Work only on dead circuits
• Have instructor check circuit before energizing
• Avoid having to reach across hot resistors/hot wires
• No loose jewelry
• Work with one hand

Theory

RL Load

Power Triangle
S=VI= volt-amps
P=VIcoswatts
Q=VIsinvars
power factor=P/S
=cos(
S2=P2+Q2

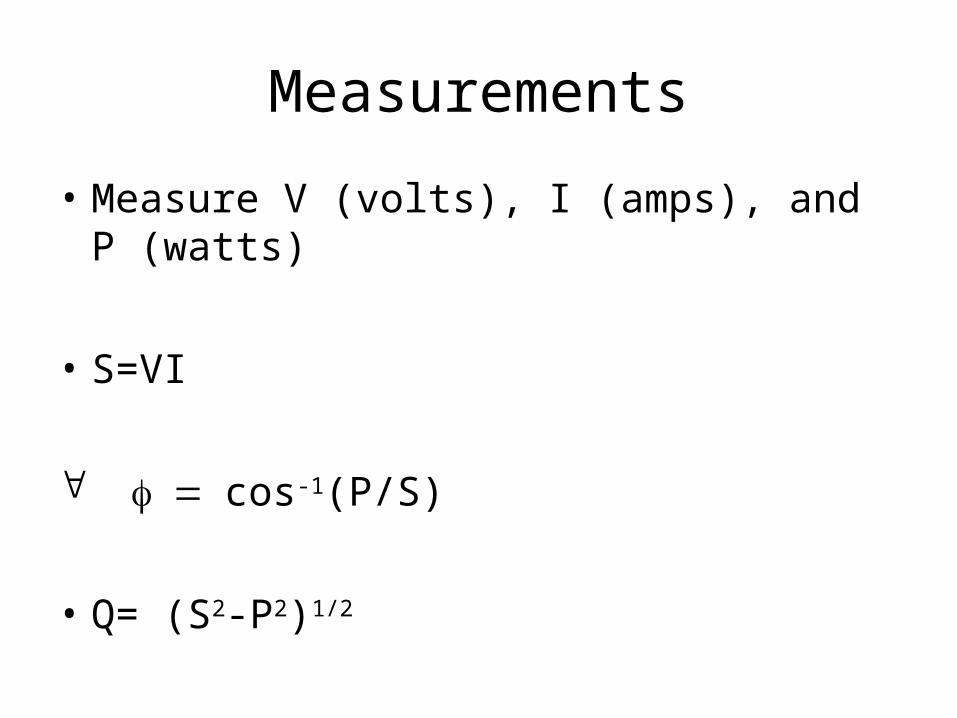
Measurements
• Measure V (volts), I (amps), and P (watts)
• S=VI
cos-1(P/S)
• Q= (S2-P2)1/2

Constant VL means constant IL and PL as CL
changes

Measurement circuit
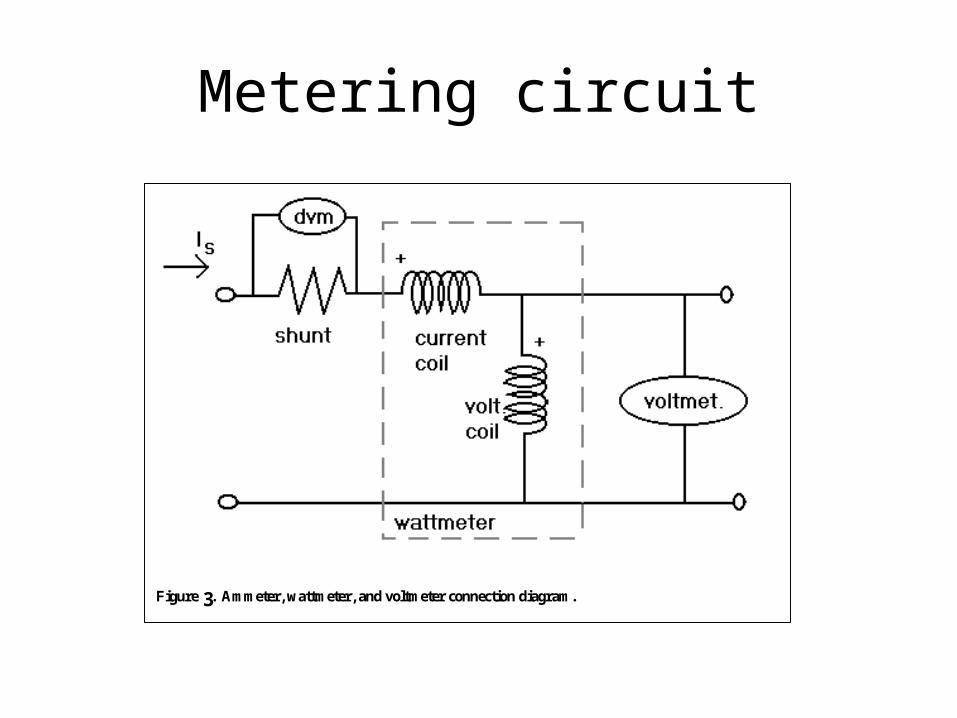
Metering circuit
Figure 3 . Ammeter, wattmeter, and voltmeter connection diagram.

Results
• C will generate vars–L will consume vars
• If capacitive vars = inductive vars, there will be unity power factor (and minimum source current)
• Further increase in capacitance will create a leading power factor (and current will be larger)

Results
• For each operating point—– Measure V, I and P– Calculate S and – Draw power triangle to scale– Determine capacitive vars from the
source measurement– Predict capacitive vars by formula CV2

Sampling Lab-- Objectives
• Use shift registers in LabView
• Use continuous sampling to estimate signal characteristics
• Integrate and differentiate signals in real time

Windowed Data Gathering (what we did previously)

Continuously sampled signal

Comparison
• Suppose the sampling theorem dictates a sampling rate of 1khz.
• Suppose you need to have 100 samples to characterize the wave
• In windowed data, you could make a decision no quicker than every 0.1 sec.
• In continuously sampled data, you can make a decision every 1 millisecond.

Shift Registers


Averaging Circuit

We will do…
• Averaging
• Integrating
• Differentiating
• RMS’ing

Real Time Integration-- discretization

Integration-- summation

Algorithm
i
k
tixiytkxiy0
)()1()()(

What is the integral of a…
• Sine wave?
• Square wave?
• What is the derivative of these signals?
• How would you do a running RMS?