Lectura 1 (2)
16
Fifteenth International Water Technology Conference, IWTC 15 2010, Alexandria, Egypt 1 The effect of pH control on turbidity and NOM removal in conventional water treatment Ahamed Fadel Ashery 1 , Kamal Radwan 2 , and Mohamed I. Gar Al-Alm Rashed 3 . 1 Public Works Department, Faculty of Engineering – Mansoura University 2 Public Works Department, Faculty of Engineering – Mansoura University, [email protected] 3 Public Works Department, Faculty of Engineering – Mansoura University, [email protected] ABSTRACT Natural organic matter, (NOM) is the term used to describe the complex matrix of organics originating from natural sources that are present in all water bodies. Effective removal of turbidity and soluble natural organic matter from water could be achieved by micro-floc formation process (coagulation) and macro-floc development (flocculation). These processes are used to destabilize suspended particles and to react with dissolved organic material in the raw water. Proper and optimum coagulation is essential for good filtration performance and for disinfection byproduct (DBP) control. This work provides guidelines and an explanation of the most suitable coagulant dose that should be used to improve turbidity and NOM removal from water and how pH should be controlled to achieve the maximum removal and to reduce the coagulant dose to the minimum in coagulation process. The best result for turbidity and NOM removal was found at pH ranges from 5 to 6, while at pH > 6 the removal of NOM was poor and may need high dosage of coagulant. Experimental results of the remaining DOC after treatment was assessed theoretically. Key words: Natural organic matter (NOM), Dissolved Organic Carbon (DOC), Turbidity, Alum coagulations. 1. INTRODUCTION Natural organic matter (NOM) originating from natural sources that are present in all water bodies are caused by break down of vegetation that finds its way in water bodies. Usually NOM concentration increases when runoff occurs. NOM could be expressed as total organic carbon (TOC), dissolved organic carbon (DOC), UV absorbance at wavelength of 254 nm (UV 254 ) absorption, and specific UV absorbance (SUVA) (Wang and Hsieh, 2000[1]; Egeberg et al., 2002[2]; Kim and Yu, 2005[3]). Dissolved organic carbon, (DOC), is a fraction of total organic carbon and has the operational definition of milligrams per liter of carbon remaining in the liquid after filtration through a 0.45-μm filter (Hendricks, 2006[4]; Kim and Yu,2005[3]; Rizzo et al.,2004[5]). The NOM is comprised of humic substance that are categorized as fulvic acids and humic acids (Bose and Reckhow, 2006[6]). Concentrations in surface water range from about 1 to 75 mg/L as dissolved organic carbon. Color is another indicator of humic matter with range
-
Upload
alexandra-sierra -
Category
Documents
-
view
229 -
download
0
description
datos
Transcript of Lectura 1 (2)

Fifteenth International Water Technology Conference, IWTC 15 2010, Alexandria, Egypt
1
The effect of pH control on turbidity and NOM removal in conventional water treatment
Ahamed Fadel Ashery1, Kamal Radwan2, and Mohamed I. Gar Al-Alm Rashed3. 1Public Works Department, Faculty of Engineering – Mansoura University
2Public Works Department, Faculty of Engineering – Mansoura University, [email protected]
3Public Works Department, Faculty of Engineering – Mansoura University, [email protected]
ABSTRACT
Natural organic matter, (NOM) is the term used to describe the complex matrix of organics originating from natural sources that are present in all water bodies. Effective removal of turbidity and soluble natural organic matter from water could be achieved by micro-floc formation process (coagulation) and macro-floc development (flocculation). These processes are used to destabilize suspended particles and to react with dissolved organic material in the raw water. Proper and optimum coagulation is essential for good filtration performance and for disinfection byproduct (DBP) control. This work provides guidelines and an explanation of the most suitable coagulant dose that should be used to improve turbidity and NOM removal from water and how pH should be controlled to achieve the maximum removal and to reduce the coagulant dose to the minimum in coagulation process. The best result for turbidity and NOM removal was found at pH ranges from 5 to 6, while at pH > 6 the removal of NOM was poor and may need high dosage of coagulant. Experimental results of the remaining DOC after treatment was assessed theoretically.
Key words: Natural organic matter (NOM), Dissolved Organic Carbon (DOC), Turbidity, Alum coagulations.
1. INTRODUCTION
Natural organic matter (NOM) originating from natural sources that are present in all water bodies are caused by break down of vegetation that finds its way in water bodies. Usually NOM concentration increases when runoff occurs. NOM could be expressed as total organic carbon (TOC), dissolved organic carbon (DOC), UV absorbance at wavelength of 254 nm (UV254) absorption, and specific UV absorbance (SUVA) (Wang and Hsieh, 2000[1]; Egeberg et al., 2002[2]; Kim and Yu, 2005[3]). Dissolved organic carbon, (DOC), is a fraction of total organic carbon and has the operational definition of milligrams per liter of carbon remaining in the liquid after filtration through a 0.45-µm filter (Hendricks, 2006[4]; Kim and Yu,2005[3]; Rizzo et al.,2004[5]). The NOM is comprised of humic substance that are categorized as fulvic acids and humic acids (Bose and Reckhow, 2006[6]). Concentrations in surface water range from about 1 to 75 mg/L as dissolved organic carbon. Color is another indicator of humic matter with range
Fifteenth International Water Technology Conference, IWTC 15 2010, Alexandria, Egypt
2
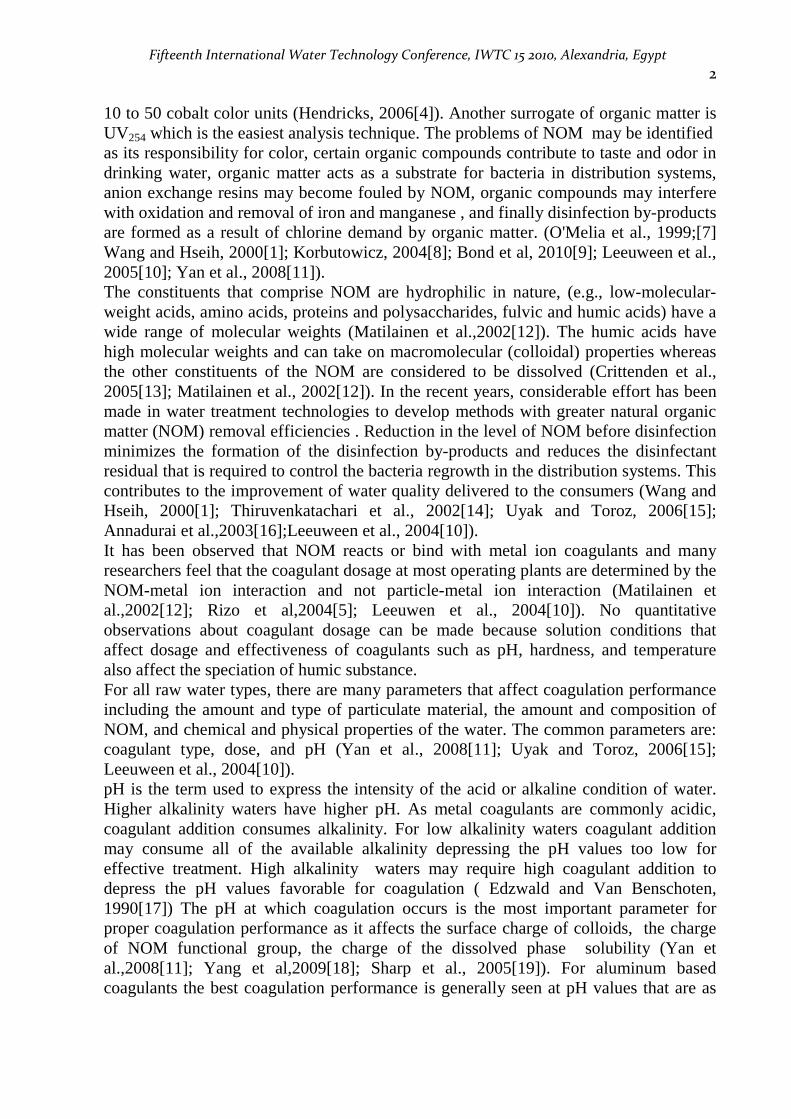
10 to 50 cobalt color units (Hendricks, 2006[4]). Another surrogate of organic matter is UV254 which is the easiest analysis technique. The problems of NOM may be identified as its responsibility for color, certain organic compounds contribute to taste and odor in drinking water, organic matter acts as a substrate for bacteria in distribution systems, anion exchange resins may become fouled by NOM, organic compounds may interfere with oxidation and removal of iron and manganese , and finally disinfection by-products are formed as a result of chlorine demand by organic matter. (O'Melia et al., 1999;[7] Wang and Hseih, 2000[1]; Korbutowicz, 2004[8]; Bond et al, 2010[9]; Leeuween et al., 2005[10]; Yan et al., 2008[11]). The constituents that comprise NOM are hydrophilic in nature, (e.g., low-molecular-weight acids, amino acids, proteins and polysaccharides, fulvic and humic acids) have a wide range of molecular weights (Matilainen et al.,2002[12]). The humic acids have high molecular weights and can take on macromolecular (colloidal) properties whereas the other constituents of the NOM are considered to be dissolved (Crittenden et al., 2005[13]; Matilainen et al., 2002[12]). In the recent years, considerable effort has been made in water treatment technologies to develop methods with greater natural organic matter (NOM) removal efficiencies . Reduction in the level of NOM before disinfection minimizes the formation of the disinfection by-products and reduces the disinfectant residual that is required to control the bacteria regrowth in the distribution systems. This contributes to the improvement of water quality delivered to the consumers (Wang and Hseih, 2000[1]; Thiruvenkatachari et al., 2002[14]; Uyak and Toroz, 2006[15]; Annadurai et al.,2003[16];Leeuween et al., 2004[10]). It has been observed that NOM reacts or bind with metal ion coagulants and many researchers feel that the coagulant dosage at most operating plants are determined by the NOM-metal ion interaction and not particle-metal ion interaction (Matilainen et al.,2002[12]; Rizo et al,2004[5]; Leeuwen et al., 2004[10]). No quantitative observations about coagulant dosage can be made because solution conditions that affect dosage and effectiveness of coagulants such as pH, hardness, and temperature also affect the speciation of humic substance. For all raw water types, there are many parameters that affect coagulation performance including the amount and type of particulate material, the amount and composition of NOM, and chemical and physical properties of the water. The common parameters are: coagulant type, dose, and pH (Yan et al., 2008[11]; Uyak and Toroz, 2006[15]; Leeuween et al., 2004[10]). pH is the term used to express the intensity of the acid or alkaline condition of water. Higher alkalinity waters have higher pH. As metal coagulants are commonly acidic, coagulant addition consumes alkalinity. For low alkalinity waters coagulant addition may consume all of the available alkalinity depressing the pH values too low for effective treatment. High alkalinity waters may require high coagulant addition to depress the pH values favorable for coagulation ( Edzwald and Van Benschoten, 1990[17]) The pH at which coagulation occurs is the most important parameter for proper coagulation performance as it affects the surface charge of colloids, the charge of NOM functional group, the charge of the dissolved phase solubility (Yan et al.,2008[11]; Yang et al,2009[18]; Sharp et al., 2005[19]). For aluminum based coagulants the best coagulation performance is generally seen at pH values that are as
Fifteenth International Water Technology Conference, IWTC 15 2010, Alexandria, Egypt
3
close as possible to the pH of minimum solubility of the coagulant. This controls dissolved Al residuals, as well as maximizing the presence of floc particles for adsorption of NOM (Hundt and O'Milia, 1988[20]). The undertaken work provides guidelines and an explanation of the most suitable coagulant dose that should be used to improve turbidity and NOM removal from water and how pH should be controlled to achieve the maximum removal and to reduce the coagulant dose to the minimum in coagulation process.
2. MATERIALS AND METHOD
The experimental work was executed at Sanitary Engineering Laboratory, Public Works Engineering Department at Faculty of Engineering – Mansoura University, Egypt.
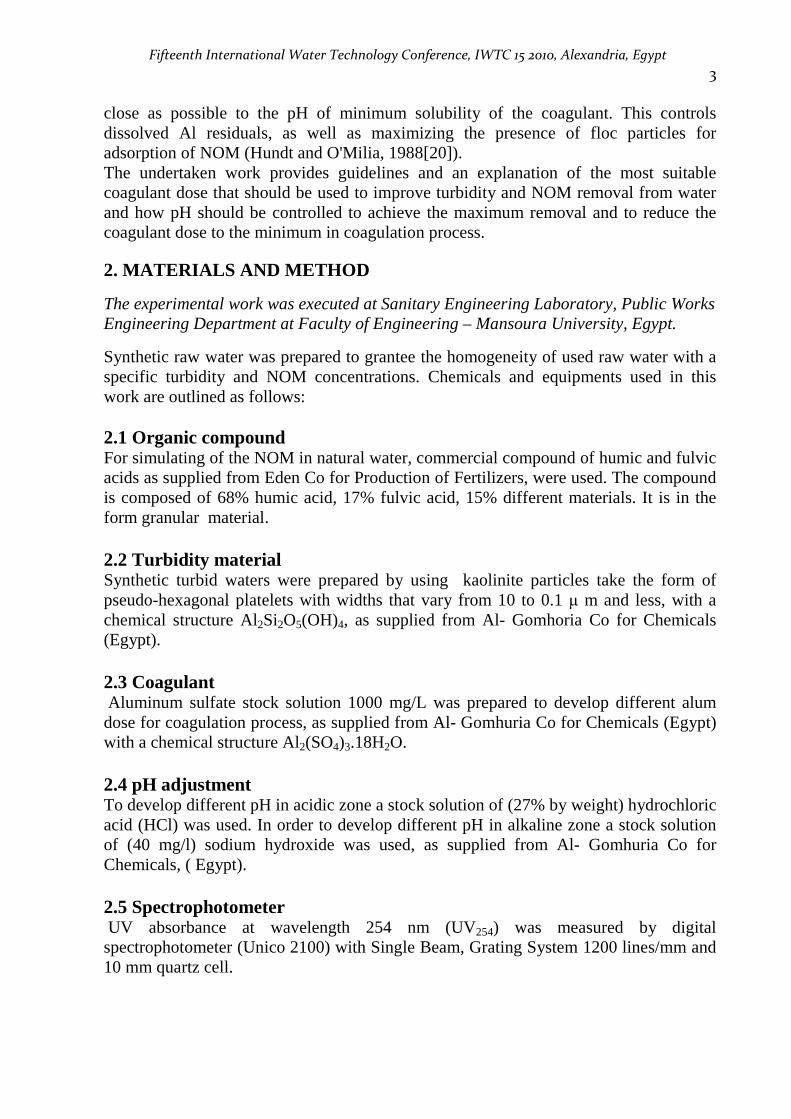
Synthetic raw water was prepared to grantee the homogeneity of used raw water with a specific turbidity and NOM concentrations. Chemicals and equipments used in this work are outlined as follows: 2.1 Organic compound For simulating of the NOM in natural water, commercial compound of humic and fulvic acids as supplied from Eden Co for Production of Fertilizers, were used. The compound is composed of 68% humic acid, 17% fulvic acid, 15% different materials. It is in the form granular material. 2.2 Turbidity material Synthetic turbid waters were prepared by using kaolinite particles take the form of pseudo-hexagonal platelets with widths that vary from 10 to 0.1 µ m and less, with a chemical structure Al2Si2O5(OH)4, as supplied from Al- Gomhoria Co for Chemicals (Egypt). 2.3 Coagulant Aluminum sulfate stock solution 1000 mg/L was prepared to develop different alum dose for coagulation process, as supplied from Al- Gomhuria Co for Chemicals (Egypt) with a chemical structure Al2(SO4)3.18H2O. 2.4 pH adjustment To develop different pH in acidic zone a stock solution of (27% by weight) hydrochloric acid (HCl) was used. In order to develop different pH in alkaline zone a stock solution of (40 mg/l) sodium hydroxide was used, as supplied from Al- Gomhuria Co for Chemicals, ( Egypt). 2.5 Spectrophotometer UV absorbance at wavelength 254 nm (UV254) was measured by digital spectrophotometer (Unico 2100) with Single Beam, Grating System 1200 lines/mm and 10 mm quartz cell.
Fifteenth International Water Technology Conference, IWTC 15 2010, Alexandria, Egypt
4
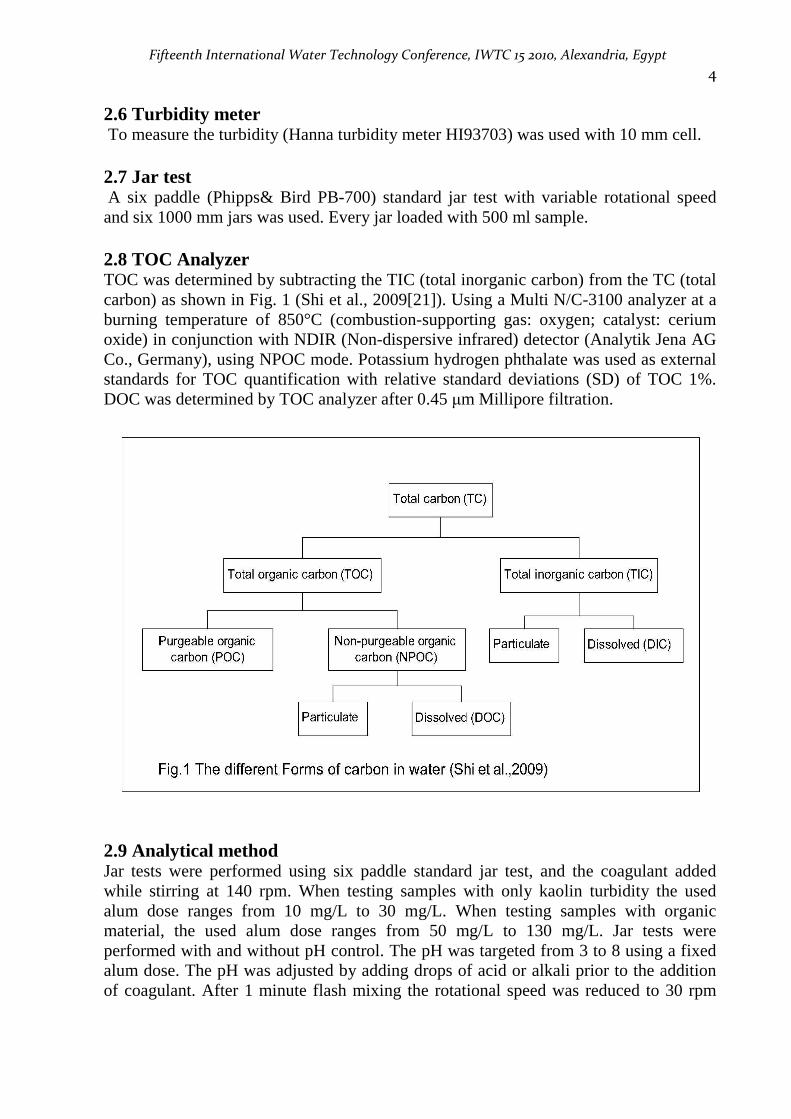
2.6 Turbidity meter To measure the turbidity (Hanna turbidity meter HI93703) was used with 10 mm cell. 2.7 Jar test A six paddle (Phipps& Bird PB-700) standard jar test with variable rotational speed and six 1000 mm jars was used. Every jar loaded with 500 ml sample. 2.8 TOC Analyzer TOC was determined by subtracting the TIC (total inorganic carbon) from the TC (total carbon) as shown in Fig. 1 (Shi et al., 2009[21]). Using a Multi N/C-3100 analyzer at a burning temperature of 850°C (combustion-supporting gas: oxygen; catalyst: cerium oxide) in conjunction with NDIR (Non-dispersive infrared) detector (Analytik Jena AG Co., Germany), using NPOC mode. Potassium hydrogen phthalate was used as external standards for TOC quantification with relative standard deviations (SD) of TOC 1%. DOC was determined by TOC analyzer after 0.45 µm Millipore filtration.
2.9 Analytical method Jar tests were performed using six paddle standard jar test, and the coagulant added while stirring at 140 rpm. When testing samples with only kaolin turbidity the used alum dose ranges from 10 mg/L to 30 mg/L. When testing samples with organic material, the used alum dose ranges from 50 mg/L to 130 mg/L. Jar tests were performed with and without pH control. The pH was targeted from 3 to 8 using a fixed alum dose. The pH was adjusted by adding drops of acid or alkali prior to the addition of coagulant. After 1 minute flash mixing the rotational speed was reduced to 30 rpm

Fifteenth International Water Technology Conference, IWTC 1
for 20 minute. The samples were then allowed to settle for 30 minute.concentrations was measured by the spectrophotometer at wavelength 254, and analyzer. The turbidity was measuredthe specific UV absorbance (Crittenden et al 2005[13])
SUVA � �����
3. RESULTS AND DISCUSSION
3.1 Turbidity removal 3.1.1 Effect of pH control on high turbidity waterThe effect of pH control was turbidity of 130 NTU. Five repeated jar tests were performed to determine the optimum dose for this synthetic turbid water withsynthetic turbid water at pH 5 and pH 6 five for each considered. The average valuean average minimum residual turbidity of with pH 5, and 1.3 for water with pHvarying the pH from 3 to 8 on the turbidity removal is shown on Fig. (the best turbidity removalbetween turbidity removal of neutral water and wate
0
2
4
6
8
10
12
14
16
10 15 20 25 30 35 40
Re
sid
ua
l tu
rbid
ity
NT
U
Alum dose mg/LFig 2 Effect of alum dose on
turbidiy removal of high turbid water
pH = 7initial turbidity =
International Water Technology Conference, IWTC 15 2010, Alexandria,
The samples were then allowed to settle for 30 minute.concentrations was measured by the spectrophotometer at wavelength 254, and
he turbidity was measured by the turbidity meter for different samples.the specific UV absorbance (SUVA) was calculated by the following equation
) :
���� ��
� � x ��������� (1)
3. RESULTS AND DISCUSSION
pH control on high turbidity water The effect of pH control was investigated by using a synthetic turbid
. Five repeated jar tests were performed to determine the optimum dose for this synthetic turbid water with pH 7. Another ten jar tests were performed with synthetic turbid water at pH 5 and pH 6 five for each and the average value was considered. The average value of the optimum dose was found to be 45 mg/L
minimum residual turbidity of 2.9 NTU for water with pH 7, 1.1 for water with pH 5, and 1.3 for water with pH 6 as indicated on Figs (2varying the pH from 3 to 8 on the turbidity removal is shown on Fig. (
turbidity removal efficiency was between pH 5 and pH 6.between turbidity removal of neutral water and water at optimum pH is considerable.
40 45 50 55 60 65
Alum dose mg/LEffect of alum dose on
turbidiy removal of high turbid
initial turbidity = 130 NTU
0
2
4
6
8
10
12
14
10 20 30
Re
sid
ua
l tu
rbid
ity
NT
U
Alum dose mg/L
Fig. 3 Effect of alum dose on turbidiy removal of high
water
pH = 5initial turbidity=
Alexandria, Egypt
5
The samples were then allowed to settle for 30 minute. Then NOM concentrations was measured by the spectrophotometer at wavelength 254, and by TOC
meter for different samples. while was calculated by the following equation
a synthetic turbid water with initial . Five repeated jar tests were performed to determine the optimum
. Another ten jar tests were performed with the average value was
was found to be 45 mg/L arriving for water with pH 7, 1.1 for water
2,3,4). The effect of varying the pH from 3 to 8 on the turbidity removal is shown on Fig. (5) indicating that
en pH 5 and pH 6. The difference r at optimum pH is considerable.
40 50 60
Alum dose mg/L
Effect of alum dose on turbidiy removal of high turbid
water
initial turbidity= 130 NTU

Fifteenth International Water Technology Conference, IWTC 1
3.1.2 Effect of pH control on low turbidity The effect of pH control was tested bturbidity 30 NTU and using optimum alum dose issued from neutral water with pH approximately synthetic water with pH 6 as shown in Figs (6,7,8)shown in Fig.9 indicate that the best removal efficiency was between pH 5 and pH 6. Fig.9 shows that the difference between efficiency removal at optimum pH and at neutral water was about 0.3 NTU which is
0
2
4
6
8
10
12
10 20 30 40
resi
du
al
turb
idit
y N
TU
Alum dose mg/LFig.4.Effect of alum dose on
turbidiy removal of high turbidity water
pH =6initial turbidity=
0
1
2
3
4
5
6
7
8
9
5 10 15 20
resd
ua
l tu
rbid
ity
NT
U
Alum dose mg/L
Fig.6.Effect of alum dose on turbidiy removal of low turbidity
water
pH = 7initial turbidity =
International Water Technology Conference, IWTC 15 2010, Alexandria,
3.1.2 Effect of pH control on low turbidity water The effect of pH control was tested by using a synthetic turbid
and using optimum alum dose issued from fifteenneutral water with pH approximately ≈7, five on synthetic water with pH 5, and fivesynthetic water with pH 6 as shown in Figs (6,7,8) which was 25 mg/L. The result as
that the best removal efficiency was between pH 5 and pH 6. shows that the difference between efficiency removal at optimum pH and at
was about 0.3 NTU which is not significant.
50 60
Alum dose mg/L.Effect of alum dose on
turbidiy removal of high turbidity
initial turbidity=130 NTU
0
1
2
3
4
5
6
7
8
3 4 5
resi
du
alt
urb
idit
y N
TU
pH
Fig.5.Effect of pH on turbidiy removal of high turbidity water
Alum dose Initial turbidity =
0
1
2
3
4
5
6
7
8
5 10 15
resi
du
al
turb
idit
y N
TU
Alum dose mg/L
Fig.7.Effect of alum dose on turbidiy removal of low turbidity
water
pH = 5initial turbidity =
20 25 30Alum dose mg/L
.Effect of alum dose on turbidiy removal of low turbidity
initial turbidity = 30 NTU
Alexandria, Egypt
6
a synthetic turbid water with initial fifteen jar tests, five on
, five on synthetic water with pH 5, and five on which was 25 mg/L. The result as
that the best removal efficiency was between pH 5 and pH 6. shows that the difference between efficiency removal at optimum pH and at
6 7 8pH
.Effect of pH on turbidiy removal of high turbidity water
Alum dose 45 mg/LInitial turbidity = 130 NTU
20 25 30Alum dose mg/L
.Effect of alum dose on turbidiy removal of low turbidity
water
5initial turbidity = 30 NTU
Fifteenth International Water Technology Conference, IWTC 1
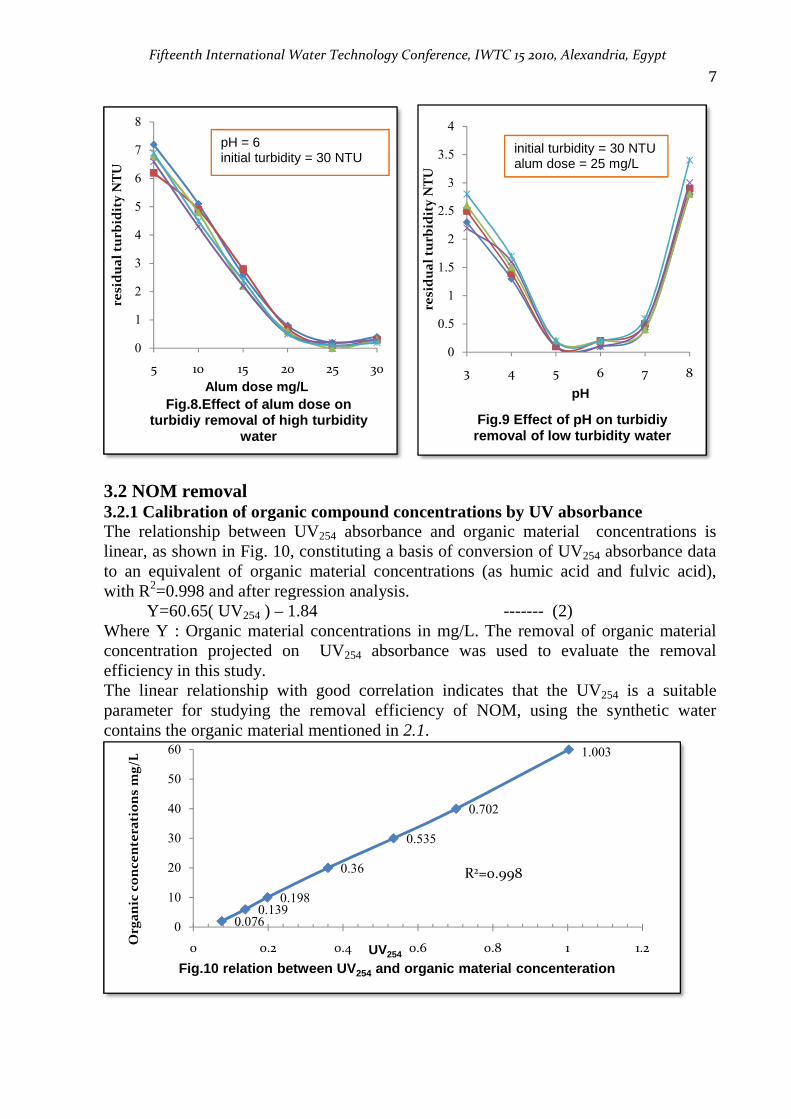
3.2 NOM removal 3.2.1 Calibration of organic compoundThe relationship between UVlinear, as shown in Fig. 10to an equivalent of organic material concentrations (aswith R2=0.998 and after regression analysis Y=60.65( UV254 ) – Where Y : Organic materialconcentration projected on efficiency in this study. The linear relationship with good correlation indicateparameter for studying the removal efficiency of NOM, using the synthetic water contains the organic material mentioned in
0
1
2
3
4
5
6
7
8
5 10 15 20
resi
du
al
turb
idit
y N
TU
Alum dose mg/LFig.8.Effect of alum dose on
turbidiy removal of high turbidity water
pH = 6initial turbidity =
0.0760.139
0.198
0
10
20
30
40
50
60
0 0.2
Org
an
ic c
on
cen
tera
tio
ns
mg
/L
Fig.10 relation between UV
International Water Technology Conference, IWTC 15 2010, Alexandria,
organic compound concentrations by UV absorbanceween UV254 absorbance and organic material
0, constituting a basis of conversion of UVof organic material concentrations (as humic acid and fulvic acid
ter regression analysis. 1.84 ------- (2)
Organic material concentrations in mg/L. The removal ofprojected on UV254 absorbance was used to evaluate the
The linear relationship with good correlation indicates that the UVparameter for studying the removal efficiency of NOM, using the synthetic water contains the organic material mentioned in 2.1.
20 25 30
Alum dose mg/L.Effect of alum dose on
turbidiy removal of high turbidity
initial turbidity = 30 NTU
0
0.5
1
1.5
2
2.5
3
3.5
4
3 4 5
resi
du
al
turb
idit
y N
TU
pH
Fig.9 Effect of pH on turbidiy removal of low turbidity water
initial turbidity = alum dose =
0.1390.198
0.36
0.535
0.702
0.4 0.6 0.8 1UV254
relation between UV254 and organic material concenteration
R2=0.998
Alexandria, Egypt
7
by UV absorbance organic material concentrations is
, constituting a basis of conversion of UV254 absorbance data humic acid and fulvic acid),
) The removal of organic material
valuate the removal
that the UV254 is a suitable parameter for studying the removal efficiency of NOM, using the synthetic water
6 7 8
pH
Effect of pH on turbidiy removal of low turbidity water
initial turbidity = 30 NTUalum dose = 25 mg/L
1.003
1.2
and organic material concenteration

Fifteenth International Water Technology Conference, IWTC 1
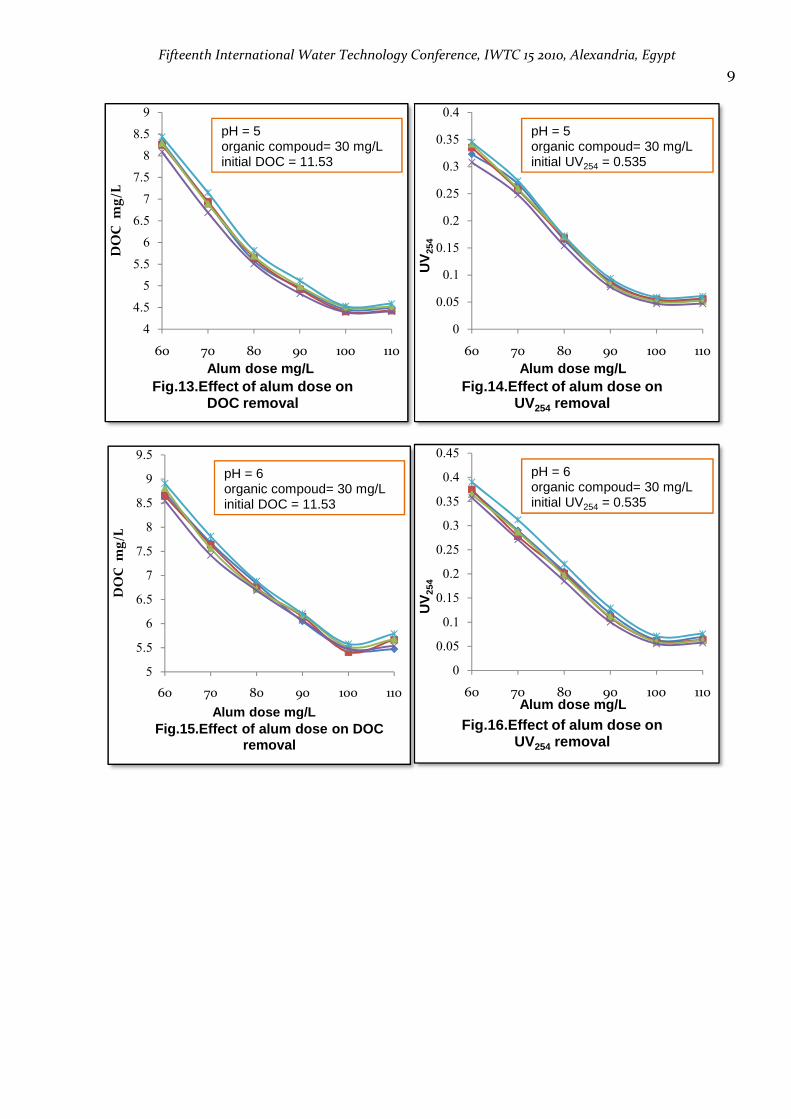
3.2.2 The effect of pH on
The effect of the solution pH on the removal of natural organic matter during coagulation and flocculation was studiedconcentration of 30 mg/L atdose used was the average optimum dose issued from neutral water with pH approximately five on synthetic water with pwas 100 mg/L. The relation between pH andfive jar tests and measuringSUVA computed from equation (1) as illustrated in table (1) Fig (19). The results clarify adjusting the pH down between 5 and 6 prior to alum coagulant addition which may be attributed to the complexes that link to each other, thereby forming large insoluble bridged complexes (micro-flocs) that also act as nuclei for macro(flocculation). However, qualitatively, as pH increases, humic substances will become more ionized because the positive charge on metal coagulants will decrease. Consequently, higher coagulant dosages will be required at higher pH values.
9
9.5
10
10.5
11
11.5
60 70 80 90
DO
C m
g/L
Alum dose mg/L
Fig.11.Effect of alum dose on DOC removal
pH = 7organic compoud= initial DOC =
International Water Technology Conference, IWTC 15 2010, Alexandria,
NOM removal efficiency
the solution pH on the removal of natural organic matter during coagulation and flocculation was studied on water with initial organic compound
0 mg/L at pH values of 3.0, 4.0, 5.0, 6.0, 7.0, and 8.0.dose used was the average optimum dose issued from fifteen jar tests, five on neutral water with pH approximately ≈7, five on synthetic water with pH 5, and five on synthetic water with pH 6 as shown in Figs (11,12,13
. The relation between pH and NOM removal isfive jar tests and measuring the UV254 and DOC as shown SUVA computed from equation (1) as illustrated in table (1)
19). The results clarify that the best removal efficiency occurred when pH down between 5 and 6 prior to alum coagulant addition which
may be attributed to the allowance for the formation of soluble NOMexes that link to each other, thereby forming large insoluble bridged
flocs) that also act as nuclei for macroHowever, qualitatively, as pH increases, humic substances will
become more ionized because the carboxyl groups will loss protons, and the positive charge on metal coagulants will decrease. Consequently, higher
be required at higher pH values.
90 100 110Alum dose mg/L
.Effect of alum dose on DOC removal
organic compoud= 30 mg/Linitial DOC = 11.53
0.3
0.32
0.34
0.36
0.38
0.4
0.42
0.44
0.46
0.48
0.5
60 70 80
UV
254
Alum dose mg/L
Fig.12.Effect of alum dose in UV254 removal
pH = 7organic compoud=initial UV
Alexandria, Egypt
8
the solution pH on the removal of natural organic matter during initial organic compound
7.0, and 8.0. The alum fifteen jar tests, five on
7, five on synthetic water with pH 5, and H 6 as shown in Figs (11,12,13,14,15,16) which
NOM removal is investigated by as shown in Figs (17&18) and
SUVA computed from equation (1) as illustrated in table (1) and demonstrated on that the best removal efficiency occurred when
pH down between 5 and 6 prior to alum coagulant addition which the formation of soluble NOM-aluminum
exes that link to each other, thereby forming large insoluble bridged flocs) that also act as nuclei for macro-floc development
However, qualitatively, as pH increases, humic substances will carboxyl groups will loss protons, and the
positive charge on metal coagulants will decrease. Consequently, higher
90 100 110Alum dose mg/L
.Effect of alum dose in removal
organic compoud= 30 mg/Linitial UV254 = 0.535
Fifteenth International Water Technology Conference, IWTC 1
5
5.5
6
6.5
7
7.5
8
8.5
9
9.5
60 70 80
DO
C m
g/L
Alum dose mg/LFig.15.Effect of alum dose on DOC
removal
pH = 6organic compoud=initial DOC =
4
4.5
5
5.5
6
6.5
7
7.5
8
8.5
9
60 70 80
DO
C m
g/L
Alum dose mg/LFig.13.Effect of alum dose on
DOC removal
pH = 5organic compoud=initial DOC =
International Water Technology Conference, IWTC 15 2010, Alexandria,
90 100 110
Alum dose mg/L.Effect of alum dose on DOC
removal
organic compoud= 30 mg/Linitial DOC = 11.53
0
0.05
0.1
0.15
0.2
0.25
0.3
0.35
0.4
60 70 80
UV
254
Alum dose mg/LFig.14.Effect of alum dose on
UV254 removal
pH = 5organic compoud=initial UV
0
0.05
0.1
0.15
0.2
0.25
0.3
0.35
0.4
0.45
60 70 80
UV
254
Alum dose mg/L
Fig.16.Effect of alum dose on UV254 removal
pH = 6organic compoud=initial UV
90 100 110
Alum dose mg/L.Effect of alum dose on
DOC removal
organic compoud= 30 mg/Linitial DOC = 11.53
Alexandria, Egypt
9
90 100 110
Alum dose mg/L.Effect of alum dose on
removal
organic compoud= 30 mg/Linitial UV254 = 0.535
90 100 110Alum dose mg/L
.Effect of alum dose on removal
organic compoud= 30 mg/Linitial UV254 = 0.535
Fifteenth International Water Technology Conference, IWTC 15 2010, Alexandria, Egypt
10
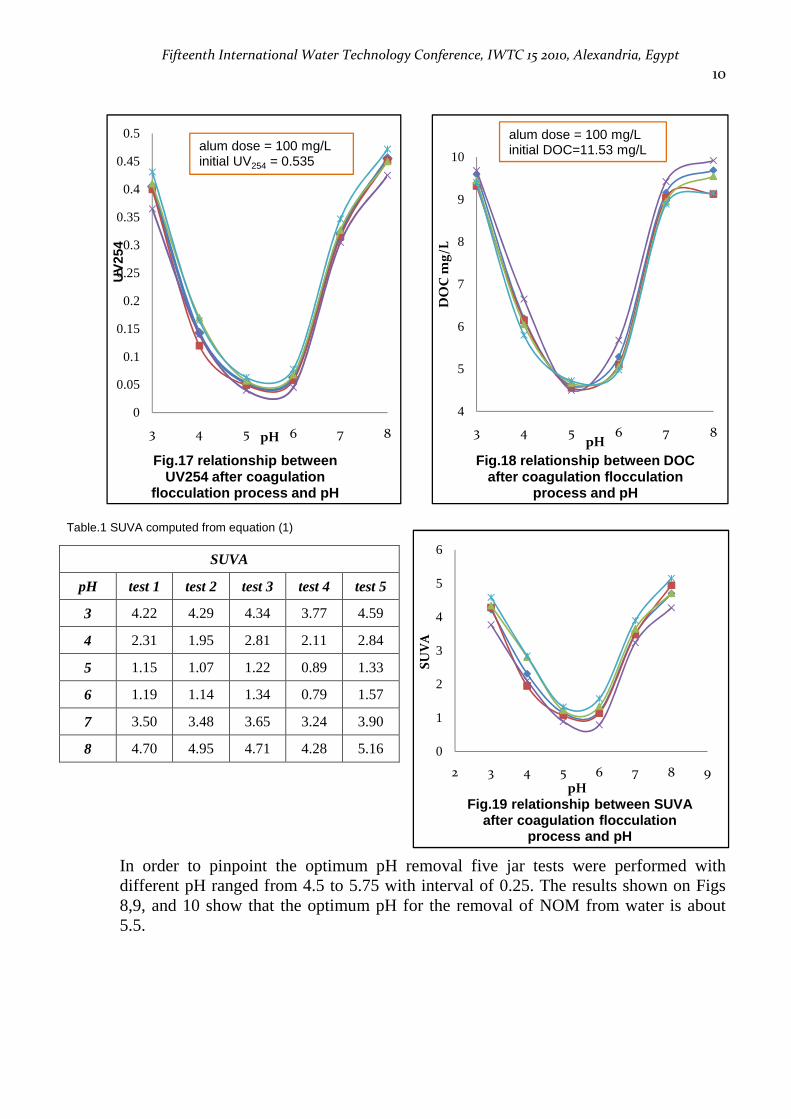
In order to pinpoint the optimum pH removal five jar tests were performed with different pH ranged from 4.5 to 5.75 with interval of 0.25. The results shown on Figs 8,9, and 10 show that the optimum pH for the removal of NOM from water is about 5.5.
0
1
2
3
4
5
6
2 3 4 5 6 7 8 9
SU
VA
pH
Fig.19 relationship between SUVA after coagulation flocculation
process and pH
SUVA
pH test 1 test 2 test 3 test 4 test 5
3 4.22 4.29 4.34 3.77 4.59
4 2.31 1.95 2.81 2.11 2.84
5 1.15 1.07 1.22 0.89 1.33
6 1.19 1.14 1.34 0.79 1.57
7 3.50 3.48 3.65 3.24 3.90
8 4.70 4.95 4.71 4.28 5.16
Table.1 SUVA computed from equation (1)
4
5
6
7
8
9
10
3 4 5 6 7 8D
OC
mg
/LpH
Fig.18 relationship between DOC after coagulation flocculation
process and pH
alum dose = 100 mg/Linitial DOC=11.53 mg/L
0
0.05
0.1
0.15
0.2
0.25
0.3
0.35
0.4
0.45
0.5
3 4 5 6 7 8
UV
254
pH
Fig.17 relationship between UV254 after coagulation
flocculation process and pH
alum dose = 100 mg/Linitial UV254 = 0.535

Fifteenth International Water Technology Conference, IWTC 15 2010, Alexandria, Egypt
11
SUVA
pH test 1 test 2 test 3 test 4 test 5
4.50 2.50 2.38 2.58 2.40 2.60
4.75 2.18 2.12 2.27 2.11 2.31
5.00 1.64 1.56 1.61 1.40 1.68
5.25 1.56 1.47 1.59 1.31 1.58
5.50 1.29 1.31 1.43 1.19 1.32
5.75 1.59 1.52 1.65 1.38 1.55
3.2.3 Theoretical assessment of DOC remaining after treatment
In this work the empirical model developed by (Edwards,1997[22]) will be applied to assess the DOC remaining after treatment. In the model development it was assumed that DOC is composed of adsorbable and nonadsorbable fraction. According to that, the effluent DOC after the coagulation process is the sum of the nonadsorbable DOC and the adsorbable DOC remaining at equilibrium after coagulation. The adsorbable DOC remaining after coagulation was not adsorbed during the coagulation process because it was in equilibrium with the DOC adsorbed on the flocs.
0
0.02
0.04
0.06
0.08
0.1
0.12
0.14
0.16
4.5 4.75 5 5.25 5.5 5.75 6
UV
254
pH
Fig.20 relationship between UV254 after coagulation
flocculation process and pH
alum dose = 100 mg/Linitial UV254 = 0.535
3
3.5
4
4.5
5
5.5
6
4.5 4.75 5 5.25 5.5 5.75 6
DO
C m
g/L
pH
Fig.21 relationship between DOC after coagulation flocculation
process and pH
initial DOC=11.53 mg/L
alum dose = 100 mg/Linitial DOC=11.53 mg/L
0.00
0.50
1.00
1.50
2.00
2.50
3.00
4.5 4.75 5 5.25 5.5 5.75
SU
VA
pH
Fig.22 relationship between SUVA after coagulation flocculation
process and pH
Table.2 SUVA computed from equation (1)

Fifteenth International Water Technology Conference, IWTC 15 2010, Alexandria, Egypt
12
The nonadsorbalble DOC is given by the equation
�������������� � !"�#$%&'()�* *�+ ) + "-. / ���0�0+0�� Where K1 and K2 are empirical fitting constants and for aluminum coagulants K1= -0.075 andK2= 0.56
$%&')�* *�+ ) � %&-12��� 3100 � 0.535
11.53 /100 � 4.64 ;/=>. =
�������������� � !−0.075#4.64( + 0.56. / 11.53 � 2.44 =>/;
To compute the amount of DOC that is in equilibrium (DOCeq) with the DOC adsorbed to the flocs Langmuir isotherm is used and in the final form of the model, the mass of DOC (mg) adsorbed per meq of coagulant to the amount adsorbed is equated to Langmuir isotherm as follows:
!1 − "�#$%&'()�* *�+ ) + "-.���0�0+0�� − ��� BC
�!/DEFD + /-EF- + /�EF.G ��� B
1 + G ��� B
Where x1, x2,and x3 are unitless empirical constants and for aluminum coagulants
x1=284, x2= -74.2, x3=4.91 (according to Edwards 1997)
b = Langmuir equilibrium constant L/mg DOC, and for aluminum coagulants b=0.147
M = the molar concentration of alum, M=0.29 mM. Rearrange the last equation with substituted variable and develop an expression for DOCeq:
' − ��� BC � H ��� B
1 + G ��� B
G I��� BJ- + #C H + 1 − ' G(I��� BJ − ' � 0
Solving the quadratic equation and use the positive expression:
��� B � −#C H + 1 − ' G( + K#C H + 1 − ' G(- + 4' G2 G
Substitute the constant values and solve for A and B:
' � !1 − "�#$%&'()�* *�+ ) + "-.���0�0+0�� � 9.086
H � !/DEFD + /-EF- + /�EF.G
Fifteenth International Water Technology Conference, IWTC 15 2010, Alexandria, Egypt
13
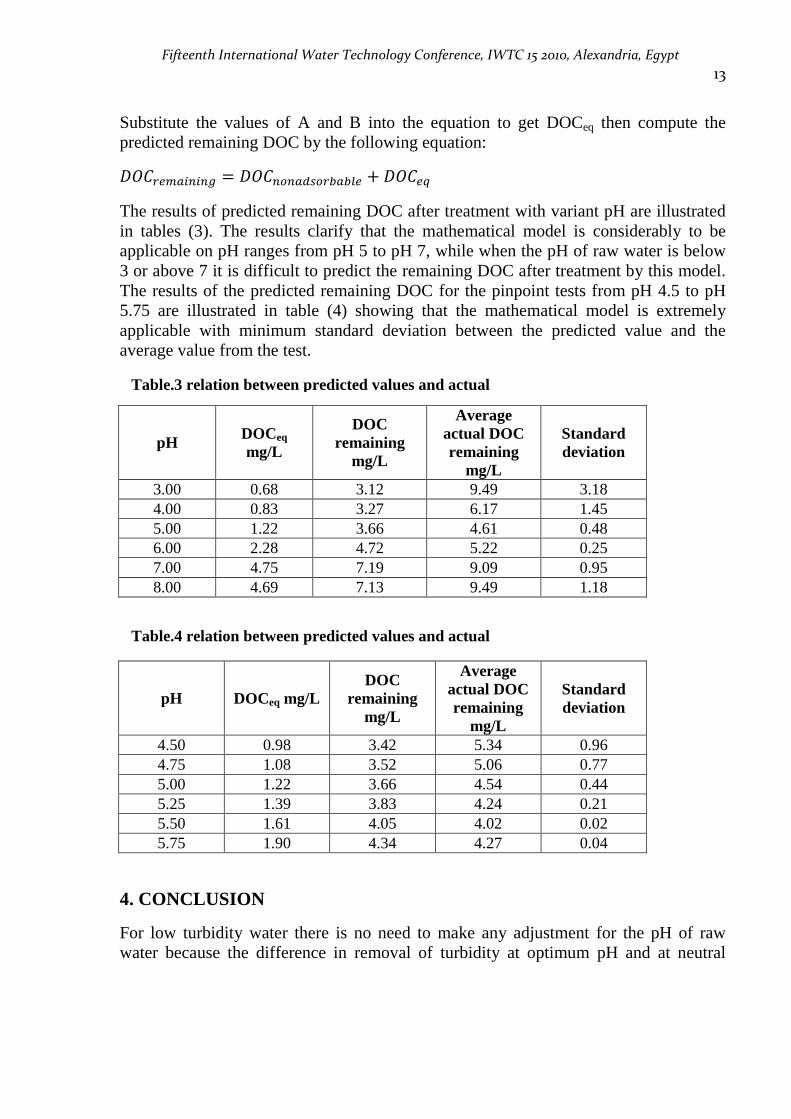
Substitute the values of A and B into the equation to get DOCeq then compute the predicted remaining DOC by the following equation:
���) N�0�0�O � ����������)���� + ��� B
The results of predicted remaining DOC after treatment with variant pH are illustrated in tables (3). The results clarify that the mathematical model is considerably to be applicable on pH ranges from pH 5 to pH 7, while when the pH of raw water is below 3 or above 7 it is difficult to predict the remaining DOC after treatment by this model. The results of the predicted remaining DOC for the pinpoint tests from pH 4.5 to pH 5.75 are illustrated in table (4) showing that the mathematical model is extremely applicable with minimum standard deviation between the predicted value and the average value from the test.
pH DOCeq mg/L
DOC remaining
mg/L
Average actual DOC remaining
mg/L
Standard deviation
3.00 0.68 3.12 9.49 3.18 4.00 0.83 3.27 6.17 1.45 5.00 1.22 3.66 4.61 0.48 6.00 2.28 4.72 5.22 0.25 7.00 4.75 7.19 9.09 0.95 8.00 4.69 7.13 9.49 1.18
pH DOCeq mg/L DOC
remaining mg/L
Average actual DOC remaining
mg/L
Standard deviation
4.50 0.98 3.42 5.34 0.96 4.75 1.08 3.52 5.06 0.77 5.00 1.22 3.66 4.54 0.44 5.25 1.39 3.83 4.24 0.21 5.50 1.61 4.05 4.02 0.02 5.75 1.90 4.34 4.27 0.04
4. CONCLUSION
For low turbidity water there is no need to make any adjustment for the pH of raw water because the difference in removal of turbidity at optimum pH and at neutral
Table.3 relation between predicted values and actual
Table.4 relation between predicted values and actual

Fifteenth International Water Technology Conference, IWTC 15 2010, Alexandria, Egypt
14
water is not significant and doesn't deserve the efforts of controlling the pH in water treatment plant. While for high turbidity water controlling the pH of raw water is more effective in turbidity removal and may be applied in water treatment plants according to the nature of raw water in these plants and according to considerable number of jar tests to these water because the optimum pH may becomes different on each type of water.
Effective removal of natural organic matter from low turbidity water can be achieved by aluminum based coagulants to make micro-floc formation (coagulation) followed by macro-floc formation (flocculation). The pH adjustment for raw water contains NOM is clear to be significant, and deserves the efforts of controlling the acidity of raw water specially in high capacity water treatment plants. In this work the laboratory results of DOC removal were matching to the empirical model of Edwards (1997) in the range from pH 5 to pH 7 and this means that is applicable in the future to the raw water used in this work. ACKNOLEDGMENT
The authors acknowledge the support received from NATO in Sanitary Engineering lab of Mansoura University through the project of “Science for Peace”, No SFP-982124 REFERENCES
[1] Wang, G., Hsieh, S. (2001) "Monitoring natural organic matter in water with scanning spectrophotometer" Environment International 26 205-212
[2] Egeberg, P. K, Chrity, A. A, Eikenes, M. (2002) "The molecular size of natural organic matter (NOM) determined by diffusivimetry and seven other methods" Water Research 36 925-932
[3] Kim, H. C., Yu, M. J. (2005) "Characterization of natural organic matter in conventional water treatment processes for selection of treatment processes focused on DBPs control" Water Research 39 4779-4789
[4] Hendricks, D., (2006) "Water Treatment Unit Processes – Physical and Chemical" , p 355, CRC Press, Taylor& Francis Group, New York,
[5] Rizzo, L., Belgiorono, V., Gallo, M., Meric, S. (2005) " Removal of THM precursors from a high-alkaline surface water by enhanced coagulation and behavior of THMFP toxicity on D.manga" Desalination 176 177-188
Fifteenth International Water Technology Conference, IWTC 15 2010, Alexandria, Egypt
15
[6] Bose, P., Reckhow, D. A. (2007) "The effect of ozonation on natural organic matter removal by alum coagulation" Water research 41 1516-1524
[7] O' Melia, C. R., Becker, W. C. and Au, K. K. (1999)."Removal of Humic Substances by Coagulation” Water Sci. and Technol., 40, 47-54
[8] Korbutowicz, M. K. (2005) " Application of ultrafiltration integerated with coagulation for improved NOM removal" Desalination 174 13-22
[9] Bond, T., Goslan, E. H., Parsons, S.A., Jefferson, B. (2010) "Disinfection by-product formation of natural organic matter surrogates and treatment by coagulation, MIEX® and nanofilteration" Water Research (44) 1645-1653
[10] Leeuwen, J., Daly, R., Holmes, M. (2005) " Modeling the treatment of drinking water to maximize dissolved organic matter removal and minimize disinfection by-product formation" Desalination 176 81-89
[11] Yan, M., Wang, D., Yu, J., Ni, J., Edwards, M., Qu, J. (2008) "Enhanced coagulation with polyaluminum chlorides: Role of pH/Alkalinity and speciation" Chemosphere 71 1665-1673
[12] Matilainen, A., Lindqvist, N., Korhonen, S., Tuhkanen, T. (2002) "Removal of NOM in the different stages of the water treatment process" Environment International 457-465
[13] Crittenden, J. C., Trussell, R. R., Hand, D. W., Howe, K. J., Tchobanoglous, G. (2005)"Water Treatment: Principles and Design" Jhon Wiley & Sons, Inc. 690-694
[14] Thiruvenkatachari, R., Ngo, H. H, Hagare, P., Vigneswaran, S. Ben Aim, R. (2002) "Flocculation-cross-flow microfiltration hybrid system for natural organic matter (NOM) removal using hematite as a flocculent" Desalination 147 83-88
[15] Uyak, V., Toroz, I. (2007) "Disinfection by-product precursors reduction by various coagulation techniques in Istanbul water supplies" Journal of Hazardous Materials 141 320-328
[16] Annadurai, G., Sung, S. S, Lee, D. J. (2004) "Simultaneous removal of turbidity and humic acid from high turbidity storm water" Advances in environmental research (8 ), 713-725
[17] Edzwald, J. K., Van Benschoten, J. E. (1990) "Aluminum coagulation of natural organic matter" Hahn and Klute. New York, Springer-Verlag 341-359
[18] Yang, Z. L., Gao, B. Y, Yue, Q. Y, Wang, Y. (2010) "Effect of pH on the coagulation performance of Al-based coagulants and residual aluminum speciation during the treatment of humic acid-kaolin synthetic water" Journal of Hazardous Material

Fifteenth International Water Technology Conference, IWTC 15 2010, Alexandria, Egypt
16
[19] Sharp, E. L., Parsons, S.A., Jefferson, B. (2006) "Seasonal variations in natural organic matter and its impact on coagulation in water treatment" Science of the Total Environment 363 183-194
[20] Hundet, T. R., O'Melia, C. R. (1988)"Aluminum-Fulvic acid interactions: Mechanism and applications" Journal of the American Water Works Association 80(4) 176-186
[21] Shi, Y., Xu, L., Gong, D., Lu, J. (2010) "Effects of sterilization treatments on the analysis of TOC in water samples" Journal of Environmental Science, 22(5) 789-795
[22] Edwards, M. (1997) "Predicting DOC removal during enhanced coagulation".Journal AWWA, 89(5), 78-89


![EVITA-Libro de lectura [Sólo lectura] [Modo de compatibilidad] · Title: Microsoft PowerPoint - EVITA-Libro de lectura [Sólo lectura] [Modo de compatibilidad] Author: Puesto 2 Created](https://static.fdocuments.in/doc/165x107/5e0aacc046419b5dc2758323/evita-libro-de-lectura-slo-lectura-modo-de-compatibilidad-title-microsoft.jpg)