lectur
65
Dose Response Dose Response Relationship Relationship & & Therapeutic Index Therapeutic Index Dr Rizwan Dr Rizwan
-
Upload
james-perianayagam -
Category
Documents
-
view
3 -
download
0
description
bd
Transcript of lectur
Dose Response RelationshipDose Response Relationship&&
Therapeutic IndexTherapeutic Index
Dr RizwanDr Rizwan

ObjectivesObjectivesdose/response (D/R) median effective
dose (ED50)
efficacy (effectiveness)
median toxic dose (TD50)
potency therapeutic index
graded (quantitative) D/R curve tachyphylaxis
quantal (cumulative) D/R curve

What is a dose response What is a dose response relationship?relationship?

Systemic description of the magnitude of the effect of a drug
as a function of the dose (very low to very high)

Dose response curvesDose response curves
The relationship of dose to The relationship of dose to response can be illustrated response can be illustrated as a graph called as dose as a graph called as dose
response curve. response curve.

Dose-response curves can be used to plot the Dose-response curves can be used to plot the results of many kinds of experiments. results of many kinds of experiments.
The X-axis plots concentration of a drug or The X-axis plots concentration of a drug or hormone. hormone.
The Y-axis plots response, which could be almost The Y-axis plots response, which could be almost anything. anything.
For example, the response might be enzyme For example, the response might be enzyme activity, accumulation of an intracellular second activity, accumulation of an intracellular second messenger, membrane potential, secretion of a messenger, membrane potential, secretion of a hormone, heart rate or contraction of a muscle. hormone, heart rate or contraction of a muscle.

Shape of the curveShape of the curve
A standard dose-response curve is A standard dose-response curve is defined by four parameters: defined by four parameters:
the baseline response (Bottom),the baseline response (Bottom),
the maximum response (Top),the maximum response (Top),
the slope, and the the slope, and the
drug concentration that provokes a drug concentration that provokes a response halfway between baseline and response halfway between baseline and maximum (EC50).maximum (EC50).


ThresholdThreshold
Important aspect of dose response Important aspect of dose response relationship.relationship.
A dose below which there are no A dose below which there are no adverse effects from exposure to adverse effects from exposure to chemical.chemical.

BIOLOGICAL STIMULUSBIOLOGICAL STIMULUS
PERCENT RECEPTOR OCCUPANCYPERCENT RECEPTOR OCCUPANCY
0%0% 100%100%
BIOLOGICAL RESPONSEBIOLOGICAL RESPONSE RECEPTOR RESERVERECEPTOR RESERVETRETHOLDTRETHOLD
0%0% 100%100%
Max EffectMax EffectThreshold EffectThreshold Effect
Schematic representation of the relationship between threshold, receptor Schematic representation of the relationship between threshold, receptor reserve, receptor occupancy, biological stimulus and biological responsereserve, receptor occupancy, biological stimulus and biological response

When a threshold is difficult to When a threshold is difficult to determinedetermine
Look for slope of the dose response Look for slope of the dose response curve.curve.
Why?Why?

A sharp increase in A sharp increase in slope suggestslope suggest
increasingly higher increasingly higher risk of toxic risk of toxic response as the response as the dose increasesdose increases
A relatively flat slope suggest
that effect of an increasing dose is
minimal

Dose Response CurveDose Response Curve
Many dose-response curves follow Many dose-response curves follow exactly the shape of a receptor exactly the shape of a receptor binding curve. As shown below, 81 binding curve. As shown below, 81 times more agonist is needed to times more agonist is needed to achieve 90% response than a 10% achieve 90% response than a 10% response.response.


Some dose-response curves however, Some dose-response curves however, are are steeper or shallowersteeper or shallower than the than the standard curve. standard curve.
The steepness is quantified by the The steepness is quantified by the Hill Hill slope, slope, also called aalso called a slope factor. slope factor.
A dose-response curve with a standard A dose-response curve with a standard slope has a Hill slope of slope has a Hill slope of 1.0.1.0.
A steeper curve has a higher slope A steeper curve has a higher slope factor, and a shallower curve has a lower factor, and a shallower curve has a lower slope factor. slope factor.


Is there any relationship between Is there any relationship between shape of curve and potencyshape of curve and potency
A A Steep curveSteep curve even at a even at a small dosesmall dose suggest a suggest a chemical of chemical of high potencyhigh potency

Reason for steep curveReason for steep curve
Cooperative interaction of several Cooperative interaction of several different actions of drug different actions of drug
E.g. effect on brain, heart, and E.g. effect on brain, heart, and peripheral vessels, all contributing peripheral vessels, all contributing to lowering of blood pressure.to lowering of blood pressure.
Coma caused by sedative Coma caused by sedative hypnotics.hypnotics.


Used to measureUsed to measure
Drug potencyDrug potency
Drug efficacyDrug efficacy
Drug safetyDrug safety

POTENCYPOTENCY
CONCENTRATION (EC50) OR DOSE (ED50) OF A DRUG
REQUIRED TO PRODUCE 50% OF THAT DRUG’S MAXIMUM EFFECT

A
B
X0
Average Response Magnitude
DRUG DOSE
PotencyPotencyHI
A is more potent than BA is more potent than B

A
B
DRUG DOSEX0
Average Response Magnitude
HI
LO
Maximum EfficacyMaximum Efficacy
B has greater max efficacy than AB has greater max efficacy than A

[D] (concentration units)
% M
axim
al E
ffec
t
0.01 0.10 1.00 10.00 100.00 1000.000.0
0.2
0.4
0.6
0.8
1.0
Partial agonist
Full Agonist
Partial agonist
PARTIAL AGONISTS - EFFICACYEven though drugs may occupy the same # of receptors, the magnitude
of their effects may differ.


Example Example Isoproterenol, Epinephrine and Nor Isoproterenol, Epinephrine and Nor epinephrineepinephrine all interact with the same all interact with the same receptor and produce the same maximal receptor and produce the same maximal effect (efficacy). Thus isoproternol, effect (efficacy). Thus isoproternol, epinephrine & nor epinephrine are equally epinephrine & nor epinephrine are equally effective (because all activate the same effective (because all activate the same number of receptors and are described as number of receptors and are described as full agonist) full agonist)
BUTBUT

Dose response curve don’t Dose response curve don’t look the samelook the same
What's different? What's different?

Difference between the 3 drugs Difference between the 3 drugs is theiris their
POTENCYPOTENCY
ISOPROTERENOL > EPINEPHRINE > NOR EPINEPHRINE

Types of dose response curvesTypes of dose response curves
GradedGraded dose response curves dose response curves
QuantalQuantal dose response curves dose response curves

What is the difference between Quantal What is the difference between Quantal and graded dose-response curves?and graded dose-response curves?

Graded (Quantitative) dose-effect relationshGraded (Quantitative) dose-effect relationshipsips
A graph of the relationship between dose A graph of the relationship between dose
and response.and response.
minimum detectable responseminimum detectable response and a and a maximum maximum
responseresponse by by varying the dose or drug concentration,varying the dose or drug concentration,
i.e., the curve is continuous. i.e., the curve is continuous.

Graded dose response curves show effects on a continuous scale And the intensity of the effect
is proportional to the dose

Exposure to ethanol Graded responses between no effect and death
RequirementsRequirements
Single biological unit or average of Single biological unit or average of many such units for each data pointmany such units for each data point
A preparation of a single animal or A preparation of a single animal or organ can produce the curve organ can produce the curve

ProblemProblem
Poor predictors of how other specimens Poor predictors of how other specimens might respond. might respond.

Plot of the contraction of the intestinal smooth muscle Plot of the contraction of the intestinal smooth muscle in response to varied doses of acetylcholine in response to varied doses of acetylcholine

ObservationObservation The response varies continuously with dose.The response varies continuously with dose. ShapeShape -- -- sigmoidalsigmoidal Threshold doseThreshold dose -- -- The lowest dose that produces a detectable The lowest dose that produces a detectable
response response Dose units --Dose units -- the the independent variableindependent variable is plotted on the X-axis as the is plotted on the X-axis as the
logarithm of the dose. This -- logarithm of the dose. This -- produces a symmetrical curve produces a symmetrical curve allows a broader range of doses on the graph allows a broader range of doses on the graph Response units --Response units -- the the dependent variabledependent variable is plotted on the Y-axis in is plotted on the Y-axis in
arithmetic units. The scale can be -- arithmetic units. The scale can be -- actual units, e.g., grams of tension, mm change in length, etc. actual units, e.g., grams of tension, mm change in length, etc. derived units, e.g., % of maximum response derived units, e.g., % of maximum response
Abstract summary of dataAbstract summary of data, to allow for easy comparisons and , to allow for easy comparisons and mathematical treatment, e.g., EDmathematical treatment, e.g., ED5050

Quantal (All-or-none; binary) doQuantal (All-or-none; binary) dose-effect relationshipsse-effect relationships
Graph of relationship between dose and Graph of relationship between dose and
effect effect
describes the describes the distribution of MINIMUM distribution of MINIMUM doses of drugdoses of drug required to produce a required to produce a defined degree of a specific responsedefined degree of a specific response in in a a populationpopulation of subjects. of subjects.

All or NoneAll or None
Percentage of population Percentage of population affectedaffected– >> threshold response threshold response
– As function of drug dose As function of drug dose
NOTNOT magnitude of drug effects magnitude of drug effects


PurposePurpose
To allow To allow predictionspredictions about what about what proportion of a population of proportion of a population of subjects will respond to given subjects will respond to given doses of the drug or toxin. doses of the drug or toxin.

Defined specific effect and degree of Defined specific effect and degree of responseresponse -- --
The specific effect being measuredThe specific effect being measuredOnly two responses are allowed -- Only two responses are allowed --
Yes or No; 0 or 1 Yes or No; 0 or 1
Response is Response is quantalquantal, i.e., not , i.e., not continuously variable continuously variable
increments or decrements by 1 increments or decrements by 1 unit (e.g., individual) at a time.unit (e.g., individual) at a time.

ProblemProblem
Many units (animals, humans, Many units (animals, humans, organs) required to create a quantal organs) required to create a quantal dose-effect curve. dose-effect curve.
From these many units, one can make From these many units, one can make predictions about what proportion of a predictions about what proportion of a similar population will respond to the similar population will respond to the drug in the same waydrug in the same way. .

TitrationTitration Because the plot represents the distribution Because the plot represents the distribution of minimum doses that produce the effect, of minimum doses that produce the effect,
one must titrate the population with one must titrate the population with increasing doses until virtually all members increasing doses until virtually all members respond. respond.
In essence, one is finding the In essence, one is finding the individual individual effective dose. effective dose.
This can be done in two ways This can be done in two ways

Titration of each individual Titration of each individual Administer increasing doses of drug to each individual until a Administer increasing doses of drug to each individual until a response is elicited, then note the dose. response is elicited, then note the dose. Do this for all members of the test population. Do this for all members of the test population.
very impracticalvery impractical ------serious conceptual disadvantages, ------serious conceptual disadvantages, e.g., multiple doses of drug may produce a false effect e.g., multiple doses of drug may produce a false effect compared to a single exposure to a larger dose. compared to a single exposure to a larger dose.
Titration of groups Titration of groups Divide the test population into groups, Divide the test population into groups,
give each group only one of a series of increasinggive each group only one of a series of increasing
doses. doses.
Responses will vary, e.g., from no responses in a Responses will vary, e.g., from no responses in a
group to 100% of responses. Record the % of the group to 100% of responses. Record the % of the
group responding to each dose. group responding to each dose.

Shape of curveShape of curve
"cumulative" dose-effect curve is "cumulative" dose-effect curve is
sigmoidal sigmoidal when % responding is plotted against the when % responding is plotted against the log-dose. log-dose.

Description of dataDescription of data
One can define the mid-point One can define the mid-point as for the graded curve, i.e., the as for the graded curve, i.e., the EDED5050, the dose that produces , the dose that produces
the effect in 50% of the test the effect in 50% of the test population. population.

Construction of Construction of quantalquantal (binary) dose-effect curves (binary) dose-effect curves
Method A: Titrate each animalMethod A: Titrate each animal
Method B -- Titration of groupsMethod B -- Titration of groups

Method A: Titrate each animalMethod A: Titrate each animal Sample experimentSample experiment
1.1. 70 rats are given the same initial dose 70 rats are given the same initial dose 2.2. Did the dose elicit the Did the dose elicit the predefined degree of predefined degree of
response response in any of the animals? If so, note in any of the animals? If so, note the % that responded (Yes or "1") and the % that responded (Yes or "1") and remove them from the test population remove them from the test population
3.3. Administer the next higher dose to the Administer the next higher dose to the remaining animals remaining animals
4.4. Note the number responding and remove Note the number responding and remove them from the test them from the test Repeat steps 3 and 4 until ALL of the animals Repeat steps 3 and 4 until ALL of the animals have responded. have responded.

BELL SHAPED CURVEmajority of responders in the middlemean response is approx. 110 mg/kgfewer responders at the end of bell curve (expected)known as biological variabilityresponders at the far left of the mean are typically hypersusceptible whereas those at the far right are resistant

CommentsComments
expensiveexpensive in labor, materials, and drug in labor, materials, and drug because many animals receive multiple because many animals receive multiple doses doses
Requires Requires long periods of timelong periods of time to conduct to conduct the experiment because one must wait the experiment because one must wait until the animals have recovered until the animals have recovered completely from the previous dose completely from the previous dose Results confoundedResults confounded by previous and by previous and multiple exposures to the drug multiple exposures to the drug

Method B -- Titration of groupsMethod B -- Titration of groups
Give one and the same dose to Give one and the same dose to each animal of a group. each animal of a group.
From a series of doses, give each From a series of doses, give each group one dose. group one dose.
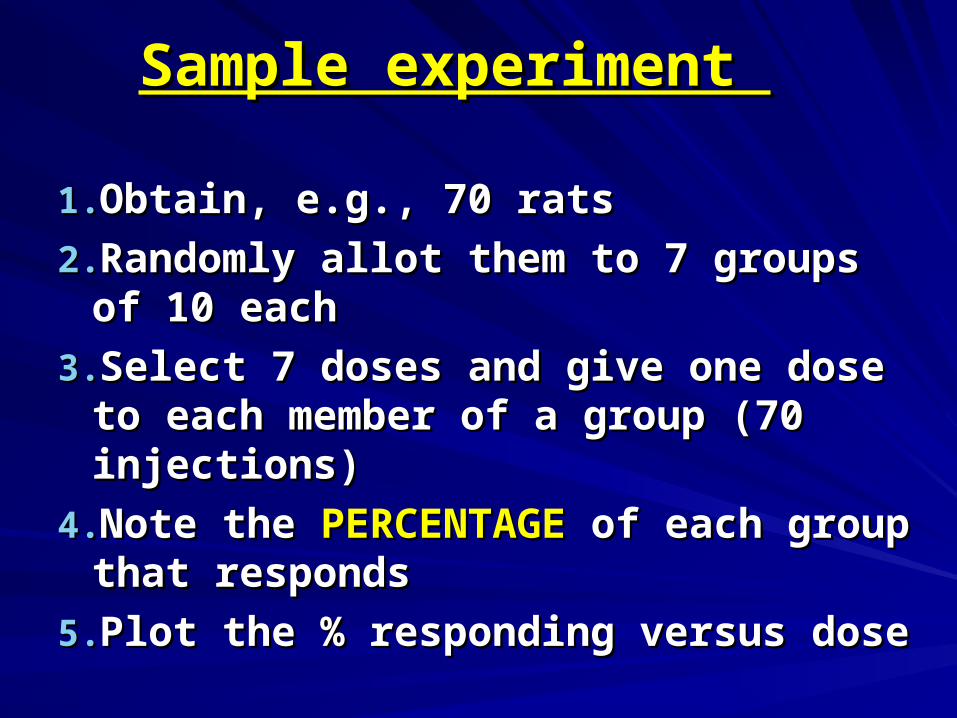
Sample experiment Sample experiment
1.1. Obtain, e.g., 70 rats Obtain, e.g., 70 rats
2.2. Randomly allot them to 7 groups of 10 Randomly allot them to 7 groups of 10 each each
3.3. Select 7 doses and give one dose to Select 7 doses and give one dose to each member of a group (70 injections) each member of a group (70 injections)
4.4. Note the Note the PERCENTAGE PERCENTAGE of each group of each group that responds that responds
5.5. Plot the % responding versus dose Plot the % responding versus dose

Cumulative quantal dose Cumulative quantal dose response plotresponse plot


Both curves provideBoth curves provideInformation regardingInformation regarding
potency.potency.SelectivitySelectivity
But But Graded dose responseGraded dose response curve curve
indicates indicates maximum efficacymaximum efficacy
Quantal dose responseQuantal dose response indicates indicates potential variability of potential variability of
responsiveness responsiveness among among individuals individuals

Quantal D/R curves used to define Quantal D/R curves used to define
median effective (and toxic) doses, median effective (and toxic) doses,
concept of “therapeutic index” concept of “therapeutic index”
the potential range of inter-subject the potential range of inter-subject variability in drug response. variability in drug response.


To use or not to use?To use or not to use?
Need informationNeed information
Therapeutic Index (safety margin)Therapeutic Index (safety margin)
Decision MakingDecision Making
TI:TI: 10mg/10mg = 1 10mg/10mg = 1
100mg/10mg = 10100mg/10mg = 10
1000mg/10mg = 100 ~1000mg/10mg = 100 ~
LD50
ED50

BIOLOGICAL STIMULUSBIOLOGICAL STIMULUS
PERCENT RECEPTOR OCCUPANCYPERCENT RECEPTOR OCCUPANCY
0%0% 100%100%
BIOLOGICAL RESPONSEBIOLOGICAL RESPONSE RECEPTOR RESERVERECEPTOR RESERVETRETHOLDTRETHOLD
0%0% 100%100%
Max EffectMax EffectThreshold EffectThreshold Effect
Schematic representation of the relationship between threshold, receptor Schematic representation of the relationship between threshold, receptor reserve, receptor occupancy, biological stimulus and biological responsereserve, receptor occupancy, biological stimulus and biological response

100
50
0
DRUG DOSE0 X
ED LD
% subjects
TI = LD50/ ED50
Relatively safe ~Relatively safe ~

100
50
0
DRUG DOSE0 X
ED LD
% subjects
TI = LD50/ ED50
Less safe drug ~Less safe drug ~


![Now ]by linocut - Stanford Universityweb.stanford.edu/~marykw/classes/CS250_W18/lectureNotes/Lectur… · To RECAP the storyofConcatenatedCodes:-Weconsidered (RScode)° (BinaryLinearCodeontheGVbound)-Because](https://static.fdocuments.in/doc/165x107/5fd7a1b3845b0041362fcbda/now-by-linocut-stanford-marykwclassescs250w18lecturenoteslectur-to-recap.jpg)