Lebanon—Determinants of Commercial Bank Deposits · PDF fileadvanced economy economic...
22
Lebanon—Determinants of Commercial Bank Deposits in a Regional Financial Center Harald Finger and Heiko Hesse WP/09/195
Transcript of Lebanon—Determinants of Commercial Bank Deposits · PDF fileadvanced economy economic...

Lebanon—Determinants of Commercial Bank Deposits in a Regional Financial Center
Harald Finger and Heiko Hesse
WP/09/195

© 2009 International Monetary Fund WP/09/195
IMF Working Paper Middle East and Central Asia Department Lebanon—Determinants of Commercial Bank Deposits in a Regional Financial Center
Prepared by Harald Finger and Heiko Hesse1
Authorized for distribution by Domenico Fanizza
September 2009
Abstract
This Working Paper should not be reported as representing the views of the IMF. The views expressed in this Working Paper are those of the author(s) and do not necessarily represent those of the IMF or IMF policy. Working Papers describe research in progress by the author(s) and are published to elicit comments and to further debate.
This paper empirically examines the demand for commercial bank deposits in Lebanon, a regional financial center. With Lebanon’s high fiscal deficits financed largely by domestic commercial banks that rely on deposit funding, deposit growth is a key variable to assess government financing conditions. At the macro level, we find that domestic factors such as economic activity, prices, and the interest differential between the Lebanese pound and the U.S. dollar are significant in explaining deposit demand, as are external factors such as advanced economy economic and financial conditions and variables proxying the availability of funds from the Gulf. Impulse response functions and variance decomposition analyses underscore the relative importance of the external variables. At the micro level, we find that in addition, bank-specific variables, such as the perceived riskiness of individual banks, their liquidity buffers, loan exposure, and interest margins, bear a significant influence on the demand for deposits.
JEL Classification Numbers: C22, C32, E41, E44, E52, G21
Keywords: Deposits, deposit demand, Lebanon, money demand, panel regressions, regional financial center, VECM
Authors’ E-Mail Addresses: [email protected]; [email protected]
1 The authors wish to thank Raja Abou-Asli, Hoda Chiriac, Mayya Dabbagh, Youssef El-Khalil, Domenico Fanizza, Nadeem Ilahi, Pablo Lopez Murphy, Ratna Sahay, Carlo Sdralevich, Hans Weisfeld, and participants at an IMF seminar for their helpful comments.

2
Contents Page
I. Introduction..........................................................................................................................3
II. Commercial Bank Deposits in Lebanon ..............................................................................3
III. Macroeconomic Estimates ...................................................................................................5
IV. Bank-Specific Factors........................................................................................................10
V. Conclusions.........................................................................................................................14
References................................................................................................................................21 Text Figures Fiscal Deficit and Change in Deposits.................................................................................4 Deposit Growth, Interest Differential, and GCC Real GDP Growth...................................5 Tables 1. VECMs for Deposit Demand...............................................................................................8 2. Impulse Response Functions................................................................................................9 3. Variance Decomposition....................................................................................................10 4. Panel Estimations for Deposit Growth at the Bank Level .................................................13 Figures 1. VECM Actual and Fitted, Models I–III.............................................................................15 2. VECM Actual and Fitted, Models IV–VI..........................................................................16 3. Impulse Response Functions..............................................................................................17 4. Key Time Series.................................................................................................................18 Appendix Macroeconomic Dataset—Unit Root Tests .......................................................................20

3
I. INTRODUCTION
Commercial bank deposits are key to ensuring continued government financing in Lebanon. With the high government debt largely held by the domestic commercial banks, their continued funding, mainly from resident and non-resident deposits, is an important gauge to the viability of the Lebanese financing model. However, available statistics do not shed much light on the origins or determinants of deposit demand, since detailed data on the origins of deposits are not available, and existing statistics on the breakdown into resident and non-resident deposits are not reliable. In addition, while there is anecdotal evidence regarding some drivers of deposit growth, particularly during the recent upsurge of deposit inflows, formal research on this important issue has been scant. This paper aims to fill this void by formally examining the determinants of deposit demand, asking whether domestic or external factors are predominant. Starting from a framework akin to a money demand specification, we aim to explain deposits using variables measuring domestic factors such as real economic activity, prices, and interest rates. Given Lebanon’s role as a financial center for the region and for the large Lebanese diaspora both in the Gulf and in industrial countries, we add variables proxying global economic and financial market conditions, the availability of funds in the Gulf, and the perception of Lebanon-specific risks. Estimating a number of vector error correction models (VECMs) to take account of cointegration in the non-stationary time series, we find that both domestic and international factors help explain deposit demand. Among domestic variables, we find that the coincident indicator for real economic activity in Lebanon, consumer prices, and the interest differential between the local currency and the U.S. dollar matter. Among the external variables, advanced economy economic and financial conditions appear significant (especially advanced economy industrial production and the Goldman Sachs Risk Aversion Index), as do some variables proxying the availability of funds from the Gulf. While both domestic and external variables are significant in explaining deposit demand, impulse response functions and variance decomposition analyses underscore the relative importance of the external variables. We extend the analysis asking whether bank-specific variables also have a significant bearing on the demand for deposits. In a series of fixed-effects panel regressions covering over 50 Lebanese banks, we find that the banks’ perceived riskiness (z-score), their liquidity buffers, loan exposures and interest margins all bear a significant influence on deposit growth at the bank level, controlling for domestic and external macroeconomic factors. The paper is organized as follows: Section II provides an overview of the Lebanese financial system while Section III shows the findings of the macroeconomic models. Section IV discusses the bank-by-bank findings while Section V concludes.
II. COMMERCIAL BANK DEPOSITS IN LEBANON
The Lebanese economy and financial system are characterized by a unique nexus between government debt and the banking system. The ratio of government debt to GDP, at

4
160 percent, is among the highest in the world and substantially above conventional debt sustainability thresholds.2 Debt is largely held by domestic commercial banks, which are funded mainly from deposits, including to a significant extent non-resident deposits. As a result, the banking system has grown very large: the ratio of total commercial bank assets to GDP, at 324 percent, is among the highest in emerging markets. The close interrelation between government debt and commercial banks has its roots in the post-civil-war period of the 1990s. High fiscal deficits in view of the post-war reconstruction coincided with the rebuilding of Lebanon as a regional financial center. As banks quickly reconstituted their deposit base, the government showed continuous demand for bank assets to finance its large fiscal deficits. And conversely, the government’s demand for bank assets enabled banks to continue to expand their deposit base rapidly and profitably.
Fiscal Deficit and Change in Deposits (In percent of GDP)
0
10
20
30
40
50
60
70
80
1991 1993 1995 1997 1999 2001 2003 2005 2007
Overall Fiscal Deficit
Change in Commercial Bank Deposits
The result is a macrofinancial system that has become dependent on a continuous expansion of bank deposits. With the government debt-to-GDP ratio well beyond conventional debt sustainability thresholds, interest payments alone amount to nearly 12 percent of GDP (2005–08 average). In part due to a number of domestic shocks since 2005, there has not been a sustained fiscal adjustment, and overall fiscal deficits have been in the order of 10 percent of GDP (2005–08 average). The main providers of this additional financing are the domestic commercial banks, which, given their large existing asset exposure to government, are de facto captive in this system, in the sense that the viability of government finances and that of the banks’ balance sheets are mutually dependent. The determinants of deposit demand are thus key to any attempt at gauging the outlook for ongoing financial stability in Lebanon. These could include domestic factors such as growth, inflation, interest rates, and domestic shocks such as the near-debt crisis in 2002, the assassination of the late Prime Minister Hariri in 2005, and the war with Israel and ensuing domestic political stalemate beginning in 2006. A simple plot of deposit growth and the interest rate differential between bank deposits in Lebanese pounds and U.S. dollar LIBOR, and highlighting periods of domestic shocks, suggests that domestic factors indeed have played an important role (below). However, given Lebanon’s importance as a regional financial center, the determinants of deposit growth likely also include external factors. While reliable statistics on the origins of the deposit base are not available, anecdotal evidence points to the importance of Lebanon’s large diaspora, which deposits part of their wealth in the Lebanese banking system and
2 For an overview of debt sustainability thresholds, see, for example, Finger and Mecagni (2007).

5
supports relatives in Lebanon through remittances, part of which are saved in bank deposits. In fact, receipts of remittances as percent of GDP in Lebanon are among the highest in the world (21 percent of GDP in 2007), with the largest flows originating from the GCC (54 percent), Australia, (7 percent), the United States (6 percent), and Canada (3 percent). A plot of deposit growth and real GDP growth in the GCC shows some correlation since the early 2000s, when the GCC became an increasingly popular destination for Lebanese expatriates, and when oil prices rose and increased the wealth of Arab investors. Moreover, global liquidity conditions could affect deposits in Lebanon, as foreign investors might be more inclined to deposit in Lebanese banks in times of abundant liquidity.
Deposit Growth, Interest Differential, and GCC Real GDP Growth
40 4016(percent yoy) 15(percent yoy) (percent yoy)(percentage points)
35 3514Deposit growth Deposit growth
30 3012Interest differential (rhs) GCC Real GDP growth (rhs) 1025 2510
20 8 20 5
15 6 15
10 4 10 0
5 2 5Correlation: 0.51 Correlation: -0.27
0 0 0 -51994 2000 2002 2002 2004 1996 1998 2004 2006 2008 1994 1996 1998 2000 2006 2008
In addition to these mainly macroeconomic factors, bank-specific variables could also play an important role. Given low coverage limits in the deposit insurance scheme, banks that are perceived as less risky, maintain a high level of liquidity, or have a lower concentration of assets, particularly to the government, may be expected to be able to attract more deposits than their peers.
III. MACROECONOMIC ESTIMATES
To gauge the determinants of deposit demand more systematically, we empirically estimate a number of deposit demand functions, using quarterly data from 1993 to 2008. The starting point is a specification that, akin to a standard money demand function, focuses on domestic factors of real economic activity, prices and interest rates. We choose the Banque du Liban’s coincident indicator (CI) as a proxy for economic activity, given its close correlation with GDP and its availability as a reasonably long quarterly time series. For prices, we choose the Consultation and Research Institute’s Consumer Price Index (CPI), also given the availability of a sufficiently long time series. Since Lebanon is a small open economy with a fully open capital account and a fixed exchange rate to the U.S. dollar since 1999, we choose as interest rate variable the interest rate differential between the Lebanese pound deposit rate and the U.S. dollar LIBOR (DEPATTRACT).3
3 Note that, as opposed to a money demand function, the interest variable here does not measure the opportunity cost of holding money, but rather the attractiveness of holding deposits.
6
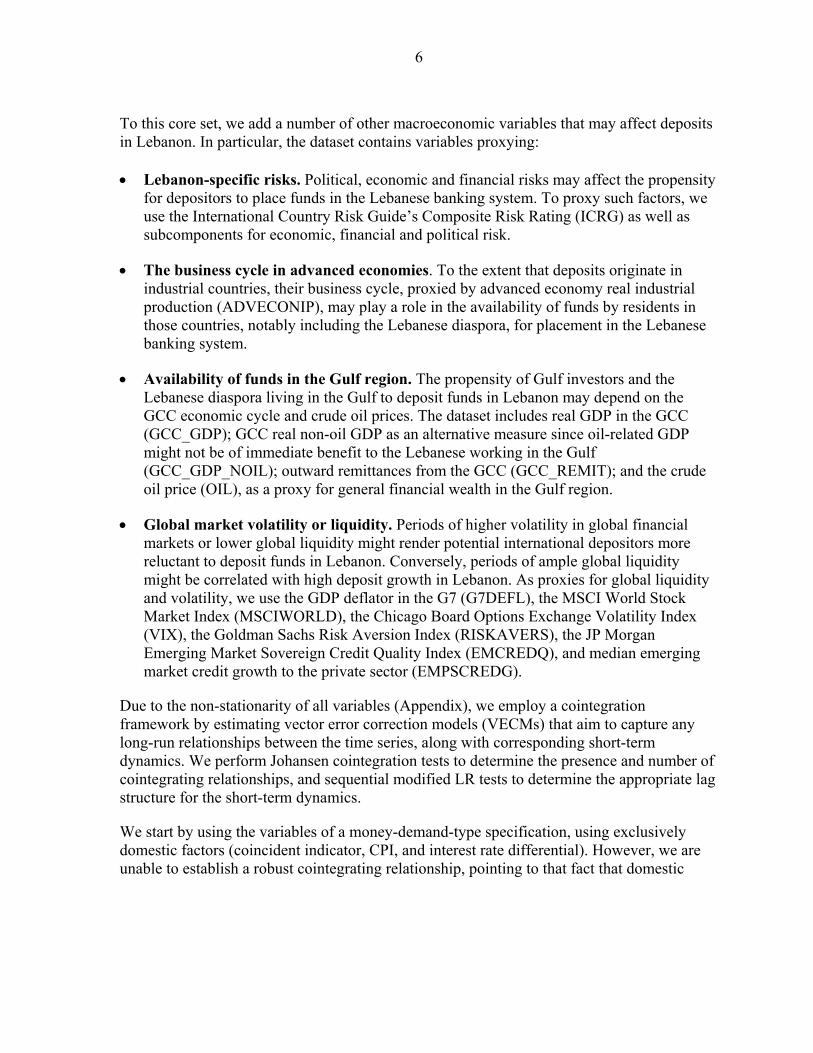
To this core set, we add a number of other macroeconomic variables that may affect deposits in Lebanon. In particular, the dataset contains variables proxying: Lebanon-specific risks. Political, economic and financial risks may affect the propensity
for depositors to place funds in the Lebanese banking system. To proxy such factors, we use the International Country Risk Guide’s Composite Risk Rating (ICRG) as well as subcomponents for economic, financial and political risk.
The business cycle in advanced economies. To the extent that deposits originate in industrial countries, their business cycle, proxied by advanced economy real industrial production (ADVECONIP), may play a role in the availability of funds by residents in those countries, notably including the Lebanese diaspora, for placement in the Lebanese banking system.
Availability of funds in the Gulf region. The propensity of Gulf investors and the Lebanese diaspora living in the Gulf to deposit funds in Lebanon may depend on the GCC economic cycle and crude oil prices. The dataset includes real GDP in the GCC (GCC_GDP); GCC real non-oil GDP as an alternative measure since oil-related GDP might not be of immediate benefit to the Lebanese working in the Gulf (GCC_GDP_NOIL); outward remittances from the GCC (GCC_REMIT); and the crude oil price (OIL), as a proxy for general financial wealth in the Gulf region.
Global market volatility or liquidity. Periods of higher volatility in global financial markets or lower global liquidity might render potential international depositors more reluctant to deposit funds in Lebanon. Conversely, periods of ample global liquidity might be correlated with high deposit growth in Lebanon. As proxies for global liquidity and volatility, we use the GDP deflator in the G7 (G7DEFL), the MSCI World Stock Market Index (MSCIWORLD), the Chicago Board Options Exchange Volatility Index (VIX), the Goldman Sachs Risk Aversion Index (RISKAVERS), the JP Morgan Emerging Market Sovereign Credit Quality Index (EMCREDQ), and median emerging market credit growth to the private sector (EMPSCREDG).
Due to the non-stationarity of all variables (Appendix), we employ a cointegration framework by estimating vector error correction models (VECMs) that aim to capture any long-run relationships between the time series, along with corresponding short-term dynamics. We perform Johansen cointegration tests to determine the presence and number of cointegrating relationships, and sequential modified LR tests to determine the appropriate lag structure for the short-term dynamics.
We start by using the variables of a money-demand-type specification, using exclusively domestic factors (coincident indicator, CPI, and interest rate differential). However, we are unable to establish a robust cointegrating relationship, pointing to that fact that domestic

7
factors alone cannot explain the demand for deposits.4 We then add one by one the additional variables described above. Table 1 presents a number of VECM specifications in which cointegration was found (see also Figures 1 and 2 for graphical representations of the regression fits). Specification I uses the above-mentioned domestic variables plus advanced economy industrial production. Trace and maximum eigenvalue tests point to one cointegrating vector. Solving the cointegrating vector for the deposit variable, all coefficients show the expected signs: higher economic activity as measured by the coincident indicator, a higher LL-$ interest differential, an increase in consumer prices, and a rise in advanced economy industrial production all tend to be associated with stronger deposit growth. Moreover, the specification shows a reasonably fast error correction: close to 20 percent of the deviation from the long-run equilibrium is corrected within one quarter. Some variables proxying the availability of funds from the Gulf region also show reasonable specifications. Specifications II – V add, in turn, GCC real and non-oil GDP, crude oil prices, and outward remittances from the GCC. The significance of the GCC GDP coefficient (specification II) is somewhat higher than the one on GCC non-oil GDP (specification III), though in both cases the coincident indicator coefficient shows the wrong sign and becomes insignificant, and the significance of the interest differential is reduced. Including crude oil prices (specification IV) also renders the coincident indicator insignificant (though it retains the expected positive coefficient). It thus appears that controlling for the external factors GCC GDP growth or crude oil prices renders the coefficient of the coincident indicator insignificant, perhaps in part due to multicollinearity among the variables. The coefficient on GCC outward remittances (specification V) shows the anticipated sign but is not significant. At between 8 and 12 percent, the error correction coefficients in specifications II – V are substantially lower than in specification I. Among the variables measuring Lebanon-specific risk or international liquidity and risk aversion, we find a reasonable specification only for the Goldman Sachs Risk Aversion Index (specification VI). In this specification, all variables show the expected sign, though at 6 percent per quarter, the error correction mechanism is relatively slow. For other variables, including the VIX, the MSCI World Stock Index, the G7 GDP deflator, emerging market private sector credit growth, and the JP Morgan emerging market credit quality index, no reasonable VECM could be established. Similarly, inclusion of the four ICRG risk ratings for Lebanon did not yield promising results. Having identified a number of domestic and external variables that help explain deposit demand, we ask which of the two groups of variables appears to have a larger impact on deposits. To answer this question, we employ both impulse response functions and variance decomposition techniques (utilizing the standard Choleski decomposition).
4 In addition, the sample period could have been subject to some structural breaks especially in the beginning of the post- civil war period and during specific crisis moments such as the Hariri assassination (2005) and the war with Israel (2006).

8
Cointegrating vector solved for: Deposits (LDEPOSITS_SA), Quarterly data, 1993-2008 1/
I II III IV V VI
Coincident indicator (LCI_SA) 0.419 -0.373 -0.457 0.158 0.749 0.8851.692 -0.942 -0.971 0.281 1.867 2.872
Interest differential (DEPATTRACT) 0.035 0.015 0.013 0.023 0.012 0.0152.882 1.325 1.047 1.539 0.800 1.233
Consumer prices (LCPI_SA) 0.762 2.236 2.151 2.352 2.257 2.7032.450 7.845 6.021 5.387 5.719 8.794
Adv. Econ. Ind. Prod. (LADVECONIP_SA) 3.3402.836
Real GDP in GCC (LGCC_GDP_SA) 1.1303.393
Real non-oil GDP in GCC (LGCC_GDP_NOIL_SA) 1.2021.681
Crude oil price (LOIL) 0.3293.040
GCC outward remittances (LGCC_REMIT_SA) 0.1590.656
GS Risk Aversion Index (RISKAVERS) -0.028-2.068
@TREND(90Q1) 0.010 -0.005 0.001
C -10.714 -2.476 -1.659 -2.059 -3.870 -5.950
ECM coefficient (CointEq1) -0.198 -0.118 -0.109 -0.079 -0.080 -0.060-5.138 -7.231 -6.194 -5.060 -4.837 -3.653
Lag structure 2 2 2 1 1 2
Adj. R2 0.59 0.63 0.60 0.48 0.47 0.49
Cointegration Tests (number of cointegrating equations) 2/Trace Test 1 2 2 1 1 1Maximum Eigenvalue Test 1 1 1 0 1 1
1/ T-statistics in italics.2/ At the 5 percent level.
Table 1. Lebanon: VECMs for Deposit Demand
9
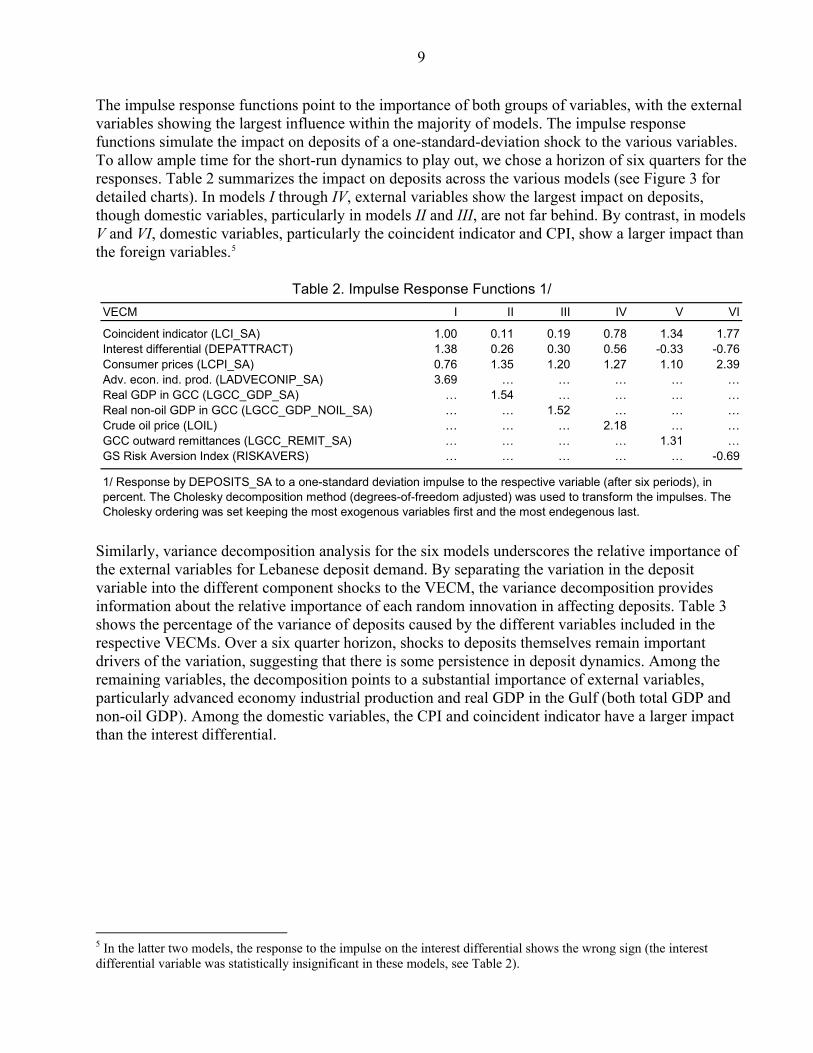
The impulse response functions point to the importance of both groups of variables, with the external variables showing the largest influence within the majority of models. The impulse response functions simulate the impact on deposits of a one-standard-deviation shock to the various variables. To allow ample time for the short-run dynamics to play out, we chose a horizon of six quarters for the responses. Table 2 summarizes the impact on deposits across the various models (see Figure 3 for detailed charts). In models I through IV, external variables show the largest impact on deposits, though domestic variables, particularly in models II and III, are not far behind. By contrast, in models V and VI, domestic variables, particularly the coincident indicator and CPI, show a larger impact than the foreign variables.5
VECM I II III IV V VI
Coincident indicator (LCI_SA) 1.00 0.11 0.19 0.78 1.34 1.77Interest differential (DEPATTRACT) 1.38 0.26 0.30 0.56 -0.33 -0.76Consumer prices (LCPI_SA) 0.76 1.35 1.20 1.27 1.10 2.39Adv. econ. ind. prod. (LADVECONIP_SA) 3.69 … … … … …Real GDP in GCC (LGCC_GDP_SA) … 1.54 … … … …Real non-oil GDP in GCC (LGCC_GDP_NOIL_SA) … … 1.52 … … …Crude oil price (LOIL) … … … 2.18 … …GCC outward remittances (LGCC_REMIT_SA) … … … … 1.31 …GS Risk Aversion Index (RISKAVERS) … … … … … -0.69
Table 2. Impulse Response Functions 1/
1/ Response by DEPOSITS_SA to a one-standard deviation impulse to the respective variable (after six periods), in percent. The Cholesky decomposition method (degrees-of-freedom adjusted) was used to transform the impulses. The Cholesky ordering was set keeping the most exogenous variables first and the most endegenous last.
Similarly, variance decomposition analysis for the six models underscores the relative importance of the external variables for Lebanese deposit demand. By separating the variation in the deposit variable into the different component shocks to the VECM, the variance decomposition provides information about the relative importance of each random innovation in affecting deposits. Table 3 shows the percentage of the variance of deposits caused by the different variables included in the respective VECMs. Over a six quarter horizon, shocks to deposits themselves remain important drivers of the variation, suggesting that there is some persistence in deposit dynamics. Among the remaining variables, the decomposition points to a substantial importance of external variables, particularly advanced economy industrial production and real GDP in the Gulf (both total GDP and non-oil GDP). Among the domestic variables, the CPI and coincident indicator have a larger impact than the interest differential.
5 In the latter two models, the response to the impulse on the interest differential shows the wrong sign (the interest differential variable was statistically insignificant in these models, see Table 2).

10
VECM I II III IV V VI
Deposits (LDEPOSITS_SA) 11.23 20.71 27.51 42.66 42.75 13.85Coincident indicator (LCI_SA) 11.85 5.91 9.53 10.82 25.35 32.82Interest differential (DEPATTRACT) 7.63 3.49 4.27 3.03 5.89 13.08Consumer prices (LCPI_SA) 2.46 23.07 19.09 9.34 9.14 37.52Adv. econ. ind. prod. (LADVECONIP_SA) 66.83 … … … … …Real GDP in GCC (LGCC_GDP_SA) … 46.82 … … … …Real non-oil GDP in GCC (LGCC_GDP_NOIL_SA) … … 39.60 … … …Crude oil price (LOIL) … … … 34.15 … …GCC outward remittances (LGCC_REMIT_SA) … … … … 16.89GS Risk Aversion Index (RISKAVERS) … … … … … 2
1/ Percent of variance in LDEPOSITS_SA after six periods due to variables included in the VECM.
Table 3. Lebanon: Variance Decomposition 1/
….73
IV. BANK-SPECIFIC FACTORS
In addition to the macroeconomic factors explored in the previous section, bank-specific factors may play an important role in explaining the demand for deposits at the bank level. In this section, we thus attempt to explain bank deposit growth using a number of bank-specific variables, controlling for the domestic and external macroeconomic factors used in the previous analysis. This approach allows us to employ detailed bank-by-bank data and take advantage of cross-sectional differences among the banks operating in Lebanon. It is hypothesized that both bank-specific as well as overall macroeconomic factors play a role. The academic literature typically focuses on the determinants of bank interest spreads (see e.g., Demirgüç-Kunt and Huizinga, 1999; Brock and Rojas-Suarez, 2000; or Beck and Hesse, 2009), while empirical studies on the determinants of deposit growth in banking systems with large deposit inflows from expatriates are very scarce. We estimate a number of panel regressions on annual data between 1997 and 2007 for over 50 banks operating in Lebanon, where the dependent variable, bank deposit growth, is a function of bank-specific factors as well as domestic and external macroeconomic variables.6 We mainly use fixed effects estimations to account for any time-invariant unobserved characteristics. As a robustness estimation, we adopt the robust estimation technique, which assigns, through an iterative process, lower weights to observations with large residuals, making the estimation less sensitive to outliers (Beck and Hesse, 2009).7 8 To avoid possible endogeneity, all bank-specific variables are lagged. Balance sheet and income statement information on commercial banks in Lebanon are obtained from BankScope. As expected, the bank data is very heterogeneous, comprising consolidated and unconsolidated data, and different years of coverage.9
6 In case of mergers, we treat the original two banks and the resulting banks as three separate financial institutions. 7 Specifically, the robust estimation technique initially eliminates gross outliers based on Cook's distance exceeding the threshold of one. Through an iterative process, weights are calculated based on the absolute residuals, and the model is regressed against those weights. The iterations continue until the maximum change in weights drops below a pre-specified tolerance level. 8 We did not estimate dynamic panel models using GMM for this study given the heterogeneity of the 50 banks in the sample.
9 Consolidated balance sheet and income statement data is used when available, but when consolidated data is not available for a bank, unconsolidated data is used instead. In addition, some obvious outliers are eliminated.

11
Our dataset comprises a number of bank-specific explanatory variables: Perceived riskiness of the bank (proxied by the z-score). The z-score is inversely related to
the probability of a bank’s insolvency, that is the probability that the value of its assets becomes lower than the value of the debt (see e.g., Boyd and Runkle, 1993; De Nicoló, 2000; and Hesse and Cihák, 2007). It can be summarized as z=(k+μ)/σ, where k is equity capital and reserves as percent of assets, μ is average return as percent of assets, and σ is standard deviation of return on assets as a proxy for return volatility. The z-score measures the number of standard deviations a return realization has to fall in order to deplete equity, under the assumption of normality of banks’ returns. A higher z-score hence corresponds to a lower probability of insolvency risk, and would thus be expected to be associated with an ability for the bank to attract, ceteris paribus, deposits more easily.
Profitability (measured by the return on equity, ROE, and the net interest margin). Similarly, higher bank profits would tend to signal increased bank soundness, which could make it easier for these banks to attract deposits.
Size of the bank (total assets in USD billion). 10 A smaller bank has to generate less deposits in absolute terms to achieve the same deposit growth than a large bank, thus possibly favoring smaller banks in achieving higher deposit growth. But a larger bank with economies of scale as well as larger branch network might be able to better attract deposits, so a priori, the sign of the coefficient is not certain.
Degree of financial intermediation (proxied by the loans-to-assets ratio). A higher degree of intermediation may signal a bank’s success in generating income as well as a need for it to attract more deposits to support its increased lending activities.
Liquidity buffers (measured by the ratio of liquid assets to deposits). Higher liquidity buffers tend to signal greater bank soundness, which could be a factor favoring deposit demand.
Macroeconomic controls. In line with the analysis in the previous section, we include the interest differential between the domestic deposit and the three-month U.S. Libor rate, the coincident indicator, industrial production in advanced economies, inflation, GDP in GCC countries, remittances outflows from the GCC, and oil prices. All macroeconomic factors are measured in annual growth rates.
The panel estimates underscore the statistical significance of a number of variables across specifications. Table 4 provides an overview of the main regression results, with column (1) showing a baseline Random Effects regression, and columns (2–6) listing some Fixed Effects models.11 Finally, column (7) illustrates the robust estimation technique.
10 In terms of market concentration, the four largest banks in Lebanon have 50 percent of the total assets.
11 In contrast to a Random Effects model, in a Fixed Effects specification, bank-specific constant terms are included in the regression equation.
12
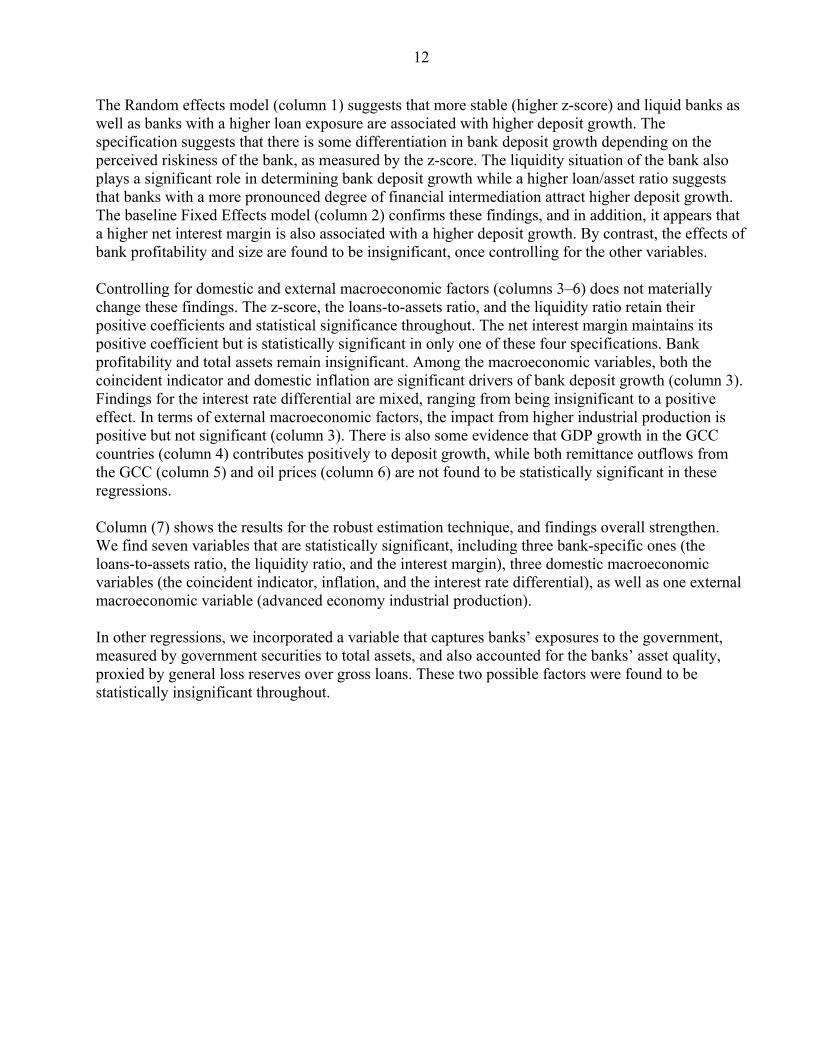
The Random effects model (column 1) suggests that more stable (higher z-score) and liquid banks as well as banks with a higher loan exposure are associated with higher deposit growth. The specification suggests that there is some differentiation in bank deposit growth depending on the perceived riskiness of the bank, as measured by the z-score. The liquidity situation of the bank also plays a significant role in determining bank deposit growth while a higher loan/asset ratio suggests that banks with a more pronounced degree of financial intermediation attract higher deposit growth. The baseline Fixed Effects model (column 2) confirms these findings, and in addition, it appears that a higher net interest margin is also associated with a higher deposit growth. By contrast, the effects of bank profitability and size are found to be insignificant, once controlling for the other variables. Controlling for domestic and external macroeconomic factors (columns 3–6) does not materially change these findings. The z-score, the loans-to-assets ratio, and the liquidity ratio retain their positive coefficients and statistical significance throughout. The net interest margin maintains its positive coefficient but is statistically significant in only one of these four specifications. Bank profitability and total assets remain insignificant. Among the macroeconomic variables, both the coincident indicator and domestic inflation are significant drivers of bank deposit growth (column 3). Findings for the interest rate differential are mixed, ranging from being insignificant to a positive effect. In terms of external macroeconomic factors, the impact from higher industrial production is positive but not significant (column 3). There is also some evidence that GDP growth in the GCC countries (column 4) contributes positively to deposit growth, while both remittance outflows from the GCC (column 5) and oil prices (column 6) are not found to be statistically significant in these regressions. Column (7) shows the results for the robust estimation technique, and findings overall strengthen. We find seven variables that are statistically significant, including three bank-specific ones (the loans-to-assets ratio, the liquidity ratio, and the interest margin), three domestic macroeconomic variables (the coincident indicator, inflation, and the interest rate differential), as well as one external macroeconomic variable (advanced economy industrial production). In other regressions, we incorporated a variable that captures banks’ exposures to the government, measured by government securities to total assets, and also accounted for the banks’ asset quality, proxied by general loss reserves over gross loans. These two possible factors were found to be statistically insignificant throughout.

13
(1) (2) (3) (4) (5) (6) (7)
Dependent Variable: Bank Deposit Growth
Profitability (-1) 0.017 0.007 -0.005 -0.006 -0.006 -0.007 0.019(0.498) (0.791) (0.832) (0.824) (0.806) (0.771) (0.186)
Z-Score (-1) 0.003 0.004 0.004 0.004 0.004 0.004 0.001(0.011)** (0.039)** (0.073)* (0.070)* (0.069)* (0.087)* (0.144)
Assets (-1) -0.004 -0.014 -0.013 -0.016 -0.013 -0.011 0.004(0.534) (0.137) (0.177) (0.089)* (0.229) (0.257) (0.222)
Loans/ Assets (-1) 0.524 0.682 0.891 0.926 0.894 0.875 0.14(0.000)*** (0.000)*** (0.000)*** (0.000)*** (0.000)*** (0.000)*** (0.029)**
Liquidity (-1) 0.332 0.571 0.576 0.592 0.576 0.572 0.096(0.000)*** (0.000)*** (0.000)*** (0.000)*** (0.000)*** (0.000)*** (0.003)***
Net Interest Rate Margin (-1) 0.007 0.022 0.012 0.017 0.012 0.012 0.008(0.230) (0.005)*** (0.152) (0.035)** (0.183) (0.154) (0.011)**
Interest Rate Differential 0.016 0.071 -0.013 -0.08 0.089(0.846) (0.076)* (0.735) (0.209) (0.073)*
Inflation 0.01 0.012 0.011 0.005 0.01(0.004)*** (0.001)*** (0.003)*** (0.422) (0.000)***
Coincident Indicator 0.702 0.667 0.522 0.502(0.056)* (0.065)* (0.164) (0.027)**
Industrial Production in Adv. 0.421 1.553(0.697) (0.018)**
GDP in GCC 1.158(0.022)**
Remittances from GCC 0(0.919)
Crude Oil Prices -0.109(0.191)
Constant -0.341 -0.632 -0.7 -0.749 -0.69 -0.662 -0.105(0.000)*** (0.000)*** (0.000)*** (0.000)*** (0.000)*** (0.000)*** (0.013)**
Observations 357 357 357 357 357 357 357
Banks included 53 53 53 53 53 53
R-squared 0.234 0.268 0.272 0.268 0.272 0.2
Estimation RE FE FE FE FE FE Robust
Notes: p values in parentheses;* significant at 10 percent;** significant at 5 percent;*** significant at 1 percentRE stands for Random Effects; FE for Fixed Effects estimation and Robust for the Robust Estimation Technique. All bank-specific variables are in lags to avoid potential endogeneity while macroeconomic factors are in percentage changes.
Table 4. Lebanon: Panel Estimations for Deposit Growth at the Bank Level
Overall, the panel regressions hence indicate that both bank-specific as well as macroeconomic factors play a role in explaining bank deposit growth. This finding can be seen as complementary to the results of the macroeconomic approach presented in the previous section. A caveat of the bank-by-bank panel approach is that the underlying bank sample is very heterogeneous, so that the findings are not necessarily fully robust and should thus be seen as suggestive. Improved data on bank balance sheet and income statement information would be required to arrive at more consistent findings.

14
V. CONCLUSIONS
This paper has attempted to provide some empirical evidence on the drivers of commercial bank deposit demand in Lebanon, adopting both macroeconomic and microeconomic approaches. Recognizing the difficulties in establishing a single preferred model, especially in the presence of non-stationarity and cointegration, we have estimated a number of macroeconomic models including domestic factors such as economic activity, prices and interest rates, as well as external factors including the business cycle in advanced countries, the availability of funds from the GCC, and global financial market conditions. The study finds that both domestic and external variables are significant, and impulse response functions and variance decomposition analysis attach a relatively higher weight to the external factors. In addition, a series of panel regressions has pointed to the significance of a number of bank-specific factors, including the banks’ perceived riskiness, liquidity buffers, loan exposure and interest margins, in explaining deposit demand at the bank level while macroeconomic factors also play a role. The importance of external factors in explaining deposit demand underscores an important vulnerability in Lebanon. Having no influence over the external variables, a sufficiently adverse constellation of these factors might render the Lebanese banking system prone to a slowdown in deposit inflows that could substantially tighten financing conditions for government. This highlights the need for continued vigilance in macroeconomic and financial sector policies. Fiscal policy should be geared toward substantial adjustment, helping to reduce the large fiscal deficits and the debt-to-GDP ratio, thereby gradually eliminating the dependence of the Lebanese system on deposit inflows. In parallel, monetary policy should maintain a sufficient interest differential to the U.S. dollar to continue supporting deposit growth at comfortable rates. And financial sector policies should continue to focus on the soundness of the banking system, so that also the bank-specific factors can continue to support the attractiveness of deposits in Lebanon. In particular, policies geared towards encouraging individual banks’ stability and comfortable liquidity buffers while allowing for healthy interest rate margins will help banks attract deposits.

15
Figure 1. VECM Actual and Fitted, Models I–III
9.6
10.0
10.4
10.8
11.2
11.6
12.0
1994 1996 1998 2000 2002 2004 2006 2008
FIT1LDEPOSITS_SA
-.04
-.02
.00
.02
.04
.06
.08
.10
.12
1994 1996 1998 2000 2002 2004 2006 2008
FIT1D_LDEPOSITS_SA
9.6
10.0
10.4
10.8
11.2
11.6
12.0
1994 1996 1998 2000 2002 2004 2006 2008
FIT2LDEPOSITS_SA
-.04
-.02
.00
.02
.04
.06
.08
.10
.12
1994 1996 1998 2000 2002 2004 2006 2008
FIT2D_LDEPOSITS_SA
9.6
10.0
10.4
10.8
11.2
11.6
12.0
1994 1996 1998 2000 2002 2004 2006 2008
FIT3LDEPOSITS_SA
-.04
-.02
.00
.02
.04
.06
.08
.10
.12
1994 1996 1998 2000 2002 2004 2006 2008
FIT3D_LDEPOSITS_SA

16
Figure 2. VECM Actual and Fitted, Models IV–VI
9.6
10.0
10.4
10.8
11.2
11.6
12.0
1994 1996 1998 2000 2002 2004 2006 2008
FIT4LDEPOSITS_SA
-.04
-.02
.00
.02
.04
.06
.08
.10
.12
1994 1996 1998 2000 2002 2004 2006 2008
FIT4D_LDEPOSITS_SA
9.6
10.0
10.4
10.8
11.2
11.6
12.0
1994 1996 1998 2000 2002 2004 2006 2008
FIT5LDEPOSITS_SA
-.04
-.02
.00
.02
.04
.06
.08
.10
.12
1994 1996 1998 2000 2002 2004 2006 2008
FIT5D_LDEPOSITS_SA
9.6
10.0
10.4
10.8
11.2
11.6
12.0
1994 1996 1998 2000 2002 2004 2006 2008
FIT6LDEPOSITS_SA
-.04
-.02
.00
.02
.04
.06
.08
.10
.12
1994 1996 1998 2000 2002 2004 2006 2008
FIT6D_LDEPOSITS_SA

17
Figure 3. Impulse Response Functions
-.01
.00
.01
.02
.03
.04
1 2 3 4 5 6
LCI_SA DEPATTRACTLCPI_SA LADVECONIP_SA
VECM I
-.005
.000
.005
.010
.015
.020
1 2 3 4 5 6
LCI_SA DEPATTRACTLCPI_SA LGCC_GDP_SA
VECM II
-.008
-.004
.000
.004
.008
.012
.016
1 2 3 4 5 6
LCI_SA DEPATTRACTLCPI_SA LGCC_GDP_NOIL_SA
VECM III
-.010
-.005
.000
.005
.010
.015
.020
.025
1 2 3 4 5 6
LCI_SA DEPATTRACTLCPI_SA LOIL
VECM IV
-.010
-.005
.000
.005
.010
.015
1 2 3 4 5 6
LCI_SA DEPATTRACTLCPI_SA LGCC_REMIT_SA
VECM V
-.02
-.01
.00
.01
.02
.03
1 2 3 4 5 6
LCI_SA DEPATTRACTLCPI_SA RISKAVERS
VECM VI
18
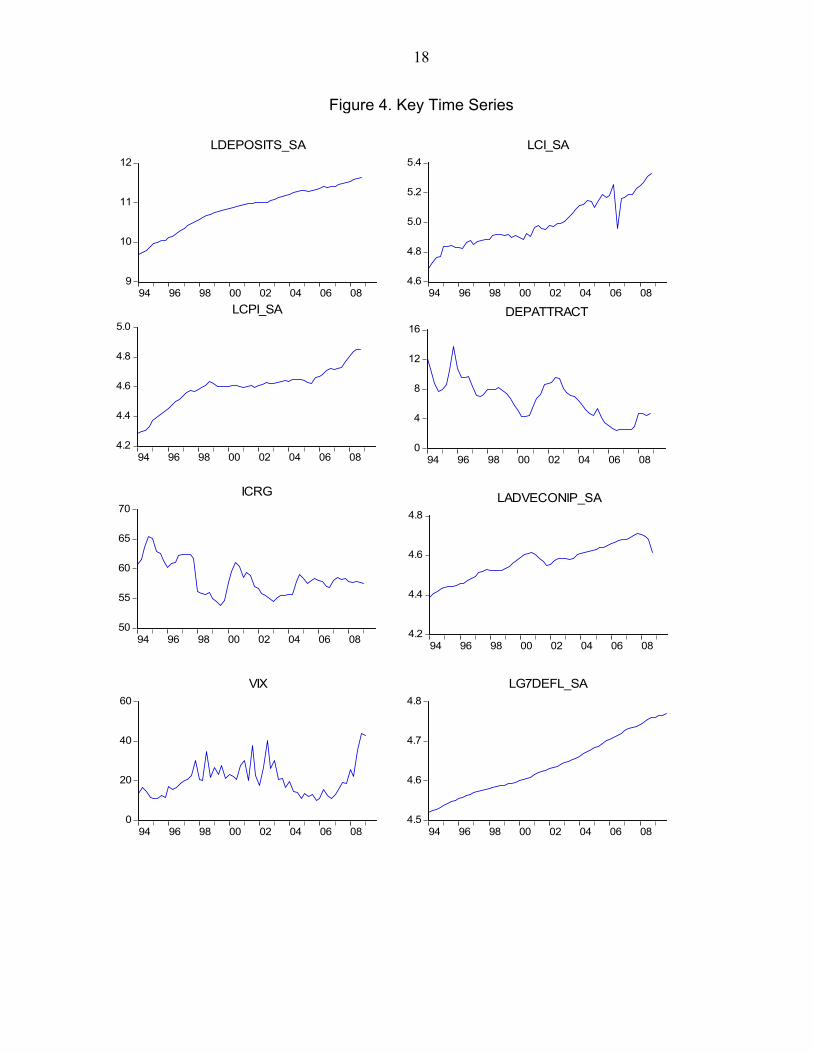
Figure 4. Key Time Series
9
10
11
12
94 96 98 00 02 04 06 08
LDEPOSITS_SA
4.6
4.8
5.0
5.2
5.4
94 96 98 00 02 04 06 08
LCI_SA
4.2
4.4
4.6
4.8
5.0
94 96 98 00 02 04 06 08
LCPI_SA
0
4
8
12
16
94 96 98 00 02 04 06 08
DEPATTRACT
50
55
60
65
70
94 96 98 00 02 04 06 08
ICRG
4.2
4.4
4.6
4.8
94 96 98 00 02 04 06 08
LADVECONIP_SA
0
20
40
60
94 96 98 00 02 04 06 08
VIX
4.5
4.6
4.7
4.8
94 96 98 00 02 04 06 08
LG7DEFL_SA

19
Figure 4. Key Time Series (concluded)
6.0
6.4
6.8
7.2
94 96 98 00 02 04 06 08
LMSCIWORLD
10
15
20
25
30
94 96 98 00 02 04 06 08
EMPSCREDG
-80
-40
0
40
80
94 96 98 00 02 04 06 08
EMCREDQ
0
5
10
15
20
94 96 98 00 02 04 06 08
RISKAVERS
4.0
4.2
4.4
4.6
4.8
94 96 98 00 02 04 06 08
LGCC_GDP_SA
3.6
4.0
4.4
4.8
94 96 98 00 02 04 06 08
LGCC_GDP_NOIL_SA
3.0
3.2
3.4
3.6
3.8
94 96 98 00 02 04 06 08
LGCC_REMIT_SA
2
3
4
5
94 96 98 00 02 04 06 08
LOIL_SA

20
Appendix: Macroeconomic Dataset—Unit Root Tests
Unit root tests point to the non-stationarity of all variables in the macroeconomic dataset (Table A1). The majority of variables appear integrated of order 1 (I(1)), while the tests would point to I(2) in advanced economy industrial production, the G7 GDP deflator, and real non-oil GDP in the GCC. However, the economic rationale would suggest that these variables are I(1) nonetheless (i.e. that quarterly percent changes in these variables are stationary) 12, and tests on longer samples of these variables might confirm this. The emerging market credit quality index appears I(1) in the ADF test but I(0) in the Phillips-Perron test.
Table A1. Unit Root Tests
VariableLevel First diff. Level First diff.
Deposits (LDEPOSITS_SA) 2.67 -1.96 * 6.18 -3.08 *
Coincident indicator (LCI_SA) 3.22 -11.99 * 2.75 -11.80 *Consumer Prices (LCPI_SA) 2.41 -3.63 * 3.60 -3.55 *Interest differential (DEPATTRACT)
ICRG Composite Risk (ICRG) -0.30 -5.63 * -0.32 -5.57 *ICRG Economic Risk (ICRG_E) -0.41 -6.65 * -0.40 -6.66 *ICRG Financial Risk (ICRG_F) -0.39 -6.61 * -0.38 -6.62 *ICRG Political Risk (ICRG_P) -0.11 -6.40 * -0.11 -6.40 *
Adv. Econ. Ind. Prod. (LADVECONIP_SA) -0.64 -0.74 1.71 -1.46
CBOE Volatility Index (VIX) 0.53 -12.00 * 0.34 -12.55 *G7 GDP deflator (LG7DEFL_SA) 1.73 -0.70 14.87 -1.24MSCI World Stock Index (LMSCIWORLD) 0.32 -6.98 * 0.24 -7.14 *Emerging Market Private Sector Credit Growth (EMPSCREDG) -0.62 -5.36 * -0.62 -5.35 *JP Morgan EM Credit Quality (EMCREDQ) -1.81 -4.52 * -1.99 * …Goldman Sachs Risk Aversion Index (RISKAVERS) 1.35 -4.07 * 1.85 -3.97 *
Real GDP in GCC (LGCC_GDP_SA) 4.02 -1.96 * 5.68 -3.33 *Real non-oil GDP in GCC (LGCC_GDP_NOIL_SA) 2.36 -0.19 10.29 -0.87GCC outward remittances (LGCC_REMIT_SA) 2.04 -3.24 * 2.32 -5.04 *Crude Oil Price (LOIL_SA) 0.48 -5.01 * 0.58 -5.03 *
* Rejection of the null hypothesis of existence of a unit root at the 5 percent level.
ADF statistic Phillips-Perron statistic
12 These variables were transformed into logs, so that first differences proxy quarterly percent changes.

21
REFERENCES
Beck, Thorsten, and Heiko Hesse, 2009, “Why Are Interest Spreads So High in Uganda?,” Journal of Development Economics, Vol. 88 (March), pp. 192–204.
Boyd, John H., and David E. Runkle, 1993, “Size and Performance of Banking Firms: Testing the Predictions of Theory,” Journal of Monetary Economics, Vol. 31 (February), pp. 47–67.
Brock, Philip Lawton, and Liliana Rojas-Suárez, 2000, “Understanding the Behavior of Bank Spreads in Latin America,” Journal of Development Economics, Vo. 63 (October), pp. 113–134.
Demirgüç-Kunt, Asli, and Harry Huizinga, 1999, “Determinants of Commercial Bank Interest Margins and Profitability: Some International Evidence,” World Bank Economic Review, Vol. 13 (May), pp. 379–408.
De Nicoló, Gianni., 2000, “Size, Charter Value and Risk in Banking: An International Perspective,” International Finance Discussion Papers No. 689 (United States: Board of Governors of the Federal Reserve System, International Finance Division).
Eken, Sena, and Thomas Helbling, 1999, “Back to the Future: Postwar Reconstruction and Stabilization in Lebanon,” IMF Occasional Paper No. 176 (Washington: International Monetary Fund).
Finger, Harald, and Mauro Mecagni, 2007, “Sovereign Debt Restructuring and Debt Sustainability: An Analysis of Recent Cross-Country Experience,” IMF Occasional Paper No. 255 (Washington: International Monetary Fund).
Hesse, Heiko, and Martin Cihák, 2007, “Cooperative Banks and Financial Stability,” IMF Working Paper 07/2, (Washington: International Monetary Fund).
Johansen, Soren, 1991, “Estimation and Hypothesis Testing of Cointegration Vectors in Gaussian Vector Autoregressive Models,” Econometrica, Vol. 59 (November), pp. 1551–80.
Johansen, Soren, and Katarina Juselius,1990, “Maximum Likelihood Estimation and Inference on Cointegration, with Applications to the Demand for Money,” Oxford Bulletin of Economics and Statistics, Vol. 52 (May), pp. 169–210.
Poddar, Tushar, and others, 2006, “Interest Rate Determination in Lebanon,” IMF Working Paper 06/94 (Washington: International Monetary Fund).
Schimmelpfennig, Axel, and Edward Gardner, 2008, “Lebanon—Weathering the Perfect Storms,” IMF Working Paper 08/17 (Washington: International Monetary Fund).