Lebanon Electricity Sector Main Findings from the World...
32
Anna Bjerde Lead Energy Specialist The World Bank Beirut September 16, 2008 Lebanon Electricity Sector Main Findings from the World Bank’s Public Expenditure Review (PER)
Transcript of Lebanon Electricity Sector Main Findings from the World...

Anna BjerdeLead Energy Specialist
The World BankBeirut
September 16, 2008
Lebanon Electricity Sector
Main Findings from the World Bank’s Public Expenditure Review (PER)

OutlineOutline
• Global energy perspective.• Overview of issues facing the Lebanese power
sector.• Benchmark with international electricity sector
performance.• Key recommendations to improve service and
reduce costs.
Global energy perspective

TodayToday’’s s Energy IssuesEnergy IssuesAre ComplexAre Complex
Hydro, Hydro, RenewablesRenewables, EE, EE Oil & Gas Oil & Gas
DevelopmentDevelopment
Energy AccessEnergy Access
UrbanizationUrbanization& Energy& Energy
Energy & Energy & Climate ChangeClimate Change
TechnologyTechnologyMacroeconomic & Macroeconomic &
Fiscal issuesFiscal issues
Regional Regional IntegrationIntegration
Indoor AirIndoor AirPollutionPollution
TransportTransport& Energy& Energy
Energy SecurityEnergy Security

Development of oil production capacity is forecast to decline
Source: PFC Energy Global Liquid Supply Forecast
0
20
40
60
80
100
120
1995 2000 2005 2010 2015 2020
Prod
uctio
n (m
mb/
d)
non-OPEC
OPEC
non-OPEC oil sands

0
20
40
60
80
100
120
1995 2000 2005 2010 2015 2020
Prod
uctio
n (m
mb/
d)Demand for oil will oustrip supply
non-OPEC
OPEC
non-OPEC oil sands
IEA Reference case 1.8% demand growth

Let’s turn to Gas: resource rich –production poor…
Social IndicatorFailed States Index
< 30.0
30.0 - 59.9
60.0 - 89.9
> 90.0
Not Available
Energy IndicatorOil/Gas Discovery/Development
!
Refinery
!( LNG Plant Project
Environmental IndicatorConservation Region (G200)
ALGERIA
MAURITANIA
UK
NIGERIA
ANGOLA
GABON
E. GUINEA
CONGO-Brazzaville
CHADSUDAN
LIBYAEGYPT
RUSSIA
AZERBAIJANTURKMENISTAN
CANADA
UNITED STATES
MEXICO
TRINIDAD & TOBAGO
COLOMBIA
ECUADOR
PERU
VENEZUELA
BRAZILBOLIVIA
ARGENTINA
NORWAY
KAZAKHSTAN
CHINA
INDIA
BANGLADESH
THAILANDVIETNAM
MALAYSIA
INDONESIA
AUSTRALIA
SYRIAIRAQ
KUWAIT
IRAN
QATAR
SAUDI ARABIA
UAE
OMAN
YEMEN

Carbon emissions have grown as energy supply and use has evolved
0
1000
2000
3000
4000
5000
6000
7000
8000
9000
1840 1860 1880 1900 1920 1940 1960 1980 2000
mm
tonn
es C
solid fuels liquid fuels gas fuels cement prod gas flaringSource: US Department of Energy Carbon Dioxide Information Analysis Center
Global Fossil Fuel Carbon Emissions by Source Since 1840

Historical energy R & D trends
The R&D effort was more centralized and concentrated, including a significant focus on nuclear technologies
R&D Spending: IEA Countries
0
2
4
6
8
10
12
14
16
18
20
1974 1978 1982 1986 1990 1994 1998 2002 2006
$ b n
0
10
20
30
40
50
60
70
80
90
100$/b b l
Energy Efficiency Foss il Fuels RenewablesNuclear Fiss ion & Fuss ion Hydrogen & Fuel Cells Other Power & StorageOther Research Oil Price (Right)
Source: IEA

Tota
l R&
D S
pend
ing
(US
$m
illion
)
(US
$m
illio
n)
What is wrong with R&D? Not enough!
Source: PFC Energy 50
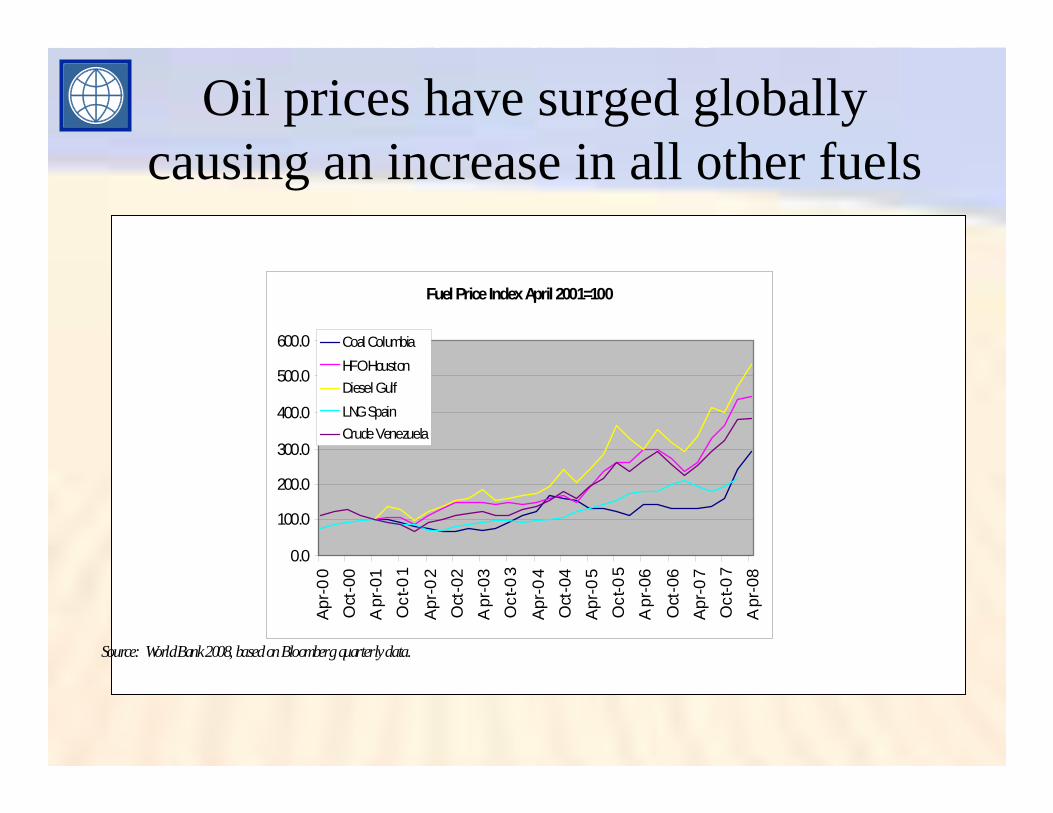
Oil prices have surged globally causing an increase in all other fuels
Fuel Price Index April 2001=100
0.0
100.0
200.0
300.0
400.0
500.0
600.0A
pr-0
0O
ct-0
0A
pr-0
1O
ct-0
1
Apr
-02
Oct
-02
Apr
-03
Oct
-03
Apr
-04
Oct
-04
Apr
-05
Oct
-05
Apr
-06
Oct
-06
Apr
-07
Oct
-07
Apr
-08
Coal ColumbiaHFO HoustonDiesel GulfLNG SpainCrude Venezuela
Source: World Bank 2008, based on Bloomberg quarterly data.

Source: IEA WEO 2007
Natural gas and coal costs less than oil with the exception of some hikes in LNG
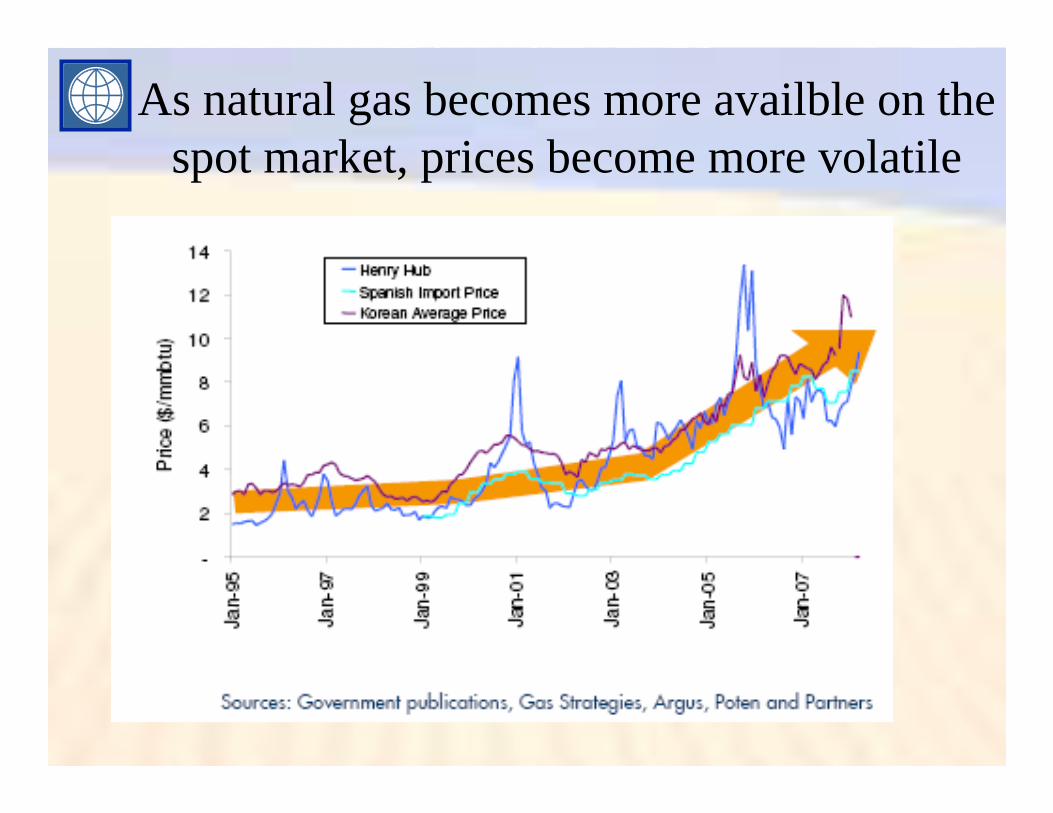
As natural gas becomes more availble on the spot market, prices become more volatile

Pros and cons with fuel options• HFO/diesel:
– + security of supply, no additional inv. cost.– - exposed to high prices and volatility, environmental disadvantages, higher heat rate.– - High cost (diesel)
• LNG:– + Clean, lower heat rate, unit size flexible.– - Large capital costs, requires scale (600 MW+)– possibly availability concerns in short-medium term.
• Coal:– + security of supply, price competitive, non CO2 emission can be controlled.– + positive fiscal impact.– - CO2 emissions, perception issues, requires larger unit sizes to be economical.
• CNG:– + Available in smaller quantities at short distances, priced at par with LNG, limited
infrastructure required, transport and other uses. Unit size flexible– + positive fiscal impact– - Untested in the power sector to date, work underway to make shipping safe.
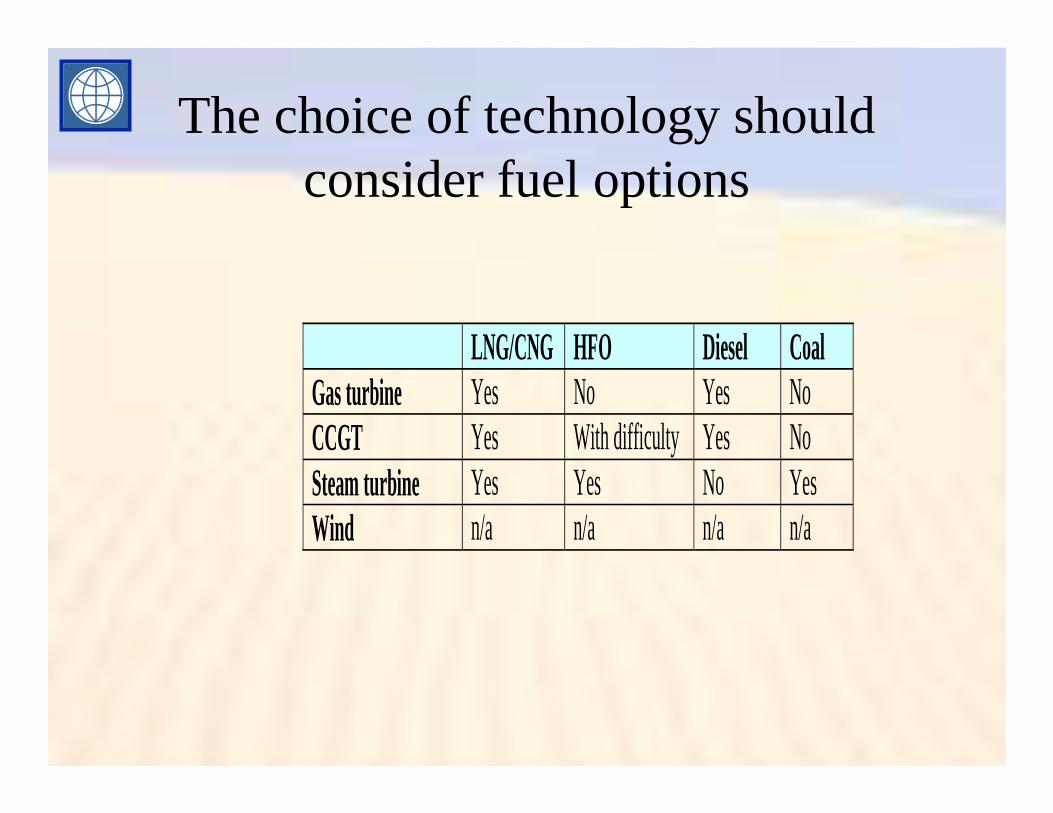
LNG/CNG HFO Diesel Coal Gas turbine Yes No Yes No CCGT Yes With difficulty Yes No Steam turbine Yes Yes No Yes Wind n/a n/a n/a n/a
The choice of technology should consider fuel options

Overview of issues facing the Lebanese power sector
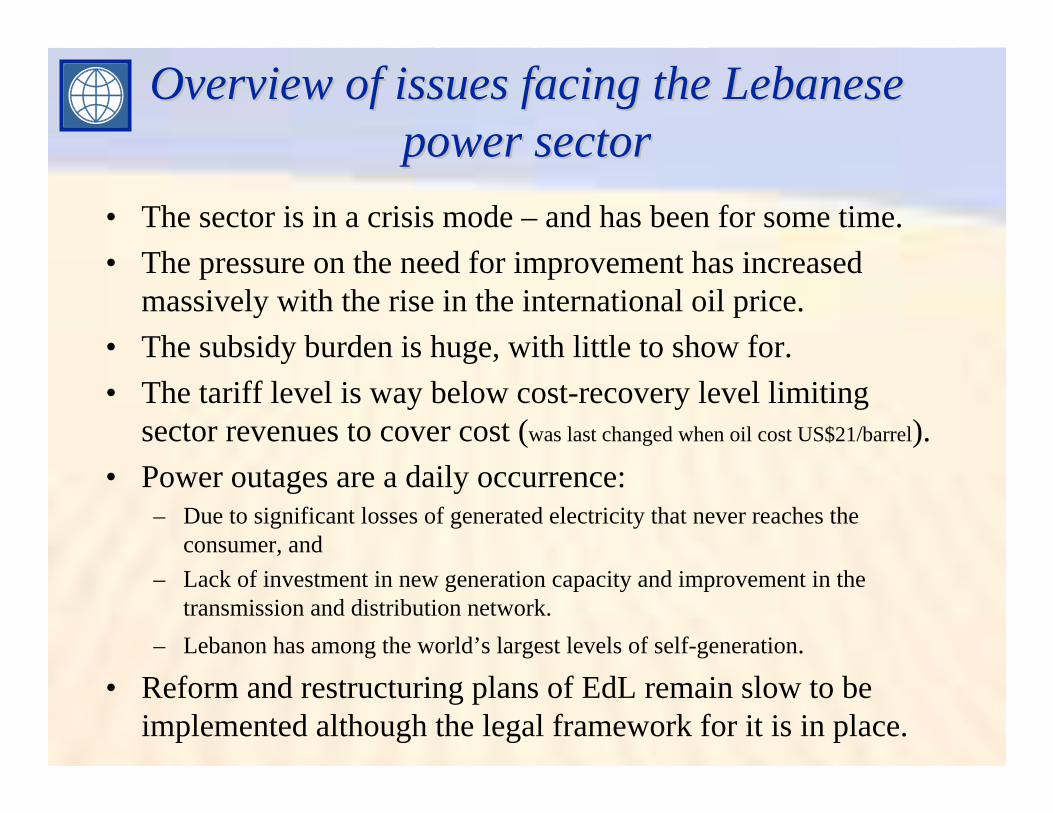
Overview of issues facing the Lebanese Overview of issues facing the Lebanese power sectorpower sector
• The sector is in a crisis mode – and has been for some time.• The pressure on the need for improvement has increased
massively with the rise in the international oil price.• The subsidy burden is huge, with little to show for.• The tariff level is way below cost-recovery level limiting
sector revenues to cover cost (was last changed when oil cost US$21/barrel).• Power outages are a daily occurrence:
– Due to significant losses of generated electricity that never reaches the consumer, and
– Lack of investment in new generation capacity and improvement in the transmission and distribution network.
– Lebanon has among the world’s largest levels of self-generation.
• Reform and restructuring plans of EdL remain slow to be implemented although the legal framework for it is in place.
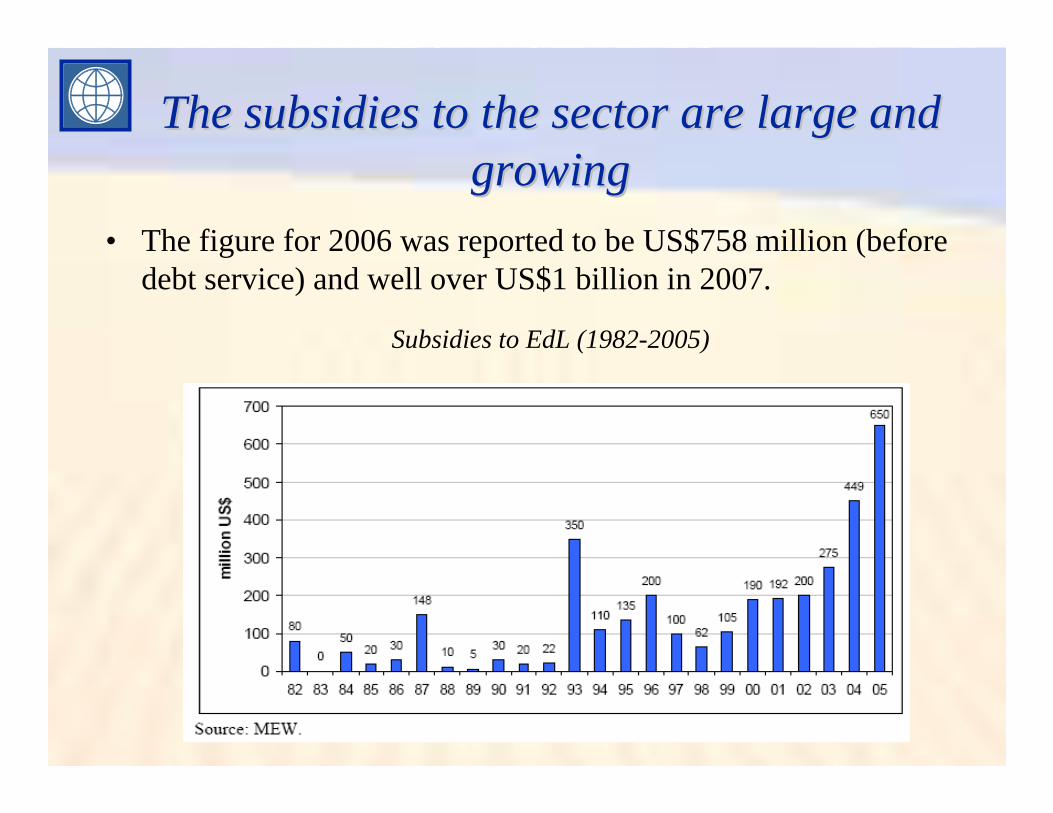
The subsidies to the sector are large and The subsidies to the sector are large and growing growing
• The figure for 2006 was reported to be US$758 million (before debt service) and well over US$1 billion in 2007.
Subsidies to EdL (1982-2005)

Lebanon is fuel import dependent and Lebanon is fuel import dependent and pays market prices for fuelpays market prices for fuel
• Fuel cost comprise close to 85% of operating cost at EdL.
Operating cost Amount (USD millions) % of total operating cost Fuel 1,095.4 83.3% Power Purchased 117.5 8.9% Wages 58.8 4.5% O&M 12.4 0.9% Other 31.5 2.4% Total 1,315.6 100%
EdLEdL is is unableunable to keep up with electricity to keep up with electricity demanddemand
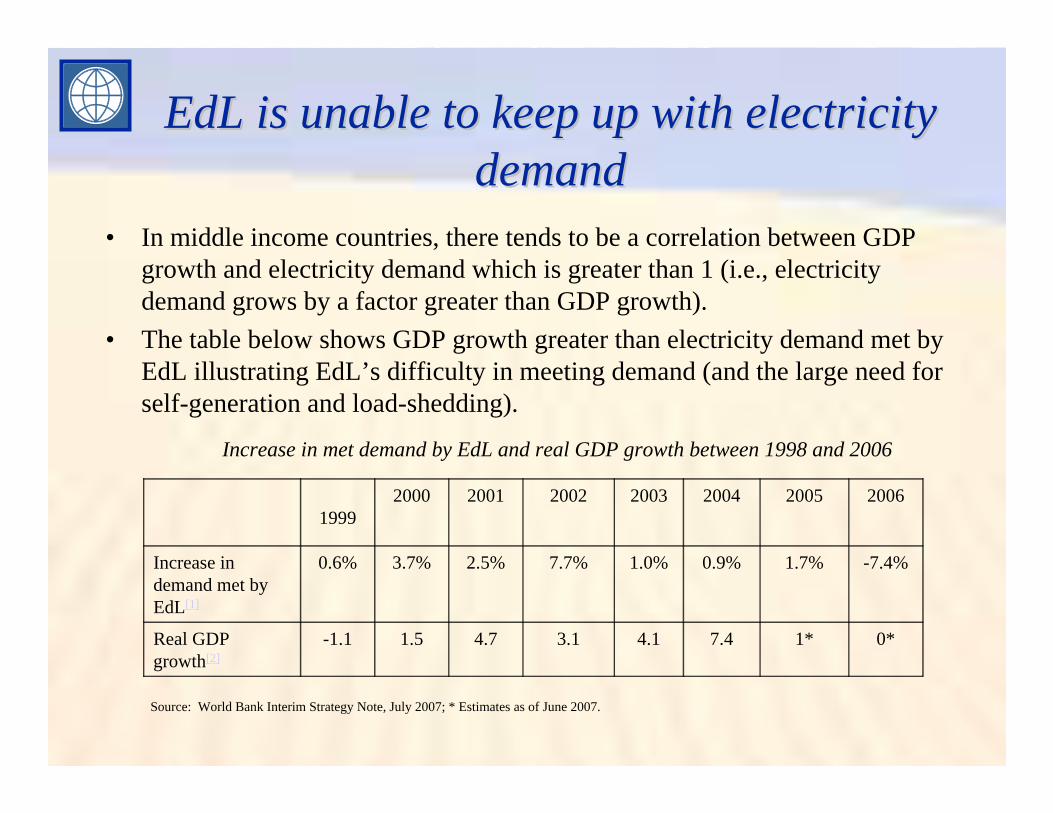
• In middle income countries, there tends to be a correlation between GDP growth and electricity demand which is greater than 1 (i.e., electricity demand grows by a factor greater than GDP growth).
• The table below shows GDP growth greater than electricity demand met by EdL illustrating EdL’s difficulty in meeting demand (and the large need for self-generation and load-shedding).
Increase in met demand by EdL and real GDP growth between 1998 and 2006
0*1*7.44.13.14.71.5-1.1Real GDP growth[2]
-7.4%1.7%0.9%1.0%7.7%2.5%3.7%0.6%Increase in demand met by EdL[1]
20062005200420032002200120001999
Source: World Bank Interim Strategy Note, July 2007; * Estimates as of June 2007.

LebanonLebanon’’s industry suffers the most in s industry suffers the most in the region from power failuresthe region from power failures
3.4 6.4 0.8 5.3 6.1 9.6 13.0
7.23
43.0
163.1
220.13
38.2
9.3 13.8
29.5
72.5
53.1
94.4
5.5 7.1 7.314.0 17.8 19.3
0
50
100
150
200
250
Saud i Arab ia
O m an M orocco Algeria Egypt Syria Yem en Lebanon
O utp ut losses (fo r f irm s with losses) (% o f sales ) F req uenc y o f powe r o utages (avg . d ays las t ye ar) H ave ow n genera to r (% )
Source: ICA study, 2006
There are also major inefficiencies in the There are also major inefficiencies in the sector and governance problemssector and governance problems
• In addition to technical losses (produced electricity that never reaches the consumer), there are major non-technical losses (theft):– This electricity has to be produced (and consumed) but does not generate
any revenue for EdL.– Some billed customers also do not pay for their consumption further
deteriorating the financial performance of EdL and increasing subsidy needs.
• EdL has a severe staffing problem with the average age approaching 60 years of age and difficulty recruiting and retaining staff (there is a hiring freeze in effect).
• Finally, it reports to both the MoEW and MoF slowing down decision-making and has a very low threshhold (in money terms) on which its Board can take decision.
• The regulatory authority is envisaged in the Law (passed in 2002) but to date no progress has been made on its establishment.
International Comparison
International benchmarkingInternational benchmarking• The performance of Lebanon’s power sector is very poor compared to
international standards:– Technical losses in well functioning utilities in developing countries ranges from 8-
10% (Lebanon = 15%).– Non-technical losses may range between 0-10% (Lebanon = 17%, reported to have
increased).• Cost recovery pricing, for example:
– Out of 44 countries in Sub-Saharan Africa 24 have fully or extensively passed fuel price increases in the retail prices.
– Partial adjustment in prices in 15 countries, and only no adjustment of prices in 5 countries.
• Back-up generation is mostly in industry and tourist dependent countries and used only in emergency mode (5-10% per year):
– In Lebanon, about 33% of electricity consumed is generated by self-generators.– This requires households to spend an extra 25% per year on electricity bills and the
economic loss to industry may be as high as US$360 million per year (see full report for details).

Key recommendations from the PER
The PER prepared by the World Bank made The PER prepared by the World Bank made recommendations in a few key areasrecommendations in a few key areas
• The recommendations focus on how to minimize public expenditure of the electricity sector and reduce overall government subsidies.
• How to meet electricity demand:– Several options were considered and analyzed and the PER recommends a
three-pronged approach: • Reduce losses as much as possible.• Rehabilitate Jieh and Zouk to extend their life-time.• Add new generation capacity, but analyze carefully the (fuel) options.
• Start a path for tariff adjustment:– Analyze options to reform the structure and level of tariffs.– Provide safety net for the poor.– Have a very comprehensive communications plan before/during the
adjustments.

Ensuring sufficient future generation Ensuring sufficient future generation capacitycapacity
• Reduction of losses:– The PER estimates that a reduction in technical losses from the current
estimated 15% to 10% would free up about 100 MW and avoid investment of about US$80-100 million, and increase the revenue base as the reduced power could be billed.
• Rehabilitation of Jieh and Zouk:– These two plants represent about half of power capacity installed in
Lebanon.– The World Bank estimates that they could run for another 10 years if
rehabilitated and then properly maintained.– The rate of return would be as high as 27% for Zouk, 20% for Jieh and
savings of around US$100 million per year as a result of more efficient fuel use, more of oil prices keep rising.

Ensuring sufficient future generation Ensuring sufficient future generation capacity (cont.)capacity (cont.)
• New generation capacity:– Lebanon has not added any new large-scale capacity in several years.– This is unusual for a sector of the size of Lebanon and with demand growth.
• This is due to a number of factors: plans to privatize EdL, lack of funds.• Meanwhile supply reliability from EdL has decreased and reliance on self-
generation has increased.
• The decision on type of technology for new generation capacity should be driven by a comprehensive fuel supply strategy:– That considers least cost, environment and energy security.
Piped Gas LNG HFO Diesel Coal CCGT Yes Yes No Yes No Steam Cycle
Yes Yes Yes No Yes

Ensuring sufficient future generation Ensuring sufficient future generation capacity (cont.)capacity (cont.)
• The PER analyses that large sized CCGT running natural gas to bemost economical and large sized CCGT running on diesel to be least economical (see PER report of full set of assumptions).
Fuel supply optionsFuel supply options
• The findings of the PER stresses the following:– Lebanon needs to be careful about locking itself into a
technology that has limited fuel options (CCGT).– CCGT runs efficiently on piped gas or LNG, but very
expensive if it uses diesel. It can’t operate on heavy fuel oil or coal.
• Coal has a perception problem. CO2 emissions is an issue. All non-CO2 emissions are controllable.
• Without reduction in losses in transmission and distribution any new generation project would be costly and wasteful.

• The current tariff was adjusted last in 1996.– Up to 500 kWh is priced quite low – this is probably too generous.
• The oil price was then US$21/barrel.• Much of industry self-generate during at peak period since the
tariff is 3 times what is charged during off peak period.– This reduces EdL’s revenue base and financial performance since
industry usually is a reliable consumer in payment terms.
• Bottom line is that the tariff is perceived high in relation to service provided but low in relation to cost.– The tariff adjustment and increase therefore needs to be in parallel to
system improvements and a communications campaign.– As well as targeted assistance to vulnerable consumers.
Tariff restructuring is neededTariff restructuring is needed

Thank You