Lease vs. Buy How to Choose - Office of the Under … (e.g., shop truck or tow truck). • Cost of...
28
Lease vs. Buy How to Choose Presenter Gary Hatfield, Mercury Associates
Transcript of Lease vs. Buy How to Choose - Office of the Under … (e.g., shop truck or tow truck). • Cost of...

Lease vs. Buy How to Choose
Presenter Gary Hatfield, Mercury Associates

Basics of Fleet Costs: Typical Dollar
Depreciation $.45
Maintenance & Repair
$.34
Fuel $.19
Indirect Costs $.02
What are the fixed costs? What are the variable costs?
FAST Reported Distribution Of Ownership Costs: Two Bureaus
Green = Depreciation; Purple = Fuel; Blue = Indirect Costs; Red = Maintenance Costs
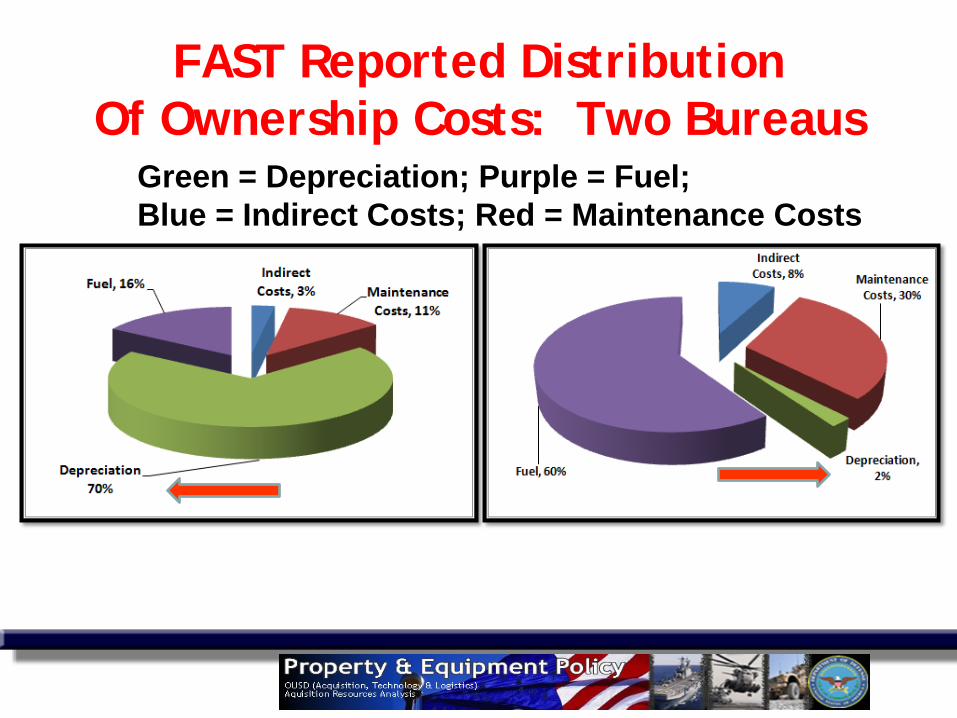
Depreciation Operating = Fuel + Maintenance
Total Cost of Ownership
Time/Usage
Cos
t Life Cycle Costs of a Vehicle
*
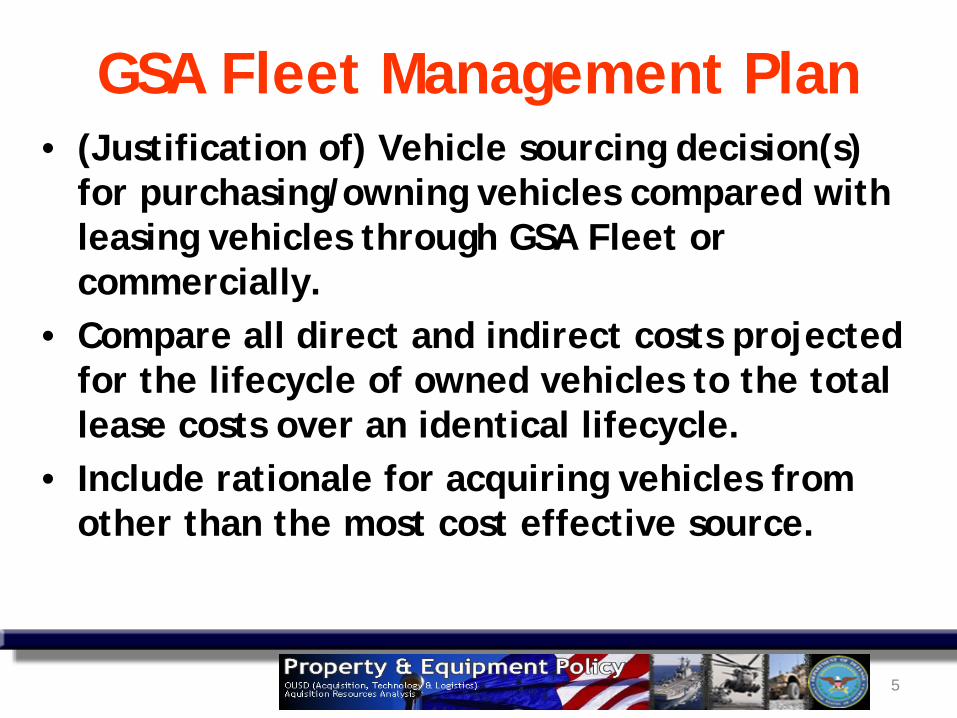
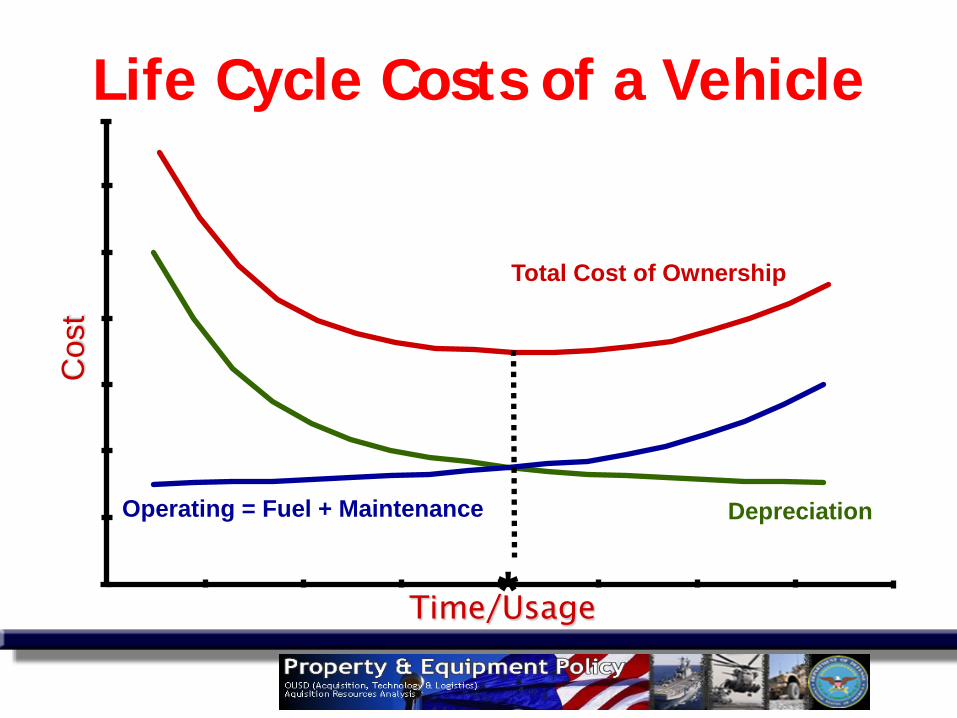
• (Justification of) Vehicle sourcing decision(s) for purchasing/owning vehicles compared with leasing vehicles through GSA Fleet or commercially.
• Compare all direct and indirect costs projected for the lifecycle of owned vehicles to the total lease costs over an identical lifecycle.
• Include rationale for acquiring vehicles from other than the most cost effective source.
GSA Fleet Management Plan
5

Reporting Depreciation • Must be reported for all owned vehicles in
the annual FAST submission for the Federal Fleet Report (FFR).
• Agencies must submit to GSA the information needed to produce the FFR.
• OMB requires agency Fleet Managers and budget officers to submit annual agency motor vehicle budgeting information through FAST (Circular A-11).

What are Direct Costs? • For Owned Vehicles:
– Depreciation – Fuel – Maintenance
• Labor, Parts, & Commercial Repairs
• For GSA Leased Vehicles: – Sum of Monthly Fixed Charge and Mileage
Charges, plus end-of-lease charges
7 7

Vehicle Cost Categories • Variable or Operating Costs
– Gasoline – Maintenance (oil) – Tires
• Capital or Fixed Costs – Depreciation
• Costs for Your Owned Vehicles: – Depreciation – Fuel – Maintenance
• Labor, Parts, & Commercial Repairs
• Costs for Your GSA Leased Vehicles: – Sum of Monthly Fixed Charge and Mileage Charges – End-of-lease charges
• Overlooked costs? – Upfitting – Replacement Tires – Others?

Depreciation Defined • For accounting
– A system (and process) of accounting methods that distributes (allocates) the cost of an asset, less salvage value (if any), over the estimated useful life of the asset.
• For replacement planning – The decline in value of assets. – The initial purchase price minus the current fair
market value (FMV). Note: Residual value -- another name for salvage value.
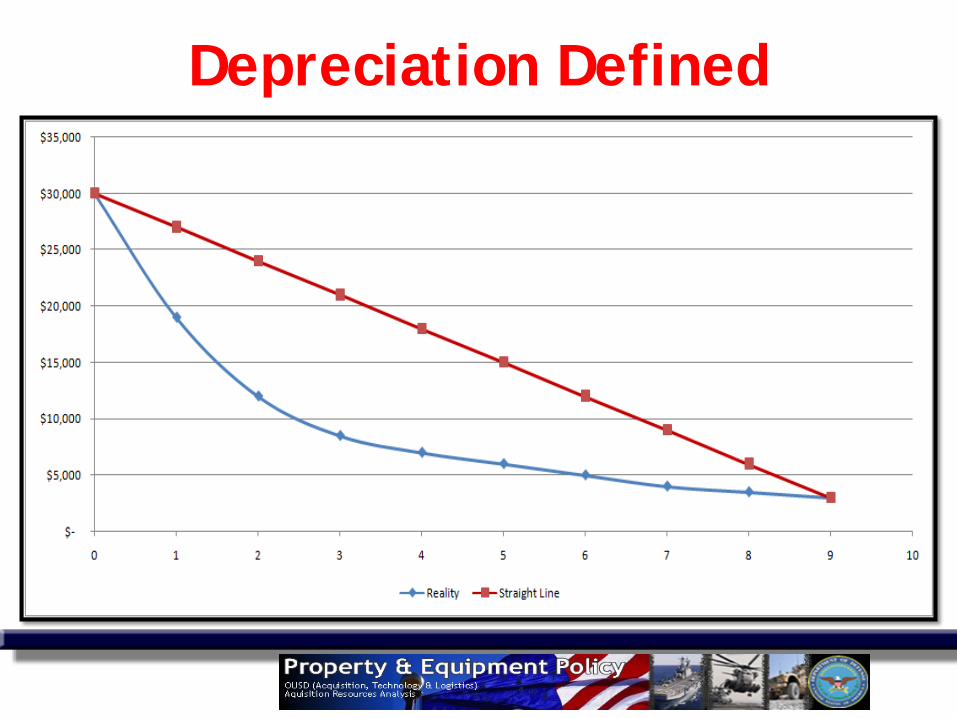
Depreciation Defined

Calculating FMV Depreciation • Total acquisition cost (plus upfitting), minus
the resale value, divided by the life (months or years); for example: – Purchase cost = $33,000 – Upfitting cost = $2,000 – Total cost = $35,000 – Resale proceeds = $3,000 – Life = 8 years – Depreciation = $35,000 - $3,000 = $32,000 ÷ 8 =
$4,000 per year
11 11

How to Report for FAST? • Problem: I don’t know the resale proceeds to
calculate depreciation until after the vehicle is sold; I don’t know the actual life of the vehicle
• Solution: Use reasonable estimates for resale proceeds and vehicle life at the time of purchase; for example: – Purchase cost = $33,000 (known) – Upfitting cost = $2,000 (known) – Total cost = $35,000 (known) – Resale proceeds = $35,000 x 10% = $3,500 (est.) – Life = 8 years (est.) – Depreciation = $35,000 - $3,500 = $31,500 ÷ 8 = $3,937
per year
• Use the FAST depreciation template
12 12

What are Indirect Costs? • Salaries and benefits, and other expenses of all fleet
management personnel. • Computer software, hardware, and support services and
administrative supplies and equipment. • The cost of vehicles and other equipment used for fleet
management (e.g., shop truck or tow truck). • Cost of temporary rented and leased motor vehicles. • Storage of motor vehicles at non-Government-owned locations
(such as for new-vehicle storage and disposal storage). • Improvements and repairs to Government-owned or leased real
property, such as offices and garages used for fleet management.
• Ancillary costs such as utilities and custodial services. • Servicing and repairing garage operating equipment (lifts, tools,
etc.) • Tort claims resulting from accidents involving fleet vehicles.
13 13

What if I don’t know Indirect Costs? • Estimate indirect costs for Owned vehicles by using
10% of total Direct fleet costs; for example: – Total annual direct cost of owned fleet = $50 million (7,000
vehs.) – Estimated indirect costs = $5 million
• Estimate indirect costs for Leased vehicles by using 1% of total Direct fleet costs; for example: – Total annual direct cost of leased fleet = $50 million (7,000
vehs.) – Estimated indirect costs = $500,000
• Note! These are just rough estimates and should not replace complete and accurate records of indirect costs where available.
14 14

15 15
What Agency Owned GSA Fleet
Vehicle Life Cycle Current Practice (non-optimized)
GSA Published Replacement Standards
Depreciation Net Capital Cost (Purchase Price less Resale value)
GSA Monthly Rate X Agency Life Cycle
Maintenance Agency Data (if complete and accurate) or estimate
GSA Mileage Rate (Rate also includes Fuel)
Fuel Agency Data (if complete and accurate) or estimate
based on MPG
Included in GSA Mileage Rate
Indirects and Overhead
Agency Data (if complete and accurate) or estimate 10% of Owned Amount

• Eliminates need for one-time significant cash outlay (Lease is “pay as you go”; Buy is “pay before you go”)
• Reduces fleet management/administration time (soft-dollar productivity improves)
• Typically eliminates need for government-operated garages for maintenance (commercial shops are most often used; however, government garages may be authorized for M&R of GSA Fleet vehicles)
GSA Leasing Pros
16

• Responsibility for the fleet management information system falls upon GSA and is included in the lease rate: – Which provides: data tracking; – report generation for fleet management purposes; – data quality for regulatory reporting (e.g., FAST).
• Replacement of vehicles occurs in a timely manner, which translates into: – Reduced vehicle downtime (newer vehicles means greater
reliability) – Translates into additional safety features which become available
on newer vehicles – Lower maintenance costs (older vehicles not replaced in a timely
manner demand more maintenance, mechanics, parts, etc.) – The agency can decrease or increase fleet size dependent upon the
mission with little effort or investment
GSA Leasing Pros
17

• Information systems not integrated with owned fleet • Many types of vehicles and equipment unavailable for
release • Mileage rate aggregates fuels and maintenance cost,
hiding detail cost components • Can be higher cost for certain vehicle types • Can be higher cost for low-utilization vehicles • Can be higher cost for rough service due to “refurbish”
cost at time of turn in • Not suitable for vehicles that require extensive
upfitting of special equipment and subsequent “de-commissioning” to remove special equipment before disposal
GSA Leasing Cons
18

• Can be lower cost for certain types of vehicles or vehicles that have low utilization
• Can retain vehicles for longer period of time than required by GSA Fleet (advantageous for low-utilization vehicles)
• Can be lower overall cost when life-cycle costing drives the replacement cycle and vehicles are replaced at the most cost-effective time in the cycle (however, this is rare in government)
• Vehicles can be upfitted with special equipment more easily, and can be sold without having to remove the special equipment (most of which will be worn out or obsolete)
Owning (buying) Pros
19

• Significantly increases fleet management/administration time (soft-dollar productivity reduced; cost generally not incorporated into lease vs. own cost analysis)
• Financial demands for replacement are less predictable
• Requires sufficient capital (appropriated funds) for timely replacement of vehicles (always a significant challenge for agencies)
• Because of insufficient capital, fleet age typically reaches high levels; optimum lifecycle replacement is exceeded, which increases total cost of ownership
Owning Cons
20

• Replacement of vehicles typically does not occur in a timely manner, which translates into: – Increased vehicle downtime (older vehicles means less
reliability) – Mission-fulfillment typically at greater risk (due to vehicle
downtime) – Increase in fleet size to ensure sufficient spare vehicles are
available as older vehicles break down more frequently – Higher maintenance costs (older vehicles not replaced in a
timely manner demand more maintenance) – Higher fuel costs and emissions;
Owning Cons (cont.)
21

• Places the burden on the component to provide an FMIS (an indirect cost), which translates into: – Requirement for a centralized FMIS with related procurement
requirements, IT support, training, programming to meet internal needs, etc.
– Management attention to data tracking – Typically less reliable data quality for fleet management purposes – Typically less reliable data quality for regulatory reporting (e.g.,
FAST) – More time required for a) data tracking, b) regulatory reporting – Government operated garages need extensive FMIS capabilities to
manage repair orders, labor tracking, parts, commercial repairs, etc.
• Often requires a government-owned and operated garage facility with staffing and overheads (indirect costs)
Owning Cons (cont.)
22

• Medium Duty Truck operated within a base, used 3,000 miles per year, 20 year life
• Cost of Ownership: $8,300 per year – Depreciation: $66K - $6K = $60K ÷ 20 = $3,000
per year – Fuel: 300 gallons @ $4 = $1,200 per year – Average Maintenance = $4,000 per year – Indirect Costs = $100 per year
• Cost of Leasing: $8,850 per year
Example
23

Example: Break Even Point
24
Life Time Cost (Purchase vs. GSA Lease)Sedan, Compact
Break Even Point9,690 Miles Per Year
$0
$2,000
$4,000
$6,000
$8,000
$10,000
$12,000
$14,000
$16,000
$18,000
$20,000
1000
3000
5000
7000
9000
1100
013
000
1500
017
000
1900
021
000
2300
025
000
2700
029
000
Miles Per Year
Cos
t
Purchase Cost GSA Cost

Agency Vehicle Class Owned GSA Commercial
DLA LD Minivan 4x2 (Passenger)
Dodge Grand Caravan $26,063.86 $19,272.88 $30,184.34
DLA LD Pickup 4x2 Dodge Ram 1500 $39,253.37 $31,478.09 $54,038.15
DLA MD Pickup 4X2 Ford F350 $51,202.47 $41,189.17 $91,454.57
Example
25

Summary • Consider ALL costs when comparing leasing vs.
buying • FMP and FAST require drill-down analysis of leasing
vs. buying • Use a Total Cost of Ownership (TCO) analysis for
owned vehicles • Consider the “soft” and indirect costs associated
with owning • Higher annual mileage vehicles favor leasing • Lower annual mileage vehicles with longer lifecycles
favor owning • Optimize owned vehicle lifecycles using TCO
26 26

Suggested Actions 1. Develop FAST Handbook and support with training (to
standardize data gathering and calculation methods)
2. Identify all indirect costs at a few garages and extrapolate (e.g. indirect cost avg. is $X per vehicle)
3. Develop TCO for selected vehicle types and assess cost differential against current age of fleet
4. Undertake rigorous lease vs. own analysis for key vehicle types and justify as required for the FMP
27 27

Presenter Contact • Mercury Associates:
– Gary Hatfield: • [email protected]
• (941) 685-6907 (mobile)
28 28