Lease Splitting and Dirty Entrants: The Unintended...
40
Lease Splitting and Dirty Entrants: The Unintended Deforestation Consequences of India’s Environmental Clearance Process Reform Anca Balietti, * Lucy Page, † Rohini Pande, ‡ Kevin Rowe, § and Anant Sudarshan ¶ July 25, 2018 Abstract Mining industries form a significant share of the industrial landscape of many poor countries. At the same time, mining activities have well-documented negative externalities: the air, land, and wa- ter pollution associated with mining has large health impacts and the destruction of forest cover can affect livelihoods. Using a comprehensive dataset on mining lease activities for India over the time period 2000 - 2013, we assess a landmark change in India’s environmental clearance process, intended to increase stringency, democratic participation, and effectiveness. The reform induced strategic be- havior by mining companies which, in turn, had perverse deforestation impacts. First, the average mine size fell with significant bunching just below 5 hectares, a cutoff below which stringent regula- tory requirements were waived. This rise in small mines was environmentally costly – districts with a higher proportion of such mines exhibit significantly greater deforestation per hectare of leased area. Second, in the post-reform period larger mines, i.e. those that have not selected out of the regulated size category, and stayed subject to environmental clearance regulation initiated deforestation earlier compared to the pre-reform period. On the benefits size, the environmental clearance process became faster after the reform, possibly due to an easing of the decision-making process following the increase in stringency and transparency. Keywords: Environmental clearance; mining; remote sensing data; deforestation; greenhouse gas emissions. 1 Introduction Mining is one of the oldest non-agricultural activities in human history, and a crucial part of economic output in many developing countries. The World Bank categorizes 56 countries as ‘mining economies’, where the sector plays an especially significant role in total economic output. Together over 3.9 billion * Harvard Kennedy School † Harvard Kennedy School ‡ Harvard Kennedy School § Harvard Kennedy School ¶ University of Chicago 1
Transcript of Lease Splitting and Dirty Entrants: The Unintended...

Lease Splitting and Dirty Entrants: The Unintended
Deforestation Consequences of India’s Environmental Clearance
Process Reform
Anca Balietti,∗ Lucy Page,† Rohini Pande,‡ Kevin Rowe,§ and Anant Sudarshan¶
July 25, 2018
Abstract
Mining industries form a significant share of the industrial landscape of many poor countries. Atthe same time, mining activities have well-documented negative externalities: the air, land, and wa-ter pollution associated with mining has large health impacts and the destruction of forest cover canaffect livelihoods. Using a comprehensive dataset on mining lease activities for India over the timeperiod 2000 - 2013, we assess a landmark change in India’s environmental clearance process, intendedto increase stringency, democratic participation, and effectiveness. The reform induced strategic be-havior by mining companies which, in turn, had perverse deforestation impacts. First, the averagemine size fell with significant bunching just below 5 hectares, a cutoff below which stringent regula-tory requirements were waived. This rise in small mines was environmentally costly – districts with ahigher proportion of such mines exhibit significantly greater deforestation per hectare of leased area.Second, in the post-reform period larger mines, i.e. those that have not selected out of the regulatedsize category, and stayed subject to environmental clearance regulation initiated deforestation earliercompared to the pre-reform period. On the benefits size, the environmental clearance process becamefaster after the reform, possibly due to an easing of the decision-making process following the increasein stringency and transparency.
Keywords: Environmental clearance; mining; remote sensing data; deforestation; greenhouse gasemissions.
1 Introduction
Mining is one of the oldest non-agricultural activities in human history, and a crucial part of economic
output in many developing countries. The World Bank categorizes 56 countries as ‘mining economies’,
where the sector plays an especially significant role in total economic output. Together over 3.9 billion
∗Harvard Kennedy School†Harvard Kennedy School‡Harvard Kennedy School§Harvard Kennedy School¶University of Chicago
1

people live in these countries, and over 1.5 billion live on less than 2 dollars a day (World Bank and
International Finance Corporation, 2002).
Unfortunately, mining is also associated with significant environmental costs, some of which (such
as species loss) are irreversible. These costs cover the gamut of air, land, and water pollution as well as
ecological damage and sometimes even species loss [2,3] (Dudka and Adriano, 1997). The Lancet Com-
mission on Pollution and Health estimates that 9 million premature deaths in 2015 were attributable to
air, water, and soil pollution globally, with a cost of USD 4.6 trillion, or more than 6 percent of the world’s
gross domestic product (Landrigan et al., 2017). The study cites about 2.5 million premature deaths from
pollution in India alone, the most of any country. As a consequence, the role of environmental regulation
is of outsized importance. It is therefore crucial to understand the impact of environmental regulation in
extractive industries, particularly in developing countries which may have weaker institutions or limited
state capacity.
In the 1970s and 1980s, India adopted a strong policy framework for controlling air and water pollu-
tion, forest clearing, and land use change. However, as India’s development has accelerated in the last 25
years, enforcement capacity in its main pollution control institutions has been outpaced by the growth
of polluting activities (Duflo et al., 2013). Greenstone et al. (2015) presents evidence on the magnitude
of this implementation gap and the consequences for human health, finding that reducing ambient air
pollution levels to those specified in current law would increase life expectancy by at least 3.2 years of
life for 660 million people living in the heavily polluted north of India. While improving the capacity
of India’s environmental regulatory institutions to carry out conventional monitoring and enforcement
strategies requires long-term structural changes, transparency initiatives that provide public access to
detailed information about industrial activities present a low cost channel for potentially improving the
accountability of polluting firms.
The Environmental Clearance (EC) process, which requires all major capital investment projects by
the private sector or government to seek regulatory approval prior to beginning construction, is the
centerpiece of environmental regulation of development in India. In 2006, India enacted a set of key
reforms that sought to bring greater transparency and accountability to the EC process by subjecting
larger projects to additional scrutiny from regulators, independent experts, and the public.
The reforms required projects to seek site-specific Terms of Reference (ToRs) for their environmental
impact assessments, decentralized smaller projects to state-level clearance bodies, and established expert
clearance bodies at both the state and central levels to review clearance applications. One key provision
of the 2006 reforms was to institute a requirement that all projects hold a public hearing after under-
taking the EIA and before submitting their clearance application to the ministry. Previously, only large
projects had been required to hold a public hearing. Crucially, although the stringency of regulation was
increased as a whole, small mines below 5 ha were exempt. One reason for this may be that it is more
difficult for small mines to bear high regulatory costs.
In this paper, we focus on the long-term incentives created by the 2006 EC reform for non-coal mine
2

proponents in India and assess the changes in a set of environmental outcomes associated with the
reform. We observe a sharp and long-lasting increase in the proportion of mines of area below 5 hectares,
which were exempt of the EC process, and a simultaneous decrease in the proportion of mines of area
between 5 and 25 hectares, which got subjected to stricter regulation starting with the 2006 Reform. The
visible selection in mine application trends suggests that mine proponents perceived the reforms to be
substantial and costly.
Two alternative scenarios could explain this distortion. On one hand, we might expect counterfactu-
ally large mines to opt for lease splitting into below 5 ha areas in order to avoid the stricter EC process.
On the other hand, the changes introduced by the reform could have altered market conditions such that
smaller scale mines – of possibly different minerals or new exploration areas – became relatively more
profitable.
The distortion of the size distribution of mines could also have environmental impacts both because
small mines are not subject to the formal regulatory environmental protection process, and because
smaller mines may be less able to afford environmentally safe production technology. We find that this
is indeed the case - small mines are associated with relatively greater reduction in vegetative cover in
districts, as compared to larger mines. It is probable that this is not a function of the state of the mined
area itself, but occurs because large mines subject to environmental regulation are required to engage in
compensatory afforestation activity.
In addition to environmental impacts following clearance to mine, we also find evidence that once
the public hearing requirement was put in place, some mines may have begun to clear land prior to
obtaining approvals or opted for less vegetated land when purchasing the mining lease. One reason
might be that operating conditions associated with environmental approvals are typically a function of
the pre-existing state of land. Lower quality baselines may therefore reduce regulatory requirements.
Our analysis uses data from the Indian Bureau of Mines, namely the All India Directory of Mining
Leases dataset. These data describe details on all mining leases (over 9200) issued since 1992, including
the date of mine execution. As well, we rely on a unique data repository that we have compiled on all
mines that applied for environmental clearance (EC) in India from 2006 to 2016.
This paper is organized as follows. Section 2 details the environmental clearance process and the 2006
reforms. Section 4 brings preliminary evidence on the distortion on the distribution of mine size that took
place starting since the 2006 EC reform and focuses on our motivation for the analysis. Sections 5 and 6
documents our analysis of the strategic behavior of small and large mines, respectively. Finally, Section 7
offers policy recommendations based on our findings and concludes.
3

2 India’s Environmental Clearance Process and the 2006 Reforms
The environmental clearance (EC) process, which requires all development projects to seek regulatory
approval before breaking ground, is the centerpiece of environmental regulation in India. The initial EC
process, instituted in 1994, required all mines larger than 5 ha to apply for clearance at the central level.
Mines would prepare an Environmental Impact Assessment (EIA) based on a standardized set of Terms
of Reference (ToRs), would hold a public hearing for mines if over 25 ha in area, and would then submit
the EIA and public hearing report to MoEFCC. MoEFCC would grant or deny clearance, seeking expert
input where necessary.
In 2006, a notification by the Ministry of Environment and Forests dramatically overhauled this pro-
cess, requiring more scrutiny of the projected environmental and social impacts of projects and greater
transparency in the approval process. The reforms decentralized the EC process into a two-tiered sys-
tem where larger projects (known as Category A) pass through a central process overseen by MoEFCC
and smaller projects (known as Category B) pass through parallel state-level processes overseen by State
Environmental Impact Assessment Authorities (SEIAAs). Within the mining sector, mines with lease
areas of 50 hectares or more are considered Category A projects, while mines of area between 5 and 50
hectares are considered Category B projects. Again, mines of area less than 5 ha are not required to get
environmental clearance.
As part of this decentralization, the 2006 EC reforms convened central- and state-level expert bodies to
review EC applications; these review bodies, known as Central and State Expert Appraisal Committees
(EACs), are comprised of representatives from industry, civil society, and academia. These committees
recommend projects for clearance, rejection, or deferral, before passing them to the MoEFCC or SEIAA
for a final clearance decision. The 2006 EC reforms also increased the stringency of the EC process by
requiring that all Category A and B mines apply for mine-specific Terms of Reference (ToRs) before
undertaking the EIA. Finally, all Category A and B mines are required to hold public hearings after
completing the EIA and before submitting the application to the ministry for clearance consideration;
previously, only mines of area above 25 ha were required to hold a public hearing. In sum, the reformed
EC application process takes the following five steps:
1. Application to MoEFCC or SEIAA. The project proponent files an application with basic informa-
tion about the project and proposed Terms of Reference (ToR) for the EIA.
2. Scoping for determination of ToR. The EAC or SEAC drafts finalized ToR based on the project
characteristics
3. EIA study and public consultation. The project proponent undertakes and submits a draft EIA.
The State Pollution Control Board then organizes a public hearing and invites written comments
from the public.
4. Project appraisal by EAC or SEAC. Project proponent submits final EIA and clearance documents
to MoEFCC or SEIAA. EAC or SEAC consider final proposal and make recommendation to MoE-
4

FCC or SEIAA to either grant or reject the clearance.
5. Grant or reject EC. MoEFCC or SEIAA makes a final decision to grant, defer, or reject the EC
application.
When the MoEFCC or SEIAA grants clearance, it assigns cleared projects a set of specific and general
conditions with which they are legally bound to comply. Project proponents must submit bi-annual
reports detailing compliance with these conditions to MoEFCC or SEIAA. Figure 1 in the Appendix
summarizes the provisions of the 2006 reforms across categories of mines by size and over time.
2.1 The role of public hearings in the EC reform
While our primary analysis will focus on the impact of the 2006 EC reforms on strategic behavior among
small mines, our later analysis will focus on impact of the reformed process on larger mines. In par-
ticular, we focus on the reform’s expanded requirement that all mines of area above 5 ha hold a public
hearing. The following section provides institutional background on this crucial provision of the reform,
which was intended to increase the transparency and public engagement of the process. During step 3
of the clearance process outlined above, the applicant is required to seek ”the concerns of local affected
persons and others who have plausible stake in the environmental impacts of the project or activity”
(MoEFCC, 2006). This public consultation requirement is designed to provide an official channel for
the public to have input on the evaluation and mitigation of social and environmental risks associated
with mines before their development. Conflicts between mining projects and the local community are
common and a common cause of delays to development of projects (Rights and Resources, 2016). Mine
proponents are required to consult with the public via two channels: holding a public hearing near the
site of the mine and eliciting written comments from other stakeholders.
The mine proponent begins the public consultation process by submitting a written request to the
relevant State Pollution Control Board (SPCB) to hold a public hearing. Along with the request, they
must provide at least 10 hard copies and electronic copies of the draft EIA report to the SPCB, with
a summary given both in English and in the local language. The mine proponent must also forward
copies to MoEFCC and to various district-level and regional authorities. Each of these authorities must
make the draft EIA public until the public hearing is finished. Similarly, MoEFCC must display the
summary of the draft EIA on its website and must have a physical copy of the full report available in its
office in Delhi.
Next, the SPCB sets a date and venue for the public hearing within seven days of receiving the project
proponent’s request. The 2006 notification requires that the hearing be held in close proximity district-
wise, but we are aware of no more specific regulations on the hearing location. SPCB must advertise
the hearing date in one major national newspaper and one regional local language paper with at least
30 days of notice. The hearing itself must be overseen by the District Magistrate, District Collector,
or Deputy Commissioner, assisted by a representative of SPCB. After a representative for the project
5

proponent describes the project and the EIA report, everyone present is allowed to ask for clarifications
on the project and to give opinions. The public hearing should cover the content of the EIA, which must
include a description of the project size, location, baseline environmental characteristics, anticipated
environmental impacts and mitigation measures, and social costs and benefits, including any plans for
relocation of villagers, improvements in physical infrastructure, and local employment.
The SPCB representative both videotapes the hearing and compiles a written summary of its pro-
ceedings. After reading this summary aloud, the District Magistrate signs it and then forwards it to the
relevant SPCB; SPCB then passes this summary to MoEFCC for consideration in the project’s clearance
deliberation. This summary must be translated into both English and the local vernacular and must be
displayed by local authorities, district authorities, and by SPCB. In total, the hearing must be completed
within 45 days of the project proponent’s initial request. The mine proponent must address all concerns
raised during the consultation process in revising the draft EIA; the proponent then submits the final
EIA report to the MoEFCC for the clearance appraisal process.
In practice, anecdotal evidence suggests that public hearings have provided an imperfect channel for
consultation in the clearance process. News coverage suggests that public hearings are often held purely
as a formality, with little provision for meaningful engagement by the public. In particular, project
proponents may hold the hearings at inconvenient locations or times, may neglect to provide the public
with the draft EIA before the hearing, or may fail to substantively incorporate public feedback into the
final EIA or project design (Mohan and Pabreja, 2016). In Jeet Singh Kanwar v. Union of India (2011), for
example, villagers sought to overturn clearance for a thermal power plant on the basis that the project
proponent had flouted the public consultation requirement. The villagers argued that the EIA summary
had been made available in English only one week before the hearing, instead of being made available
in both English and the local vernacular 30 days in advance, that the summary of proceedings was not
read out to the public, and that the hearing was held 8 km from the project site, precluding many from
attending.
In Adivasi Majdoor Kisan Ekta Sangthan v. MoEF (2011), villagers contested the environmental clear-
ance of a coal mine and washery in Chhattisgarh on similar grounds. Besides arguing that the hearing
was held in a remote and inconvenient location, the appellants claimed that the mine proponent failed
to make the summary draft EIA available online or in person in the district official’s office and failed to
publicize any local language version of the summary. Next, video recordings showed that villagers op-
posing the project disrupted the proceedings before leaving the premises. The district magistrate issued
no notice that the public hearing would continue, but resumed the hearing with only a few supporters
of the project present. The NGT’s deliberations remark that all of these supporters appeared to have
been brought and prompted by the proponent, concluding that the event had been a mockery of public
hearing.’ The NGT overturned the mine’s environmental clearance on these grounds.
Project proponents’ noncompliance with the public hearing requirements often translate into delays
later in the clearance process. The Council on Energy, Environment and Water (CEEW), a think tank in
6

India, finds that 9.17% of projects that were delayed in EAC meetings were because of public hearing-
related issues, especially for coal mining and industrial projects. The delays often arise because the
proponent has not incorporated recommendations from the public hearing or because SPCB has created
administrative delays in conducting the hearings. CEEW also cautions that public hearings tend to be
held too late in the decision-making process, so they simply become a delay for project proponents
and an opportunity for public opposition. We focus our analysis on this public hearing requirement,
which, while lauded in the literature as a crucial part of environmental impact assessment, has been so
contentious in Indias EC process.
3 Data
Our analysis rests on several data repositories compiled from a variety of sources. First, we use data
from the Indian Bureau of Mines, namely the All India Directory of Mining Leases dataset. Second, we
have compiled a dataset containing information on all mines that applied for environmental clearance
(EC) in India from 2006 to 2016. These data cover a range of aspects of these mining projects, including
characteristics of mines and project proponents, details of the application process, and satellite-based
measurement of environmental outcomes at mine sites. Finally, we rely on remote-sensing data to cap-
ture changes in forest cover.
Data on all mining leases from the Indian Bureau of Mines
We have purchased a dataset called the All India Directory of Mining Leases from the Indian Bureau of
Mines. These data describe details on all mining leases (over 9200) issued since 1992, including the date
of mine execution. We hired a data team from the Jameel Abdul Latif Poverty Action Lab to digitize
these data, which we initially received as 2000 hard copy pages.1
MoEFCC data on clearance applications
We construct the backbone of this dataset by scraping clearance records from an online application
database published by the Ministry of Environment, Forest and Climate Change (MoEFCC). We have
scraped data on the roughly 15,000 environmental clearance applications that have been filed since the
system’s initiation in 1980. Of these, we collect 1,318 records for unique, non-coal mines that applied for
clearance between 2006 and 2016. In addition to reporting project name, project location, and the dates
of key EC stages of submission, review, and approval, this online portal hosts documents associated
with each EC application. However, data available through the MoEFCC portal suffers from several
limitations. First, dates associated with key steps in the EC process are not reported for many projects
1We have merged these IBM data with the clearance dataset by mine wherever possible.
7

and many associated documents are missing. Even where application dates are reported, they are some-
times inconsistent with the sequence of the legal clearance process or differ from those reported in EC
documents associated with the same project.
Based on these inaccuracies, we supplement the MoEFCC portal with data on mine characteristics
and application processes drawn from the clearance letters granted to these mining projects. We have
scraped all of these letters from attachments available on MoEFCC’s online portal. While the contents
of the clearance letters change over time, the letters typically contain a range of information on both the
dates of key steps in the EC application process, like the date the project applied for clearance or was
granted TORs, and on physical mine characteristics, like the mineral mined, mine lease area, production
capacity, and method of extraction. These clearance letters are available either as PDF files with text
embedding, PDF files without text embedding, or html files. We first convert all of these files to text files
and then programmatically extract a wide set of variables, including: key dates in the application time,
including the date of EC application and clearance; the state, district, tehsil, and village in which a mine is
located; a range of mine characteristics, including the mine proponent, minerals mined, mine production
capacity, mine area, and whether an application is for a mine expansion or new mine. To ensure the
accuracy of the clearance letter dataset, we supplemented this programmatic variable extraction with
manual data entry. Together with the MoEFCC application dataset, this clearance letter dataset provides
a robust set of information on mine characteristics and EC applications for all mines in our sample.
In total, our final dataset includes 934 mining applications for EC with full information for mine and
clearance characteristics scraped from the MoEFCC website.
Satellite data on environmental outcomes
Finally, we rely on a novel dataset of satellite-based environmental outcomes and assess changes in
forest cover using the Enhanced Vegetation Index (EVI) from NASA’s MODIS satellite. EVI measures
vegetation for the entire globe at a spatial resolution of 250m. Values range from 0 to 1, where any value
less than 0.2 corresponds to land that is considered to be sparse to barren. EVI values are calculated
at 16-day intervals from daily MODIS data. We first aggregate EVI data at the district level and assess
changes in vegetation coverage induced by the reform. Then, when we analyze the impacts of the re-
form on outcome variables of large mines, we are able to associate EVI with exact mine locations. We
commissioned mines’ GPS locations from ML Infomaps, an Indian company. Using these coordinates,
we link mines to satellite-based measures of land cover. Using these satellite data, we calculate annual
maximum, median, and mean EVI at mine sites as a measure of the extent of deforestation at mine sites.
8

4 Shift in the distribution of mine size
The 2006 EC reforms could have induced selection on mine size around three distinct area thresholds:
5 ha, 25 ha, and 50 ha. First, mines might anticipate significant costs from additional regulatory and
public scrutiny under the 2006 reforms and therefore might shift to leases of less than 5 ha to escape the
clearance process as a whole. Next, since the imposition of the public hearing requirement on all mines
above 5 ha removed the premium to being below 25 ha, we might expect to see a shift in the proportion
of mining leases above 25 ha. Finally, since the 2006 reforms split mines above 50 ha into Category A
and below 50 ha into Category B, we might expect to see mines shifting either above or below the 50 ha
threshold to avoid either the state- or central-level clearance process.
Figure 1: Number of new mine leases granted by area. Source: own illustration based on data from the IndianBureau of Mines.
Indeed, we find substantial evidence that the 2006 reforms altered the distribution of mine size in
India by inducing an immediate and long-lasting shift towards mines of area below 5 ha, which were
not required to get environmental clearance. Figure 1 below plots the number of mining leases by area
over time using data from the Indian Bureau of Mines (IBM) Registry of Mining Leases. The figure plots
the number of new leases each year from 1990 to 2013 for five area categories: less than 5 hectares, 5 to
15 hectares, 15 to 50 hectares, 50 to 100 ha, and greater than 100 hectares. The gray line at 2006 denotes
the EC reform. The figure shows a striking shift in the lease size distribution after 2006. In particular,
between 2005 and 2007 there was a large increase in the number of leases with area below 5 ha, which
were not subject to EC until a ruling of the Supreme Court in 2012. Indeed, the number of leases granted
9

between 5 and 15 ha fell by 73 between 2006 and 2007, while the number of leases granted of 5 ha or less
rose by 242. At the same time, the number of mine leases of area between 5 and 15 ha fell markedly after
a peak in 2005. There is little visible trend in the number of leases of area over 15 ha. These application
series strongly suggest that the 2006 reform induced a shift in the distribution of mine areas from leases
between 5 and 15 ha, which would have had to get clearance under the newly stringent process, to leases
of less than 5 ha, which would avoid the process.
Figure 2: Share of number of new mine leases granted by area. Source: own illustration based on data from theIndian Bureau of Mines.
This shift towards mines of area under 5 ha persists over time. Indeed, while the number of mines
in all area categories falls off precipitously after 2008, the proportion of leases that are less than 5 ha
remains high over time. Figure 2 plots the proportion of mining leases granted by area categories; these
area categories match those in Figure 1. The proportion of leases with area below 5 ha rises to over 80%
in 2007 and remains there through the remainder of our sample period.
In theory, the large shift towards leases below 5 ha could reflect other market shifts, like an increase in
demand for minerals that are best mined in small leases. However, we find that most of the new mass in
leases under 5 ha falls just under the 5 ha threshold, suggesting that the shift is induced by the 2006 EC
reform rather than by another market change. Consider Figure 3 below, which presents the distribution
of mining leases overall and around the 5 ha threshold before and after the 2006 reforms. We define
the pre-reform period as 1998 through 2005 and the post-reform period as 2006 through 2013. The first
panel of the figure gives a histogram of all mining leases with area below 100 ha. About 4% of mining
10

leases granted between 1998 and 2013 have area at or above 100 ha. Again, we see the large post-reform
spike in leases below 5 ha. Just over 80% of all leases granted after the reform had area less than 5 ha,
compared to about 51% of leases before the reform. A McCrary test validates the presence of a large and
statistically significant discontinuity in the density of mines around the 5-ha cut-off after the 2006 reform
(Figure B.1 in the Appendix).
Figure 3: Distributions of non-coal mine leases in India, pre- and post the 2006 Environmental Clearance reform.The pre-reform period covers 1998 - 2005 and the post-reform period covers 2006 - 2013. In the left panel, thevertical line marks the 5 hectare cutoff; in the right panel, the vertical lines mark the 5, 25, and 50 hectare cutoffs.Source: own illustration based on data from the Indian Bureau of Mines.
The second panel of Figure 3 zooms in to the histogram of mining lease area among leases of area
below 15 ha. Here, we see that the shift towards leases of area less than 5 ha is concentrated just below
the 5 ha cutoff. A full 70.4% of leases granted after the reform had area between 4 and 5 ha, compared
with 14.2% of leases before the reform. This bunching below the cutoff suggests that the shift in the mine
area distribution reflects the 2006 EC policy reform, rather than the influence of other market forces.
Next, we see similar bunching for each of the most popular minerals and across states; see Figs B.2 and
B.3 in the Appendix. We might expect to the area distribution shift to occur only in certain states or
minerals if it were driven by a mineral price shock, rather than by a national policy change.
5 Strategic behavior of small mines
5.1 Impacts of the distribution shift: Descriptive evidence
Why would this shift in India’s distribution of mine sizes matter? We hypothesize that the distortion
of the size distribution could have important implications for the environmental damages of mining in
India. In particular, we test two possible channels. First, the shift towards small mines induced by the
2006 reforms may have resulted in greater total area under mining development. Second, this shift may
have resulted in greater environmental damage or lower environmental quality per hectare of mining
11

development. We outline the reasoning for each of these hypotheses below and provide descriptive
evidence below. In Section X, we will provide regression analysis in support of these claims.
5.1.1 Did the size shift result in greater total leased area?
How did the 2006 reform impact the overall volume of mining in India? Figure 4 below plots total leased
area over time for all lease sizes and within mining categories. The timeseries for total lease area is spiky,
driven by the a few large mines (lease area over 100 ha), and exhibits no clear trend except for a striking
fall in mining activity after 2010. While it is difficult to disentangle the impacts of the 2006 reform from
other time trends that could impact the mining sector over our study period, we will attempt to identify
the impacts of the reform on leased area using the event study-style breaks in the area series around the
date of the 2006 reform. We focus here on area leased to small and medium mines, which account for
the majority of mining leases in India and for the strategic behavior we observe. We further explore the
link between the 2006 reform, strategic behavior, and area under mining in regression form in Section 6
below.
Figure 4: Evolution of leased area 1990 - 2013 by lease area category and overall
In theory, the shift towards small mining leases could have left total leased area unchanged if the
new small leases were offset by a drop in the number of medium sized leases, or those between 5 and
15 ha. However, if the introduction of more stringent environmental regulation for medium and large
mines increased the relative profitability of smaller mines, it may have favored the market entrance of
12

new small players. Depending on the magnitude of this relative boost in profitability, the number of
new small leases could increase beyond what would have been a counterfactual number of leases below
15 hectares, resulting in higher total leased area. Next, regulators might unintentionally allow for higher
total leased area when lease applications are for smaller mines, perhaps because they apply less scrutiny
to small leases or because they fail to consider the cumulative area of separate lease applications.
Figure 5: Lease area 1990-2013 for small (< 5 ha) and medium (5-15 ha) mines
We find, however, that the area of new small leases substantially surpassed the drop in area from 5-15
ha leases. Figure 5 gives the total area granted in leases of area between 5 and 15 ha and in leases below
5 ha from 1990 to 2013. Consistent with the pattern of number of leases granted over time, total area
granted in small leases rises sharply after 2006 while area granted in medium leases falls. The drop in
area from medium leases does not counteract the rise in area from small leases, and total area granted to
small or medium mines (leases with area less than 15 ha) rises overall with the 2006 reforms (Figure 6).
Note that the level shift in total area granted in small or medium leases occurs in 2005, the year before
the reforms were enacted, due to an anticipatory spike in medium-sized leases in that year.
13

Figure 6: Total lease area for small mines and among all mines of area < 15 ha (small and medium mines)
In Figure 7, we compare the total post-reform lease area in small mines by mineral with estimates of
the area contributed from “splitting” 5-15 ha mines and “carrying over” mines that would have been
under 5 ha anyways in the absence of the 2006 reform. Here we focus on the 7 most common minerals
after the 2006 reforms, which are dominated by quartz, feldspar, and clay. We estimate split 5-15 ha area
as the difference between the pre- and post-reform area in 5-15 ha leases by mineral.2 In other words, we
assume that any area leased in medium-sized mines pre-reform years would also have been leased in
medium-sized mines in post-reform years if not for the reform itself; then if area in medium leases falls
by X hectares, we assume that splitting of medium-size mines due to the reform attributed X hectares
to total post-reform lease area in small mines. Next, we estimate carry-over area as the pre-reform area
in leases under 5 ha. Then, we can estimate excess post-reform leased area in small mines as the gap
between the sum of “split” and “carried-over” area and total leased area in small mines post-reform. If
the 2006 reform simply redistributed mining development between area categories, we would estimate
that these two categories accounted for the total post-reform area in small leases.
However, we find that “split” and “carryover” area only account for a small share of the post-reform
leased area in the most common minerals. Of the 2017.8 ha leased to small quartz mines in 2007 and
2008, the drop in medium-sized mines only accounts for only 0.4% and carried-over area from pre-
reform small leases accounts for only 8.8%. For quartz, we can think of the remaining 90.8% of the
post-reform lease area as new development induced by the 2006 reform.
2Note that here we measure pre-reform area totals using the 2003 and 2004 lease area distributions and measure the post-reform area totals using the 2007 and 2008 lease area distributions. We use these subsets of years to avoid conflating the impactof the reform with the large time trends in leased area both before and after the reform.
14

Figure 7: A decomposition of total post-2006 area leased in small mines in the most common minerals
5.1.2 Were post-reform grantees dirtier and smaller?
Besides leading to greater total leased area, we hypothesize that the reforms could have increased envi-
ronmental damage per unit of mining because smaller mines may be strictly worse for the environment.
In particular, small mines are not required to go through the environmental clearance process, may in-
volve smaller, less experienced firms, and because of lower economies of scale, expensive environmen-
tally safe production technology may not be feasible to adopt. In this section, we explore the impact of
the 2006 reform and the resulting shift to small mines (of area under 5 ha) on the characteristics of mine
lease grantees.
15

Figure 8: Number of leases and unique lessees for small and medium mines, 1990-2013
Broadly, the change in “environmental competence” of lease grantees after the 2006 reforms depends
on whether the reform induced the entry of a new class of small mining companies or, rather, incen-
tivized applicants that otherwise would have produced larger mines to split counterfactually larger
leases into small mines. We begin exploring this question by evaluating the extent to which the spike
in small leases reflects lease splitting, or the grant of multiple leases to single applicants, or the entry of
small, single-lease applicants. To do so, we first identify unique grantees by fuzzy merging groups of
grantee names. Consider Figure 8, which plots series for the number of leases and number of unique
grantees for small and medium mines over time. The series for unique lessees broadly tracks the num-
ber of leases over time for both area groups, suggesting that the bulk of new small leases arise from new
entry of small grantees, rather than from a few large companies getting multiple small leases.
16

Figure 9: Average number of leases per unique grantee, against lease area (ha)
At the same time, however, we find some evidence of lease splitting, especially just below the 5 ha
cutoff. Consider Figure 9, which plots the average number of leases per unique lease grantee against
lease area in the pre- and post-reform periods. Following the 2006 reform, there is a marked spike in
the average number of leases per grantee among leases between 4 and 5 ha. The average number of
leases per grantee rises from 1.07 leases to 1.22 leases per grantee from the pre- to post-reform period.
Multiple leases from the same grantee remain a fairly small proportion of all small leases after the reform,
however. Of the 2098 leases of area between 4 and 5 ha granted from 2006-2013, 30% were granted to a
lessee with at least one other small lease in the same period.
It is important to note that our measure of lease splitting so far represents a lower bound of lease-
splitting behavior. While so far we have identified lease splitting by linking together leases held by
unique applicants, companies could apply for leases under different names. In the same sense, lease
applicants may also effectively split leases by applying for multiple leases under different names within
families or other social networks. To explore this form of coordination across lease applicants, we first
separate grantees into those that appear to be companies and those that appear to be individuals. We
identify companies by the presence of keywords in the lessee name, like “mining,” “company,” “enter-
prise,” or “cement.” Within the set of leases granted to “individual” applicants, we then calculate the
proportion that were granted to an individual whose surname matches that of another applicant with
a lease in the same district. Figure 10 plots this proportion over time for small and medium leases. We
see a visible shift in the proportion of small leases with a matching surname after 2006, while there is no
17

such visible shift among medium leases. These trends provide additional suggestive evidence that some
degree of lease splitting, rather than just entry of small, single-mine applicants, contributed to the rise in
small mines after the 2006 reforms.
Figure 10: Probability of a surname match among grantees within a district over time
Even if lease splitting, rather than just an influx of individual leaseholders, accounts for some of the
spike in small mines after the 2006 EC reforms, this lease splitting could be driven by new, unexperienced
companies suddenly made relatively profitable by the new costs imposed on larger mines. In other
words, we might expect to see larger, existing companies being forced out by the 2006 reforms and
replaced by new, smaller companies. See Figure 11, which plots the number of leases granted after the
2006 reforms against area and separated by grantees who did and did not also have a lease granted in
the pre-2006 period. Here, we see that while applicants that had leases both in the pre- and post-reform
periods also shift heavily towards small mines in the post-reform period, most new leases in 2006 or
later were granted to applicants with no pre-reform leases.
18

Figure 11: Proportion of leases in new mines of owners with a previous lease.
Moreover, we find that the boom in small leases around the 2006 reform was disproportionately
driven by individual lessees, rather than companies. Figure 12 plots the proportion of leases that were
granted to individuals over time among small and medium leases over time. While the proportion of
medium-size leases granted to individuals fell precipitously after the 2006 reforms, the proportion of
small leases granted to individuals rose somewhat more sharply immediately around the years of the
reform.
19

Figure 12: Proportion of individuals over time that had leases below 5 ha.
5.2 Impacts of the distribution shift: Regression analysis
Following the observation of the shift in the long-term distribution of mine size, two key questions arise
regarding its consequences. On one hand, we are interested in understanding its impact on the size of
the mining sector in the long term. On the other hand, our analysis tries to uncover whether the size
distribution shift brought along a change in the environmental burden of the mining sector. These two
topics are the focus of the following sections.
5.2.1 Impacts on total leased area
Section 4 provides suggestive evidence of an increase in total area leased to small and medium-size
mines immediately after the 2006 reforms, though this increase in area attenuated over time as mining
activity fell. The series for total area, which appears to be driven by a few large mines, is less clearly
linked to the 2006 reform. This section aims to quantify the contribution of the shift in the distribution
of mine size towards smaller mines to this increase.
We hypothesize that the crowding out of medium-sized leases due to the introduction of more strin-
gent environmental regulation for this size category, could have increased the relative profitability of
smaller mines and favored the market entrance of new small players. Depending on the magnitude of
this relative boost in profitability, the number of new small leases could increase beyond what would
20

have been a counterfactual area in leases below 15 hectares, resulting in an increase in total leased area
for small and medium mines.
We begin by first estimating simple event study models on the series for total lease area in various
size categories. We estimate variants of the following model:
Total lease areat = α + β1Yeart + β2Post-reformt + β3Year*Post-reformt
We estimate this model on a national timeseries of total leased area in different area categories by year.
In particular, we estimate the model using total leased area, total leased area in small leases (< 5 ha), and
total leased area in medium leases (5-15 ha). This model allows us to test both for a level shift in leased
area after the 2006 reforms and for a shift in annual time trends after the reform. We present the results
in Appendix Table A.1 and present them graphically here.
Figure 13: Predicted values for total leased area from regression with quadratic year controls interacted withpost-reform dummy
21

Figure 14: Predicted values for leased area < 5 ha from regression with quadratic year controls interacted withpost-reform dummy
In all figures, we normalize our estimates for predicted leased area so that lease area equals 0 in 2005,
the year before the reform (year -1 in the figures). The lines in the figure plot predicted leased area over
time, while the orange dots in the background plot observed leased area by year. Here, we see that the
was a level shift up in 2006 for total leased area and leased area in leases under 5 ha. In contrast, there
is a level shift down in 2006 for lease area in leases between 5 and 15 ha. While leased area remains
elevated relative to 2005 levels for small mines, returns to and then falls below 2005 levels about 4 years
after the reform.
22

Figure 15: Predicted values for leased area 5-15 ha from regression with quadratic year controls interacted withpost-reform dummy
We cannot robustly evaluate the long-run impacts of the 2006 reforms from these time trends, since
other long-run market or regulatory changes may confound our estimates. However, the level shifts in
2006 provide substantial evidence of the reform’s short-run impacts on total lease area, especially for
small and medium-size mines. In particular, these results add to our descriptive evidence in suggesting
that the reform induced, or at least coincided with, a short-run increase in total area in small leases and
drop in total area in medium leases.
Next, we test the impact of the strategic shift to small mines on total leased area by exploiting district-
level variation in the extent of strategic behavior. In particular, we use a reduced form model in which
the total leased area in the post-reform period by district is a function by the total pre-reform leased area,
as an indication of the counterfactual, and the share of small mines. We expect that areas with a larger
proportion of small mines to also have an increase in total area. Heterogeneity in the proportion of small
leases across different areas is expected due to differences in the quality of institutions and their ability
to attract business, their level of past development and how much room is left for new projects, and most
importantly by the unequal distribution of minerals across India’s territory.
Post-reform lease areai = α + β2Pre-reform leased areai +
β2Post-reform prop new leased area in leases<5 hai + ϵi
23

where the i is the district and Prop new leased area in leases<5 ha in posti is defined as:
Post-reform prop new leased area in leases<5 hai =Post-reform area in leases < 5ha
Post-reform total leased area
or
Post-reform prop new leased area in leases<5 hai =Post-reform area in leases < 5haPost-reform area in leases < 15ha
We estimate this model both using an outcome variable of total post-reform leased area (model 1)
and total post-reform leased area in small and medium leases (model 2). As expected, we find that total
leased area in the post-reform period tends to increase with pre-reform leased area. That is, districts
with a lot of mining before the reform tended to have more mining after the reform as well. Among
small and medium leases, districts that had a larger share of lease area in leases under 15 ha had higher
post-reform mining. The opposite is true when we look at the impact of the share of lease area under 5
ha out of total leased area.
Table 1: Cross-sectional links between proportion of leased area in leases under 5 ha and post-reform leased area
(1) (2)
Using full area sample Restricting to leases of area < 15 ha
Post-reform prop area < 5 ha -357.578** 113.730*
(149.74) (66.20)
Total pre-reform leased area 0.498*** 1.546***
(0.08) (0.19)
Nr. observations 164 147
R2 0.275 0.315
Note: Significant coefficients are denoted with stars as follows: *** p<0.01, ** p<0.05,
and * p<0.1.
Why do we see these incongruous results? We expect that the results in model 1 may be driven
by districts with large mines. Any district with a large mine would tend to have a small share of area
in leases under 5 ha, since any small mines would be dominated by the presence of a large mine. At
the same time, districts with large mines would have unusually high total leased area. Thus, districts
with large mines could induce a negative correlation between proportion of area under 5 ha and total
leased area. In the regression in which we exclude large mines (model 2), we find the expected positive
correlation between a strategic shift to small mines and total lease area in small or medium mines.
24
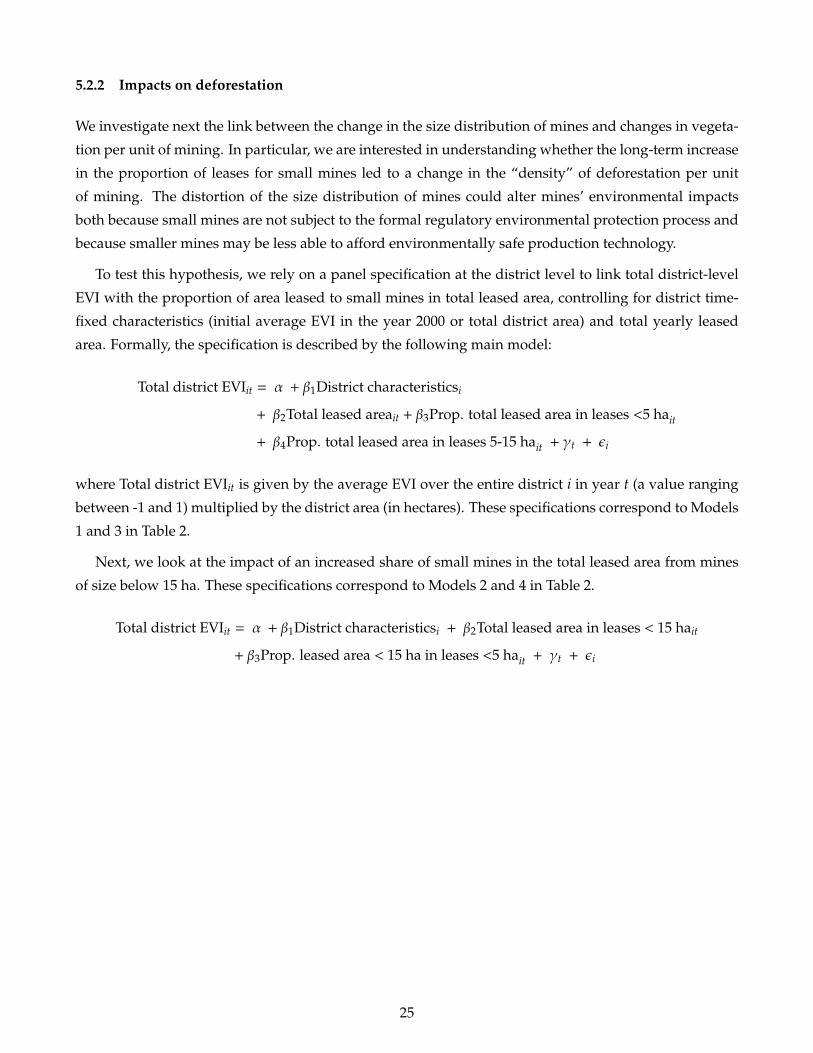
5.2.2 Impacts on deforestation
We investigate next the link between the change in the size distribution of mines and changes in vegeta-
tion per unit of mining. In particular, we are interested in understanding whether the long-term increase
in the proportion of leases for small mines led to a change in the “density” of deforestation per unit
of mining. The distortion of the size distribution of mines could alter mines’ environmental impacts
both because small mines are not subject to the formal regulatory environmental protection process and
because smaller mines may be less able to afford environmentally safe production technology.
To test this hypothesis, we rely on a panel specification at the district level to link total district-level
EVI with the proportion of area leased to small mines in total leased area, controlling for district time-
fixed characteristics (initial average EVI in the year 2000 or total district area) and total yearly leased
area. Formally, the specification is described by the following main model:
Total district EVIit = α + β1District characteristicsi
+ β2Total leased areait + β3Prop. total leased area in leases <5 hait
+ β4Prop. total leased area in leases 5-15 hait + γt + ϵi
where Total district EVIit is given by the average EVI over the entire district i in year t (a value ranging
between -1 and 1) multiplied by the district area (in hectares). These specifications correspond to Models
1 and 3 in Table 2.
Next, we look at the impact of an increased share of small mines in the total leased area from mines
of size below 15 ha. These specifications correspond to Models 2 and 4 in Table 2.
Total district EVIit = α + β1District characteristicsi + β2Total leased area in leases < 15 hait
+ β3Prop. leased area < 15 ha in leases <5 hait + γt + ϵi
25

Table 2: Yearly panel regressions of district EVI on proportion leased area under 5
(1) (2) (3) (4)
Summed district EVI
Total district area (ha) 0.170*** 0.160***
(0.05) (0.05)
Summed initial district EVI 1.090*** 1.111***
(0.06) (0.06)
Total leased area (ha) -20.473 -18.950
(20.12) (14.70)
Prop. total area in leases < 5 ha -53369.803*** -36235.520***
(19815.44) (9603.06)
Prop. total area in leases 5-15 ha 8460.340 -27798.091*
(15593.09) (14985.77)
Total leased area in leases < 15 ha 167.100 -60.077
(117.83) (37.05)
Prop. area < 15 ha in leases < 5 ha -63631.772*** -10625.694
(19778.63) (9438.29)
Year FE YES YES YES YES
Nr. observations 973 973 828 828
R2 0.559 0.724 0.554 0.723
Note: Significant coefficients are denoted with stars as follows: *** p<0.01, ** p<0.05,
and * p<0.1.
We find that small mines are associated with relatively greater reduction in vegetative cover in dis-
tricts, as compared to larger mines. It is probable that this is not a function of the state of the mined
area itself, but occurs because large mines subject to environmental regulation are required to engage in
compensatory afforestation activity.
6 Strategic behavior of large mines
So far, the paper has focused on strategic behavior among small mines induced by the 2006 reforms. For
the remainder of the paper, we use our extensive set of data on mines that passed through the reformed
clearance process. We will provide evidence that the EC reform also may have induced additional de-
forestation by incentivizing earlier deforestation among mines that remained above 5 ha and therefore
passed through the reformed process.
In particular, we will focus our analysis on the impacts of public hearings in India’s environmental
clearance process for mines. One crucial provision of the 2006 reforms was to expand the requirement
26

that mines hold public hearings from mines of area over 25 ha to all Category B mines, or those of area
between 5 and 50 ha. The objective of public consultation is to ensure that “the concerns of local affected
persons and others who have plausible stake in the environmental impacts of the project or activity
are ascertained with a view to taking into account all the material concerns in the project or activity
design as appropriate.” Along with the information disclosure procedures that support it, the public
hearing requirement in the 2006 reforms is intended to provide an official channel for the public to have
input on the evaluation and mitigation of social and environmental risks associated with mines before
their development. Conflicts between mining projects and the local community are a common cause of
delays to development of projects (Rights and Resources, 2016). We are unable to detect any significant
difference in either the stringency of the EC process or mines’ environmental performance stemming
from the public hearing requirement. At the same time, our analysis of the public hearing requirement
reveals that on average mines deforested substantially earlier after the reform, despite shorter clearance
durations.
We hypothesize that the 2006 EC reforms could have improved environmental performance at mines
by increasing the transparency of the clearance process and subjecting projects to more stringent review
by expert committees and the public. At the same time, the reforms could have increased the regula-
tory burden of the process by placing additional requirements on mine proponents and lengthening the
clearance process.
We seek to evaluate these possible impacts by exploiting a discontinuity in the historical clearance
process for mines of area above and below 25 ha. Under the 1994 system for environmental clearance,
mines of area less than 25 ha were not required to hold public hearings, while those above 25 ha were.
The 2006 reforms bundled all mines of area between 5 and 50 ha as “Category B” projects, requiring all
of them to hold public hearings after compiling an EIA. Thus, the 2006 reforms required for the first time
that mines of area between 5 and 25 ha hold a public hearing, while leaving unchanged the requirement
that mines of area between 25 and 50 ha hold a public hearing. For mines above and below the 25 ha
cut-off, this differential change in the public hearing requirement was the only change to the EC process
around the date of the 2006 notification.
Therefore, we can exploit these cut-offs in clearance requirements at 25 ha and around the date of the
EC notification in September 2006 to evaluate the impact of the public hearing requirement. In particular,
we evaluate the impact of holding a public hearing as the differential change in outcomes from pre- to
post-notification for mines of area above and below 25 ha. Identifying mines of area less than 25 ha as
treatment mines and mines of area greater than 25 ha as control, we estimate the following difference-
in-difference regression:
Xi = β0 + β1Mine characti + β2Queue lengthi + β3Log areai + β4Treatmenti +
β5Posti + β6Post*Treatmenti + ϵi
where Xi is a mine-level outcome, Treatmenti is an indicator specifying that mine i has area under 25 ha,
27

and Posti indicates whether a given mine applied for clearance before or after the 2006 EC notification.
Then, β4 estimates the differential in mine outcomes for mines below 25 ha relative to mines above 25 ha
before the 2006 notification, β5 estimates the gap in mine outcomes for control mines (area above 25 ha)
that applied after the 2006 notification relative to those that applied before, and β6 estimates the differen-
tial change in mine outcomes around the date of the 2006 notification for treatment mines, or those with
area below 25 ha. We can interpret β6 as the impact of the expanded public hearing requirement under
the 2006 EC reforms. Note that we restrict our analysis to mines of area between 5 and 50 ha. Mines of
area below 5 ha are not required to apply for environmental clearance, and mines of area greater than 50
ha are classified as “Category A” projects and are subject to a different clearance process.
In this difference-in-difference analysis, controlling for the pre- and post-notification trends among
control mines allows us to separate the impact of the public hearing requirement from overall time trends
in environmental and clearance outcomes. However, our analysis may be compromised by selection of
mines into treatment or control. We will seek to evaluate the extent of selection throughout our analysis.
Broadly, we seek to estimate the impact of the public hearing requirement on the mine-level costs
and benefits of the environmental clearance process. First, we measure the regulatory burden of public
hearings either as the duration of the clearance process, defined as the time between application and
clearance approval in days, or as mines’ self-reported total costs. While the benefits of the clearance pro-
cess could include things like increased employment for local communities, we focus on evaluating the
impact of the reform on environmental performance at mines. We proxy for environmental conditions
for mines with four outcomes: average annual PM2.5 concentration within 1 km of mines’ centroids,
biochemical oxygen demand and pH in the nearest river, and median annual EVI at mine sites. For
each of these environmental outcomes, we define our outcome variable for analysis as the change in that
outcome from two years pre-clearance to two years post-clearance. Evaluating the impact of public hear-
ings on these differenced environmental outcomes allows us to estimate the impact of public hearings
on mines’ environmental performance, rather than picking up changes in mine siting over time. In addi-
tion to these first-differenced measures of mines’ environmental performance, we will assess the impact
of public hearings on mines’ compliance with the requirement that they deforest only after receiving
clearance.
6.1 Changes induced by the public hearings
Table 3 assesses balance on summary statistics for mine characteristics between treatment and control.
This balance table allows us a first look at selection into treatment versus control along observable mine
and application characteristics. Note that this table pools treatment and control mines between the pre-
and post-notification periods. Consider the first and second panels of Table 3, which assess differences
in mine and application characteristics, respectively. We find that most mine characteristics are balanced
across the 25 ha cutoff, suggesting that observable selection into treatment and control is limited. As
expected, treatment mines have significantly lower production capacity than do control mines. Next, we
28

find that queue length, or the number of projects awaiting clearance, is significantly lower for treatment
mines, and that treatment mines are significantly less likely to be run by a company that has a successful
previous clearance. We seek to control for these differences throughout our analysis.
In contrast, panel three of Table 3 presents post-EC mine outcomes, in which we might expect differ-ential clearance processes to induce discontinuities. Treatment and control mines look broadly similaralong these clearance and environmental outcomes, though treatment mines have significantly higherpH in nearby rivers and significantly lower annual EVI at mine sites.
Tables 4 and 5 present the results of our primary difference-in-difference analysis of the impact ofpublic hearings, which we estimate as the differential impact of the 2006 reforms for treatment mines(area less than 25 ha) relative to control mines (area greater than 25 ha). In Table 4, we begin by estimatingthe impact of the public hearing requirement on the costs of the EC process. We measure costs as durationof the EC process or as the total mine cost stated in each mine’s clearance letter. First, we find thatclearance duration fell significantly for mines that applied for clearance after the 2006 notification, fallingby about 31%. Note that we can only interpret this average change as a time trend, not as a causal impactof the 2006 notification reforms. We find no significant differential pre-post trend for treatment minesrelative to control for either measure of clearance costs. In other words, we find no significant impactsof the public hearing requirement on clearance costs.
It is important to approach these null results with caution, since they could simply reflect weaknessesin our measures of process costs. First, our measure of EC application duration does not actually includethe time spent on the public hearing. We lack data on the date that projects first apply for ToR, sowe calculate duration as the time between when a project submits its EIA to MoEFCC and the date onwhich it receives clearance. The public hearing occurs before the project proponent submits its EIA to theministry, so it is not included in our measure of duration. Thus, even if the public hearing requirementincreases the total duration of the application process, we might not expect to see significant impactson the measure of duration to which we have access. However, this measure of duration could pick upincreases in duration that arise because the public hearing produces additional information that slowsconsideration by the EAC, for example. Again, we see no such impacts. Next, our data for mine costs isfairly imprecise. Mines self-report costs, which are often rounded up to values like 5 crore, or 50 millionRupees. Thus, these values are likely imprecise measures of actual mine costs.
29

Table 3: Balance table around area = 25 ha
Treatment Mean(N = 68)
Control Mean(N = 66)
Difference ofMeans
P-value forDifference of Means
Mine characteristics:Production capacity (TPA) 1.7e+05 3.0e+05 -1.3e+05 0.035
(3.5e+04) (4.8e+04) (5.9e+04)Riverbed mine 0.044 0.015 0.029 0.328
(0.025) (0.015) (0.030)Mine in multiple districts 0.000 0.015 -0.015 0.312
(0.000) (0.015) (0.015)Violation 0.029 0.000 0.029 0.163
(0.021) (0.000) (0.021)
Application characteristics:Queue length 154.618 172.970 -18.352 0.016
(4.312) (6.246) (7.551)Application typeNew mine 0.294 0.364 -0.070 0.395
(0.056) (0.060) (0.082)Existing mine 0.147 0.152 -0.004 0.943
(0.043) (0.044) (0.062)Area/capacity enhancement 0.559 0.485 0.074 0.395
(0.061) (0.062) (0.087)
Proponent cleared before 0.147 0.288 -0.141 0.048(0.043) (0.056) (0.071)
Date of EC application 1.7e+04 1.7e+04 -55.010 0.453(58.299) (43.519) (73.078)
Mine outcomes:EC duration 316.618 293.258 23.360 0.471
(19.587) (25.898) (32.345)Mine site PM (ug/m3) 39.194 35.554 3.640 0.162
(1.870) (1.788) (2.590)Annual median EVI 0.196 0.222 -0.026 0.079
(0.009) (0.011) (0.015)Annual maximum EVI 0.475 0.482 -0.008 0.798
(0.019) (0.023) (0.029)Deforest year rel. to clearance 0.382 1.028 -0.645 0.278
(0.524) (0.291) (0.591)Biochemical ox. demand (mg/L) 2.317 2.213 0.104 0.840
(0.442) (0.282) (0.516)pH 7.893 7.578 0.315 0.003
(0.076) (0.072) (0.105)
30

Table 4: Impacts of public hearing reform on clearance costs
(1) (2) (3) (4)Log duration Total mine costs
Treatment -0.134 -0.203 52.208 17.132(0.17) (0.17) (71.18) (65.37)
Post notif. -0.414*** -0.373*** 90.286 78.854(0.15) (0.14) (68.63) (63.92)
Treatment * post notif. 0.177 0.266 -104.800 -98.435(0.21) (0.20) (80.53) (73.22)
Log area -0.102 -0.016 42.537 -20.646(0.13) (0.13) (34.83) (33.97)
Queue length 0.002 -0.495(0.00) (0.38)
Log prod cap (TPA) -0.122*** 52.730***(0.03) (10.61)
Application type (Base = new mine)Existing mine 0.211 40.281
(0.17) (62.18)Area/capacity enhancement 0.261** 1.269
(0.13) (41.16)
Mine type (Riverbed = 1) 0.576 -70.783(0.37) (89.47)
Letter lists more than 1 district 0.565*** -101.260***(0.12) (37.88)
Cleared before -0.211 -4.291(0.14) (53.91)
Violation 0.240 182.082***(0.16) (40.49)
Nr. observations 134 134 124 124R2 0.077 0.325 0.049 0.277Adj. R2 0.049 0.258 0.017 0.199
Note: Robust standard errors are given in parentheses. Significant co-efficients are denoted with stars as follows: *** p<0.01, ** p<0.05, and* p<0.1. The sample is restricted to mines of area less than 50 ha. Postnotif. is a dummy variable indicating that a mine applied for clearanceafter the date of the EC notification on September 14, 2006.
31

Table 5: Impacts of public hearing reform on deforestation at mines
(1) (2) (3) (4) (5) (6) (7)∆median EVI Deforest year (rel. to clear) Prob. of compliance
Treatment 0.002 0.004 0.004 -0.342 0.173 -0.207 -0.099(0.02) (0.02) (0.02) (1.09) (1.00) (0.15) (0.16)
Post notif. -0.004 -0.001 0.000 -1.782*** -1.338** -0.283*** -0.190*(0.02) (0.02) (0.02) (0.59) (0.65) (0.09) (0.11)
Treatment * post notif. 0.016 0.013 0.012 1.195 0.174 0.260 0.075(0.02) (0.02) (0.02) (1.15) (1.24) (0.19) (0.20)
Log area -0.002 -0.000 0.001 1.782* 2.297*** 0.304* 0.366**(0.01) (0.01) (0.01) (0.93) (0.82) (0.16) (0.15)
Log prod cap (TPA) -0.002 -0.002 -0.822*** -0.117***(0.00) (0.00) (0.19) (0.03)
Application type (Base = new mine)Existing mine 0.001 -0.003 -0.454 0.040
(0.01) (0.01) (1.01) (0.17)Area/capacity enhancement 0.000 -0.000 -0.361 -0.019
(0.01) (0.01) (0.65) (0.14)
Mine type (Riverbed = 1) -0.010 -0.008 -2.632*** -0.754***(0.01) (0.02) (0.55) (0.22)
Cleared before -0.002 -0.003 0.586 0.229(0.01) (0.01) (0.49) (0.14)
Queue length -0.000 0.003 -0.001(0.00) (0.01) (0.00)
Letter lists more than 1 district 0.004 1.191** 0.182(0.01) (0.58) (0.14)
Violation 0.044** 4.241*** 0.548***(0.02) (0.59) (0.11)
Nr. observations 116 116 116 70 70 70 70R2 0.031 0.041 0.067 0.132 0.406 0.147 0.350Adj. R2 -0.004 -0.040 -0.042 0.079 0.280 0.095 0.213
Note: Robust standard errors are given in parentheses. Significant coefficients are denoted with starsas follows: *** p<0.01, ** p<0.05, and * p<0.1. The sample is restricted to mines of area less than 50ha. Post notif. is a dummy variable indicating that a mine applied for clearance after the date of theEC notification on September 14, 2006.
Furthermore, we find no evidence that the public hearing requirement significantly altered mines’environmental compliance. First, consider the extent of deforestation at mines. We find neither anysignificant change in mine deforestation around the date of the 2006 notification for control mines norany differential change for treatment mines. We do find that mines that applied for clearance after the2006 notification deforested significantly earlier relative to their date of clearance, deforesting an averageof about 1.8 years earlier relative to clearance. In the same vein, we estimate that post-notification mineswere significantly less likely to comply with the requirement that mines deforest only after receivingclearance. That is, we find that an additional 28% of mines deforested early among those that appliedfor clearance after the 2006 notification relative to those that applied before. This shift, which we cannotinterpret causally, is somewhat surprising given that the clearance process appears to have sped up
32

following the 2006 notification. While we find this overall time trend, however, we find no evidence thatthe expanded public hearing requirement significantly altered mines’ probability of deforesting early.
Overall, we have found no evidence to suggest that public hearings significantly altered either thecosts of the clearance process, as measured by mine costs and the duration of the process, or its benefits,which we measure as the impacts of mines on forest cover. We must maintain a certain degree of cautionin interpreting these results. As we noted earlier, for example, our measures of clearance costs may beimprecise: mine capital costs are imprecisely estimated, and our measure of duration does not includethe public hearing itself. Next, our analysis is limited in that it can only detect short term impacts of theexpansion of public hearings under the 2006 reforms, since we are limited to analyzing these impacts offof mines that applied for clearance before state-level clearance bodies were established. Next, we cannotassess the full range of benefits that we might expect to arise from the public hearing requirement. Whilewe can assess its impact on environmental outcomes, we might expect forced public consultation toincrease mines’ other benefits to nearby communities, like increasing local employment or investmentsin local schools or health centers, for example.
7 Conclusion
This paper documents the strategic behavior adopted by mines in response to changes in environmen-tal regulation in India. We find evidence of a strong distortion in the distribution of mine size towardssmaller areas that were waived of the regulatory burden. We observe a sharp and long-lasting increase inthe proportion of mines of area below 5 hectares, which were exempt of the EC process, and a simultane-ous decrease in the proportion of mines of area between 5 and 25 hectares, which got subjected to stricterregulation starting with the 2006 Reform. The visible selection in mine application trends suggests thatmine proponents perceived the reforms to be substantial and costly.
The distortion of the size distribution of mines could also have environmental impacts both becausesmall mines are not subject to the formal regulatory environmental protection process, and becausesmaller mines may be less able to afford environmentally safe production technology. We find that thisis indeed the case - small mines are associated with relatively greater reduction in vegetative cover indistricts, as compared to larger mines. It is probable that this is not a function of the state of the minedarea itself, but occurs because large mines subject to environmental regulation are required to engage incompensatory afforestation activity.
For larger mines that did not opt for lease splitting, and remained in the regulated size category andwent through the EC process, we have found no evidence to suggest that the requirement for publichearings significantly altered either the costs of the clearance process, as measured by mine costs andthe duration of the process, or its environmental consequences, which we measure as the impacts ofmines on forest cover. We must maintain a certain degree of caution in interpreting these results. Aswe noted earlier, for example, our measures of clearance costs may be imprecise: mine capital costs areimprecisely estimated, and our measure of duration does not include the public hearing itself. Next, ouranalysis is limited in that it can only detect short term impacts of the expansion of public hearings under
33

the 2006 reforms, since we are limited to analyzing these impacts off of mines that applied for clearancebefore state-level clearance bodies were established. Next, we cannot assess the full range of benefitsthat we might expect to arise from the public hearing requirement. While we can assess its impact onenvironmental outcomes, we might expect forced public consultation to increase mines’ other benefits tonearby communities, like increasing local employment or investments in local schools or health centers,for example.
However, we do find evidence that after the EC reform the environmental clearance process lookless time. We also find evidence of strategic behavior among the larger mines that did not opt for leasesplitting, but remained in the regulated size category. Post-reform, the clearing of forests takes placeearlier than in the pre-reform period, on average about 16 months before the environmental clearanceis granted. As the duration of the clearance process was one average of less than a year, this indicatesthat land clearing may prior to the EC application or that mine owners opted for less vegetated landwhen purchasing the mining lease. One reason might be that operating conditions associated with en-vironmental approvals are typically a function of the pre-existing state of land. Lower quality baselinesmay therefore reduce regulatory requirements. If the 2006 reform did indeed induce earlier deforesta-tion among applicants, this poses a real environmental cost, since any additional year of forest presencemeans environmental benefits like carbon dioxide capture and other pollution reductions.
Our results reaffirm that ensuring that new policies work as intended requires not just establishingthem, but also implementing them well. In India, anecdotal evidence suggests that the public hearingsmay be ineffectual tools for public consultation because they are often inaccessible to affected popula-tions and are held as mere formalities. Enforcing particular details, like advertising the hearings well inadvance, holding the hearings at convenient locations and times, and making information on environ-mental risks clear and accessible, may be crucial to ensuring effective public engagement in the clearanceprocess.
34

A Appendix
Figure A.1: Total mine lease area granted by size of mine. Source: own illustration based on data from the IndianBureau of Mines.
35

Table A.1: Post- and pre-reform time trends in leased area by category
(1) (2) (3) (4) (5) (6)Total lease area Lease area < 5 ha Lease area 5-15 ha
Year -434.6 263325.3 25.4 11777.5 48.7* -46065.0(286.7) (416281.0) (53.9) (79634.4) (26.5) (36652.5)
Post-reform 2201782.7** 87487.1 332412.3* 238207.3 234662.1*** 604309.1*(813156.9) (3439601.0) (152944.6) (657994.5) (75214.6) (302848.6)
Post-reform * year -1094.7** -40.4 -165.1* -118.2 -117.2*** -301.5*(405.5) (1715.1) (76.3) (328.1) (37.5) (151.0)
Year2 -65.9 -2.9 11.5(104.0) (19.9) (9.2)
Post-reform * year2 0.0 0.0 0.0(.) (.) (.)
Nr. observations 16 16 16 16 16 16R2 0.735 0.744 0.681 0.682 0.762 0.792
Note: Significant coefficients are denoted with stars as follows: *** p<0.01, ** p<0.05,and * p<0.1.
36

B McCrary tests for discontinuities in the distribution of area size
Figure B.1: McCrary tests of density discontinuity at the 5 and 25 ha cutoffs before and after the 2006 EC Reform.Source: own illustration based on data from the Indian Bureau of Mines.
37

Figure B.2: Distributions of non-coal mine leases in India, pre- and post the 2006 Environmental Clearance reformby mineral. The pre-reform period spans over 1998 - 2005; the post-reform period spans over 2006 - 2013. Theselected minerals are the top 8 most numerous in the sample. Source: own illustration based on data from theIndian Bureau of Mines.
38

Figure B.3: Distributions of non-coal mine leases in India, pre- and post the 2006 Environmental Clearance reformby state. The pre-reform period spans over 1998 - 2005; the post-reform period spans over 2006 - 2013. The selectedstates are the top 6 most populated in the sample. Source: own illustration based on data from the Indian Bureauof Mines.
39

References
Dudka, S. and Adriano, D. C. (1997). Environmental impacts of metal ore mining and processing: a review. Journal of environ-mental quality, 26(3):590–602.
Duflo, E., Greenstone, M., Pande, R., and Ryan, N. (2013). Truth-telling by Third-party Auditors and the Response of PollutingFirms: Experimental Evidence from India*. The Quarterly Journal of Economics, 128(4):1499–1545.
Greenstone, M., Nilekani, J., Pande, R., Sudarshan, A., Sugathan, A., and Ryan, N. (2015). Lower Pollution, Longer Lives: LifeExpectancy Gains if India Reduced Particulate Matter Pollution. Economic and Political Weekly, 50(8):40–46.
Landrigan, P. J., Fuller, R., Acosta, N. J., Adeyi, O., Arnold, R., Balde, A. B., Bertollini, R., Bose-O’Reilly, S., Boufford, J. I.,Breysse, P. N., et al. (2017). The lancet commission on pollution and health. The Lancet.
Rights and Resources (2016). Land Disputes and Stalled Investments in India.
World Bank and International Finance Corporation (2002). Mining and development. treasure or trouble? mining in developingcountries. Published online.
40