Learning Visual Importance for Graphic Designs and Data...
13
Learning Visual Importance for Graphic Designs and Data Visualizations Zoya Bylinskii 1 Nam Wook Kim 2 Peter O’Donovan 3 Sami Alsheikh 1 Spandan Madan 2 Hanspeter Pfister 2 Fredo Durand 1 Bryan Russell 4 Aaron Hertzmann 4 1 MIT CSAIL, Cambridge, MA USA {zoya,alsheikh,fredo}@mit.edu 2 Harvard SEAS, Cambridge, MA USA {namwkim,spandan_madan,pfister}@seas.harvard.edu 3 Adobe Systems, Seattle, WA USA {podonova}@adobe.com 4 Adobe Research, San Francisco, CA USA {hertzman,brussell}@adobe.com ABSTRACT Knowing where people look and click on visual designs can provide clues about how the designs are perceived, and where the most important or relevant content lies. The most im- portant content of a visual design can be used for effective summarization or to facilitate retrieval from a database. We present automated models that predict the relative importance of different elements in data visualizations and graphic designs. Our models are neural networks trained on human clicks and importance annotations on hundreds of designs. We collected a new dataset of crowdsourced importance, and analyzed the predictions of our models with respect to ground truth impor- tance and human eye movements. We demonstrate how such predictions of importance can be used for automatic design retargeting and thumbnailing. User studies with hundreds of MTurk participants validate that, with limited post-processing, our importance-driven applications are on par with, or out- perform, current state-of-the-art methods, including natural image saliency. We also provide a demonstration of how our importance predictions can be built into interactive design tools to offer immediate feedback during the design process. ACM Classification Keywords H.5.1 Information Interfaces and Presentation: Multimedia Information Systems Author Keywords Saliency; Computer Vision; Machine Learning; Eye Tracking; Visualization; Graphic Design; Deep Learning; Retargeting. INTRODUCTION A crucial goal of any graphic design or data visualization is to communicate the relative importance of different design elements, so that the viewer knows where to focus attention and how to interpret the design. In other words, the design Permission to make digital or hard copies of all or part of this work for personal or classroom use is granted without fee provided that copies are not made or distributed for profit or commercial advantage and that copies bear this notice and the full citation on the first page. Copyrights for components of this work owned by others than ACM must be honored. Abstracting with credit is permitted. To copy otherwise, or republish, to post on servers or to redistribute to lists, requires prior specific permission and/or a fee. Request permissions from [email protected]. UIST 2017, October 22–25, 2017, Quebec City, QC, Canada © 2017 ACM. ISBN 978-1-4503-4981-9/17/10. . . $15.00 DOI: https://doi.org/10.1145/3126594.3126653 Figure 1. We present two neural network models trained on crowd- sourced importance. We trained the graphic design model using a dataset of 1K graphic designs with GDI annotations [33]. For training the data visualization model, we collected mouse clicks using the Bubble- View methodology [22] on 1.4K MASSVIS data visualizations [3]. Both networks successfully predict ground truth importance and can be used for applications such as retargeting, thumbnailing, and interactive de- sign tools. Warmer colors in our heatmaps indicate higher importance. should provide an effective management of attention [39]. Un- derstanding how viewers perceive a design could be useful for many stages of the design process; for instance, to pro- vide feedback [40]. Automatic understanding can help build tools to search, retarget, and summarize information in de- signs and visualizations. Though saliency prediction in natural images has recently become quite effective, there is little work in importance prediction for either graphic designs or data visualizations. Our online demo, video, code, data, trained models, and supplemen- tal material are available at visimportance.csail.mit.edu.
-
Upload
hoangkhanh -
Category
Documents
-
view
215 -
download
0
Transcript of Learning Visual Importance for Graphic Designs and Data...

Learning Visual Importancefor Graphic Designs and Data Visualizations
Zoya Bylinskii1 Nam Wook Kim2 Peter O’Donovan3 Sami Alsheikh1 Spandan Madan2
Hanspeter Pfister2 Fredo Durand1 Bryan Russell4 Aaron Hertzmann4
1 MIT CSAIL, Cambridge, MA USA {zoya,alsheikh,fredo}@mit.edu2 Harvard SEAS, Cambridge, MA USA {namwkim,spandan_madan,pfister}@seas.harvard.edu
3 Adobe Systems, Seattle, WA USA {podonova}@adobe.com4 Adobe Research, San Francisco, CA USA {hertzman,brussell}@adobe.com
ABSTRACTKnowing where people look and click on visual designs canprovide clues about how the designs are perceived, and wherethe most important or relevant content lies. The most im-portant content of a visual design can be used for effectivesummarization or to facilitate retrieval from a database. Wepresent automated models that predict the relative importanceof different elements in data visualizations and graphic designs.Our models are neural networks trained on human clicks andimportance annotations on hundreds of designs. We collecteda new dataset of crowdsourced importance, and analyzed thepredictions of our models with respect to ground truth impor-tance and human eye movements. We demonstrate how suchpredictions of importance can be used for automatic designretargeting and thumbnailing. User studies with hundreds ofMTurk participants validate that, with limited post-processing,our importance-driven applications are on par with, or out-perform, current state-of-the-art methods, including naturalimage saliency. We also provide a demonstration of how ourimportance predictions can be built into interactive designtools to offer immediate feedback during the design process.
ACM Classification KeywordsH.5.1 Information Interfaces and Presentation: MultimediaInformation Systems
Author KeywordsSaliency; Computer Vision; Machine Learning; Eye Tracking;Visualization; Graphic Design; Deep Learning; Retargeting.
INTRODUCTIONA crucial goal of any graphic design or data visualization isto communicate the relative importance of different designelements, so that the viewer knows where to focus attentionand how to interpret the design. In other words, the design
Permission to make digital or hard copies of all or part of this work for personal orclassroom use is granted without fee provided that copies are not made or distributedfor profit or commercial advantage and that copies bear this notice and the full citationon the first page. Copyrights for components of this work owned by others than ACMmust be honored. Abstracting with credit is permitted. To copy otherwise, or republish,to post on servers or to redistribute to lists, requires prior specific permission and/or afee. Request permissions from [email protected].
UIST 2017, October 22–25, 2017, Quebec City, QC, Canada
© 2017 ACM. ISBN 978-1-4503-4981-9/17/10. . . $15.00
DOI: https://doi.org/10.1145/3126594.3126653
Figure 1. We present two neural network models trained on crowd-sourced importance. We trained the graphic design model using adataset of 1K graphic designs with GDI annotations [33]. For trainingthe data visualization model, we collected mouse clicks using the Bubble-View methodology [22] on 1.4K MASSVIS data visualizations [3]. Bothnetworks successfully predict ground truth importance and can be usedfor applications such as retargeting, thumbnailing, and interactive de-sign tools. Warmer colors in our heatmaps indicate higher importance.
should provide an effective management of attention [39]. Un-derstanding how viewers perceive a design could be usefulfor many stages of the design process; for instance, to pro-vide feedback [40]. Automatic understanding can help buildtools to search, retarget, and summarize information in de-signs and visualizations. Though saliency prediction in naturalimages has recently become quite effective, there is little workin importance prediction for either graphic designs or datavisualizations.
Our online demo, video, code, data, trained models, and supplemen-tal material are available at visimportance.csail.mit.edu.

Figure 2. We show an interactive graphic design application using our model that lets users change and visualize the importance values of elements.Users can move and resize elements, as well as change color, font, and opacity, and see the updated realtime importance predictions. For instance, a userchanges the color of the text to the left of the runner to increase its importance (middle panel). The rightmost panel includes a few additional changesto the size, font, and placement of the text elements to modify their relative importance scores. A demo is available at visimportance.csail.mit.edu.
We use “importance” as a generic term to describe the per-ceived relative weighting of design elements. Image saliency,which has been studied extensively, is a form of importance.However, whereas traditional notions of saliency refer tobottom-up, pop-out effects, our notion of importance can alsodepend on higher-level factors such as the semantic categoriesof design elements (e.g., title text, axis text, data points).
This paper presents a new importance prediction method forgraphic designs and data visualizations. We use a state-of-the-art deep learning architecture, and train models on twotypes of crowdsourced importance data: graphic design im-portance (GDI) annotations [33] and a dataset of BubbleViewclicks [22] we collected on data visualizations.
Our importance models take input designs in bitmap form. Theoriginal vector data is not required. As a result, the modelsare agnostic to the encoding format of the image and can beapplied to existing libraries of bitmap designs. Our modelspick up on some of the higher-level trends in ground truthhuman annotations. For instance, across a diverse collectionof visualizations and designs, our models learn to localize thetitles and correctly weight the relative importance of differentdesign elements (Fig. 1).
We show how the predicted importance maps can be used asa common building block for a number of different applica-tions, including retargeting and thumbnailing. Our predictionsbecome inputs to cropping and seam carving with almost noadditional post-processing. Despite the simplicity of the ap-proach, our retargeting and thumbnailing results are on parwith, or outperform, related methods, as validated by a set ofuser studies launched on Amazon’s Mechanical Turk (MTurk).Moreover, an advantage of the fast test-time performance ofneural networks makes it feasible for our predictions to beintegrated into interactive design tools (Fig. 2). With anotherset of user studies, we validate that our model generalizesto fine-grained design variations and correctly predicts howimportance is affected by changes in element size and locationon a design.
Contributions: We present two neural network models forpredicting importance: in graphic designs and data visualiza-tions. This is the first time importance prediction is introducedfor data visualizations. For this purpose, we collected a datasetof BubbleView clicks on 1,411 data visualizations. We alsoshow that BubbleView clicks are related to explicit importanceannotations [33] on graphic designs. We collected importanceannotations for 264 graphic designs with fine-grained varia-tions in the spatial arrangement and sizes of design elements.We demonstrate how our importance predictions can be usedfor retargeting and thumbnailing, and include user studies tovalidate result quality. Finally, we provide a working interac-tive demo.
RELATED WORKDesigners and researchers have long studied eye movementsas a clue to understanding the perception of interfaces [9, 16].There have also been several recent studies of eye movementsand the perception of designs [2, 12]. However, measuringeye movements is an expensive and time-consuming process,and is rarely feasible for practical applications.
Few researchers have attempted to automatically predict im-portance in graphic designs. The DesignEye system [40] useshand-crafted saliency methods, demonstrating that saliencymethods can provide valuable feedback in the context of a de-sign application. O’Donovan et al. [33] gather crowdsourcedimportance annotations, where participants are asked to maskout the most important design regions. They train a predic-tor from these annotations. However, their method requiresknowledge of the location of design elements to run on a newdesign. Haass et al. [11] test three natural image saliencymodels on the MASSVIS data visualizations [3], conclud-ing that, across most saliency metrics, these models performsignificantly worse on visualizations than on natural images.Several models also exist for web page saliency. However,most methods use programmatic elements (e.g., the DOM)as input to saliency estimation rather than allowing bitmapimages as input [4, 47]. Pang et al. predict the order in whichpeople will look at components on a webpage [36] by making
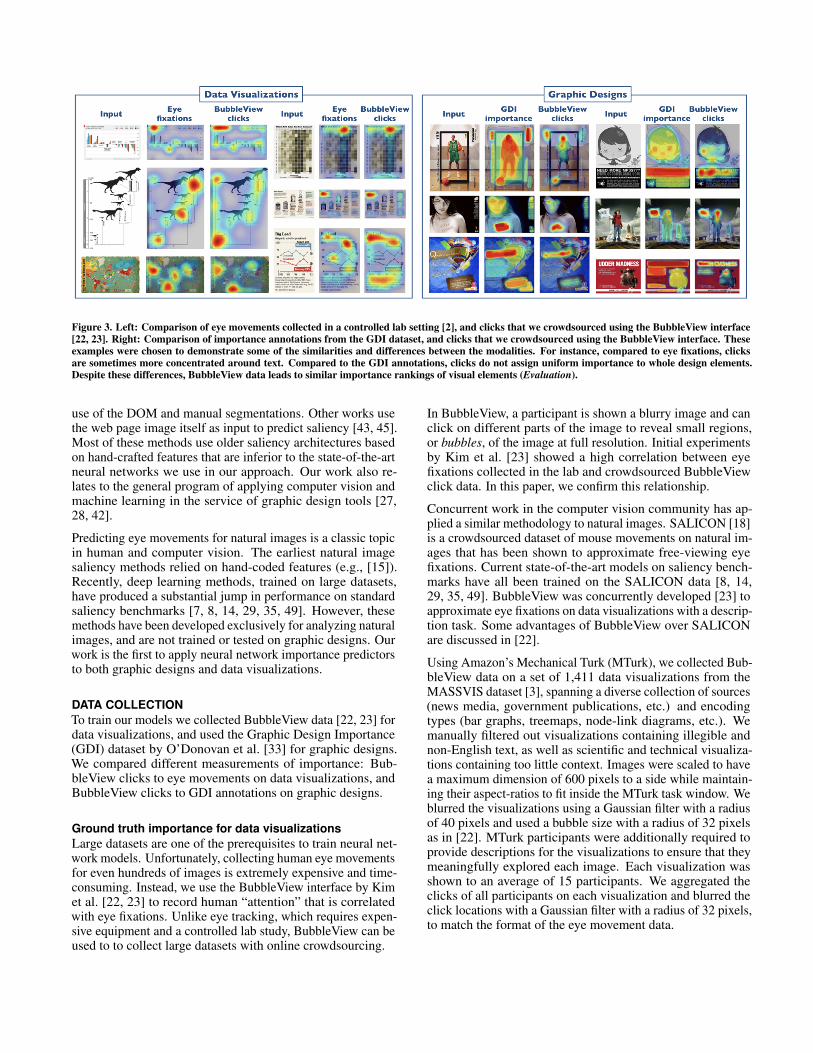
Figure 3. Left: Comparison of eye movements collected in a controlled lab setting [2], and clicks that we crowdsourced using the BubbleView interface[22, 23]. Right: Comparison of importance annotations from the GDI dataset, and clicks that we crowdsourced using the BubbleView interface. Theseexamples were chosen to demonstrate some of the similarities and differences between the modalities. For instance, compared to eye fixations, clicksare sometimes more concentrated around text. Compared to the GDI annotations, clicks do not assign uniform importance to whole design elements.Despite these differences, BubbleView data leads to similar importance rankings of visual elements (Evaluation).
use of the DOM and manual segmentations. Other works usethe web page image itself as input to predict saliency [43, 45].Most of these methods use older saliency architectures basedon hand-crafted features that are inferior to the state-of-the-artneural networks we use in our approach. Our work also re-lates to the general program of applying computer vision andmachine learning in the service of graphic design tools [27,28, 42].
Predicting eye movements for natural images is a classic topicin human and computer vision. The earliest natural imagesaliency methods relied on hand-coded features (e.g., [15]).Recently, deep learning methods, trained on large datasets,have produced a substantial jump in performance on standardsaliency benchmarks [7, 8, 14, 29, 35, 49]. However, thesemethods have been developed exclusively for analyzing naturalimages, and are not trained or tested on graphic designs. Ourwork is the first to apply neural network importance predictorsto both graphic designs and data visualizations.
DATA COLLECTIONTo train our models we collected BubbleView data [22, 23] fordata visualizations, and used the Graphic Design Importance(GDI) dataset by O’Donovan et al. [33] for graphic designs.We compared different measurements of importance: Bub-bleView clicks to eye movements on data visualizations, andBubbleView clicks to GDI annotations on graphic designs.
Ground truth importance for data visualizationsLarge datasets are one of the prerequisites to train neural net-work models. Unfortunately, collecting human eye movementsfor even hundreds of images is extremely expensive and time-consuming. Instead, we use the BubbleView interface by Kimet al. [22, 23] to record human “attention” that is correlatedwith eye fixations. Unlike eye tracking, which requires expen-sive equipment and a controlled lab study, BubbleView can beused to to collect large datasets with online crowdsourcing.
In BubbleView, a participant is shown a blurry image and canclick on different parts of the image to reveal small regions,or bubbles, of the image at full resolution. Initial experimentsby Kim et al. [23] showed a high correlation between eyefixations collected in the lab and crowdsourced BubbleViewclick data. In this paper, we confirm this relationship.
Concurrent work in the computer vision community has ap-plied a similar methodology to natural images. SALICON [18]is a crowdsourced dataset of mouse movements on natural im-ages that has been shown to approximate free-viewing eyefixations. Current state-of-the-art models on saliency bench-marks have all been trained on the SALICON data [8, 14,29, 35, 49]. BubbleView was concurrently developed [23] toapproximate eye fixations on data visualizations with a descrip-tion task. Some advantages of BubbleView over SALICONare discussed in [22].
Using Amazon’s Mechanical Turk (MTurk), we collected Bub-bleView data on a set of 1,411 data visualizations from theMASSVIS dataset [3], spanning a diverse collection of sources(news media, government publications, etc.) and encodingtypes (bar graphs, treemaps, node-link diagrams, etc.). Wemanually filtered out visualizations containing illegible andnon-English text, as well as scientific and technical visualiza-tions containing too little context. Images were scaled to havea maximum dimension of 600 pixels to a side while maintain-ing their aspect-ratios to fit inside the MTurk task window. Weblurred the visualizations using a Gaussian filter with a radiusof 40 pixels and used a bubble size with a radius of 32 pixelsas in [22]. MTurk participants were additionally required toprovide descriptions for the visualizations to ensure that theymeaningfully explored each image. Each visualization wasshown to an average of 15 participants. We aggregated theclicks of all participants on each visualization and blurred theclick locations with a Gaussian filter with a radius of 32 pixels,to match the format of the eye movement data.

We used the MASSVIS eye movement data for testing ourimportance predictions. Fixation maps were created by aggre-gating eye fixation locations of an average of 16 participantsviewing each visualization for 10 seconds. Fixation locationswere Gaussian filtered with a blur radius of 32 pixels. Fig. 3aincludes a comparison of the BubbleView click maps to eyefixation maps from the MASSVIS dataset.
Ground truth importance for graphic designsWe used the Graphic Design Importance (GDI) dataset [33]which comes with importance annotations for 1,078 graphicdesigns from Flickr. Thirty-five MTurk participants wereasked to label important regions in a design using binarymasks, and their annotations were averaged. Participants werenot given any instruction as to the meaning of “importance.”To determine how BubbleView clicks relate to explicit im-portance annotations, we ran the BubbleView study on thesegraphic designs and collected data from an average of 15 par-ticipants per design. Fig. 3b shows comparisons between theGDI annotations and BubbleView click maps. In both datasimilar elements and regions of designs emerge as important.
Each representation has potential advantages. The GDI an-notations assign a more uniform importance score to wholeelements. This can serve as a soft segmentation to facilitatedesign applications like retargeting. BubbleView maps maybe more appropriate for directly modeling human attention.
MODELS FOR PREDICTING IMPORTANCEGiven a graphic design or data visualization, our task is topredict the importance of the content at each pixel location.We assume the input design/visualization is a bitmap image.The output importance prediction at each pixel i is Pi ∈ [0,1],where larger values indicate higher importance. We approachthis problem using deep learning, which has lead to manyrecent breakthroughs on a variety of image processing tasks inthe computer vision community [25, 38], including the closelyrelated task of saliency modeling.
Similar to some top-performing saliency models for naturalimages [14, 26], our architecture is based on fully convolu-tional networks (FCNs) [32]. FCNs are specified by a directedacyclic graph of linear (e.g., convolution) and nonlinear (e.g.,max pool, ReLU) operations over the pixel grid, and a set ofparameters for the operations. The network parameters areoptimized over a loss function given a labeled training dataset.We refer the reader to Long et al. [32] for more details.
We predict real-valued importance using a different trainingloss function from the original FCN work, which predicteddiscrete object classes. Given ground truth importances ateach pixel i, Qi ∈ [0,1], we optimize the sigmoid cross entropyloss for FCN model parameters Θ over all pixels i = 1, . . . ,N:
L(Θ) =− 1N
N
∑i=1
(Qi logPi +(1−Qi) log(1−Pi)) (1)
where Pi = σ ( fi(Θ)) is the output prediction of the FCN fi(Θ)
composed with the sigmoid function σ(x) = (1+ exp(−x))−1.Note that the same loss is used for binary classification, whereQi ∈ {0,1}. Here, we extend it to real-valued Qi ∈ [0,1].
Figure 4. We increase the precision of our FCN-32s predictions by com-bining output from the final layer of the network with outputs fromlower levels. The resulting predictions, FCN-16s and FCN-8s, capturefiner details. We found FCN-16s sufficient for our model for graphic de-signs, as FCN-8s did not add a performance boost. For our model fordata visualizations, we found no performance gains beyond FCN-32s.
We use a different loss than other saliency models based onneural networks that optimize Euclidean [26, 34], weightedEuclidean [8], or binary classification losses [29, 49]. Our lossis better suited to [0,1] values, and is equivalent to optimizingthe KL loss commonly used for saliency evaluation.
We trained separate networks for data visualizations and forgraphic designs. For the data visualizations, we split the 1.4KMASSVIS images for which we collected BubbleView clickdata into 1,209 training images and 202 test images. For thetest set we chose MASSVIS images for which eye movementsare available [2]. For the graphic designs, we split the 1,078GDI images into 862 training images and 216 test images(80-20% split). We used the GDI annotations [33] for training.We found that training on the GDI annotations rather than theBubbleView clicks on graphic designs facilitated the designapplications better, since the GDI annotations were betteraligned to element boundaries.
Model details: We converted an Oxford VGG-16 convolu-tional neural network [44] to an FCN-32s model via networksurgery using the implementation in Caffe [17]. The model’spredictions are 1/32 of the input image resolution, due tosuccessive pooling layers. To increase the resolution of thepredictions and capture fine details, we followed the procedurein Long et al. [32] to add skip connections from earlier layersto form FCN-16s and FCN-8s models, that are respectively,1/16 and 1/8 of the input image resolution. We found that theFCN-16s (with a single skip connection from pool4) improvedthe graphic design importance maps relative to the FCN-32smodel (Fig. 4), but that adding an additional skip connectionfrom pool3 (FCN-8s) performed similarly. We found that skip

connections lead to no gains for the data visualization impor-tance. For our experiments we used the trained FCN-16s forgraphic designs and the FCN-32s for data visualizations.
Since we have limited training data we initialized the networkparameters with the pre-trained FCN32s model for semanticsegmentation in natural images [32], and fine-tuned it for ourtask. The convolutional layers at the end of the network and theskip connections were randomly initialized. Training detailsare provided in the Supplemental Material.
We opted for a smaller architecture with fewer parameters thansome other neural network saliency models for natural images.This makes our model more effective for our datasets, whichare currently an order-of-magnitude smaller than the naturalimage saliency datasets.
EVALUATION OF MODEL PREDICTIONSWe compare the performance of our two importance modelsto ground truth importance on each dataset. For data visual-izations, we compare predicted importance maps to bubbleclicks gathered using BubbleView, and to eye fixations fromthe MASSVIS dataset. For graphic designs, we compare pre-dicted importance maps to GDI annotations.
Evaluation criteriaWe evaluate the similarity of our predicted and ground truth im-portance maps using two metrics commonly used for saliencyevaluation [6]: Kullback-Leibler divergence (KL) and crosscorrelation (CC). CC measures how correlated the pixel-wisevalues are in the two maps, and treats both false positives andfalse negatives equally. KL, however, measures how well onedistribution predicts another. Our importance maps can beinterpreted as providing, for each pixel, the probability thatthe pixel would be considered important by ground truth ob-servers. KL highly penalizes missed predictions, so a sparsemap that fails to predict a ground truth important location willreceive a large KL value (poor score). Given the ground truthimportance map Q and the predicted importance map P, KL iscomputed as:
KL(P,Q) =N
∑i=1
(Qi logQi−Qi logPi) = L(P,Q)−H(Q), (2)
where H(Q) =−∑Ni=1 (Qi logQi) is the entropy of the ground
truth importance map and L(P,Q) is the cross entropy of theprediction and ground truth. Note the similarity to the lossin Equation (1), which is over a Bernoulli random variable;here the random variable is instantiated. A large KL diver-gence indicates a high dissimilarity between maps, whereasKL(P,Q) = 0 indicates two maps are identical. KL is in prin-ciple unbounded, so to provide a feasible range, we includechance baselines in our experiments. CC is computed as:
CC(P,Q) =1N ∑
Ni=1 (Pi− P̄)
(Qi− Q̄
)√1N ∑
Ni=1 (Pi− P̄)2
√1N ∑
Ni=1(Qi− Q̄
)2, (3)
where P̄ = 1N ∑
Ni=1 Pi, and respectively for Q. CC ranges from
-1 to 1, where 1 indicates maximal correlation between twomaps P and Q. For further intuition about how KL and CC
Model CC score ↑ KL score ↓Chance 0.00 0.75
Judd [21] 0.11 0.49DeepGaze [29] 0.57 3.48
Our model 0.69 0.33Table 1. How well can our importance model predict the BubbleViewclick maps? We add comparisons to two other top-performing saliencymodels and a chance baseline. Scores are averaged over 202 test datavisualizations. A higher CC score and lower KL score are better.
Model CC score ↑ KL score ↓Chance 0.00 1.08
Judd [21] 0.19 0.74DeepGaze [29] 0.53 3.10
Our model 0.54 0.63Bubble clicks 0.79 0.28
Table 2. How well can human eye fixations be predicted? We mea-sured the similarity between human fixation maps and various predic-tors. Scores are averaged over 202 test data visualizations. A goodmodel achieves a high CC score and low KL score. Our neural networkmodel was trained on BubbleView click data, so that is the modality itcan predict best. Nevertheless, its predictions are also representative ofeye fixation data. As an upper bound on this prediction performance, weconsider how well the BubbleView click data predicts eye fixations, andas a lower bound, how well chance predicts eye fixations.
metrics score similarity, we provide scores above each im-age in Fig. 5, and additional examples in the SupplementalMaterial, showing high- and low-scoring predictions.
Prediction performance on data visualizationsWe include predictions from our importance model in Fig. 5.Notice how we correctly predict important regions in theground truth corresponding to titles, captions, and legends. Wequantitatively evaluate our approach on our collected datasetof BubbleView clicks. We report CC and KL scores averagedover our dataset of 202 test images in Table 1.
We compare against the following baselines: chance, Juddsaliency [21], and DeepGaze [29], a top neural networksaliency model trained on the SALICON dataset [18] of mousemovements on natural images. The chance baseline, used insaliency benchmarks [6, 20], is computed by uniformly sam-pling a real value between 0 and 1 at each image pixel. Ourapproach out-performs all baselines. KL is highly sensitive tofalse negatives and drastically penalizes sparser models [6]1,explaining the high KL values for DeepGaze in Table 1. Post-processing or directly optimizing models for specific metricscan yield more favorable performances [30].
How well does our neural network model, trained on clicks,predict eye fixations? We find that the predicted importanceis representative of eye fixation patterns as well (Table 2),although the difference in scores indicates that our modelmight be learning from patterns in the click data that aredifferent from fixations.
1Because of the sensitivity of KL to output regularization, we adviseagainst using it (solely) to compare models [6].
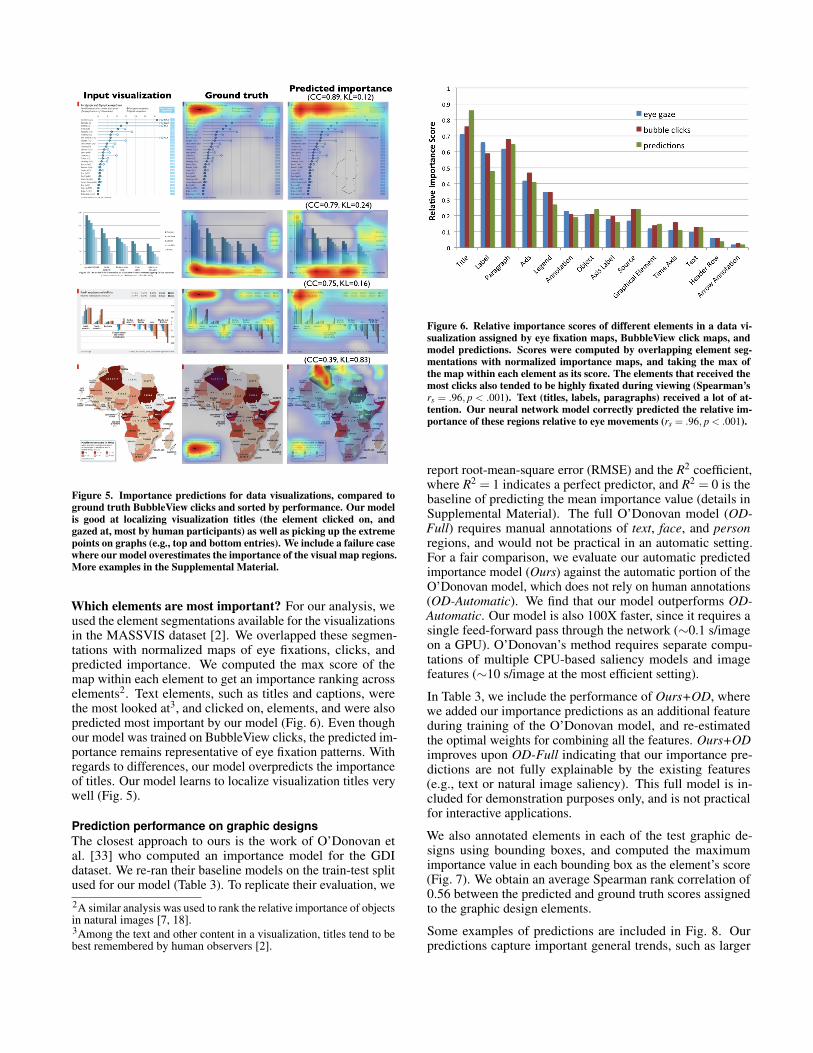
Figure 5. Importance predictions for data visualizations, compared toground truth BubbleView clicks and sorted by performance. Our modelis good at localizing visualization titles (the element clicked on, andgazed at, most by human participants) as well as picking up the extremepoints on graphs (e.g., top and bottom entries). We include a failure casewhere our model overestimates the importance of the visual map regions.More examples in the Supplemental Material.
Which elements are most important? For our analysis, weused the element segmentations available for the visualizationsin the MASSVIS dataset [2]. We overlapped these segmen-tations with normalized maps of eye fixations, clicks, andpredicted importance. We computed the max score of themap within each element to get an importance ranking acrosselements2. Text elements, such as titles and captions, werethe most looked at3, and clicked on, elements, and were alsopredicted most important by our model (Fig. 6). Even thoughour model was trained on BubbleView clicks, the predicted im-portance remains representative of eye fixation patterns. Withregards to differences, our model overpredicts the importanceof titles. Our model learns to localize visualization titles verywell (Fig. 5).
Prediction performance on graphic designsThe closest approach to ours is the work of O’Donovan etal. [33] who computed an importance model for the GDIdataset. We re-ran their baseline models on the train-test splitused for our model (Table 3). To replicate their evaluation, we2A similar analysis was used to rank the relative importance of objectsin natural images [7, 18].3Among the text and other content in a visualization, titles tend to bebest remembered by human observers [2].
Figure 6. Relative importance scores of different elements in a data vi-sualization assigned by eye fixation maps, BubbleView click maps, andmodel predictions. Scores were computed by overlapping element seg-mentations with normalized importance maps, and taking the max ofthe map within each element as its score. The elements that received themost clicks also tended to be highly fixated during viewing (Spearman’srs = .96, p < .001). Text (titles, labels, paragraphs) received a lot of at-tention. Our neural network model correctly predicted the relative im-portance of these regions relative to eye movements (rs = .96, p < .001).
report root-mean-square error (RMSE) and the R2 coefficient,where R2 = 1 indicates a perfect predictor, and R2 = 0 is thebaseline of predicting the mean importance value (details inSupplemental Material). The full O’Donovan model (OD-Full) requires manual annotations of text, face, and personregions, and would not be practical in an automatic setting.For a fair comparison, we evaluate our automatic predictedimportance model (Ours) against the automatic portion of theO’Donovan model, which does not rely on human annotations(OD-Automatic). We find that our model outperforms OD-Automatic. Our model is also 100X faster, since it requires asingle feed-forward pass through the network (∼0.1 s/imageon a GPU). O’Donovan’s method requires separate compu-tations of multiple CPU-based saliency models and imagefeatures (∼10 s/image at the most efficient setting).
In Table 3, we include the performance of Ours+OD, wherewe added our importance predictions as an additional featureduring training of the O’Donovan model, and re-estimatedthe optimal weights for combining all the features. Ours+ODimproves upon OD-Full indicating that our importance pre-dictions are not fully explainable by the existing features(e.g., text or natural image saliency). This full model is in-cluded for demonstration purposes only, and is not practicalfor interactive applications.
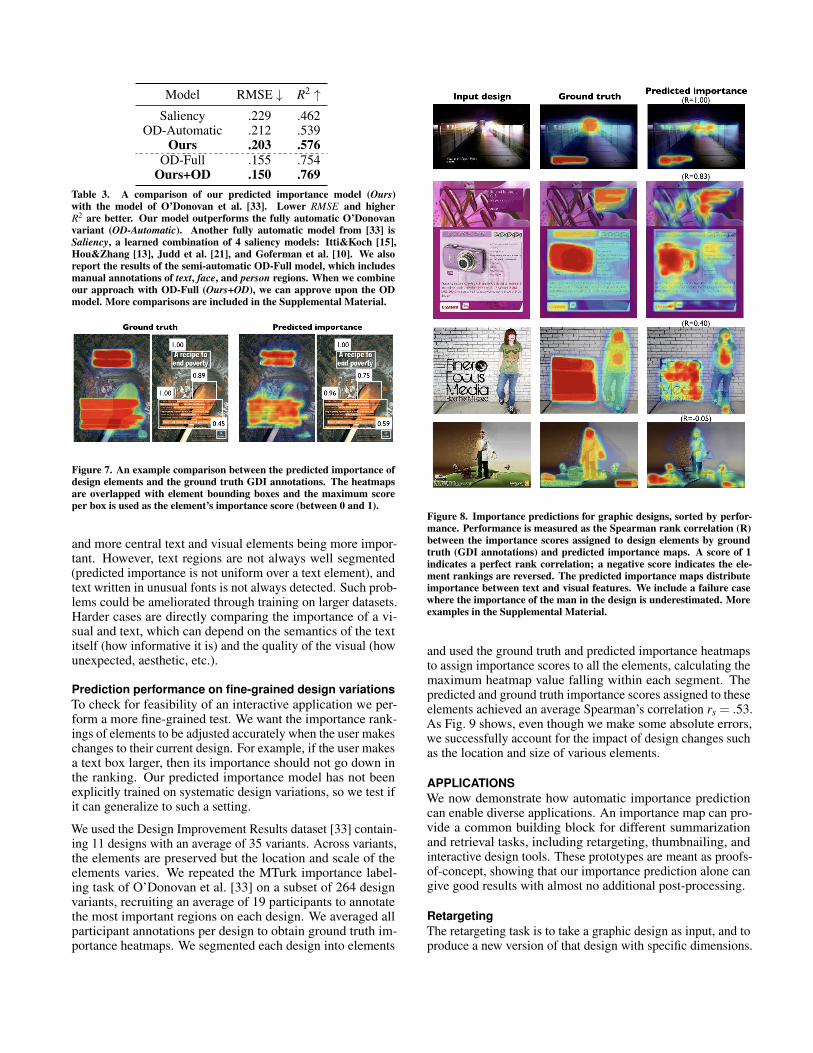
We also annotated elements in each of the test graphic de-signs using bounding boxes, and computed the maximumimportance value in each bounding box as the element’s score(Fig. 7). We obtain an average Spearman rank correlation of0.56 between the predicted and ground truth scores assignedto the graphic design elements.
Some examples of predictions are included in Fig. 8. Ourpredictions capture important general trends, such as larger
Model RMSE ↓ R2 ↑Saliency .229 .462
OD-Automatic .212 .539Ours .203 .576
OD-Full .155 .754Ours+OD .150 .769
Table 3. A comparison of our predicted importance model (Ours)with the model of O’Donovan et al. [33]. Lower RMSE and higherR2 are better. Our model outperforms the fully automatic O’Donovanvariant (OD-Automatic). Another fully automatic model from [33] isSaliency, a learned combination of 4 saliency models: Itti&Koch [15],Hou&Zhang [13], Judd et al. [21], and Goferman et al. [10]. We alsoreport the results of the semi-automatic OD-Full model, which includesmanual annotations of text, face, and person regions. When we combineour approach with OD-Full (Ours+OD), we can approve upon the ODmodel. More comparisons are included in the Supplemental Material.
Figure 7. An example comparison between the predicted importance ofdesign elements and the ground truth GDI annotations. The heatmapsare overlapped with element bounding boxes and the maximum scoreper box is used as the element’s importance score (between 0 and 1).
and more central text and visual elements being more impor-tant. However, text regions are not always well segmented(predicted importance is not uniform over a text element), andtext written in unusual fonts is not always detected. Such prob-lems could be ameliorated through training on larger datasets.Harder cases are directly comparing the importance of a vi-sual and text, which can depend on the semantics of the textitself (how informative it is) and the quality of the visual (howunexpected, aesthetic, etc.).
Prediction performance on fine-grained design variationsTo check for feasibility of an interactive application we per-form a more fine-grained test. We want the importance rank-ings of elements to be adjusted accurately when the user makeschanges to their current design. For example, if the user makesa text box larger, then its importance should not go down inthe ranking. Our predicted importance model has not beenexplicitly trained on systematic design variations, so we test ifit can generalize to such a setting.
We used the Design Improvement Results dataset [33] contain-ing 11 designs with an average of 35 variants. Across variants,the elements are preserved but the location and scale of theelements varies. We repeated the MTurk importance label-ing task of O’Donovan et al. [33] on a subset of 264 designvariants, recruiting an average of 19 participants to annotatethe most important regions on each design. We averaged allparticipant annotations per design to obtain ground truth im-portance heatmaps. We segmented each design into elements
Figure 8. Importance predictions for graphic designs, sorted by perfor-mance. Performance is measured as the Spearman rank correlation (R)between the importance scores assigned to design elements by groundtruth (GDI annotations) and predicted importance maps. A score of 1indicates a perfect rank correlation; a negative score indicates the ele-ment rankings are reversed. The predicted importance maps distributeimportance between text and visual features. We include a failure casewhere the importance of the man in the design is underestimated. Moreexamples in the Supplemental Material.
and used the ground truth and predicted importance heatmapsto assign importance scores to all the elements, calculating themaximum heatmap value falling within each segment. Thepredicted and ground truth importance scores assigned to theseelements achieved an average Spearman’s correlation rs = .53.As Fig. 9 shows, even though we make some absolute errors,we successfully account for the impact of design changes suchas the location and size of various elements.
APPLICATIONSWe now demonstrate how automatic importance predictioncan enable diverse applications. An importance map can pro-vide a common building block for different summarizationand retrieval tasks, including retargeting, thumbnailing, andinteractive design tools. These prototypes are meant as proofs-of-concept, showing that our importance prediction alone cangive good results with almost no additional post-processing.
RetargetingThe retargeting task is to take a graphic design as input, and toproduce a new version of that design with specific dimensions.

Figure 9. Sample input designs, and how the relative importance of the different design elements changes as they are moved, resized, and otherwisemodified. For instance, compared to in (a), the event date stands out more and gains importance when it occurs at the bottom of the poster, in largefont, on a contrasting background (b). Similarly, when the most important text of the design in (c) is moved to the upper righthand corner where it isnot surrounded by other text, it gains prominence (d). Our automatic model makes similar predictions of the relative importance of design elements asground truth human annotations.
Retargeting is a common task for modern designers, whomust work with many different output dimensions. Thereis a substantial amount of work on automatic retargeting fornatural images, e.g., [1, 41]. Several of these methods haveshown that saliency or gaze provide good cues for retargeting,to avoid cropping out image content that people are likely topay most attention to, such as faces in photographs.
The only previous work on retargeting graphic designs is byO’Donovan et al. [33]. They assumed knowledge of the under-lying vector representation of the design and used an expensiveoptimization with many different energy terms. The methodwe propose uses bitmap data as input, and is much simpler,without requiring any manual annotations of the input image.
Importance-based retargeting for graphic designs should pre-serve the most important regions of a design, such as the titleand key visual elements. Given a graphic design bitmap as in-put and specific dimensions, we use the predicted importancemap to automatically select a crop of the image with highestimportance (Fig. 10). Alternative variants of retargeting (e.g.,seam carving) are discussed in the Supplemental Material.
Evaluation: We ran MTurk experiments where 96 partici-pants were presented with a design and 6 retargeted variants,and were asked to score each variant using a 5-point Likertscale with 1 = very poor and 5 = very good (Fig. 11). Eachparticipant completed this task for 12 designs: 10 randomly se-lected from a collection of 216 designs, and another 2 designsused for quality control. We used this task to compare crops re-targeted using predicted importance to crops retargeted usingground truth GDI annotations, Judd saliency [21], DeepGazesaliency [29], and an edge energy map. We extracted a cropwith an aspect ratio of 1:4 from a design using the highest-
valued region, as assigned by each of the saliency/importancemaps. As a baseline, we selected a random crop location.
After an analysis of variance showed a significant effect ofretargeting method on score, we performed Bonferonni pairedt-tests on the scores of different methods. Across all 216 de-signs, crops obtained using ground truth GDI annotations hadthe highest score (Mean: 3.19), followed by DeepGaze (Mean:2.95) and predicted importance (Mean: 2.92). However, thedifference between the latter pair of models was not statisti-cally significant. Edge energy maps (Mean: 2.66) were worse,but not significantly; while Judd saliency (Mean: 2.47) and therandom crop baseline (Mean: 2.23) were significantly worsein pairwise comparisons with all the other methods (p < .01for all pairs). Results of additional experimental variants arereported in the Supplemental Material.
Our predicted importance outperforms Judd saliency, a naturalsaliency model commonly used for comparison [31, 33]. Juddsaliency has no notion of text. Predicted importance, trainedon less than 1K graphic design images, performs on par withDeepGaze, the currently top-performing neural network-basedsaliency model [5] which has been trained on 10K naturalimages, including images with text. Both significantly out-perform the edge energy map, which is a common baselinefor retargeting. These results show the potential use case ofpredicted importance for a retargeting task, even without anypost-processing steps.
ThumbnailingThumbnailing is similar to retargeting, but with a differentgoal. It aims to provide a visual summary for an image tomake it easier to find relevant images in a large collection[19, 46]. Unlike previous methods, our approach operates

directly on a bitmap input, rather than requiring a specializedrepresentation as input. For this example our domain is datavisualizations rather than graphic designs.
Given a data visualization and an automatically-computed im-portance map as input, we generate a thumbnail by carving outthe less important regions of the image. The importance mapis used as an energy function, whereby we iteratively removeimage regions with least energy first. Rows and columns ofpixels are removed until the desired proportions are achieved,in this case a square thumbnail. This is similar to seam carv-ing [1, 41], but using straight seams, found to work better inour setting. The boundaries of the remaining elements areblurred using the importance map as an alpha-mask with afade to white. Qualitatively, the resulting thumbnails consist oftitles and other main supporting text, as well as data extremes(from the top and bottom of a table, for instance, or from theleft and right sides of a plot).
Evaluation: We designed a task intended to imitate a searchthrough a database of visualizations. MTurk participants weregiven a description and a grid of 60 thumbnails, and wereinstructed to find the visualization that best matches the de-scription. We ran two versions of the study: with the originalvisualizations resized to thumbnails (Fig. 12a), and anotherwith our automatically-computed importance-based thumb-nails (Fig. 12b). We measured how many clicks it took forparticipants to find the visualization corresponding to the de-scription in each version.
A total of 400 participants were recruited for our study. Afterfiltering, we compared the performance of 200 participantswho performed the study with resized visualizations and 169participants who saw the importance-based thumbnails.
Each MTurk assignment, containing a single search task as-signed to a single participant, was treated as a repeated ob-servation. We ran an unpaired two-sample t-test to comparethe task performance of both groups. On average, partici-pants found the visualization corresponding to the descriptionin fewer clicks using the importance-based thumbnails (1.96clicks) versus using the resized visualizations (3.25 clicks,t(367) = 5.10, p < .001). Our importance-based thumbnailsfacilitated speedier retrieval, indicating that the thumbnailscaptured visualization content relevant for retrieval.
Interactive applicationsAn attractive aspect of neural network models is their fast run-time performance (Table 4). As a prototype, we integrated ourimportance prediction with a simple design layout tool thatallows users to move and resize elements, as well as changecolor, text font, and opacity (Fig. 2). With each change in thedesign, an importance map is recomputed automatically toprovide immediate feedback to the user. The accompanyingvideo and demo (visimportance.csail.mit.edu) demonstratethe interactive capabilities of our predictions. Our experi-ments in the Evaluation section provide initial evidence thatour model can generalize to the kind of fine-grained design ma-nipulations, like the resizing and relocation of design elements,that would be common in an interactive setting. Determininghow best to use importance prediction to provide feedback to
users is an interesting problem for future work. For example,importance prediction could help in formulating automaticsuggestions for novice users to improve their designs.
Timing: On a Titan-X GPU, our model computes the impor-tance map for a design in the GDI dataset (600×450 pixels)in 100 ms. Table 4 provides some timing information for ourmodel on differently-sized images.
Image size (pixels/side) 300 600 900 1200 1500
Avg. compute time (ms) 46 118 219 367 562Table 4. Time (in milliseconds) taken by our model to compute an im-portance map for differently-sized images, averaged over 100 trials.
LIMITATIONSOur neural network model is only as good as the training datawe provide it. In the case of data visualizations, there is astrong bias, both by the model and the ground truth humandata, to focus on the text regions. This behavior might not gen-eralize to other types of visualizations and tasks. Click data,gathered via the BubbleView interface, is not uniform overelements, unlike explicit bounding box annotations (i.e., as inthe GDI dataset [33]). While this might be a better approxima-tion to natural viewing, non-uniform importance across designelements might cause side-effects for downstream applicationslike thumbnailing, by cutting off parts of elements or text.
CONCLUSIONSWe curated hundreds of examples of graphic designs and datavisualizations, annotated with importance, to train fully convo-lutional neural network models to predict importance maps fornovel designs. We showed that our computational predictionsapproximate ground truth human data enough to be used fora number of automatic applications. Our importance mapsact as a common underlying representation for retargeting ofgraphic designs, thumbnailing of data visualizations, and in aprototype interactive design application.
This paper presents the first neural network model for pre-dicting saliency or importance in graphic designs and datavisualizations, capable of generalizing to a wide range of de-sign formats. Moreover, the fast test-time performance ofour model makes it feasible for the predictions to be usedin interactive design tools. Our approach is not limited tographic designs and data visualizations. The methodology andmodels can easily be adapted to other visual domains, such aswebsites [22]. As better webcam-based eyetracking methodsbecome available (e.g., [24, 37, 48]) possibilities also openup for directly training our model from eye movement data.Future work can also explore the use of importance predic-tions to offer more targeted design feedback and to provideautomated suggestions to a user.
ACKNOWLEDGEMENTSWe would like to thank Joel Brandt and anonymous review-ers for useful feedback. Thank you to Matthias Kümmererand Adrià Recasens for help computing saliency models. ZBwould like the acknowledge the support of the Natural Sci-ences and Engineering Research Council of Canada Postgrad-uate Doctoral Scholarship (NSERC PGS-D).

Figure 10. (a) Input designs, (b) our predicted importance maps, and (c) automatic retargeting results using the predicted importance maps to cropout design regions with highest overall importance. This is compared to: (d) edge-based retargeting, where gradient magnitudes are used as the energymap, and (e) Judd saliency, a commonly-used natural image saliency model. Additional comparisons are provided in the Supplemental Material.
Figure 11. MTurk interface for evaluating retargeting results of predicted importance compared to other baselines. More experimental details areprovided in the Supplemental Material.
(a) (b)Figure 12. Given a set of data visualizations (a), we use our importance maps to automatically generate thumbnails (b). The thumbnails facilitate visualsearch through a database of visualizations by summarizing the most important content. More examples can be found in the Supplemental Material.

REFERENCES1. Shai Avidan and Ariel Shamir. 2007. Seam Carving for
Content-aware Image Resizing. ACM Trans. Graph. 26, 3,Article 10 (July 2007). DOI:http://dx.doi.org/10.1145/1276377.1276390
2. Michelle A. Borkin, Zoya Bylinskii, Nam Wook Kim,Constance May Bainbridge, Chelsea S. Yeh, DanielBorkin, Hanspeter Pfister, and Aude Oliva. 2016. BeyondMemorability: Visualization Recognition and Recall.IEEE Transactions on Visualization and ComputerGraphics 22, 1 (Jan 2016), 519–528. DOI:http://dx.doi.org/10.1109/TVCG.2015.2467732
3. Michelle A. Borkin, Azalea A Vo, Zoya Bylinskii, PhillipIsola, Shashank Sunkavalli, Aude Oliva, and HanspeterPfister. 2013. What Makes a Visualization Memorable?IEEE Transactions on Visualization and ComputerGraphics 19, 12 (Dec 2013), 2306–2315. DOI:http://dx.doi.org/10.1109/TVCG.2013.234
4. Georg Buscher, Edward Cutrell, and Meredith RingelMorris. 2009. What Do You See when You’Re Surfing?:Using Eye Tracking to Predict Salient Regions of WebPages. In Proceedings of the SIGCHI Conference onHuman Factors in Computing Systems (CHI ’09). ACM,New York, NY, USA, 21–30. DOI:http://dx.doi.org/10.1145/1518701.1518705
5. Zoya Bylinskii, Tilke Judd, Ali Borji, Laurent Itti, FrédoDurand, Aude Oliva, and Antonio Torralba. 2012. MITSaliency Benchmark. (2012).
6. Zoya Bylinskii, Tilke Judd, Aude Oliva, AntonioTorralba, and Frédo Durand. 2016a. What do differentevaluation metrics tell us about saliency models? CoRRabs/1604.03605 (2016). http://arxiv.org/abs/1604.03605
7. Zoya Bylinskii, Adrià Recasens, Ali Borji, Aude Oliva,Antonio Torralba, and Frédo Durand. 2016b. WhereShould Saliency Models Look Next? SpringerInternational Publishing (ECCV), Cham, 809–824. DOI:http://dx.doi.org/10.1007/978-3-319-46454-1_49
8. Marcella Cornia, Lorenzo Baraldi, Giuseppe Serra, andRita Cucchiara. 2016. A deep multi-level network forsaliency prediction. In 2016 23rd InternationalConference on Pattern Recognition (ICPR). 3488–3493.DOI:http://dx.doi.org/10.1109/ICPR.2016.7900174
9. Andrew T Duchowski. 2007. Eye tracking methodology.Theory and practice 328 (2007).
10. Stas Goferman, Lihi Zelnik-Manor, and Ayellet Tal. 2012.Context-Aware Saliency Detection. IEEE Transactions onPattern Analysis and Machine Intelligence 34, 10 (Oct2012), 1915–1926. DOI:http://dx.doi.org/10.1109/TPAMI.2011.272
11. Michael J. Haass, Andrew T. Wilson, Laura E. Matzen,and Kristin M. Divis. 2016. Modeling HumanComprehension of Data Visualizations. SpringerInternational Publishing (VAMR), Cham, 125–134. DOI:http://dx.doi.org/10.1007/978-3-319-39907-2_12
12. Lane Harrison, Katharina Reinecke, and Remco Chang.2015. Infographic Aesthetics: Designing for the FirstImpression. In Proceedings of the 33rd Annual ACMConference on Human Factors in Computing Systems(CHI ’15). ACM, New York, NY, USA, 1187–1190. DOI:http://dx.doi.org/10.1145/2702123.2702545
13. Xiaodi Hou and Liqing Zhang. 2007. Saliency Detection:A Spectral Residual Approach. In 2007 IEEE Conferenceon Computer Vision and Pattern Recognition. 1–8. DOI:http://dx.doi.org/10.1109/CVPR.2007.383267
14. Xun Huang, Chengyao Shen, Xavier Boix, and Qi Zhao.2015. SALICON: Reducing the Semantic Gap inSaliency Prediction by Adapting Deep Neural Networks.In 2015 IEEE International Conference on ComputerVision (ICCV). 262–270. DOI:http://dx.doi.org/10.1109/ICCV.2015.38
15. Laurent Itti, Christof Koch, and Ernst Niebur. 1998. Amodel of saliency-based visual attention for rapid sceneanalysis. IEEE Transactions on Pattern Analysis andMachine Intelligence 20, 11 (Nov 1998), 1254–1259.DOI:http://dx.doi.org/10.1109/34.730558
16. Robert Jacob and Keith S Karn. 2003. Eye tracking inhuman-computer interaction and usability research:Ready to deliver the promises. Mind 2, 3 (2003), 4.
17. Yangqing Jia, Evan Shelhamer, Jeff Donahue, SergeyKarayev, Jonathan Long, Ross B. Girshick, SergioGuadarrama, and Trevor Darrell. 2014. Caffe:Convolutional Architecture for Fast Feature Embedding.CoRR abs/1408.5093 (2014).http://arxiv.org/abs/1408.5093
18. Ming Jiang, Shengsheng Huang, Juanyong Duan, and QiZhao. 2015. SALICON: Saliency in Context. In 2015IEEE Conference on Computer Vision and PatternRecognition (CVPR). 1072–1080. DOI:http://dx.doi.org/10.1109/CVPR.2015.7298710
19. Binxing Jiao, Linjun Yang, Jizheng Xu, and Feng Wu.2010. Visual Summarization of Web Pages. InProceedings of the 33rd International ACM SIGIRConference on Research and Development in InformationRetrieval (SIGIR ’10). ACM, New York, NY, USA,499–506. DOI:http://dx.doi.org/10.1145/1835449.1835533
20. Tilke Judd, Frédo Durand, and Antonio Torralba. 2012. ABenchmark of Computational Models of Saliency toPredict Human Fixations. In MIT Technical Report.
21. Tilke Judd, Krista Ehinger, Frédo Durand, and AntonioTorralba. 2009. Learning to predict where humans look.In 2009 IEEE 12th International Conference onComputer Vision. 2106–2113. DOI:http://dx.doi.org/10.1109/ICCV.2009.5459462
22. Nam Wook Kim, Zoya Bylinskii, Michelle A. Borkin,Krzysztof Z. Gajos, Aude Oliva, Frédo Durand, andHanspeter Pfister. 2017. BubbleView: a validation of amouse-contingent interface for crowdsourcing image
importance and tracking visual attention. CoRRabs/1702.05150 (2017). http://arxiv.org/abs/1702.05150Accepted to TOCHI.
23. Nam Wook Kim, Zoya Bylinskii, Michelle A. Borkin,Aude Oliva, Krzysztof Z. Gajos, and Hanspeter Pfister.2015. A Crowdsourced Alternative to Eye-tracking forVisualization Understanding. In Proceedings of the 33rdAnnual ACM Conference Extended Abstracts on HumanFactors in Computing Systems (CHI EA ’15). ACM, NewYork, NY, USA, 1349–1354. DOI:http://dx.doi.org/10.1145/2702613.2732934
24. Kyle Krafka, Aditya Khosla, Petr Kellnhofer, HariniKannan, Suchendra Bhandarkar, Wojciech Matusik, andAntonio Torralba. 2016. Eye Tracking for Everyone. In2016 IEEE Conference on Computer Vision and PatternRecognition (CVPR). 2176–2184. DOI:http://dx.doi.org/10.1109/CVPR.2016.239
25. Alex Krizhevsky, Ilya Sutskever, and Geoffrey E. Hinton.2012. ImageNet Classification with Deep ConvolutionalNeural Networks. In Proceedings of the 25thInternational Conference on Neural InformationProcessing Systems (NIPS’12). Curran Associates Inc.,USA, 1097–1105.http://dl.acm.org/citation.cfm?id=2999134.2999257
26. Srinivas S. Kruthiventi, Kumar Ayush, and R. VenkateshBabu. 2015. DeepFix: A Fully Convolutional NeuralNetwork for predicting Human Eye Fixations. CoRRabs/1510.02927 (2015). http://arxiv.org/abs/1510.02927
27. Ranjitha Kumar, Arvind Satyanarayan, Cesar Torres,Maxine Lim, Salman Ahmad, Scott R. Klemmer, andJerry O. Talton. 2013. Webzeitgeist: Design Mining theWeb. In Proceedings of the SIGCHI Conference onHuman Factors in Computing Systems (CHI ’13). ACM,New York, NY, USA, 3083–3092. DOI:http://dx.doi.org/10.1145/2470654.2466420
28. Ranjitha Kumar, Jerry O. Talton, Salman Ahmad, andScott R. Klemmer. 2011. Bricolage: Example-basedRetargeting for Web Design. In Proceedings of theSIGCHI Conference on Human Factors in ComputingSystems (CHI ’11). ACM, New York, NY, USA,2197–2206. DOI:http://dx.doi.org/10.1145/1978942.1979262
29. Matthias Kümmerer, Lucas Theis, and Matthias Bethge.2014. Deep Gaze I: Boosting Saliency Prediction withFeature Maps Trained on ImageNet. CoRRabs/1411.1045 (2014). http://arxiv.org/abs/1411.1045
30. Matthias Kümmerer, Thomas S. A. Wallis, and MatthiasBethge. 2017. Saliency Benchmarking: SeparatingModels, Maps and Metrics. CoRR abs/1704.08615(2017). http://arxiv.org/abs/1704.08615
31. Sharon Lin and Pat Hanrahan. 2013. Modeling HowPeople Extract Color Themes from Images. InProceedings of the SIGCHI Conference on HumanFactors in Computing Systems (CHI ’13). ACM, NewYork, NY, USA, 3101–3110. DOI:http://dx.doi.org/10.1145/2470654.2466424
32. Jonathan Long, Evan Shelhamer, and Trevor Darrell.2017. Fully Convolutional Networks for SemanticSegmentation. IEEE Transactions on Pattern Analysisand Machine Intelligence 39, 4 (April 2017), 640–651.DOI:http://dx.doi.org/10.1109/TPAMI.2016.2572683
33. Peter O’Donovan, Aseem Agarwala, and AaronHertzmann. 2014. Learning Layouts forSingle-PageGraphic Designs. IEEE Transactions onVisualization and Computer Graphics 20, 8 (Aug 2014),1200–1213. DOI:http://dx.doi.org/10.1109/TVCG.2014.48
34. Junting Pan, Kevin McGuinness, Elisa Sayrol, Noel E.O’Connor, and Xavier Giró i Nieto. 2016a. Shallow andDeep Convolutional Networks for Saliency Prediction.CoRR abs/1603.00845 (2016).http://arxiv.org/abs/1603.00845
35. Junting Pan, Elisa Sayrol, Xavier Giro-i Nieto, KevinMcGuinness, and Noel E O’Connor. 2016b. Shallow anddeep convolutional networks for saliency prediction. InProceedings of the IEEE Conference on Computer Visionand Pattern Recognition. 598–606.
36. Xufang Pang, Ying Cao, Rynson W. H. Lau, andAntoni B. Chan. 2016. Directing User Attention viaVisual Flow on Web Designs. ACM Trans. Graph. 35, 6,Article 240 (Nov. 2016), 11 pages. DOI:http://dx.doi.org/10.1145/2980179.2982422
37. Alexandra Papoutsaki, Patsorn Sangkloy, James Laskey,Nediyana Daskalova, Jeff Huang, and James Hays. 2016.Webgazer: Scalable Webcam Eye Tracking Using UserInteractions. In Proceedings of the Twenty-FifthInternational Joint Conference on Artificial Intelligence(IJCAI’16). AAAI Press, 3839–3845.http://dl.acm.org/citation.cfm?id=3061053.3061156
38. Ali Sharif Razavian, Hossein Azizpour, JosephineSullivan, and Stefan Carlsson. 2014. CNN FeaturesOff-the-Shelf: An Astounding Baseline for Recognition.In Proceedings of the 2014 IEEE Conference onComputer Vision and Pattern Recognition Workshops(CVPRW ’14). IEEE Computer Society, Washington, DC,USA, 512–519. DOI:http://dx.doi.org/10.1109/CVPRW.2014.131
39. Ronald A Rensink. 2011. The management of visualattention in graphic displays. Cambridge UniversityPress, Cambridge, England.
40. Ruth Rosenholtz, Amal Dorai, and Rosalind Freeman.2011. Do Predictions of Visual Perception Aid Design?ACM Trans. Appl. Percept. 8, 2, Article 12 (Feb. 2011),20 pages. DOI:http://dx.doi.org/10.1145/1870076.1870080
41. Michael Rubinstein, Diego Gutierrez, Olga Sorkine, andAriel Shamir. 2010. A Comparative Study of ImageRetargeting. ACM Trans. Graph. 29, 6, Article 160 (Dec.2010), 10 pages. DOI:http://dx.doi.org/10.1145/1882261.1866186
42. Manolis Savva, Nicholas Kong, Arti Chhajta, Li Fei-Fei,Maneesh Agrawala, and Jeffrey Heer. 2011. ReVision:Automated Classification, Analysis and Redesign ofChart Images. In Proceedings of the 24th Annual ACMSymposium on User Interface Software and Technology(UIST ’11). ACM, New York, NY, USA, 393–402. DOI:http://dx.doi.org/10.1145/2047196.2047247
43. Chengyao Shen and Qi Zhao. 2014. Webpage Saliency.Springer International Publishing (ECCV), Cham, 33–46.DOI:http://dx.doi.org/10.1007/978-3-319-10584-0_3
44. Karen Simonyan and Andrew Zisserman. 2014. VeryDeep Convolutional Networks for Large-Scale ImageRecognition. CoRR abs/1409.1556 (2014).http://arxiv.org/abs/1409.1556
45. Jeremiah D Still and Christopher M Masciocchi. 2010. Asaliency model predicts fixations in web interfaces. In 5 thInternational Workshop on Model Driven Development ofAdvanced User Interfaces (MDDAUI 2010). Citeseer, 25.
46. Jaime Teevan, Edward Cutrell, Danyel Fisher, Steven M.Drucker, Gonzalo Ramos, Paul André, and Chang Hu.2009. Visual Snippets: Summarizing Web Pages forSearch and Revisitation. In Proceedings of the SIGCHIConference on Human Factors in Computing Systems(CHI ’09). ACM, New York, NY, USA, 2023–2032. DOI:http://dx.doi.org/10.1145/1518701.1519008
47. Allison Woodruff, Andrew Faulring, Ruth Rosenholtz,Julie Morrsion, and Peter Pirolli. 2001. UsingThumbnails to Search the Web. In Proceedings of theSIGCHI Conference on Human Factors in ComputingSystems (CHI ’01). ACM, New York, NY, USA, 198–205.DOI:http://dx.doi.org/10.1145/365024.365098
48. Pingmei Xu, Krista A. Ehinger, Yinda Zhang, AdamFinkelstein, Sanjeev R. Kulkarni, and Jianxiong Xiao.2015. TurkerGaze: Crowdsourcing Saliency withWebcam based Eye Tracking. CoRR abs/1504.06755(2015). http://arxiv.org/abs/1504.06755
49. Rui Zhao, Wanli Ouyang, Hongsheng Li, and XiaogangWang. 2015. Saliency detection by multi-context deeplearning. In 2015 IEEE Conference on Computer Visionand Pattern Recognition (CVPR). 1265–1274. DOI:http://dx.doi.org/10.1109/CVPR.2015.7298731