Learning to Read Stories in Numerical Data Debbie Hanson, Center for Urban Education Hannah Lawler,...
18
Learning to Read Stories in Numerical Data Debbie Hanson, Center for Urban Education Hannah Lawler, Santa Monica College
-
Upload
gordon-potterton -
Category
Documents
-
view
214 -
download
0
Transcript of Learning to Read Stories in Numerical Data Debbie Hanson, Center for Urban Education Hannah Lawler,...

Learning to Read Stories in Numerical Data
Debbie Hanson, Center for Urban EducationHannah Lawler, Santa Monica College

Institute for Equity, Effectiveness, and Excellence at Hispanic Serving Institutions
Partner DiscussionThink back to a recent time when data was presented/ discussed at your institution and share:
• What data were you looking at?• Why were you looking at it?• How was the data shared? • Was there a group discussion about what the
data meant and it’s implications? • What did participants do with the data following
the meeting?

Institute for Equity, Effectiveness, and Excellence at Hispanic Serving Institutions
What we want to talk about today…
Overview:
• Reading Stories in Data using an Action Research Lens
• Strategies for Presenting Equity Data
• Creating a Structure To Promote Collaboration and Focus Dialogue

Institute for Equity, Effectiveness, and Excellence at Hispanic Serving Institutions
Action Research
• Brings together a ‘community of practice’
• Participants conduct research to understand the environment within which they practice
• Participants reflect on their own practices, beliefs, and values
• Goal: change initiated by stakeholders—those on the ground level who both have intimate knowledge of practices AND are positioned to make those changes
Translated to Reading Stories
in Data, this means….

Institute for Equity, Effectiveness, and Excellence at Hispanic Serving Institutions
Reading Stories in Data Using an Action Research Lens
• Multiple voices contributing to ‘the data story’
• Data is connected to day-to-day practices
• Participants are asked to reflect on their own practices, beliefs, and values (based on what the data shows)
• Participants discuss how data should inform action

Institute for Equity, Effectiveness, and Excellence at Hispanic Serving Institutions
Part I: Tools/Strategies for Presenting Equity Data
Goal: present data in a way that is clear, meaningful, and actionable
1. Focus on the right indicators
2. Use of visual toolsa. Color
b. Graphic displays
c. Pictures/images
3. Translate equity goals into humans
4. Anticipating next questions

Institute for Equity, Effectiveness, and Excellence at Hispanic Serving Institutions
Session Learning Outcomes
• Session participants will learn tools for presenting equity data that is consumable
• Session participants will learn strategies for promoting collaborative dialogue around equity data

Institute for Equity, Effectiveness, and Excellence at Hispanic Serving Institutions
#1: Focus on the Right Data
Course success rates in
developmental math
Last math course completed in high school
Where students placed on the math placement exam
Students’ financial aid status
Participation in tutoring and other academic support services
Enrollment status (full-time/part-time)
Parent’s education level

Institute for Equity, Effectiveness, and Excellence at Hispanic Serving Institutions
#2a: Use of Visual Tools - Colors
Ethnicity/Race
First-time Freshmen – Fall 2010
Graduated in 3 Years Equity Gap
Count Percent Count Percent +/-
Asian 887 8.87% 513 10.26% +1.39%
Black or African American
1214 12.14% 448 8.96% -3.18%
Hispanic 2501 25.01% 962 19.24% -5.77%
… … … … … …
Ethnicity/Race
First-time Freshmen – Fall 2010
Graduated in 3 Years Equity Gap
Count Percent Count Percent +/-
Asian 887 8.87% 513 10.26% +1.39%
Black or African American
1214 12.14% 448 8.96% -3.18%
Hispanic 2501 25.01% 962 19.24% -5.77%
… … … … … …

Institute for Equity, Effectiveness, and Excellence at Hispanic Serving Institutions
#2b: Use of Visual Tools – Graphic Displays
Asian Black or African American
Hispanic
-7
-6
-5
-4
-3
-2
-1
0
1
2 1.39
-3.18
-5.77
Equity Gap – Graduation in 3 Years
Eq
uit
y G
ap

Institute for Equity, Effectiveness, and Excellence at Hispanic Serving Institutions
#2c: Use of Visual Tools – Pictures/Images
Ethnicity/Race
Enroll MATH 101
- Cohort
Successful MATH 101
Enroll MAT
H 102
% of Orig.
Cohort
Successful MATH 102
Enroll Trans
f Math
% of Orig.
Cohort
Successful in Transfer
Math
% Cohort Migrated and Successfully Completed
Transfer Math
Asian 134 79 59.0% 57 42.5
% 38 66.7% 30 22.4
% 17 56.7% 12.7%
African American
/ Black116 52 44.8
% 31 26.7% 20 64.5
% 18 15.5% 11 61.1
% 9.5%
Hispanic 290 181 62.4% 128 44.1
% 74 57.8% 63 21.7
% 45 71.4% 15.5%
… … … … … … … … … … … … …

Institute for Equity, Effectiveness, and Excellence at Hispanic Serving Institutions
#2c: Use of Visual Tools – Pictures/Images
Asian
African American
/Black
Hispanic
Cohort MATH 101 MATH 102 Transfer Math

Institute for Equity, Effectiveness, and Excellence at Hispanic Serving Institutions
#3: Translate Equity Goals into Humans
Hispanic Graduation Rate
First-time Freshmen (Fall 2010)
Graduated in Three Years
Rate
2501 962 38.5%
Overall Student Population Graduation Rate
First-time Freshmen (Fall 2010)
Graduated in Three Years
Rate
7602 3473 45.7%
Equity Gap 38.5% - 45.7% = -7.2% or 181 students
Institute for Equity, Effectiveness, and Excellence at Hispanic Serving Institutions
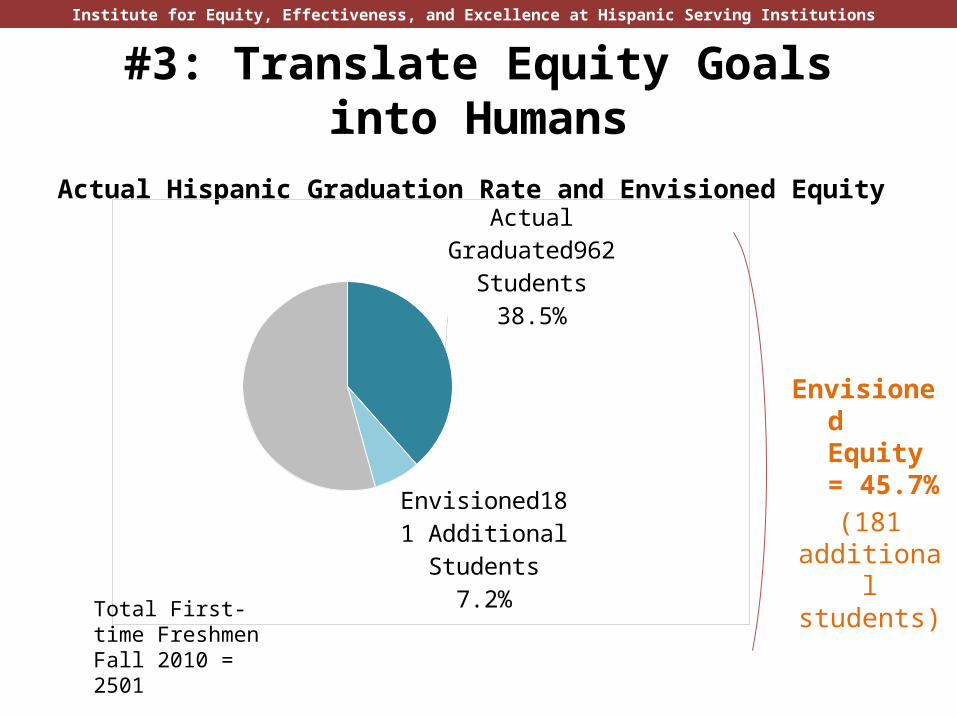
#3: Translate Equity Goals into Humans
Actual Hispanic Graduation Rate and Envisioned EquityActual Gradu-ated962 Students
38.5%
Envi-sioned181 Additional Students
7.2%Total First-time Freshmen Fall 2010 = 2501
Envisioned Equity = 45.7%
(181 additional students)

Institute for Equity, Effectiveness, and Excellence at Hispanic Serving Institutions
#4: Anticipating “Next” Questions
Graduation rate
Stated educational goal
Counseling
English/math placement levels
Unit load Outside responsibilities

Institute for Equity, Effectiveness, and Excellence at Hispanic Serving Institutions
Part II: Creating a Structure To Promote Collaboration and Focus
Dialogue‘First-Take’ Questions
– What is the data telling you? Does it signal that there might be a problem? An opportunity?
– What part of this information do you think is the most interesting? – Did this data surprise you? If so, how?
Delving-Deeper Questions– How can we connect this data to our day-to-day practices? If the
data uncovers an outcome that’s problematic – what are the practices and policies connected to that area?
– How might we find out what isn’t working in that area and experiment with new practices (remember, we’re focusing on ‘structures’ not on ‘people’)
– Is there additional data we should look at to better define the ‘problem’

Institute for Equity, Effectiveness, and Excellence at Hispanic Serving Institutions
Getting People To Own the Data
• Getting people to share own anecdotal experiences
• Building trust

Institute for Equity, Effectiveness, and Excellence at Hispanic Serving Institutions
Parking Lot
• I heard you, and it’s valid and needs to be discussed, helps to focus conversation