Learning Resources for Conducting...
72
Learning Resources for Conducting Research Social and Behavioral Science Methods Second Edition Lawrence T. Orcher with contributions by Danielle Dobies and Kyle Dump
Transcript of Learning Resources for Conducting...

Learning Resourcesfor
Conducting ResearchSocial and Behavioral
Science MethodsSecond Edition
Lawrence T. Orcherwith contributions by Danielle Dobies and Kyle Dump
ii
Although the author and publisher have made every effort to ensure the accuracy andcompleteness of information contained in this book, we assume no responsibility forerrors, inaccuracies, omissions, or any inconsistency herein. Any slights of people, places,or organizations are unintentional.
Copyright © 2014 by Taylor & Francis
First published 2014 by Pyrczak Publishing.
Published 2017 by Routledge
2 Park Square, Milton Park, Abingdon, Oxon OX14 4RN
711 Third Avenue, New York, NY 10017, USA
Routledge is an imprint of th e Taylor & Francis Group, an informa business
All rights reserved. No part of this book may be reprinted or reproduced or utilised in
any form or by any electronic, mechanical, or other means, now known or hereafter
invented, including photocopying and recording, or in any information storage or
retrieval system, without permission in writing from the publishers.
Notice: Product or corporate names may be trademarks or registered trademarks, and are used only for identification and explanation without intent to infringe.

iii
Brief ContentsContents v
Introduction vii
Learning Resource 1 Checklist for Preparing a Preliminary ResearchProposal 1
Learning Resource 2 Chapter OutlinesPart A Getting Started
(Outline of Chapters 1 through 11)
Part B Issues in Participant Selection(Outline of Chapters 12 through 13)
Part C Issues in Measurement(Outline of Chapters 14 through 16)
Part D Techniques for Data Analysis(Outline of Chapters 17 through 20)
Part E Issues in Conducting Surveys(Outline of Chapters 21 through 23)
Part F Issues in Conducting Experiments(Outline of Chapters 24 through 26)
Part G Putting It All Together(Outline of Chapter 27)
79
32
36
42
46
49
52
Learning Resource 3 Conducting Research Online: Challenges FacingResearchers
Online Research in Family and Consumer SciencesWhen an Online Survey is AppropriateRecruitment of ParticipantsSampling and Response RatesSurvey Design and ImplementationData Storage, Privacy, and ConfidentialityConclusion
5353545657585960

iv
Notes:

v
ContentsIntroduction vii
LEARNING RESOURCE 1 Checklist for Preparing a Preliminary
Research Proposal 1
LEARNING RESOURCE 2 Chapter Outlines 7
Part A Getting Started 9
1. Selecting Tentative Topics for Empirical Research 9
2. Locating Literature and Refining a Research Topic 11
3. Preparing a Literature Review 13
4. Citing References in APA and ASA Styles 15
5. Writing Research Hypotheses, Purposes, and Questions 17
6. Selecting a Research Approach 18
7. Looking Ahead to Participant Selection 20
8. Looking Ahead to Measurement 22
9. Looking Ahead to Data Analysis for Quantitative Research 24
10. Looking Ahead to Data Analysis for Qualitative Research 26
11. Preparing a Preliminary Research Proposal 29
Part B Issues in Participant Selection 32
12. Participant Selection in Quantitative Research 32
13. Participant Selection in Qualitative Research 34
Part C Issues in Measurement 36
14. Measurement in Quantitative Research 36
15. Writing Objective Measures 38
16. Measurement in Qualitative Research 40
Part D Techniques for Data Analysis 42
17. Descriptive Statistics for Quantitative and Qualitative Research 42
18. Correlational Statistics for Quantitative Research 43
Continued
vi
19. Inferential Statistics for Quantitative Research 44
20. A Closer Look at Data Analysis in Qualitative Research 45
Part E Issues in Conducting Surveys 46
21. Issues in Participant Selection for Surveys 46
22. Issues in Measuring Demographics in Surveys 47
23. Issues in the Use of Questionnaires in Surveys 48
Part F Issues in Conducting Experiments 49
24. Introduction to Experimentation and Threats to External Validity 49
25. Threats to Internal Validity and True Experiments 50
26. Pre-Experiments and Quasi-Experiments 51
Part G Putting It All Together 5227. Writing Reports of Empirical Research 52
LEARNING RESOURCE 3 Conducting Research Online: Challenges
Facing Researchers 53

vii
IntroductionLearning Resources for Conducting Research provides students with
supplemental materials to achieve mastery in their study of research methods for thesocial and behavioral sciences.
Included in the Learning ResourcesLearning Resource 1 is for students who are preparing a preliminary research
proposal. By using the checklist, students will be reminded of every major step inpreparing a proposal, as well as the proper sequence for the preparation of each part.
Learning Resource 2 provides an outline summary of each chapter. This resourceshould be used in two ways. First, students should read the summary of the chapter priorto reading the chapter itself. This is what is known as a pre-reading activity, whichprovides students with an overview of what they will be reading in a chapter. Pre-readingis widely believed to assist in comprehension while reading. Second, students will find ithelpful to refer to the chapter outlines when preparing for examinations. When readingthe chapter outlines for this purpose, students should ask themselves if they can discussthe meanings of the terms used in the outline and if they can give an example of each.Based on this exercise, students should know which particular terms and concepts theyneed to review in the textbook and in their classroom notes.
Learning Resource 3 provides an overview of major obstacles to conductingonline research and the difficulties in interpreting research data gathered in this way.Practical solutions to issues with methods are provided. This is a “must read” for studentsplanning online surveys.
Lawrence T. OrcherLos Angeles, California

viii
Notes:

1
Learning Resource 1Checklist for Preparing a
Preliminary Research Proposal(Based on Chapters 1 Through 11)
Directions: Below are the major steps for preparing a preliminary research proposal. For each stepyou take, place a checkmark on the line to its left. If a step does not apply to your proposal, writeNA for “Not Applicable.”
Chapter 1 Selecting Tentative Topics for Empirical Research_____ Consider everyday observations as a source of research topics. Specifically,
consider:_____ the prevalence of the observed behavior._____ the demographics associated with the behavior._____ the cause of the observed behavior._____ what the observed behavior may cause._____ whether it is possible to predict the behavior._____ what theory or theories might account for the behavior.
_____ Stay open to more than one topic._____ Consider testing a theory by testing predictions derived from the theory._____ Make preliminary inquiries about the availability of participants._____ Avoid sensitive topics if you are a beginning researcher._____ Consult with instructors and members of your committee while selecting a topic._____ Scan journal articles for possible research topics. Specifically, consider conducting:
_____ a modified replication based on a previous study’s limitations._____ a modified replication based on the researchers’ insights.
_____ If your topic is too broad, consider narrowing it by using only one characteristic ona demographic variable (e.g., interview only male teachers).
_____ If it is too simple, consider adding one or more demographic variables. (e.g.,interview teachers in Mexico as well as the United States to compare them).
Chapter 2 Locating Literature and Refining a Research Topic_____ Decide which databases are likely to have research on tentative research topics.
Some examples of places to look are:_____ PsycARTICLES_____ PsycINFO_____ ERIC_____ CSA Sociological Abstracts_____ Social Work Abstracts_____ Google Scholar
. _____ Consider other places specific to your topic._____ Use a citation index to find relevant research._____ Use a database thesaurus to find terms to use in a search._____ Use Boolean operators to refine a search.
Checklist for Preparing a Preliminary Research Proposal
2
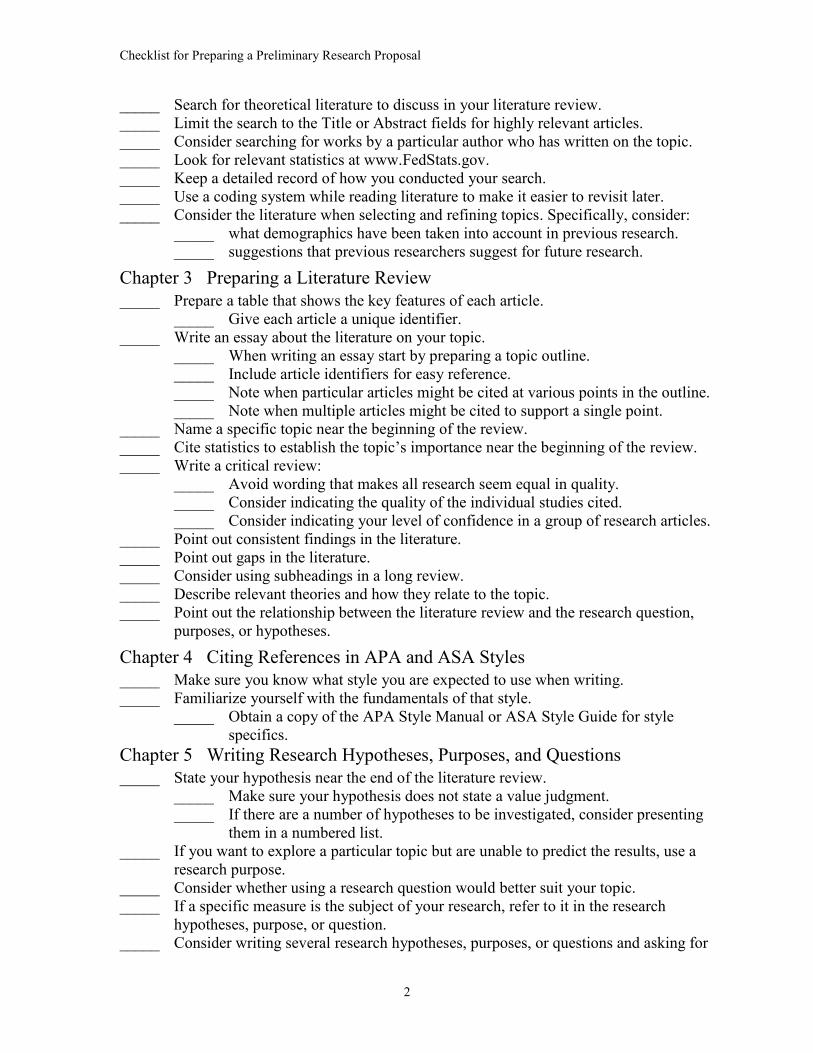
_____ Search for theoretical literature to discuss in your literature review._____ Limit the search to the Title or Abstract fields for highly relevant articles._____ Consider searching for works by a particular author who has written on the topic._____ Look for relevant statistics at www.FedStats.gov._____ Keep a detailed record of how you conducted your search._____ Use a coding system while reading literature to make it easier to revisit later._____ Consider the literature when selecting and refining topics. Specifically, consider:
_____ what demographics have been taken into account in previous research._____ suggestions that previous researchers suggest for future research.
Chapter 3 Preparing a Literature Review_____ Prepare a table that shows the key features of each article.
_____ Give each article a unique identifier._____ Write an essay about the literature on your topic.
_____ When writing an essay start by preparing a topic outline._____ Include article identifiers for easy reference._____ Note when particular articles might be cited at various points in the outline._____ Note when multiple articles might be cited to support a single point.
_____ Name a specific topic near the beginning of the review._____ Cite statistics to establish the topic’s importance near the beginning of the review._____ Write a critical review:
_____ Avoid wording that makes all research seem equal in quality._____ Consider indicating the quality of the individual studies cited._____ Consider indicating your level of confidence in a group of research articles.
_____ Point out consistent findings in the literature._____ Point out gaps in the literature._____ Consider using subheadings in a long review._____ Describe relevant theories and how they relate to the topic._____ Point out the relationship between the literature review and the research question,
purposes, or hypotheses.
Chapter 4 Citing References in APA and ASA Styles_____ Make sure you know what style you are expected to use when writing._____ Familiarize yourself with the fundamentals of that style.
_____ Obtain a copy of the APA Style Manual or ASA Style Guide for stylespecifics.
Chapter 5 Writing Research Hypotheses, Purposes, and Questions_____ State your hypothesis near the end of the literature review.
_____ Make sure your hypothesis does not state a value judgment._____ If there are a number of hypotheses to be investigated, consider presenting
them in a numbered list._____ If you want to explore a particular topic but are unable to predict the results, use a
research purpose._____ Consider whether using a research question would better suit your topic._____ If a specific measure is the subject of your research, refer to it in the research
hypotheses, purpose, or question._____ Consider writing several research hypotheses, purposes, or questions and asking for
Checklist for Preparing a Preliminary Research Proposal
3
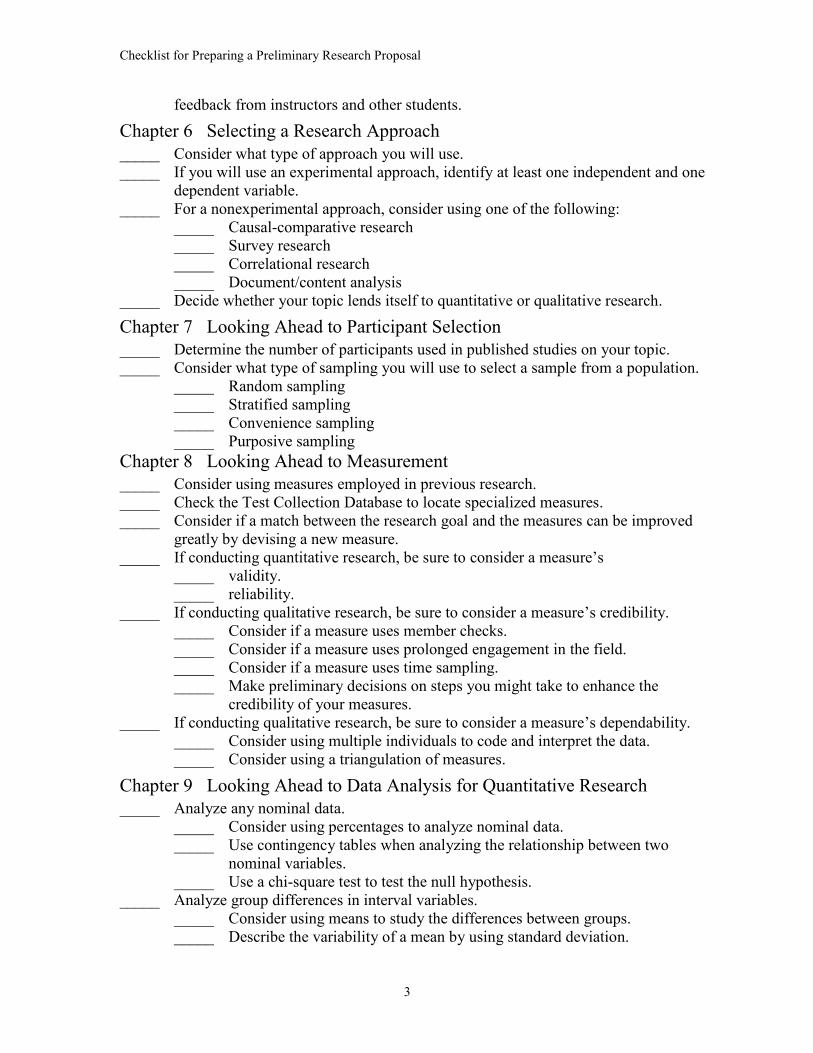
feedback from instructors and other students.
Chapter 6 Selecting a Research Approach_____ Consider what type of approach you will use._____ If you will use an experimental approach, identify at least one independent and one
dependent variable._____ For a nonexperimental approach, consider using one of the following:
_____ Causal-comparative research_____ Survey research_____ Correlational research_____ Document/content analysis
_____ Decide whether your topic lends itself to quantitative or qualitative research.
Chapter 7 Looking Ahead to Participant Selection_____ Determine the number of participants used in published studies on your topic._____ Consider what type of sampling you will use to select a sample from a population.
_____ Random sampling_____ Stratified sampling_____ Convenience sampling_____ Purposive sampling
Chapter 8 Looking Ahead to Measurement_____ Consider using measures employed in previous research._____ Check the Test Collection Database to locate specialized measures._____ Consider if a match between the research goal and the measures can be improved
greatly by devising a new measure._____ If conducting quantitative research, be sure to consider a measure’s
_____ validity._____ reliability.
_____ If conducting qualitative research, be sure to consider a measure’s credibility._____ Consider if a measure uses member checks._____ Consider if a measure uses prolonged engagement in the field._____ Consider if a measure uses time sampling._____ Make preliminary decisions on steps you might take to enhance the
credibility of your measures._____ If conducting qualitative research, be sure to consider a measure’s dependability.
_____ Consider using multiple individuals to code and interpret the data._____ Consider using a triangulation of measures.
Chapter 9 Looking Ahead to Data Analysis for Quantitative Research_____ Analyze any nominal data.
_____ Consider using percentages to analyze nominal data._____ Use contingency tables when analyzing the relationship between two
nominal variables._____ Use a chi-square test to test the null hypothesis.
_____ Analyze group differences in interval variables._____ Consider using means to study the differences between groups._____ Describe the variability of a mean by using standard deviation.

Checklist for Preparing a Preliminary Research Proposal
4
_____ Use the t test to test the null hypothesis between two means._____ For more than two groups, use ANOVA to test the null hypothesis.
_____ Consider analyzing the change on interval variables by administering a pretest anda posttest.
_____ When examining the relationship between two interval variables, consider using thecorrelation coefficient.
Chapter 10 Looking Ahead to Data Analysis for Qualitative Research_____ Make a preliminary, informal analysis of data while collecting data in qualitative
research._____ Consider writing memos in which you make notes of reactions and
interpretations of data being collected._____ Reflect on data as it is being collected and use your reflections as a basis
for modifying questions, formulating additional questions, and evenchanging the line of questioning to obtain more useful data.
_____ Consider collecting data from additional participants until you reach thepoint of data saturation.
_____ Consider using the Grounded Theory approach._____ Open coding: Examine segments of the interview transcripts to identify
distinct, separate segments. Then, code the individual segments to makethem easier to identify.
_____ Axial coding: Reexamine the transcripts of interviews and any other datasources to identify relationships between the categories identified duringopen coding.
_____ Develop a core category._____ Consider using Hill’s Consensual Qualitative Research approach.
_____ Have members of a team work independently to identify domains._____ Have the team members work together to reach a consensus on domains
and core ideas._____ Have the teams’ work mediated by an auditor.
_____ Consider specific techniques for analysis of qualitative data by any approach._____ Use enumeration to count how many respondents mentioned each
important construct._____ Select quotations to illustrate points made in the Results section._____ Consider having two or more researchers code the data and consult with
each other later to determine the extent to which their codes andinterpretations are in agreement.
_____ Consider diagramming the results._____ Consider using peer debriefing._____ Consider using auditing._____ Consider conducting member checks._____ Identify the range of responses._____ Note and consider discrepant cases during data analysis for discrepant case
analysis.
Chapter 11 Preparing a Preliminary Research Proposal_____ Write a title for your proposal that is a brief statement that names major variables in

Checklist for Preparing a Preliminary Research Proposal
5
the research hypothesis, purpose, or question. It may also indicate the specific typesof participants studied._____ Consider adding the phrase "A Research Proposal" as a subtitle.
_____ Determine if you are expected to begin your proposal with an introduction followedby a separate literature review or to begin with an essay that integrates the twoelements.
If the introduction is to be a separate essay, it should contain the following: ____ Identification of the problem area ____ Conceptual definitions of key terms ____ An indication of why the topic is worthy of investigation,
including the types of implications the results might have ____ A brief description of any relevant theories, which should be
expanded on in the literature review ____ A statement of the specific research hypotheses, purposes, or
questions the research is designed to explore____ For qualitative research, acknowledge that your personal
perspectives may influence the interpretation of data._____ Include a “Method” section on your proposal._____ Include a subsection on “Participants” in the “Method” section.
_____ Consider starting the subsection with a description of the population fromwhich the participants will be selected.
_____ Estimate the sample size._____ Provide a best guess as to the rate of participation._____ Describe the informed consent procedures you will use._____ Consider discussing any anticipated limitations in the selection of
participants and how they might affect the results._____ Include a section on “Measures” in the “Method” section.
_____ Describe what type of measures will be used._____ Describe the types of demographics that will be collected._____ Consider interviewing participants using semi-structured or loosely
structured interviews._____ Indicate the types of information that will be collected with the interviews._____ If you are using quantitative research, consider using objective-type
measures to collect the data relating to the research’s hypotheses, purposes,or questions.
_____ If new measures will be developed for use in the proposed research, makesure to describe them as specifically as possible.
_____ If there are important physical steps that will be taken in order to conduct theresearch that were not described under “Participants” and “Measures,” discuss themunder a subsection called “Procedures.”
_____ Include an “Analysis” section in your proposal._____ Include a “Discussion” section where you summarize the proposal and discuss the
limitations and strengths of the proposed study and possible implications._____ Include a list of “References” at the end of the proposal.

Checklist for Preparing a Preliminary Research Proposal
6
Notes:

7
Learning Resource 2
Chapter OutlinesThese 27 chapter outlines provide important breakdowns of the topics covered and
basic summaries of the main ideas covered in each topic. The outlines are intended to beused alongside the text as you work through each chapter. The outlines may also provehelpful for review when studying for an examination.

8
Notes:

Part AGetting Started
9
Chapter 1: Selecting Tentative Topics for Empirical Research
I. Everyday Observations as a Source of Research Topicsa) Especially useful when something unexpected is observed.
(1) What is the prevalence of the observed behavior?(2) What are the demographics of those who exhibit the behavior?(3) What is the cause of the observed behavior?(4) What does the observed behavior cause?(5) Is it possible to predict the behavior?(6) What theory or theories might account for the behavior?
II. Theories as a Source of a Research Topica) Consider predictions based on theories as possible topics for research.b) Research that supports the predictions supports the theories.c) Research results inconsistent with the predictions, dispute the theory.d) Because theories have many applications, research that contributes to theory building
is generally held in higher regard than nontheoretical research.III. Availability of Participants and Topic Selection
a) Ideally, research topics are selected, narrowed before identifying participants.b) Because certain types of participants may be unavailable, make preliminary inquiries
as to the availability of participants early.IV. Ethical Considerations in Topic Selection
a) Ethics require researchers to keep research participants free from physical andpsychological harm.
b) The mere act of asking certain questions might cause psychological distress.c) Beginning researchers should avoid sensitive topics.
V. The Audience’s Expectations Regarding Topicsa) Consult with instructors and members of a committee while selecting a topic. These
individuals can help in a number of ways, such as:(1) Suggesting specific research topics within a student’s area of interest.(2) Identifying barriers to conducting a satisfactory study on a given topic.(3) Helping to narrow a topic to make it more manageable.
VI. Personal Needs and Topic Selectiona) It is acceptable to conduct research that can help meet certain personal needs as long
as the researcher’s involvement and feelings do not create blind spots.b) Avoid the urge to select a difficult or complex topic solely due to personal needs.
VII.Published Research as a Source of Topicsa) Scan journal articles for ideas for research topics.b) While scanning, consider replicating a study:
(1) To identify a study for which you want to conduct a replication. Especiallyrecommended for studies that had unexpected findings.
(2) To conduct a modified replication of a published study based on previouslimitations such as a poor sampling. A good possibility for a research topic is to plan a modified
replication that overcomes one or more of the limitations discussedby a researcher in their own study.
(3) To conduct a modified replication of a published study based on theresearcher's insights after completing the study. Researchers often briefly describe future directions for research in
light of the insights they have gained from their study.

Chapter 1: Selecting Tentative Topics for Empirical Research
10
c) A student researcher usually will find it helpful to be able to say that the proposedresearch will overcome the limitations of previous research or that the proposedresearch was suggested in a journal article for future research.
VIII.Using Demographics to Narrow a Topica) If a topic seems too broad (e.g., patients’ compliance with physicians’ directions), it
can often be made narrower by using one or more demographic characteristics such asstudying only compliance by individuals with diabetes.
IX. Using Demographics to Make a Topic More Complexa) A research topic can also be made more complex by including one or more
demographic variables.X. Staying Open to Other Topics
a) Do not settle on a topic before doing preliminary readings of the literature.b) Reading the literature might reveal that a number of studies have already been
conducted on a given topic or that there is a consensus on the results amongresearchers.
c) Sometimes a topic that seemed uninteresting has more interesting literature or hasmore important implications than anticipated.

11
Chapter 2: Locating Literature and Refining a Research Topic
I. Identifying Appropriate Databasesa) Almost all journal articles are indexed in one or more electronic database.b) Identifying databases likely to have research on tentative research topics is key.c) ERIC (www.eric.ed.gov) stands for Education Resources Information Center.
(1) Contains references to more than a million records that provide citations tojournal articles, books, conference papers, and so on.
d) PsycARTICLES and PsycINFO(1) Maintained by the American Psychological Association (APA).(2) PsycARTICLES contains more than 158,000 searchable full-text articles
from 42 journals published by the APA and its allied organizations.(3) PsycINFO contains abstracts of more than 3.2 million references to both
APA and non-APA journal articles and books.e) CSA Sociological Abstracts
(1) Published by Cambridge Scientific Abstracts (CSA)—indexes abstracts ofarticles published in more than 250 English-language journals.
(2) It abstracts dissertations, books, and unpublished papers.(3) This database also covers fields related to sociology including anthropology,
criminology, social psychology, and urban studies.f) Social Work Abstracts
(1) It indexes abstracts of articles in more than 460 social work and humanservices journals.
(2) Also covers fields such as child and family welfare, civil rights, familywelfare, drug and alcohol addiction, and various human services.
g) Google Scholar (www.scholar.Google.com)(1) Searches scholarly literature across numerous disciplines.(2) Covers resources such as books, abstracts, and journal articles published by
universities, professional societies, and academic publishers.h) Other databases such as Linguistics and Language Behavior Abstracts, Medline,
Business Source Plus, and other specialized databases that may be accessed throughan academic library. Consult a librarian for more information.
II. Using a Citation Indexa) Google Scholar has a “Cited by” feature that indicates how many times the document
has been cited and where.b) Information on citations can be important because a document that has been cited by
other authors has probably been influential, controversial, or especially useful.III. Using a Database Thesaurus
a) If a database has a thesaurus of keywords on which it is structured, search thethesaurus for relevant terms (sometimes called descriptors).
IV. Using Boolean Operators (NOT, AND, and OR) to Refine a Searcha) Using operators such as NOT as well as AND narrows the number of references
found while using OR broadens the number.b) Boolean operators can also be used to delimit a search to selected demographics.
V. Searching for Theoretical Literaturea) Because the development of theories is a major activity in the sciences, it is desirable
to discuss relevant theories in literature reviews on most topics.b) Theoretical literature can be found by searching for a topic term then adding the term
AND theory.c) Entering the name of a theory as a search term may yield references on that theory.

Chapter 2: Locating Literature and Refining a Research Topic
12
VI. Searching in Only the Title and/or Abstract Fieldsa) The information in databases is divided into fields, such as the author field, which
allows users to search for articles written by a particular author.b) Two especially helpful fields:
(1) Title field (the title of the work).(2) Abstract field (a summary of the work).
VII. Searching for the Works of a Particular Authora) Many researchers conduct research on a selected topic over a period of decades.b) To locate literature authored by such a researcher (and trace the history of that
author’s work on the topic), restrict a search to the author field.VIII. Locating Statistics at www.FedStats.gov
a) You can access statistics from more than 100 federal agencies.b) The Fed Stats site searches all agencies for relevant links to federal statistics.c) This is important for two reasons:
(1) You do not have to search each agency separately.(2) An agency you are not aware of may have statistics relevant to a topic.
d) Citing specific, relevant statistics when writing a literature review makes it moreauthoritative and informative.
IX. Keeping a Record of How the Search Was Conducteda) By being able to state specifically which databases were searched and how they were
searched, reviewers can protect themselves from criticism that he or she was carelessin conducting research.
b) This is especially useful if a professor or researcher who is familiar with relevantexperimental studies that a reviewer failed to locate challenges a statement made in areview.
X. Using a Coding System While Reading Literaturea) An effective way to code is to use different colored highlighters.b) For example:
(1) One color can be used for anything that is interesting or surprising.(2) Another can be used for discussions of relevant theories.(3) Another can be used for definitions of key terms.(4) And yet another can be used for suggestions for future research.
XI. Considering Literature When Selecting and Refining Topicsa) Having located and considered the literature on several tentative topics, a researcher
should be in a good position to make a selection among the topics.b) There are many ways in which the literature can assist in topic selection.
(1) Results reported in literature on one topic might be more interesting thanthose on the others.
(2) One topic might be less researched than the others.(3) One topic might have more practical implications than the others.
c) Once one research topic has been selected over the others in a tentative list, considerhow the literature might be used to refine the topic.
(1) What demographics have been taken into account in previous research?(2) What limitations do previous researchers describe in their studies?(3) What do previous researchers suggest for future research?
d) These considerations can often help identify how a topic can be refined or modifiedto make it more likely to contribute to the understanding of a topic.

13
Chapter 3: Preparing a Literature Review
I. Preparing a Table That Shows the Key Features of Each Articlea) It is easy to get lost in details of individual articles and fail to see important trends and
outcomes when there are several articles on in a topic.b) Preparing a table showing key features of each article can avoid this problem:
(1) Give each article a unique identifier. A good identifier is the last name of the author and the year of
publication. These should be listed in the first column of the table.
(2) Contents of the remaining columns may vary substantially, depending on theliterature to be reviewed. Some examples to consider are: Type of sample. Number of participants in the sample. Measurement approach. Overall results. Notable features.
(3) Inspection of a table can aid in the further refinement of the research topic andreveal weaknesses to be avoided in one’s own research.
II. Writing an Essay About the Literaturea) A literature review is an essay that synthesizes information about a topic.b) The first step in writing such an essay is to prepare a topic outline.
(1) Include the articles’ identifiers, authors’ last names and years of publication.(2) Note that a particular article might be cited at various points in the outline and
that more than one article might be cited to support a particular point.c) Following a topic outline when writing a literature review will help prevent the common
mistake of writing a string of summaries of one study after another.III. Naming a Specific Topic Near the Beginning of a Review
a) Do not start a review with broad, sweeping statements.b) Be specific and on point.
IV. Using Statistics to Establish the Importance of the Topic Near the Beginning of a Reviewa) Researchers frequently cite statistics near the beginning of a review to help indicate the
importance of a problem.V. Providing Conceptual Definitions Near the Beginning of a Review
a) Providing conceptual definitions is especially important when related concepts might beconfused with the topic of the research and ensures that terms are not mistakenly taken tomean something they are not intended to mean.
VI. Providing a Brief History of the Topic Near the Beginning of a Reviewa) Providing a brief history of the research on a topic can help establish the context for the
proposed study.VII.Writing a Critical Literature Review
a) Uncritical reviews treat all studies as though they are equal in quality.(1) This can do a disservice to the reader, especially when there are contradictions in
the literature.b) It is not always necessary to indicate the quality of studies cited, but in the absence of
such indications readers are likely to assume the studies cited are of reasonable quality.(1) It is important to indicate that a weak study is being cited.(2) How much emphasis to put on the flaws of an individual study is ultimately a
subjective decision.(3) Some indicators should be provided to warn readers when a study is seriously
flawed by a weak sample or by serious design flaws, such as: Citing a study as a pilot or preliminary study.

Chapter 3: Preparing a Literature Review
14
Emphasizing flaws by bolding the text.(4) Sometimes it is more efficient to critique groups of studies that have common
flaws.c) An alternative to describing specific methodological weaknesses in studies is to use
statements that indicate the degree of confidence that should be placed in them.VIII. Indicating the Level of Confidence in a Research Finding
a) All empirical research may safely be assumed to be subject to error.b) As a result, it is important to use wording that does not imply that the research has
revealed some universal fact or truthc) Wording should be used to indicate the level of confidence the writer has in the results.
(1) Use statements to indicate a high level of confidence, such as: “Overwhelming evidence” “Strong evidence” “Results of a definitive study” “Seldom disputed” “Seems very likely that”
(2) Use statements to indicate a low degree of confidence in the results of studiesthat are questionable, such as: “Based on a pilot study” “Weak evidence hints at” “It appears that” “Suggests the possibility that”
(3) It is not always necessary to use terms to indicate the degree of confidence.However, when the degree is not indicated, readers are likely to assume that theevidence is reasonably strong.
IX. Pointing Out Consistent Findings in the Literaturea) There are subtle ways to point out findings that are consistent.
(1) For consistent results a phrase such as “it is commonly found,” or “a great dealof support,” can imply confidence in findings.
(2) For less consistent results phrasing such as “results tend to,” implies a lesserdegree of confidence.
X. Pointing Out Gaps in the Literaturea) There are also subtle ways to point out findings that are inconsistent.
(1) For less consistent results, phrasing such as “results tend to,” or “results fill a gapin the literature” implies a lesser degree of confidence.
XI. Using Subheadings in a Long Reviewa) Subheadings help readers to follow the transitions from one subtopic to another within a
review.b) The major subheadings in the topic outline usually serve as effective subheadings in a
long review.XII.Describing Relevant Theories
a) It is very desirable to select a topic with theoretical underpinnings.b) If you select such a topic, be sure to discuss the theory and its relationship to the topic in
enough detail that a reader with no knowledge of the theory will be able to understand itsimportance.
c) Be sure to discuss relevant research that supports or contradicts the theory.XIII. Noting the Relationship Between the Review and the Research Questions, Purposes, or
Hypothesesa) A reader should see the logical connection between what is known about a topic and the
research questions, purposes, or hypotheses underlying the research that will beconducted in a review.
b) Research questions, purposes, or hypotheses are usually near the end of a review.

15
Chapter 4: Citing References in APA and ASA Styles
I. In-Text Citationsa) Citations identify the source of ideas and quotations used by a writer.b) Typically, citations consist of two parts:
(1) A symbol, such as an asterisk, letter of the alphabet, word, or number in the text.(2) A full bibliographic reference usually at the end of the material.
c) In-Text Citations in APA(1) American Psychological Association (APA) style uses a version of the “author–
date” method for in-text citations and can be parenthetical or non-parenthetical.(2) Parenthetical In-Text Citations in APA Style
An in-text citation can be made parenthetical by putting the author’sname and year of publication in parentheses at the end of a quotation,paraphrase, or summary.
For sources with two authors use an ampersand (&) between the lastnames of the authors. Example: (Smith, A. S. & Doe, F., 2013).
When three to five authors of a given source are cited, the first time theauthors are cited, all names are used.
Then, in subsequent citations, only the first author’s name followed byet al. is used. Example: (Smith, Doe & Jones, 2013) cited allsubsequent times as (Smith et al., 2013)
When a source being cited has six or more authors, use et al. every timeit is cited.
When two or more sources are in substantial agreement, multiplesources may be cited within a single set of parentheses in alphabeticalorder, separated by semicolons. Example: (Doe, 2013; Jones & Miller,2012; Smith et al., 2013)
When the source is a group, cite its authorship using the whole name ofthe group. Example: (Association for Hypothetical Studies, 2010)
When an author wants to call attention to a specific passage within asource and quotes directly from a source, include the page number(s) inthe in-text citation. Example: (Smith et al., 2013, pp. 6–7)
p. serves as an abbreviation for page (singular) and pp. is theabbreviation for pages.
(3) Non-Parenthetical In-Text Citations in APA Style An in-text citation can be non-parenthetical as well. For non-parenthetical in-text citations, the author’s last name is used as
the subject of the sentence, while the year of publication remainsparenthetical.
The word and is used instead of an ampersand (&) for non-parentheticalin-text citations.
Non-parenthetical in-text citations are best used when a writer wants toemphasize the authorship of the source material.
(4) Reference Lists in APA Style For each in-text citation there should be a full bibliographic reference in
the reference list at the end of the manuscript. References in a reference list are formatted with second and subsequent
lines indented with a “hanging indent.” Print and electronic references should be combined into a single list with
the heading “References,” which should be centered and in bold. Consult the APA Style Guide for more information on how to format
different types of references.
Chapter 4: Citing References in APA and ASA Styles
16
d) In-Text Citations in ASA Style(1) ASA stands for the American Sociological Society. Like APA style, ASA style
uses a version of the “author–date” method for in-text citations. This method canalso be parenthetical or non-parenthetical.
(2) Parenthetical In-Text Citations in ASA Style Much like in APA. An in-text citation in ASA style can be made
parenthetical by putting the author’s last name and year of publication inparentheses. Unlike APA, a comma does not separate the last name anddate. Example: (Doe 2013)
For sources written by two authors the word and is used. Example:(Smith and Doe 2013)
Sources with one or two authors cited more than once in a givenmanuscript should be cited the same way each time.
When there are three authors of a given source, the first time the authorsare cited, all names are used. In subsequent citations, only the firstauthor’s name followed by et al. is used. Example: (Smith, Doe, andJones 2013) cited all subsequent times as (Smith et al. 2013)
When a source has four or more authors use et al. the first and allsubsequent times. Example: (Smith et al. 2013)
If two or more sources are in substantial agreement the sources may becited within a single set of parentheses. Like APA Style the sources arelisted in alphabetical order separated by semicolons. Example: (Doe2013; Jones and Miller 2012; Smith et al. 2013)
When the source is a group, cite its authorship using the sole name ofthe group. Example: (Association for Hypothetical Studies 2010)
To call attention to a specific passage within a source quoted directlyfrom the source, include the page number(s) in the in-text citation.Example: (Jones et al. 2013: 6-7)
(3) Non-parenthetical in-text citations are done the same way in both APA and ASAstyle, with the author’s last name as the subject of the sentence and the year ofpublication remaining parenthetical.
(4) In ASA Style and APA Style, each reference is formatted with a hanging indent.II. Reference Management Software
a) For those who are undertaking large research projects and will need help managing andorganizing many references, there is a variety of reference management softwareavailable, ranging in price from free to hundreds of dollars.
b) Reference management software offers a variety of features for researchers, including theability to:
(1) Bookmark web pages.(2) Tag, annotate, and highlight PDFs.(3) Create a reference list based on hundreds of different reference styles.
c) Some software is only available through the web, while some may be downloadeddirectly to your computer.
d) Students may sign up for accounts through their university to access the software for free.III. Concluding Comments
a) APA style and ASA style differ primarily in details regarding punctuation and placementof various types of information.
b) They may just be details, but they are important details in scientific writing, whereconsistency in style is important in order to avoid misunderstandings and errors.

17
Chapter 5: Writing Research Hypotheses, Purposes, and Questions
I. Writing Research Hypothesesa) A research hypothesis predicts the outcome of a research study.
(1) The prediction may be based on theory, results of previous research, or acombination of both.
b) Hypotheses are usually stated near the end of a literature review.c) To be an effective guide for research, a hypothesis should refer to specific variables.d) Some hypotheses refer to treatments that will be administered to participants.e) Under most circumstances, a hypothesis should not refer to a specific statistical outcome,
because if the outcome is off by even 1% the researcher will have to report that thehypothesis was not confirmed.
f) A hypothesis should not state a value judgment because such judgments are notobservable.
g) If there are a number of hypotheses to be investigated in a study, consider presentingthem in a numbered list.
(1) This will make it easier to write the results section of the research report bypermitting reference to the hypotheses by number.
II. Writing Research Purposesa) If a researcher wants to explore a particular topic but believes they are unable to predict
the results, a research purpose should be stated in lieu of a research hypothesis.b) Like a hypothesis, a research purpose should refer to specific observable behaviors.
III. Writing Research Questionsa) A research question serves as an alternative to writing a research purpose.b) When the question form is used, it should be stated in a way that it cannot be answered
with a simple “yes” or “no” because the results of research are usually mixed.(1) Normally, there will be some degree of social influence, which could not be
described accurately with a simple “yes” or “no.”IV. Identifying Populations in Research Hypotheses, Purposes, and Questions
a) When a researcher is interested in studying how variables operate in specific types ofpopulations, the populations should be identified within the research hypothesis, purpose,or question.
(1) This ensures that the reader will have the same context as the author with whichto view the research.
V. Referring to Measurement Methods in Research Hypotheses, Purposes, and Questionsa) Not necessary to name specific measures in research hypotheses, purposes, or questions.
(1) These measures can be discussed in detail later in a research proposal or report.(2) Main exception to this guideline is when a specific measure is the subject of the
research.VI. Concluding Comments
a) Consider writing several research hypotheses, purposes, or questions and asking forfeedback on them from instructors and other students.
b) Having several to compare and contrast will facilitate a discussion of each as the basis fora research project.

18
Chapter 6: Selecting a Research Approach
I. Experimental Versus Nonexperimental Researcha) The purpose of experimentation is to explore a cause-and-effect relationship.b) All experiments have at least one independent and one dependent variable.
(1) The independent variable, such as providing daily versus weekly feedback,constitutes the variable that is under the control of the experimenter.
(2) The outcome variable, out of the experimenter’s control, is called the dependentvariable.
c) A classic design for an experiment is to form an experimental group that receives a newor alternative treatment and a control group that receives either no treatment or aconventional treatment.
d) Often, researchers want to explore causality but cannot administer the treatments ofinterest for practical reasons or for legal or ethical reasons. In cases such as these, the bestoption is to find participants who have received such treatments previously.
(1) Note that such a study is nonexperimental because no treatments wereadministered for the study. Instead, it is a type of nonexperimental study knownas a causal-comparative study.
II. Major Types of Nonexperimental Researcha) Causal-Comparative Research
(1) Nonexperimental research can be used to explore causality but only when it isnot possible to conduct an experiment by administering treatments toparticipants.
(2) The primary type of quantitative nonexperimental research for exploringcausality is causal-comparative research (ex post facto research).
(3) A researcher should choose the causal-comparative method if three conditionsare met: The goal is to investigate a cause-and-effect relationship. Treatments cannot be given. Two similar groups that differ in some outcome can be identified and
questioned.b) Surveys
(1) Surveys provide what currently exists, not what caused its existence.(2) Questionnaires are the most popular method for collecting survey information.
Questionnaires sent through the mail have a very low response rate.(3) Face-to-face interviews are also widely used in surveys.
The interview process has numerous advantages.(4) For educational research, achievement surveys are also popular.
c) Correlational Studies(1) A correlational study is designed to examine the relationship between two or
more sets of scores—the term correlational research is almost always reserved asa label for studies in which correlation coefficient is employed. It can be computed only when there are two sets of scores.
(2) A correlation coefficient can vary from 0.00 to 1.00 for direct relationships. Avalue of 0.00 indicates the complete absence of a relationship while a 1.00indicates a perfect direct relationship.
(3) A correlation coefficient can also vary from 0.00 to -1.00 for inverserelationships. A value of 0.00 indicates the complete absence of a relationshipwhile a -1.00 indicates a perfect inverse relationship.
d) Document/Content-Analysis Research(1) Human behavior is at times explored by examining the contents of documents.
An advantage of document/content-analysis research is that good

Chapter 6: Selecting a Research Approach
19
samples can often be obtained. A disadvantage of document/content-analysis research is that an
assumption must be made that the contents of documents accuratelyreflect the attitudes and beliefs of those who wrote them and those whoread them.
(2) While document/content-analysis research can provide informative results,conducting such research is greatly simplified by not having to deal directly withresearch participants.
III. Program Evaluation: A Hybrida) The evaluation of social and educational programs has become a major focus of
researchers since the 1960s.b) Program evaluation is a “hybrid” because some evaluation efforts have similarities to
experimental research while others have similarities to nonexperimental research.c) The programs that are administered can be viewed as treatments given to participants.
(1) Unlike researchers who conduct experiments, program evaluators seldom havecontrol over the decision on who will receive the treatment and who will not.
d) Some elements of program evaluation do not deal with the effects or outcomes of theprograms. Instead, they deal with factors affecting their implementation.
IV. Quantitative Versus Qualitative Researcha) A major distinction in research is whether it is quantitative or qualitative.
(1) In quantitative research, the results are reduced to numbers, typically scores orfrequency counts that can be analyzed with statistical methods. In order to make such an analysis meaningful, procedures used to obtain
the scores must be standardized so that they are the same for eachparticipant.
i. Quantitative studies should be carefully and fully planned inadvance to enhance the collection of data in a standardized way.
ii. Once a quantitative study is started, deviations from the plansshould not be permitted because they may interfere with thestandardization.
iii. Personalized interactions with participants should not bepermitted because these might disrupt the standardization,causing different kinds of interactions with differentparticipants.
Quantitative research might be characterized as being rigid, distant, andimpersonal.
(2) In qualitative research, there is no need to standardize the data collection. It doesnot need to be as fully planned in advance, and deviations in the plans cannotonly be tolerated but might be welcomed.
(3) For example, semi-structured interviews might be used to gather qualitative dataand interviewers might be encouraged to probe in different directions withdifferent participants.
b) Put in general terms, quantitative researchers have the potential for more breadth inunderstanding a problem and qualitative researchers have the potential for more depth ofunderstanding.
c) While it might be argued that a researcher should pick a topic and then use the mostappropriate methods (whether quantitative or qualitative) to study it, in reality, someresearchers are more comfortable working with quantities while others are more skilled inworking with a less structured approach.
(1) Those with a strong orientation should consider it when selecting a topic becausesome topics naturally lend themselves more to a quantitative approach whileothers lend themselves more to a qualitative approach.
20
Chapter 7: Looking Ahead to Participant Selection
I. Determining the Number of Participants to Usea) There is no answer to determine how many participants are needed for a study. It depends
on a number of factors:(1) If the research is being conducted for a term project, small numbers of
participants might be acceptable, depending on the requirements.(2) For a thesis or dissertation, numbers larger than those required for a term project
probably will be expected and, once again, the advice of instructors is needed tomake a final determination of the appropriate sample size.
(3) There are varying norms for different types of research.(4) Some types of participants are difficult to locate or work with as participants.
b) How the participants are selected is much more important than how many are selected.c) Examining the literature is one of the most fruitful ways to identify norms for the
numbers of participants used in various types of studies on various topics.(1) Being able to cite the number of participants used in previous studies can be an
important strength when justifying plans for a particular number of participantsin a term project, thesis, or dissertation.
II. Random Sampling for Quantitative Researcha) Random sampling is the gold standard for selecting a sample from a population.
(1) In this type of sampling, all members of a population must be identified, andeach member must be given an equal chance of being selected.
b) Random sampling is sometimes not used because even though it is desirable, it isfrequently difficult to identify all members of a population.
c) Another common reason random sampling is sometimes not used is because somepotential participants whose names are selected by random sampling may refuse toparticipate.
(1) Even if a random sample of names is drawn, the refusal of some of thoseselected to participate makes the actual resulting sample nonrandom andtherefore biased.
III. Stratified Sampling for Quantitative Researcha) In stratified sampling, a sample that is representative of its population in terms of key
variables is drawn.b) In stratified random sampling, the same percentage of individuals is drawn at random
from each subgroup.c) Stratification is not always conducted with random sampling, but using stratification
without random sampling is not as useful as it might seem.IV. Convenience Sampling for Quantitative and Qualitative Research
a) The use of volunteers serves as an example of convenience sampling.b) Convenience samples must be presumed to be biased samples; however, they still have a
legitimate role in both quantitative and qualitative research.(1) They allow researchers who do not have access to better samples an opportunity
to make preliminary explorations related to their research hypotheses, purposes,or questions.
(2) They allow researchers to pilot test their measurement techniques.(3) Promising research with convenience samples may inspire researchers with
access to better samples to replicate the research.V. Purposive Sampling for Qualitative Research
a) Qualitative researchers tend to emphasize depth of understanding of purposively selected,small groups of individuals without regard to the appropriateness of generalizing fromthem to a population.
b) In purposive sampling, individuals are handpicked to be participants because they havecertain characteristics that are believed to make them especially good sources of

Chapter 7: Looking Ahead to Participant Selection
21
information.c) The distinction between a purposive sample and a sample of convenience is important
because selecting a purposive sample is regarded as highly appropriate for a qualitativestudy, while using a sample of convenience should be avoided whenever possible in bothqualitative and quantitative research.
d) To qualify as a purposive sample a researcher must:(1) Establish criteria for the selection of certain types of individuals.(2) Have a reason for establishing the criteria.(3) Make a planned and systematic effort to contact such individuals.
e) If a sample of convenience is the only available option, a study should not necessarily beabandoned. Conducting the research in spite of this weakness in sampling has somebenefit:
(1) It allows beginning researchers to gain experience that will be useful in laterprojects.
(2) A pilot qualitative study with a sample of convenience will help to determinewhether additional research with a better sample is likely to be fruitful.
VI. Using Literature When Making Plans for Participant Selectiona) Beginning researchers who will be conducting research as a term project should make
some preliminary plans based on the information in this chapter and the descriptions ofparticipant selection found in the literature on their topic—note how many participantswere used in various studies as well as how they were selected.
b) Often, authors of published research discuss limitations in participant selection in the“Discussion” section near the end of research reports.

22
Chapter 8: Looking Ahead to Measurement
I. Using Measures Employed in Previous Researcha) When investigating a topic, researchers often use the same measures previously
employed by other researchers who investigated the topic.b) Using the same measures has two potential advantages:
(1) Much is often known about the validity of measures used in previousresearch, especially if they have been widely used. The frequency of prior use suggests that other researchers have
judged the measure to be valid.(2) It helps in building a consistent body of research.
c) Research problems may require a modification of measures used in previousresearch.
d) A disadvantage of using a measure widely used in previous studies on a topic is thatwhatever flaws the measure has will affect the results of all the studies.
(1) There may be times where a justification for conducting another study on thesame topic is to determine if similar results can be obtained using a differentmeasure or even a different type of measure.
II. Locating Existing Measuresa) Reviewing the literature on a topic frequently identifies existing measures.
(1) When researchers have difficulty in locating a particular measure, they canconsult the Educational Testing Service’s (ETS) Test Collection Database. This database contains descriptions of more than 25,000 measures,
including research and unpublished measures. For each measure, the database includes information on the
availability such as the name, address, and phone number of theauthor or publisher.
b) The ETS Test Collection Database is useful for locating measures on specializedtopics.
III. Issues in Devising New Measuresa) Sometimes, new measures need to be devised to suit a particular research project.
(1) The general rule is that if a match between the research goal and themeasures can be improved greatly by devising a new measure, a new oneshould be devised.
b) Beginning researchers should note that when they devise new measures, they mightbe asked to defend the measures’ validity and reliability (in quantitative research) ordependability and credibility (in qualitative research).
IV. Validity of Measures in Quantitative Researcha) In quantitative research, the validity of measures is of great concern.
(1) Validity refers to the extent to which the measures are measuring what theyare supposed to be measuring.
b) One of the major approaches to studying the validity of measures is to conductstatistical studies in which the results from administering a measure are correlatedwith other results.
c) The other major approach to studying validity is to have experts make judgmentsregarding the contents of a measure.
d) Be aware that the validity of measures should be addressed in a research report, soattention should be paid to any available validity information on measures beingconsidered for use in a research project.
V. Reliability of Measures in Quantitative Research

Chapter 8: Looking Ahead to Measurement
23
a) Reliability deals with the extent to which results are consistent.b) Consistency in measurement is desirable whenever a relatively stable trait is being
measured.c) One of the most important factors influencing the reliability of objective tests and
scales is the number of items they contain.(1) Reliability is an especially important concern when the measure requires
subjective judgments because these judgments can be quite unreliable if theyare highly subjective.
(2) For this reason, quantitative researchers prefer measures that de-emphasizesubjectivity.
VI. Credibility of Measures in Qualitative Researcha) The credibility of the measure in qualitative research is roughly equivalent to the
concept of validity of measure in quantitative research. Except, different approachesare used to obtain it:
(1) Member checks is a method that consists of sharing the interpretations ofresults with participants to gauge how well the interpretations reflect themeanings intended by participants.
(2) Prolonged engagement in the field is also a method used for assuringcredibility.
(3) When resources do not permit prolonged engagement, time sampling canenhance credibility.
b) Qualitative researchers also use what they call “triangulation of data sources,” whichmeans using more than one type of source for data.
c) Students who are planning qualitative research should make some preliminarydecisions on what steps they might take to enhance the credibility of their measures.
VII. Dependability of Measures in Qualitative Researcha) Qualitative researchers are more tolerant of subjectivity in their measures than
quantitative researchers, but they do concern themselves with whether theirsubjectivity is sufficiently controlled so that the results reflect on the participantswithout undue influence of those making the subjective judgments.
b) One way to examine dependability in qualitative research is to have more than oneindividual code and interpret the data (such as the responses to open-ended questions)and note the extent to which they both agree.
(1) When areas of disagreement among the individuals emerge, they can beresolved through discussions designed to lead to a consensus on the bestinterpretations.
(2) A consensus is usually taken to be more dependable than a singleindividual’s judgment.
c) Dependability in qualitative research can also be improved through the use of“triangulation of measure.”
(1) Unlike triangulation of data sources, in which various types of sources areemployed, triangulation of measure uses only one source but uses more thanone type of measure.
(2) To the extent that different types of measures yield similar results, the resultscan be said to be dependable.

24
Chapter 9: Looking Ahead to Data Analysis for Quantitative Research
I. Analysis of Nominal Dataa) Many variables in research yield what is called nominal data.
(1) Nominal data use words instead of numbers to describe their categories.b) Percentages
(1) Percentages are widely used to analyze nominal data. A percentage indicates the number of cases per 100 that have some
characteristic.(2) Contingency tables are used when researchers are interested in the relationship
between two nominal variables. These two-way tables can help in determiningwhether a relationship exists. It is important to indicate the number of cases in a contingency table
because percentages, by themselves, can sometimes be misleading.c) Chi-Square
(1) The possibility that random samples differ from each other only because ofrandom sampling is called the null hypothesis. Two equally acceptable ways ofexpressing this hypothesis are: Random sampling has created a difference between the samples that
does not exist between populations. There is no true difference between the populations.
(2) The relationship between two nominal variables, the null hypothesis can betested using a chi-square test. A chi-square test aids in finding whether or not a relationship is
statistically significant.II. Analysis of Group Differences in Interval Variables
a) In contrast to nominal variables, an interval variable has numbers that represent howmuch of something exists.
b) Tests and scales that have objective-type items that yield overall scores often generateinterval data in the social and behavioral sciences.
c) Means and Standard Deviations for One Group(1) The central tendency for interval data can be described with an average. In
statistics, there are three averages: Mean Median Mode
(2) By far, the mean is the most widely used. It is the average that is obtained bysumming all the scores and dividing by the number of scores.
(3) While knowing the average of a set of scores is very informative, an averagedoes not indicate how spread out the scores are. The technical term for the “amount of spread” in a set of scores is
variability.(4) One way to describe variability is to report the range of scores, as in “the scores
range from 2 to 80.”(5) However, a much more common way to describe variability is to use the
standard deviation, which was designed to indicate the variability of the middletwo thirds of a group. For example:
d) Means and Standard Deviations for Two or More Groups(1) While the analysis of the means and standard deviations for two or more groups
is much the same, the distinction comes in how it is reported.

Chapter 9: Looking Ahead to Data Analysis for Quantitative Research
25
Be careful to report information for different groups separately to keepthe results clear.
e) t Test for Two Means(1) To test the null hypothesis between two means, a test called the t test can be
used.(2) A value of t can be computed and used to determine the probability that the null
hypothesis is true. As with the chi-square test, if the probability is .05 or less(such as .01 or .001), the null hypothesis should be rejected.
f) Analysis of Variance (ANOVA) for More Than Two Means(1) Because the t test is used for comparing only two means, its use is not
appropriate for a purpose that will generate interval data for more than twogroups.
(2) For more than two means, analysis of variance (ANOVA) can be used.(3) Once again, if the entire population of the groups is tested, there is no need to
test the null hypothesis because it refers to sampling errors, which do not existwhen there is no sampling.
III. Analysis of Change on Interval Variablesa) Researchers administer pretests and posttests in order to measure the amount of change.b) A classic model is a two-group experiment in which an experimental group receives a
pretest, followed by a treatment, followed by a posttest. In the meantime, a control groupreceives a pretest, followed by no special treatment, followed by a posttest.
(1) By subtracting each participant’s posttest score from his or her pretest score, achange score is obtained.
(2) The usual analysis for such a setup is to calculate the means and standarddeviations for the pretest, posttest, and change scores for each group.
IV. Analysis for the Relationship Between Two Interval Variablesa) When examining the relationship between two interval variables, the most widely used
statistic is the correlation coefficient (informally called the Pearson r).(1) A correlation coefficient describes the direction of a relationship. The direction
of a relationship is either direct (also called positive) or inverse (also callednegative). Note that coefficients for a direct relationship range from 0.00 to 1.00,
with 0.00 indicating no relationship and 1.00 indicating a perfect directrelationship. For an inverse relationship, the range is from 0.00 (norelationship) to –1.00 for a perfect negative relationship.
b) When correlation coefficients are reported, it is conventional to also report the mean andstandard deviation.

26
Chapter 10: Looking Ahead to Data Analysis for Qualitative Research
I. The Intermingling of Data Collection and Data Analysisa) Preliminary, informal data analysis is usually performed during the process of
collecting the data in qualitative research.b) This is illustrated by three practices commonly employed by qualitative researchers.
While collecting data, qualitative researchers often engage in memo writing wherethe interviewers make notes of their own reactions and interpretations.
(1) As data are being collected, qualitative researchers reflect on it (a form ofinformal analysis) and use their reflections as a basis for modifyingquestions, formulating additional questions, and even changing the line ofquestioning in order to obtain more useful data.
(2) Qualitative researchers often collect data from additional participants untilthey reach the point of data saturation. This refers to the failure of additional cases to add new information
beyond what was collected from previous participants.II. Selecting a General Approach to Data Analysis
a) To guide their data analysis, qualitative researchers usually select a general,overarching approach.
b) The Grounded Theory Approach(1) Perhaps the most frequently used approach is the grounded theory approach.(2) The term “theory” in “grounded theory” can be a bit misleading because it
does not refer to a theory of human behavior. Instead, it refers to an inductivemethod of analysis that can lead to theories of behavior. Qualitative researchers start with the data and develop theories based
on the data (i.e., grounded in the data).(3) First step—open coding. In this step, segments of the transcripts of the
interviews are examined for distinct, separate segments (such as ideas orexperiences of the participants) and are “coded” by identifying them andgiving each type a name.
(4) Second step—axial coding. At this stage, the transcripts of the interviews andany other data sources, such as memos written during data collection, arereexamined with the purpose of identifying relationships between thecategories and themes identified during open coding. There are several types of relationships that might be noted. Here are
a few examples:i. Temporal [X usually precedes Y in linear time].ii. Causal [X caused participants to do Y].iii. Associational [X and Y usually or always occur at about the
same time but are not believed to be causally connected].(5) In the final stages of the grounded theory approach to analysis, qualitative
researchers develop a core category, which is the main overarching categoryunder which the other categories and subcategories belong.
c) Consensual Qualitative Approach(1) Hill’s Consensual Qualitative Research approach (CQR), which emphasizes
having several individuals participate in the analysis, has specific stepsdesigned to lead to a consensus regarding the meaning and interpretation ofthe results. CQR specifies a series of procedures to code the data across
participant responses.
Chapter 10: Looking Ahead to Data Analysis for Qualitative Research
27
III. Specific Techniques for Analysis of Qualitative Dataa) Enumeration
(1) Enumeration is counting how many respondents mentioned each importantconstruct (such as a feeling, behavior, or incident).
(2) By subtracting each participant’s posttest score from his or her pretest score,a change score is obtained. The usual analysis for such a setup is to calculatethe means and standard deviations for the pretest, posttest, and change scoresfor each group.
(3) Some researchers use the results in writing up their results. Using terms such as “many,” “some,” and “a few” based on
enumeration data makes it possible to discuss the results withoutcluttering them with specific numbers and percentages
(4) When correlation coefficients are reported, it is conventional to also reportthe mean and standard deviation.
b) Selecting Quotations(1) It is very common to present quotations from participants to illustrate points
made in the results section of a qualitative research report. Preliminary decisions should be made on which quotations to use
during data analysis.(2) Perhaps the most common criterion for the selection of quotations is that they
are somehow “representative,” which might be indicated by how frequentlysomething is said.
(3) Another criterion is the degree to which a quotation articulates main ideas inthe results.
(4) And yet another is intensity. Statements made with strong words or higher-than-normal volume
might indicate an emotional intensity associated with the statements.c) Intercoder Agreement
(1) It is desirable to have two or more researchers code the data when possible. It is customary to have them consult with each other to determine the
general approach and the specific techniques that will be employed. Then they begin working independently.
(2) Later, the researchers consult with each other to determine the extent towhich their codes and interpretations are in agreement. If the researcherslargely agree, this is evidence of the dependability of the results. While largeareas of disagreement indicate that the data are subject to more than one goodinterpretation.
(3) The researchers might then work together to strive to reach a consensus onthe results, which is an important feature of CQR.
d) Diagramming(1) Having performed the analysis, qualitative researchers often diagram the
results by placing the core concept in a box at the top and showing the arrayof related categories below it.
e) Auditing(1) To use auditing, a researcher must keep detailed accounts of how the data
were collected and the thought processes used while analyzing the data. Some of these accounts might be in the form of memos.
(2) Auditing is similar to peer debriefing in that a qualified outsider is used forthe activity. However, in peer debriefing, the outsider acts more as aconsultant who is assisting the researcher. In auditing, the auditor is more
Chapter 10: Looking Ahead to Data Analysis for Qualitative Research
28
like an outside financial auditor for a corporation.(3) The auditor’s role is not to participate in the research but to examine it near
the end in the hope that he or she will be able to certify the appropriatenessof the research methods and interpretations of the results.
f) Member Checks(1) When conducting member checks, participants are asked to meet again with
the researcher to review the data and results. For instance, they can be asked to verify the accuracy of the
transcriptions of the interviews, and they can be asked to commenton the adequacy of the interpretations of the data.
(2) When participants disagree with certain interpretations, the researcher shouldexplore how they might be reformulated to take into account the participants’views.
(3) Conducting thorough member checks can be quite time-consuming. As aconsequence, qualitative researchers sometimes ask only a sample of theoriginal participants to participate in this activity.
g) Identifying the Range of Responses(1) Even when all or almost all respondents provide similar accounts in terms of
content, their responses can range in emotional tone as well as in frequency. Noting the range of responses when analyzing the data can assist in
writing up the results.h) Discrepant Case Analysis
(1) During data analysis, it is important to note and consider discrepant cases.(2) Researchers should consider whether there are other ways that might explain
the discrepancy in which the minority differs from the majority. If an answer is not clear, it might be useful to ask some of the
discrepant cases to return for another interview.
29
Chapter 11: Preparing a Preliminary Research Proposal
I. The Title of a Proposala) The title of a proposal should be a brief statement that names the major variables in
the research hypothesis, purpose, or question.(1) It might also include types of individuals covered by the research.
b) To distinguish a proposal from a report of completed research, researchers often giveit this subtitle: “A Research Proposal.”
c) The title is not a sentence and does not end with a period.II. The Introduction and Literature Review
a) Student researchers should seek guidance on whether they are expected to begin theirproposal with an introduction followed by a separate literature review or to beginwith an essay that integrates the two elements.
(1) If the introduction is to be a separate essay, it should contain the followingelements: Identification of the problem area. Conceptual definitions of key terms. An indication of why the topic is worthy of investigation, including
the types of implications the results might have. A brief description of any relevant theories, which should be
expanded on in the literature review. A statement of the specific research hypotheses, purposes, or
questions the research is designed to explore.b) A conceptual definition is a dictionary-like definition that sets the general boundaries
that establish the meaning of a construct.c) Conversely, operational definitions describe the physical process used to identify the
construct and “see” it.(1) While conceptual definitions are presented in the introduction to a research
proposal, operational definitions typically are presented in the “Methods”section of a proposal.
d) The Introduction and Literature Review in Qualitative Research(1) Qualitative researchers might recognize that their personal perspectives and
experiences may influence their collection and interpretation of data in theintroduction.
(2) Proposals for qualitative research seldom contain hypotheses becausequalitative researchers emphasize “following the data.”
III. The Method Section of a Proposala) The “Method” section is given the major heading “Method,” which is usually
centered on the page.b) It almost always has at least two subsections, one on participant selection and one on
measures.c) Participants
(1) Start this subsection with a description of the population from which theparticipants will be selected and state the basis for selection: e.g., random selection, convenience sampling, etc. If a sample of convenience (also known as an accidental sample) is
used, it is a good idea to explicitly acknowledge this as a weakness.(2) Indicate how many names will be drawn.(3) Provide a best guess as to the rate of participation.(4) Describe the informed consent procedures used, if any.

Chapter 11: Preparing a Preliminary Research Proposal
30
(5) Discuss any anticipated limitations in the selection of participants and, ifpossible, discuss how these might affect the results.
d) Measures(1) The measures subsection should describe the measures such as
questionnaires, interview questions or tests that will be used in the research.(2) Qualitative researchers frequently interview participants using semi-
structured or loosely structured interviews.(3) Even though they will not be highly structured, the “Measures” section of a
proposal should indicate the types of information that will be collected withthe interviews.
(4) Quantitative researchers usually use objective-type measures.(5) If new measures will be developed, the description of them should be as
specific as possible.e) Procedures
(1) The optional subsection called “Procedures” is usually flush left in italicsunder the major heading of “Method.” It usually follows the subsections on “Participants” and “Measures.”
(2) The subsection on procedures is needed whenever there are importantphysical steps that will be taken in order to conduct the research that werenot described under “Participants” and “Measures.”
(3) A common use for the “Procedures” subsection is to describe the steps thatwill be taken to administer the measures. The proposed procedures for an experiment should also be described.
i. Sometimes this is presented under another subheadinglabeled "Experimental Procedures."
IV. The Analysis Section of a Proposala) The “Analysis” section is given the major heading “Analysis,” which is usually
centered on the page.(1) For a quantitative proposal for basic research, this section can be rather brief,
naming the statistics that will be computed.(2) The “Analysis” section of a qualitative proposal may be somewhat longer
than that of a quantitative proposal if the general approach is to be describedin detail.
b) It is usually not considered necessary to indicate whether a statistical computerprogram will be used for a quantitative proposal.
c) However, if a computer program will be used in qualitative analysis, it should benamed because the available programs differ greatly in their underlying assumptionsand approaches to the more loosely structured data generated by qualitative studies.
V. The Discussion Section of a Proposala) The Discussion section is given the major heading “Discussion,” which is usually
centered on the page.b) Typically, this section begins with a brief summary of the proposal up to that point.
(1) The summary should describe not only the mechanical aspects of the study,but also restate the research hypotheses, purposes, or questions to beexplored as well as the context for the study.
c) A description of the limitations and strengths of the study should be included.VI. References at the End of a Proposal
a) The “References” section is given the major heading “References,” which is usuallycentered on the page.
(1) This section should include only references that were cited in the proposal.The references should not constitute “a suggested reading list.”

Chapter 11: Preparing a Preliminary Research Proposal
31
VII. The Major Components of a Proposal: An Outline
Title: The Influence of X on Y Among Residents ofKing County: A Research Proposal
Introduction
Literature Review
Method
Participants
Measures
Procedures (or Experimental Procedures)
Analysis
Discussion
References
a) It is important to put the preliminary plans for research in writing as a preliminaryresearch proposal early in the research process.
(1) This will allow time for the writer to later review the proposal with a freshmindset as well as to obtain feedback from others, which can be used inimproving it.

Part BIssues in Participant Selection
32
Chapter 12: Participant Selection in Quantitative Research
I. Simple Random Samplinga) The only way to preclude bias in sampling is to draw a random sample of names and
to convince all those individuals whose names have been selected to participate in thestudy.
(1) Conventional wisdom dictates that if a sample is not drawn at random, itshould be presumed to be biased.
b) Simple random sampling consists of giving each member of a population an equaland independent chance of being selected.
(1) Conceptually, the simplest way to do this is to write the names of allmembers of a population on slips of paper, put them in a container, and drawthe number needed for the sample. With this process, each individual has a chance of being selected.
(2) Another way to draw a simple random sample is to use a table of randomnumbers.
c) It is important to note that because a sample is random (and therefore unbiased), it isnot necessarily free of errors. In fact, it is safe to presume that all random sampleshave been influenced by random errors (i.e., chance errors).
(1) A major advantage of random sampling is that a class of statistics known asinferential statistics allows researchers to estimate how likely it is that theresults have been influenced by random sampling errors.
II. Stratified Random Samplinga) Random selection can be improved by combining it with stratification on a relevant
variable. When a researcher stratifies, he or she divides the population intosubgroups, each of which has a common characteristic.
(1) Typically, a researcher will draw from each subgroup to reflect itsdemographic percentages. It is possible to stratify on more than one variable.
III. Systematic Samplinga) Sampling is drawing every nth individual from a list, where n is the interval size such
as a small interval of 2 or a larger interval of 10.b) A potential weakness of systematic sampling is that the population list might be
ordered in such a way that a biased sample is selected.(1) To avoid this type of problem, an alphabetical list should be used.
Furthermore, selections should be made all the way through the list.(2) Even though systematic sampling is not random, using an alphabetical list
and drawing throughout the list until the end of the list is reached isconsidered, for all practical purposes, to be as good as random sampling.
IV. Cluster Samplinga) Cluster sampling can be used when all members of a population are already
assembled into groups.(1) Each group is called a cluster, and clusters instead of individuals are selected
for a sample.b) An advantage of cluster sampling is that it is often more convenient to draw clusters
instead of individuals.c) For cluster sampling to qualify as an excellent method of sampling, two conditions
must be met and a reasonable number of clusters must be drawn, regardless of thenumber of individuals in them. The clusters must be drawn at random.
V. Sample Size in Quantitative Research

Chapter 12: Participant Selection in Quantitative Research
33
a) There is no easy answer to the question of what size a sample should be.b) Five examples were given in a previous chapter:
(1) The requirements of an instructor regarding sample size for a term project.(2) The requirements for a thesis or dissertation.(3) The norms for different types of research, which can often be determined by
noting the sample sizes in publishing research of various types.(4) The difficulty of locating some types of participants.(5) Trading off a smaller sample in favor of obtaining a more diverse sample.
c) Potential for Harm to Participants(1) If it is anticipated that potential harm might result from procedures used in a
research study, then initial studies using very small numbers of participantsshould be conducted. This will allow researchers to determine the possible magnitude of
the harm as well as the benefits.d) The Need for Pilot Studies
(1) A pilot study is an initial study that is conducted to determine feasibility.Pilot studies can contribute to knowledge on a topic and often are publishablein an academic journal when their results are especially promising and therationale underlying the research is demanding.
e) Number of Subgroups to be Examined(1) As a general rule, the more subgroups that will be examined in a study, the
larger the total sample size should be.f) Importance of Precise Results
(1) The larger the sample, the more precise the results are.(2) If highly precise results are needed, then very large samples should be used.
g) Statistical Significance(1) A statistically significant difference is one that is larger than one would
expect on the basis of chance alone.(2) One of the key factors in significance testing is sample size. The larger the
sample, the more likely a given difference is statistically significant.

34
Chapter 13: Participant Selection in Qualitative Research
I. Purposive Samplinga) Criterion Sampling
(1) Used when very clear-cut, specific criteria are established for identifyingpotential participants.
(2) When planning participant selection, consider exclusion criteria as well asinclusion criteria.
b) Random Purposive Sampling(1) When the potential purposive sample is too large, random selection within
the purposive sample can help decrease the sample.c) Typical Case Sampling
(1) Sometimes beneficial to select participants who are “typical” or “normal” insome sense.
(2) Advantage: reduces the complexity of the data collected, making analysiseasier.
(3) Disadvantage: Sometimes comparing typical cases with extreme/deviantcases can reveal too much.
d) Extreme or Deviant Sampling(1) Criteria should be established to identify what constitutes an
“extreme/deviant” case in a particular study.(2) Individuals who meet the criteria should be purposively selected.(3) Can be useful to conduct initial study on extreme/deviant cases because
distinctive characteristics of extreme cases are often more obvious than intypical cases.
(4) Can also be used to select participants from both ends of a continuum.e) Intensity Sampling
(1) Select individuals who are likely to have intense experiences or feelingsrelating to the topic of research.
(2) Difference from extreme/deviant sampling: Extreme sampling selectsindividuals who are different from most, while intensity sampling selectsindividuals who have more intense experiences.
f) Maximum Variation Sampling(1) Cases selected so that full range of characteristics of interest is present in the
sample.(2) Advantage: makes it possible to compare results across a wide spectrum of
variables.g) Homogeneous Sampling
(1) Opposite of maximum variation sampling.(2) Individuals selected based on similarities in important ways.(3) Narrows scope of a study.
h) Opportunistic Sampling(1) Participants selected as the opportunity arises.(2) Difference from convenience sampling: Convenience sampling chooses cases
only because they happen to be convenient, whereas opportunistic samplingmay identify individuals as the opportunity arises, but they may not be at allconvenient to study.
i) Stratified Purposive Sampling(1) Subgroups of interest in the population must first be identified.
Chapter 13: Participant Selection in Qualitative Research
35
(2) Participants from each subgroup must be selected so all subgroups arerepresented.
j) Snowball Sampling(1) Initial participant(s) identifies additional participants for a study.(2) Two keys to snowball sampling:
At least one individual with at least one additional contact must belocated.
Researcher must build rapport with the initial participants.(3) Can be used to locate information-rich individuals or those “hidden” or “hard
to find.”k) Combination Purposive Sampling
(1) Sometimes desirable to use combination of various types of purposivesampling to obtain a single sample.
(2) May use two or more types of samples and analyze the results separately foreach type—allows research to identify similarities and differences betweentypes of samples.
II. Improving Convenience Samplinga) If convenience sampling is the only option, researchers should try to obtain
convenience samples from diverse sources.b) When used, demographic information should be collected so that the convenience
sample can be described in detail.III. Participant Recruitment in Qualitative Research
a) Researchers use a variety of means to recruit participants.b) Proposed method of participant recruitment should be described in detail in a
research proposal.IV. Sample Size in Qualitative Research
a) Samples used in qualitative research are often much smaller than samples used inquantitative research.
b) Two factors that contribute to small sample size:(1) Qualitative researchers strive to purposively select individuals who are
“information-rich.”(2) Qualitative methods can require large amounts of time to be spent with each
participant.(3) Saturation is important in determining sample size.(4) Beginning researchers should specify a target number, despite willingness to
be open-ended regarding sample size.
Part CIssues in Measurement
36
Chapter 14: Measurement in Quantitative Research
I. Standardization and Objectivity of Measurementa) Quantitative researchers value standardization.b) Also value objectivity—an objective test can be scored without subjective judgment.
II. Social Desirabilitya) Participants tend to provide responses that they believe are desirable from a social
point of view.b) To reduce influence of social desirability, assure participants that the information
they provide is for research purposes only and only group statistics will be reported.c) Asking for anonymous responses to sensitive questions can also reduce it.
III. Reliability and Internal Consistencya) The Concept of Reliability in Measurement
(1) Consistency is synonymous with reliability—researchers favor measure thatyields consistent scores.
b) Test-Retest Reliability(1) Determined by administering a test or other measure twice to a sample of
examinees.(2) There will be some fluctuation from one administration to the next because
of three factors: Guessing on a test or making random marks in response to questions. Changes in the physical and mental status of the examinees. Changes in how the test was administered and testing conditions.
(3) Reliability measured with a reliability coefficient—range from 0.00 (noconsistency) to 1.00 (perfect consistency).
(4) High reliabilities range from 0.85 and up.c) Internal Consistency
(1) Refers to consistency of results from one part of a test or scale to another.(2) The result of correlating is called split-half reliability coefficient—ranges
from 0.00 to 1.00.(3) In practice, the split-half technique is replaced with Cronbach’s alpha (α),
which is mathematically equivalent to splitting a test over and over in manyways as possible.
(4) If internal consistency is low, it could mean one of two things: Scores may have been influenced by guessing or by examinees
making random marks. Scale or test measures more than one skill or trait.
d) Interobserver Reliability(1) Refers to the extent to which two or more observers arrive at the same scores
when they observe the behavior of the same participants.(2) Becomes important whenever observational process is not completely
objective.(3) If interobserver reliability is low, it could mean one of two things:
The characteristic being observed is inherently difficult to judge. One or more of the observers were careless or not properly trained in
how to make the observations.IV. Validity and Its Relationship to Reliability
a) Validity refers to the extent to which a measure assesses what it is designed tomeasure.
Chapter 14: Measurement in Quantitative Research
37
b) Important to note: A test or scale can be highly reliable yet be invalid.V. Judgmental Validity
a) Content Validity(1) Based on experts’ judgments of the appropriateness of the contents of a scale
or test for a particular purpose.b) Face Validity
(1) Assessment of validity based on nonexpert judgments of what a test appearsto measure on the surface.
(2) Researchers mainly concerned with content validity, not face validity.(3) Face validity can become a concern when examinees do not think that a test
is valid and therefore refuse to take the test or fail to try their best.(4) More of a “public relations” concern.
VI. Criterion-Related Validitya) Based on the extent to which scores on a test or scale correlate with scores on a
criterion.b) Criterion is a standard by which something can be judged.c) Two types:
(1) Concurrent validity—results when the test that is being validated isadministered at about the same time as the criterion scores are beinggathered.
(2) Predictive validity—should be determined for all tests and scales that aredesigned to predict some future behavior.
d) Expressed with a validity coefficient—is mathematically calculated the same way as areliability coefficient—ranges from 0.00 to 1.00.
e) Rough guidelines to help beginning researchers:(1) Coefficients below .20 = poor validity.(2) Coefficients between .20 and .39 = modest validity.(3) Coefficients between .40 and .60 = good validity.(4) Coefficients above .61 = excellent validity.
VII. Construct Validitya) Refers to the extent to which a measure yields scores that are consistent with what is
known (or generally believed to be true) about the construct it is designed to measure.b) Construct is the label for a cohesive set of related behaviors.

38
Chapter 15: Writing Objective Measures
I. Attitude Scalesa) Planning an Attitude Scale
(1) An attitude consists of feelings that have the potential to lead to actions.(2) When planning an attitude scale, first identify the component of the object of
the attitudes.(3) Specify how many attitude scale items will be written for each component.(4) Plan to have an item or two that ask for overall attitudes.
b) Writing an Attitude Scale(1) Basic concept of Likert scale is to write straightforward statements about the
object of the attitude.(2) Likert scale choices vary from “Strongly Agree” to “Strongly Disagree.”(3) Half of the statements should be favorable and half should be unfavorable.(4) Reverse scoring should be used for the items expressing unfavorable
sentiments.c) Pilot Testing an Attitude Scale
(1) A pilot test of the attitude scale items should be conducted with respondentswho will not be included in the main study.
(2) Use two techniques to get information on the quality of the items: “Think aloud” technique. Ask respondents to write notes in the margins on anything that
bothers them or is unclear.II. Observation Checklists
a) Planning an Observation Checklist(1) Observation checklist consists of a list of behaviors and characteristics for
which observations should be made.(2) Specific behaviors should be identified that are indicators of a particular trait.(3) The context within which the observations will be made should be put in
writing in the plan.b) Writing an Observation Checklist
(1) Each item in the observation checklist should refer to only a single, discretebehavior.
(2) Observation checklists are frequently used to evaluate the performance of atask.
(3) Can also include items that touch on speed of behavior, duration of behavior,and success of the behavior.
c) Pilot Testing an Observation Checklist(1) Conduct the pilot test with participants who will not be included in the main
study.(2) Key to success is to have two or more observers observe the same
participants at the same time without conferring with each other.(3) Then, the extent to which the observers agree with each checklist item should
be determined.(4) When disagreements arise, it helps if the researcher provides definitions.
III. Achievement Testsa) Planning an Achievement Test
(1) Most popular type is the multiple-choice item.(2) Key to success is to base the test on the specific instructional objectives.
b) Writing Achievement Test Items
Chapter 15: Writing Objective Measures
39
(1) A multiple-choice test item should have two or more distracters.(2) To prevent ambiguity in multiple-choice items, items should be written as
clearly as possible.c) Pilot Testing an Achievement Test
(1) Conduct the pilot test with participants who will not be included in the mainstudy.
(2) Calculate the percentage that marked each multiple-choice item correctly andexamine the results for unexpected findings.
(3) Can also gain useful information by comparing the performance ofexaminees that typically are high in achievement with that of examinees whoare typically low in achievement.
IV. Concluding Commentsa) Tests prepared by professionals usually undergo more expert and comprehensive
reviews.b) Beginning researchers are advised to use measures previously developed by
professionals when possible.
40
Chapter 16: Measurement in Qualitative Research
I. Issues in Interviewer Selection and Behaviora) Matching Interviewers and Participants
(1) Interviewers need to be able to establish rapport with participants so that theywill feel comfortable in being forthcoming with information.
(2) Important consideration is the match of the background characteristics of theinterviewer(s) and the participants.
b) Interviewer Self-Disclosure(1) Interviewers should engage in self-disclosure—consciously thinking about
their traits and beliefs that might affect their decisions.(2) Should take place before any interviews are conducted and should be noted
in the report of the research.II. Devising Interview Protocols
a) Semi-Structured, Open-Ended Interviews(1) Often used by qualitative researchers.(2) Protocol can take two forms:
Can have a core set of questions to be asked of all participantswhile allowing the interviewers to add additional questions asneeded.
Can be less formal, consisting of only a list of topics aboutwhich questions will be asked.
(3) Probes are helpful when participants provide vague or general answers.(4) Qualitative researchers typically use open-ended questions.
b) Initial Questions to Establish Rapport(1) Initial questions asked set the tone for the rest of an interview.(2) Care should be taken to use initial questions to make the participants feel
comfortable.c) Using Previously Developed Interview Protocols
(1) Using previously developed protocols measure more characteristics ofquantitative research than qualitative research.
d) Having Interview Protocols Reviewed(1) Always a good idea to have your interview protocol reviewed by experts
whenever possible.(2) Especially important for beginning researchers.
e) Pilot Testing Interview Protocols(1) Less crucial for qualitative research to pilot test a measure because it is
acceptable for qualitative researchers to modify their measures as they collectdata.
(2) A pilot test may help beginning researchers with the opportunity to practicetheir interviewing skills.
f) Formulating Questions about Demographics(1) Questions asking for demographic information should be standardized for all
participants.(2) Potentially sensitive questions should usually be asked near the end of the
interview.(3) When asking sensitive questions, interviewers should preface them with a
brief explanation for asking them.
Chapter 16: Measurement in Qualitative Research
41
(4) To soften the impact of sensitive questions, interviewers can offer choicesthat cover ranges rather than asking for specific numbers (as in age orincome).
g) Recording Responses and Note Taking(1) Advantage to recording: produces a complete record of participants’
responses.(2) Disadvantage to recording: presence of a recorder might inhibit some
participants.(3) Alternative to recording is to take notes.
Two major disadvantages:i.Notes will not constitute a complete record of responses.ii.Greatly complicates the work of the interviewers.
(4) Beginning researchers should record responses instead of making notes,unless dealing with highly sensitive matters.
(5) Always make notes of important aspects of the interview as soon as possibleafter the conclusion of each interview.

Part DTechniques for Data Analysis
42
Chapter 17: Descriptive Statistics for Quantitative and QualitativeResearch
I. Describing Nominal Dataa) Nominal data refers to data that consist of names or labels that contain words, not
numbers.b) Percentage indicates how many participants out of 100 have some trait or
characteristic.c) Can examine the relationship between two nominal variables by building a
contingency table.II. Describing Ordinal Data
a) Ordinal data put participants in rank order from high to low.b) Can be summarized with the median and interquartile range.
III. Describing Ratio and Interval Dataa) Three characteristics of ratio data:
(1) Tell “how much” of a characteristic each participant has.(2) All units represent the same amount of the characteristic.(3) Ratio data have a true, absolute zero point.
b) Interval data have first two characteristics of ratio data.(1) However, they do not have a true zero.(2) A zero on an objective test often is arbitrary (not absolute).
c) The Mean and Median(1) Mean—most commonly used descriptive statistic for averaging ratio and
interval data. Computationally, it is the average obtained by summing all the
scores and dividing by the number of scores. The symbols for the mean are M (used if the data are for an entire
population) and m (if the data are for only a sample drawn from apopulation).
(2) Major drawback for certain data sets—if there are some extreme scores onone side of a distribution without extreme scores on the other side, the meanmay be pulled too far toward the extreme to be representative of the typicalparticipant.
(3) Skewed—when the distribution is unbalanced.(4) Two ways to handle the problem of skewed results: calculate the mean with
and without the extreme cases with an explanation that the distribution isskewed and report the median.
(5) Median—always the score with 50% of the cases above it and 50% below it.d) The Standard Deviation and Interquartile Range
(1) Standard deviation—most always used to describe variation when the meanhas been used as the average. The larger the variation, the larger the standard deviation will be. In published reports, the symbols often used are SD (when describing
a whole population) and sd (when describing a sample from apopulation).
Designed to describe normal distribution (bell-shaped curve).(2) Use interquartile range for a highly skewed distribution instead of the mean.
Interquartile range—the range of a middle of 50% of the scores.

43
Chapter 18: Correlational Statistics for Quantitative Research
I. Correlational methods allow researchers to examine and describe relationships between pairsof scores for a group of participants.
a) Correlation coefficients provide a precise number to express the strength of arelationship.
(1) Can range from 1.00 (for a direct relationship with no exceptions) to 0.00(for the absence of a relationship).
(2) Has a positive value for direct relationships (positive relationships) and has anegative value for inverse relationships (negative relationships).
b) Most widely used correlation coefficient is the Pearson product-moment correlationcoefficient (Pearson r).
c) Correlation coefficients describe two characteristics of a relationship:(1) Whether a relationship is direct or inverse.(2) The strength of the trend.
II. Describing the Strength of a Relationshipa) A value of a Pearson r that is very close to 1.00 would be described as a “very
strong” direct relationship.b) A value of a Pearson r that is very close to -1.00 would be described as a “very
strong” inverse relationship.c) A positive value of a Pearson r that is very close to 0.00 would be described as a
“very weak” direct relationship.d) A negative value of a Pearson r that is very close to 0.00 would be described as “very
weak” inverse relationship

44
Chapter 19: Inferential Statistics for Quantitative Research
I. Inferential statistics are used by researchers who have sampled from a population.II. Margins of Error
a) Based primarily on the number of participants. The larger the sample of participants,the lower the margin of error will be.
b) Must have some degree of confidence associated with it.III. The Null Hypothesis
a) Null hypothesis—states that a difference may have been created by errors caused byrandom sampling.
b) These errors are called sampling errors.c) Research hypotheses state what researchers predict they will find, whereas null
hypothesis always asserts that the difference may be created by sampling errors.IV. The Chi-Square Test
a) Chi-square test—test of the null hypothesis involving differences amongpercentages.
b) Establishes a probability that the null hypothesis is a correct hypothesis.c) In social and behavioral sciences, any probability of 5 or less in 100 is usually
regarded as sufficiently low to reject the null hypothesis.d) When the null hypothesis has been rejected based on an inferential statistical test,
researchers declare the difference to be statistically significant.e) The symbol for Chi Square is 2, and the symbol for probability is p.
V. The t Testa) The t Test for Means
(1) t test—used to obtain the probability that sampling error created thedifference between 2 means.
(2) Can be used to test the difference between only one pair of means at a time.b) The t Test for Correlation Coefficients
(1) When a correlation coefficient is based on a sample from a population, thenull hypothesis says that there is no true correlation.
(2) Customary to omit the value of t when reporting the significance of acorrelation coefficient.
VI. The F Test (ANOVA)a) F test is an extension of the t test.b) Conducted using a set of procedures known as Analysis of Variance (ANOVA).c) Significant value of F only indicates that the set of differences as a whole probably
has some nonrandom differences.d) To determine which specific pairs of means are significantly different from each
other, use multiple comparisons test.VII. Statistical Versus Practical Significance
a) Statistical significance indicates only that whatever difference(s) is/are beingconsidered is/are unlikely to have been created at random—not necessarily of anypractical significance.
b) Three considerations for practical significance:(1) Consider cost in relation to benefit to determine practical significance.(2) Consider whether statistically significant results suggest actions that are
questionable from an ethical or legal standpoint.(3) Consider acceptability.

45
Chapter 20: A Closer Look at Data Analysis in Qualitative Research
I. Self-Disclosure and Bracketing in Data Analysisa) Individuals collecting data should engage in self-disclosure.b) Self-disclosure should be followed by bracketing—refers to setting aside any
individual’s beliefs and concerns in order to be able to view the phenomena underinvestigation from the point of view of the participants.
II. A Closer Look at the Grounded Theory Approacha) Three stages of coding in the grounded theory approach:
(1) Open coding—distinct, separate segments of the responses of participants areidentified and given names.
(2) Axial coding—creation of categories, higher order labels that encompassseveral concepts.
(3) Selective coding—develops a core category and describes the process bywhich variables interact and are related to each other.
III. A Closer Look at the Consensual Qualitative Approacha) Consensual Qualitative Research (CQR) emphasizes reaching consensus, so
researchers must establish how and when the consensus-building process will beconducted.
b) Steps in CQR method:(1) Code into domains—refers to segmenting the data into groups according to
the topics they cover.(2) Develop core ideas within domains—write short summaries that reduce the
original idea of participants into fewer words.(3) Have domains and core ideas developed in the first two steps audited by an
outside expert.(4) Cross-analysis—core ideas are grouped into categories based on similarities.(5) Stability check—done by examining additional data, if available.

Part EIssues in Conducting Surveys
46
Chapter 21: Issues in Participant Selection for Surveys
I. Surveys—type of nonexperimental, quantitative research.a) Two major sources of bias in surveys: using the postal system to conduct direct mail
surveys and using the Internet to conduct email and online surveys.II. Participant Issues in Conducting Direct Mail Surveys
a) Often most efficient way to reach respondents who reside in geographically diverselocations is via postal service.
b) Researchers use various techniques to increase response rates to direct mail surveys:(1) Offer an incentive, such as a physical reward.(2) Personalize the survey by having the questionnaires mailed by a person or
agency that the potential respondents will recognize.(3) Send successive mailings of a questionnaire to nonrespondents.
c) Additional steps listed to improve response rates:(1) Enclose a self-addressed, stamped envelope.(2) Keep vocabulary and grammar as simple as possible.(3) Avoid using technical jargon in questions designed for the general public.(4) Keep questionnaire as short as possible.(5) Point out how the results will directly benefit the participants.
III. Participant Issues in Conducting Internet Surveysa) Email surveys work best when the researcher has only a few simple questions to ask.b) Online surveys
(1) Potential respondents click on a link in an email that takes them to a survey.(2) Response rates to online surveys can vary dramatically.(3) Biased against individuals and households that do not have access to the
Internet. Individuals with modest incomes or education are less likely to usethe Internet.
IV. Techniques for Improving Convenience Samplesa) Consider Adjusting the Research Problem
(1) May want to adjust the research purpose in light of the accessibility ofpotential participants.
b) Use Diverse Locations and Timesc) Use Population Demographics When Planning the Sample
(1) Office of institutional research on most campuses routinely compilesdemographic information on the student body—often available to the public.
(2) Can be used by researchers who are trying to draw a representative sample ofa study body.
d) Use Population Demographics When Analyzing the Datae) Track Information on Nonvolunteers
(1) Nonvolunteers—participants who were contacted but refused to participate.(2) The differential in rates of participation should be noted in the research
report in order to advise readers of a potential bias in sampling.f) Consider Seeking a Community-Based Sample
(1) Can be obtained by soliciting participation in public places.(2) Additionally, community groups and organizations might provide access to
their members: social clubs, religious institutions, and neighborhoodcouncils.
V. Concluding Commenta) Obtaining a representative sample is more important than using a large sample.b) It is better to work with a smaller representative sample than a larger biased sample.

47
Chapter 22: Issues in Measuring Demographics in Surveys
I. Determining Which Demographics to Collecta) Almost limitless types of demographic information that might be collected.b) Only demographics deemed to be relevant to the research problem should be
collected.II. Writing Demographic Questions
a) Questions on Sensitive Variables(1) Mitigate impact of potentially sensitive matters by providing a range of
values from which participants may choose.(2) Be sure to include exhaustive choices when presenting a range of values.(3) Consider how many individuals are likely to fall into each range.(4) Racial and ethnic background are potentially sensitive issues.
Preferred terms change over time and various members of the samegroup may prefer different terms.
Provide alternative terms and a choice for “Other” to allowparticipants to indicate mixed ancestry.
(5) Helpful to examine how professional survey researchers have written itemson race/ethnicity.
b) Providing Definitions(1) Determine if definitions or explanations for terms in demographic questions
should be provided.(2) Important to provide definitions when using technical terms.
c) Providing Exhaustive Choices(1) Choices in an item should be exhaustive—providing a choice for each
possibility.(2) Sometimes difficult to spot deficiencies in the exhaustiveness of the choices.
d) Providing Spaces for Responses to Open-Ended Questions(1) Choices that participants can quickly check off should be provided.(2) Some items may have so many possible choices that providing choices would
be unwieldy (e.g., zip codes).(3) Be sure to provide an adequate amount of space for open-ended items.
III. Pilot Testing Demographic Questionsa) Pilot test individuals who will not be participating in the main survey.b) To get feedback, ask each individual to “think aloud” as they consider and respond to
the questions.IV. Organizing and Introducing Demographic Questions
a) All demographic items should be grouped together and placed at the end of thequestionnaire or schedule.
b) Give a brief explanation for asking demographic information. This helps bluntresistance to answering questions that some participants might view as invasive oftheir privacy.

48
Chapter 23: Issues in the Use of Questionnaires in Surveys
I. Preparing Instruments for Administrationa) Give a Questionnaire a Title
(1) Clearly indicate the types of variables covered.(2) Be as clear and specific as possible.
b) Prepare an Introduction(1) Brief introduction should indicate:
The purpose of the survey. The sponsor. The approximate amount of time it will take to complete the
questionnaire. Whether responses will remain confidential.
(2) Point out any potential benefits that might accrue either to the individualresponding or to some group of individuals.
c) Group the Items by Topic(1) Group items by topic if there is more than one question in each of several
subtopics.(2) Provide subheadings for each group.
d) Conclude with a “Thank You” and provide contact information(1) Instrument should end with a thank you statement.(2) Participants should be informed of how to contact the researcher in the
future.II. Group Administration of Questionnaires
a) When surveying a group, potential participants should be given the right to decline toparticipate.
b) Advantage of Group Administration(1) Efficient way to obtain a large sample.
c) Disadvantage of Group Administration(1) Clusters tend to be homogeneous in important respects.(2) Responses from clusters may not represent the full diversity of participants.
III. Individual Administration of Questionnairesa) Advantage of Individual Administration
(1) Will usually provide a more diverse sample.b) Disadvantage of Individual Administration
(1) Takes more effort and time.c) Advantages of Face-to-Face Administration
(1) Participation rates can be higher when participants are approached on a face-to-face basis.
(2) Researchers might get insights into participants’ understanding of thequestions through comments and facial expressions.

Part FIssues in Conducting Experiments
49
Chapter 24: Introduction to Experimentation and Threats to ExternalValidity
I. Experiments Explore Cause-and-Effect Relationshipsa) Set of treatments is called the independent variable.b) The outcome variable is called the dependent variable.
II. Controlling the Hawthorne Effect in Experimentationa) Refers to the tendency of participants to improve because they are being studied.b) Can use an attention control group to control for this.
III. Using Multiple Independent and Dependent Variablesa) A given experiment can have more than one independent variable (more than one set
of treatments).b) By examining two independent variables at the same time in the same experiment,
can examine how the variables work together to produce difference on the dependentvariable—called can interaction of the independent variables.
c) Number of dependent variables limited only by the number of outcomes that mightreasonably be expected to be influenced by the independent variable and thewillingness of participants to complete multiple measures.
IV. External Validity of Experimentsa) Refers to the ability to generalize results of an experiment in a population.b) Five threats to external validity:
(1) Selection Bias Refers to any bias that might have occurred in the selection of
individuals to be participants. Random selection is key to preventing bias in sampling.
(2) Reactive Effects of Experimental Arrangements Setting of experimental research can have an effect on how the
participants respond to treatments. Can occur whenever anything about the experimental setting is
unlike the natural setting in which the behavior ordinarily occurs.(3) Reactive Effects of Testing
Refers to the possibility that the pretest in an experiment mightsensitize participants to a treatment.
Can avoid by using unobtrusive measures.(4) Obtrusiveness of Measurement
Measurement might obtrude on participants and cause them to reactdifferently than they would if there were no measurement.
To avoid, can use unobtrusive measures.a. Can often be used in field experiments through
observation at a distance or indirect observation.(5) Multiple-Treatment Interference
Occurs when the same participant is given more than one treatment.V. Concluding Comments
a) An experiment is said to have good external validity when it is reasonable to believethat the results apply to a population in a natural setting.
b) Not possible to avoid all threats, but steps should be taken to eliminate as many aspossible.

50
Chapter 25: Threats to Internal Validity and True Experiments
I. An experiment is said to have good internal validity if it is conducted in such a way that theindependent variable is the only viable explanation for changes observed in participants.
II. Historya) Refers to any event external to the experiment that might have caused the observed
change in participants’ behavior.b) Controlling History with a True Experiment
(1) Can be controlled by conducting true experiments.(2) All true experiments have more than one group of participants, and the
participants are assigned to groups at random.(3) Basic true experiment has two groups with pretests and posttests for each
group.(4) True experimental design controls for history by having a control group that
will be influenced by the same external events.III. Maturation
a) Refers to natural developmental changes—most noticeable in young children.b) Can be controlled by conducting a true experiment.
IV. Instrumentationa) Refers to possible changes in a measure or measurement process.b) Within a true experiment, both the experimental and control group would tend to
change from pretest to posttest at the same rate because of instrumentation.V. Testing
a) Results from learning how to take a particular test with the result that performancesare increased on the posttest—sometimes called practice effect.
b) Can be controlled by conducting a true experiment.VI. Statistical Regression
a) Refers to the tendency of participants who are extremely high or extremely low toscore closer to the mean on retesting—extremes tend to correct themselves.
b) Can be controlled by conducting a true experiment—if extreme scores are randomlyassigned, both groups will be likely to regress toward the mean at the same rate.
VII.Selectiona) Happens when two (or more) nonequivalent groups are compared.b) Whenever nonrandom assignment is used to form the experimental and control
groups, groups are presumed to be nonequivalent.c) Can be prevented by forming the two groups at random.
VIII.True Experimental Designsa) True experimental design can easily be extended to have more than two groups.b) Equivalency is the result of random assignment, not the pretest.
(1) Not necessary to have a pretest in order to have a true experiment.(2) Not having a pretest avoids threat to external validity called “reactive effects
of testing.”(3) Advantage of having a pretest in the amount of growth or change can be
determined from the beginning of an experiment to the end on the posttest.IX. Concluding Comments
a) By using a true experiment, all the above threats to internal validity are controlled.

51
Chapter 26: Pre-Experiments and Quasi-Experiments
I. Pre-Experimentsa) Can be thought of as an activity that is done before formal experimentation begins.b) The three pre-experiment designs are so weak that they are of almost no value in
exploring cause-and-effect relationships:(1) First example—has only one group of participants who were given a pretest,
followed by a treatment, followed by a posttest.(2) One-shot case study—has only one group that is given a treatment, followed
by a test—there is no pretest. Because there is no pretest, it is impossible to know if there has even
been any change in the participants. Subject to all the threats to internal validity—essentially of no value
for exploring cause-and-effect relationships.(3) Static-group comparison design—both an experimental and control group
receive a posttest, but no pretest.c) Some beginning researchers might use pre-experimental designs in a preliminary
pilot test prior to beginning a more formal experiment—can help improve tests andother observational methods.
II. Quasi-Experimentala) The three types of quasi-experiments, while not as good as true experimental designs,
they are still of some value for exploring cause-and-effect relationships:(1) Non-equivalent control group design—has an experimental group that
receives the treatment, and a control group. Individuals are not assigned at random, but instead are preexisting
groups—most useful when the pretest scores are similar for the twogroups.
Key problem: no matter how similar the two groups are known to beat time of pretest, they may differ in some systematic way that isunknown to the researcher.
(2) Time-series design—conducted with one group of participants. Most useful when the dependent variable is a variable that naturally
fluctuates from time to time without any special treatment. A series of pretests are called baseline.
(3) Equivalent time samples design—involves only one group of participants. Some days treatment is given, some days it is not—days for the
treatment are selected at random. Key problem: threat to external validity called “multiple-treatment
interference.III. Concluding Comments
a) For most experimental purposes, true experimental designs are most desirable.b) If random assignment is not possible, quasi-experimental designs might be used to
obtain useful information.c) As a rule, pre-experimental designs should be avoided except when used as
preliminary pilot studies conducted prior to formal experimentation to refinetreatments and measures.
Part GPutting It All Together
52
Chapter 27: Writing Reports of Empirical Research
I. Research proposals can be used as the foundation of a research report.a) Major sections include: Title, Introduction, Literature Review, Method (with
subheadings Participants, Measures, and Procedures), Results, Discussion, andReferences.
b) Title should be a brief statement that names the major variables in the researchhypothesis, purpose, or question.
II. The Abstracta) Brief summary that is placed below the title—typically 150 words or less, unless a
thesis or dissertation which may be longer.b) At a minimum should indicate:
(1) The general purpose of the research.(2) The types of individuals who served as participants.(3) The general nature of the results.
III. The Introduction and Literature Reviewa) Purpose of literature review:
(1) To establish the context for the research study.(2) To justify the study by establishing that the problem area is important.
b) If an introduction or literature review is more than two or three double-spaced pages,consider using subheadings.
IV. The Method Sectiona) Almost always has a subsection on participants and a subsection on measures.b) A subsection on procedures is often desirable—needed whenever there are important
physical steps that were taken in order to conduct the research that were not fullydescribed under the other subheadings.
V. The Results Sectiona) Some researchers provide demographic information in the subsection on participants,
but others summarize the demographic data at the beginning of the Results section.b) When writing the Results section, keep in mind that no matter how strong the trends
in data are, they are subject to errors.c) It is always inappropriate to use the term “prove.” Instead, refer to the degree of
confidence in the results based on the evidence provided by the data.d) Qualitative results are typically much longer than quantitative results because they
are expressed in words and must be justified.VI. The Discussion Section
a) Often begins with a brief summary of the preceding material in the research report.b) Should state the general purpose of the study and indicate the major results—also
helpful to indicate whether the major results are consistent with those discussedearlier in the literature review.
c) Summary is typically followed by a discussion of the limitations (weaknesses) of thestudy. This protects researchers from being charged with naively failing to recognizeweaknesses.
d) Special strengths of the study should be pointed out.e) Also include suggestions for future research—be as specific as possible.
VII. Referencesa) Should be placed immediately after the discussion.b) Pay attention to details when formatting references.

53
Learning Resource 3
Conducting Research Online:Challenges Facing Researchers
Originally published as Lyons, A. C., Cude, B., Lawrence, F. C., &Gutter, M. (2005). Conducting research online: Challenges facingresearchers in family and consumer sciences. Family and ConsumerSciences Research Journal, 33(4), 341–356. Copyright © 2005 byAmerican Association of Family and Consumer Sciences. Reprintedwith permission.
A substantial number of consumers and their familiesnow have access to e-mail and the Internet. Accordingto the UCLA Center for Communication Policy (2003),more than 70% of Americans used the Internet in 2003,with e-mail cited as the most common online activity.5The growth in e-mail and Internet usage makes onlinemethodologies appealing for conducting research, es-pecially in Family and Consumer Sciences (FCS).
There are several reasons why FCS researchersmight be interested in using an online survey to con-10duct research. First, online survey techniques can pro-vide access to populations that are difficult to reachwith traditional survey methods. These populationsmight include, but are not limited to, those unlikely toparticipate in face-to-face research activities because of15societal stigmas, work or family commitments, or theinconveniences and other constraints associated withtraditional survey methods (Andrews, Nonnecke, &Preece, 2003; Murray & Fisher, 2002). The Internetcan provide a sense of social distance for some target20populations, resulting in more open responses in onlinesurveys than in other data collection methods. TheInternet also can be a convenient way to participate forthose with computer experience and a preference forcompleting the survey at their leisure. Greater access25to, and knowledge of, hard-to-reach populations resultin samples that are more representative of the generalpopulation.
From a practical standpoint, online surveys have sev-eral other advantages over traditional mail and tele-30phone surveys. In general, the benefits of conductingonline surveys range from potentially larger samplesizes and faster response rates to less data processingand lower costs (Bachmann, Elfrink, & Vazzana, 2000;Jackson & DeCormier, 1999; McDonald & Adam,352003; Mehta & Sivades, 1995). Online surveys can bedelivered in a matter of seconds and have been reportedto have faster turnaround times and fewer respondenterrors. Also, the process of sending e-mails and settingup online surveys is less expensive than conducting40mail and telephone surveys. In many cases, online sur-
veys can reduce the marginal costs of data collection tozero because researchers avoid the costs associatedwith printing and mailing the survey and includingreturn postage. Cobanoglu, Warde, and Moreo (2001)45reported a mean response period of 5.97 days foronline surveys compared to 16.46 days for mail sur-veys; they also estimated the total costs for a mailsurvey at 2.4 times the costs of a comparable onlinesurvey.50
Besides these advantages, there are also a number ofchallenges with respect to the validity, design, and im-plementation of online surveys. The purpose of thisarticle is to highlight the opportunities associated withonline surveying while being realistic about the chal-55lenges that FCS researchers are likely to face whenusing this research methodology. This article seeks tominimize the extent to which FCS researchers repeatthe errors of their predecessors by providing, wheneverpossible, specific examples from previous FCS studies.60Essentially, this article is a primer for those with lim-ited or no experience in using online surveying meth-ods.
Online Research in Family and Consumer SciencesThe use of online surveys is relatively new to re-65
searchers and practitioners in the field of FCS. YetFCS researchers increasingly are using online methodsto collect data on a wide range of topics and from avariety of target populations, including online shop-pers, students, financial practitioners, employees, and70investors.
It is important to note that there are two techniquesthat one can use to conduct studies using the Internet.The first uses e-mail and is akin to traditional mail sur-veys; the respondent receives an e-mail with the survey75either embedded in the e-mail or included as an at-tachment that the respondent opens and completes. Inthe other technique, a survey is posted to a website,respondents are directed to the site using e-mail or an-other method, and information is collected and80downloaded at the site. In this article, the latter tech-nique is referred to as an online survey, whereas e-mailsurveys are referred to as such. This article focusesprimarily on online surveys because this tends to be themethod most FCS researchers have chosen. The fol-85lowing sections provide specific examples that high-light some of the ways in which FCS researchers haveused online surveying techniques effectively to conduct

Conducting Research Online: Challenges Facing Researchers
54
research. The specific details of FCS studies also areincluded throughout the article wherever relevant.90
Researchers in family and consumer economics haveconducted a number of studies online. Several usedonline surveys to investigate Internet purchasing be-haviors. For example, Cude and Morganosky (2000;Morganosky & Cude, 2002) used online surveys to95collect data from online grocery shoppers to learn moreabout who purchases groceries online, how much theyspend, and how frequently they make purchases. Kwonand Lee (2003) used data from an Internet survey ad-ministered by the Georgia Institute of Technology100Graphics Visualization and Usability Center to investi-gate online shoppers’ concerns about Internet paymentsecurity.
A number of other family and consumer economicsresearchers used online surveys to examine the finan-105cial decisions and practices of various target popula-tions. Volpe, Kotel, and Chen (2002) collected data todetermine whether online investors’ levels of invest-ment literacy varied by their characteristics, andHanna, Gutter, and Fan (2001) used online survey110techniques to investigate an improved subjective meas-ure of risk tolerance. More recently, researchers infamily and consumer economics used online surveys tocollect data from college students, in particular on theircredit practices and financial education needs (i.e.,115Lawrence et al., 2003; Lyons, 2003, 2004; Pollack,Foster, & Robinson, 2004).
Examples of online surveys also can be found inchild and family development. Birnbaum (2004) cited anumber of studies in social and cognitive psychology120that used online methods to conduct experiments, oftenexamining whether online and laboratory experimentsyielded the same results. Other researchers examinedonline social behaviors. Nosek, Banaji, and Greenwald(2002) focused on whether individuals exhibit different125social behaviors online versus in person, whereasCooper, Morahan-Martin, Mathy, and Maheu (2002)conducted a study through the MSNBC website tolearn more about people who engage in onlinesexual activity.130
Some researchers have used online methods to exam-ine various aspects of family life. Colvin, Chenoweth,Bold, and Harding (2004) studied the perceptions thatcaregivers of older adults have of online social supportnetworks. Hill, Hawkins, and Miller (1996) examined135the impact of working from home on traditional workand family life using an IBM program to conduct anonline survey of IBM employees. Moorefield andProulx (2004) used the Internet to collect qualitativeinformation on the family structure of gay couples.140
Online surveys are also part of an emerging area ofresearch in health and nutrition. Daley, McDermott,McCormack-Brown, and Kittleson (2003) used theInternet to collect data from college students and inves-tigated the relationship between temperament type and145health-risk-taking behavior among college students.
Vereecken (2001) also used an Internet survey to studythe health behaviors of school-aged children in Bel-gium. Other researchers have used online surveys toassess how online education and support groups can150improve patient outcomes, especially for those withdiabetes (i.e., Anderson, Donnelly, & Hess, 1992; Far-ris, Stoupa, Mendenhall, & Mazzuca, 1994; McKay,King, Eakin, Seeley, & Glasgow, 2001; Meadows etal., 1988).155
A few studies in FCS have focused on the technicalaspects of online surveying and compared the effec-tiveness of Internet surveys to traditional mail, tele-phone, and/or fax surveys. Cobanoglu et al. (2001)compared the response speeds, response rates, and160costs for mail, fax, and Web-based surveys using arandom sample of hospitality professors from theCouncil on Hotel, Restaurant, and Institutional Educa-tion. They found that Web surveys by far had a fasterresponse speed and higher response rate and were sig-165nificantly cheaper than mail surveys. Litvin and Kar(2001) used a survey instrument to collect tourism re-search data by two independent collection methods: (1)a mall-intercept approach asking individuals who werepassing through a mass-rapid transit station or shop-170ping mall to participate and (2) an e-survey in whichparticipants were sent an e-mail with the survey in-strument attached as a document. They found that e-surveying was a viable means to conduct tourism re-search that resulted in a fairly representative sample of175travelers. Overall, these studies, as well as others (i.e.,Baruch, 1999; Gosling, Vazire, & Srivastava, 2004;Joinson, 2001; Reips, 2002; Wharton, Hampl, Hall, &Winham, 2003), provide evidence that online researchmethods can be, in specific and appropriate cases, more180practical and desirable than traditional survey methods.
The remainder of this article focuses on the processof how to conduct an online survey and the challengesFCS researchers are likely to encounter, such as thoseassociated with sampling, survey design, and data stor-185age and confidentiality. A flow chart has been includedto outline the process used by FCS researchers to con-duct online survey research (see Table 1 on next page).
When an Online Survey is Appropriate190As previously mentioned, one of the major advantagesto using online surveys to conduct FCS research is thatthey can be an effective means to collect data fromhard-to-reach populations (Andrews et al., 2003;Murray & Fisher, 2002). In addition, a number of FCSstudies provide evidence that the Internet can create asense of social distance for some target populations,resulting in more open responses. Thus, researcherswho need to ask questions that are more sensitive innature, such as about illegal drug use or sexual behav-iors, may obtain higher response rates using online

Conducting Research Online: Challenges Facing Researchers
55
surveys than traditional paper surveys (Daley et al.,2003). Vereecken (2001) found that school-aged chil-dren were more likely to report having experimentedwith smoking, drinking alcohol, and skipping school inan online survey than in a paper survey. In addition,195Moorefield and Proulx (2004) found that the breadthand depth of content collected from gay couples abouttheir family structure increased when they used theInternet rather than face-to-face methods to collectdata.200
However, no matter which group is targeted, it iscritical that researchers determine the degree to whichthe target population is likely to have access to a com-puter and the Internet (Katz & Aspden, 1997; McDon-ald & Adam, 2003; Stanton & Rogelberg, 2001; Tay-205lor, 2000; Wilson & Laskey, 2003). Some target audi-ences with access, including teenagers, college stu-dents, “in house” employee groups, and professional orbusiness groups, may respond better to online surveysthan to traditional methods (Birnbaum, 2004). How-210ever, a significant fraction of U.S. households still donot have access to the Internet, and researchers mustkeep this in mind.
Some FCS researchers and practitioners are inter-ested in populations that have more limited access to215the Internet than the general public and will be less
able and willing to respond online (Stanton & Rogel-berg, 2001; Taylor, 2000). The Pew Internet andAmerican Life Project (Lenhart, 2003) reported that in2003 those less likely to go online were more likely to220be older, to be a member of a minority group, and tohave modest incomes and education. One half of allnonusers were older than age 50, and one quarter didnot have a high school diploma. Fifty-eight percent ofall Americans went online compared to 8% of African225Americans, 9% of Hispanics, and 18% of those withincomes less than $30,000. In rural areas, fewer thanone half of Americans went online. In addition, nearly30% of nonusers were retired and 16% were unem-ployed. Nonusers also were more likely to be disabled;23026% of nonusers reported a disability, compared to12% of Internet users. The UCLA Center for Commu-nication Policy (2003) found that Internet nonuserscited lack of technology (28% had no computer) andlack of interest (28%) as the primary reasons for not235being online.
In addition to considering respondents’ access to theInternet, researchers also must assess the level of com-fort that the target population has with using a com-puter and the Internet. Many of the target populations240that FCS researchers and practitioners might surveyonline have easy access to a computer and the Internet
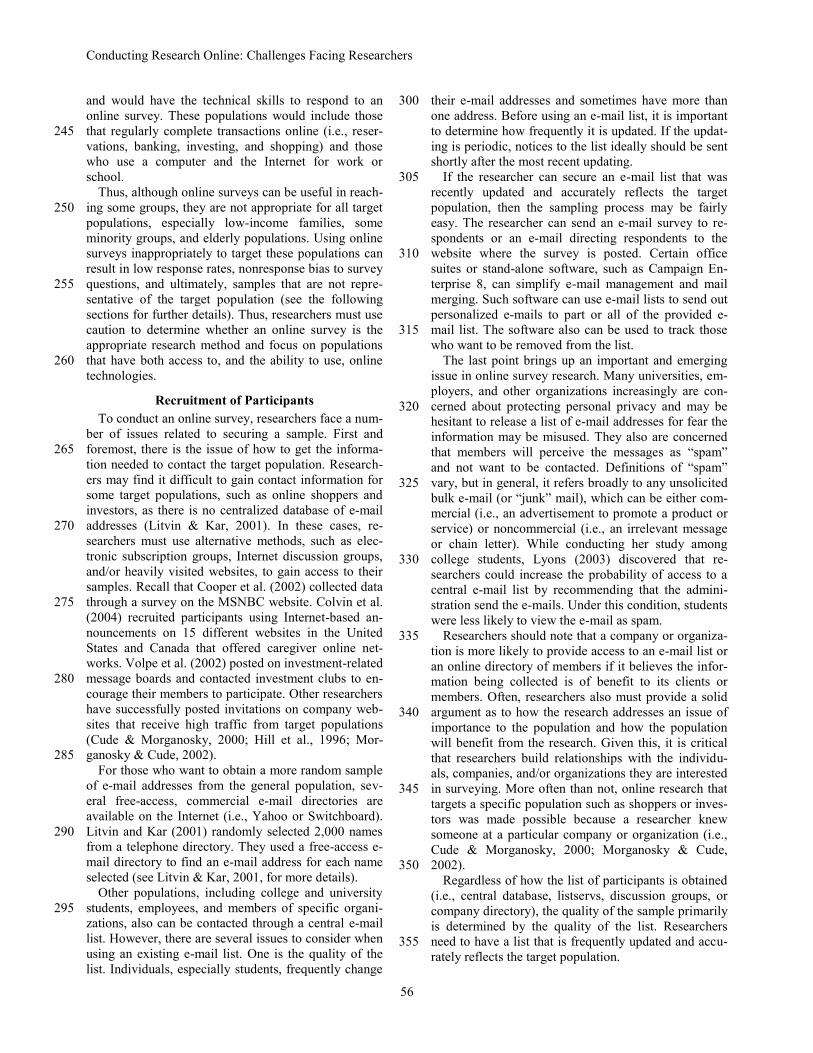
Conducting Research Online: Challenges Facing Researchers
56
and would have the technical skills to respond to anonline survey. These populations would include thosethat regularly complete transactions online (i.e., reser-245vations, banking, investing, and shopping) and thosewho use a computer and the Internet for work orschool.
Thus, although online surveys can be useful in reach-ing some groups, they are not appropriate for all target250populations, especially low-income families, someminority groups, and elderly populations. Using onlinesurveys inappropriately to target these populations canresult in low response rates, nonresponse bias to surveyquestions, and ultimately, samples that are not repre-255sentative of the target population (see the followingsections for further details). Thus, researchers must usecaution to determine whether an online survey is theappropriate research method and focus on populationsthat have both access to, and the ability to use, online260technologies.
Recruitment of ParticipantsTo conduct an online survey, researchers face a num-
ber of issues related to securing a sample. First andforemost, there is the issue of how to get the informa-265tion needed to contact the target population. Research-ers may find it difficult to gain contact information forsome target populations, such as online shoppers andinvestors, as there is no centralized database of e-mailaddresses (Litvin & Kar, 2001). In these cases, re-270searchers must use alternative methods, such as elec-tronic subscription groups, Internet discussion groups,and/or heavily visited websites, to gain access to theirsamples. Recall that Cooper et al. (2002) collected datathrough a survey on the MSNBC website. Colvin et al.275(2004) recruited participants using Internet-based an-nouncements on 15 different websites in the UnitedStates and Canada that offered caregiver online net-works. Volpe et al. (2002) posted on investment-relatedmessage boards and contacted investment clubs to en-280courage their members to participate. Other researchershave successfully posted invitations on company web-sites that receive high traffic from target populations(Cude & Morganosky, 2000; Hill et al., 1996; Mor-ganosky & Cude, 2002).285
For those who want to obtain a more random sampleof e-mail addresses from the general population, sev-eral free-access, commercial e-mail directories areavailable on the Internet (i.e., Yahoo or Switchboard).Litvin and Kar (2001) randomly selected 2,000 names290from a telephone directory. They used a free-access e-mail directory to find an e-mail address for each nameselected (see Litvin & Kar, 2001, for more details).
Other populations, including college and universitystudents, employees, and members of specific organi-295zations, also can be contacted through a central e-maillist. However, there are several issues to consider whenusing an existing e-mail list. One is the quality of thelist. Individuals, especially students, frequently change
their e-mail addresses and sometimes have more than300one address. Before using an e-mail list, it is importantto determine how frequently it is updated. If the updat-ing is periodic, notices to the list ideally should be sentshortly after the most recent updating.
If the researcher can secure an e-mail list that was305recently updated and accurately reflects the targetpopulation, then the sampling process may be fairlyeasy. The researcher can send an e-mail survey to re-spondents or an e-mail directing respondents to thewebsite where the survey is posted. Certain office310suites or stand-alone software, such as Campaign En-terprise 8, can simplify e-mail management and mailmerging. Such software can use e-mail lists to send outpersonalized e-mails to part or all of the provided e-mail list. The software also can be used to track those315who want to be removed from the list.
The last point brings up an important and emergingissue in online survey research. Many universities, em-ployers, and other organizations increasingly are con-cerned about protecting personal privacy and may be320hesitant to release a list of e-mail addresses for fear theinformation may be misused. They also are concernedthat members will perceive the messages as “spam”and not want to be contacted. Definitions of “spam”vary, but in general, it refers broadly to any unsolicited325bulk e-mail (or “junk” mail), which can be either com-mercial (i.e., an advertisement to promote a product orservice) or noncommercial (i.e., an irrelevant messageor chain letter). While conducting her study amongcollege students, Lyons (2003) discovered that re-330searchers could increase the probability of access to acentral e-mail list by recommending that the admini-stration send the e-mails. Under this condition, studentswere less likely to view the e-mail as spam.
Researchers should note that a company or organiza-335tion is more likely to provide access to an e-mail list oran online directory of members if it believes the infor-mation being collected is of benefit to its clients ormembers. Often, researchers also must provide a solidargument as to how the research addresses an issue of340importance to the population and how the populationwill benefit from the research. Given this, it is criticalthat researchers build relationships with the individu-als, companies, and/or organizations they are interestedin surveying. More often than not, online research that345targets a specific population such as shoppers or inves-tors was made possible because a researcher knewsomeone at a particular company or organization (i.e.,Cude & Morganosky, 2000; Morganosky & Cude,2002).350
Regardless of how the list of participants is obtained(i.e., central database, listservs, discussion groups, orcompany directory), the quality of the sample primarilyis determined by the quality of the list. Researchersneed to have a list that is frequently updated and accu-355rately reflects the target population.
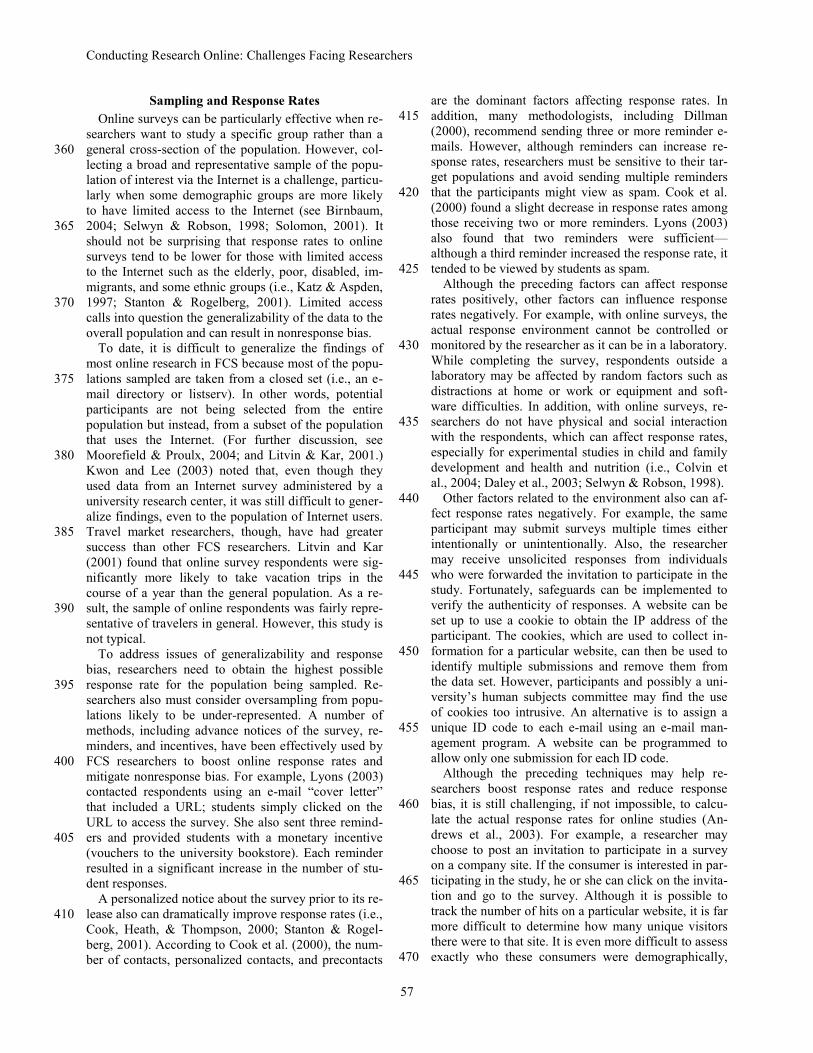
Conducting Research Online: Challenges Facing Researchers
57
Sampling and Response RatesOnline surveys can be particularly effective when re-
searchers want to study a specific group rather than ageneral cross-section of the population. However, col-360lecting a broad and representative sample of the popu-lation of interest via the Internet is a challenge, particu-larly when some demographic groups are more likelyto have limited access to the Internet (see Birnbaum,2004; Selwyn & Robson, 1998; Solomon, 2001). It365should not be surprising that response rates to onlinesurveys tend to be lower for those with limited accessto the Internet such as the elderly, poor, disabled, im-migrants, and some ethnic groups (i.e., Katz & Aspden,1997; Stanton & Rogelberg, 2001). Limited access370calls into question the generalizability of the data to theoverall population and can result in nonresponse bias.
To date, it is difficult to generalize the findings ofmost online research in FCS because most of the popu-lations sampled are taken from a closed set (i.e., an e-375mail directory or listserv). In other words, potentialparticipants are not being selected from the entirepopulation but instead, from a subset of the populationthat uses the Internet. (For further discussion, seeMoorefield & Proulx, 2004; and Litvin & Kar, 2001.)380Kwon and Lee (2003) noted that, even though theyused data from an Internet survey administered by auniversity research center, it was still difficult to gener-alize findings, even to the population of Internet users.Travel market researchers, though, have had greater385success than other FCS researchers. Litvin and Kar(2001) found that online survey respondents were sig-nificantly more likely to take vacation trips in thecourse of a year than the general population. As a re-sult, the sample of online respondents was fairly repre-390sentative of travelers in general. However, this study isnot typical.
To address issues of generalizability and responsebias, researchers need to obtain the highest possibleresponse rate for the population being sampled. Re-395searchers also must consider oversampling from popu-lations likely to be under-represented. A number ofmethods, including advance notices of the survey, re-minders, and incentives, have been effectively used byFCS researchers to boost online response rates and400mitigate nonresponse bias. For example, Lyons (2003)contacted respondents using an e-mail “cover letter”that included a URL; students simply clicked on theURL to access the survey. She also sent three remind-ers and provided students with a monetary incentive405(vouchers to the university bookstore). Each reminderresulted in a significant increase in the number of stu-dent responses.
A personalized notice about the survey prior to its re-lease also can dramatically improve response rates (i.e.,410Cook, Heath, & Thompson, 2000; Stanton & Rogel-berg, 2001). According to Cook et al. (2000), the num-ber of contacts, personalized contacts, and precontacts
are the dominant factors affecting response rates. Inaddition, many methodologists, including Dillman415(2000), recommend sending three or more reminder e-mails. However, although reminders can increase re-sponse rates, researchers must be sensitive to their tar-get populations and avoid sending multiple remindersthat the participants might view as spam. Cook et al.420(2000) found a slight decrease in response rates amongthose receiving two or more reminders. Lyons (2003)also found that two reminders were sufficient—although a third reminder increased the response rate, ittended to be viewed by students as spam.425
Although the preceding factors can affect responserates positively, other factors can influence responserates negatively. For example, with online surveys, theactual response environment cannot be controlled ormonitored by the researcher as it can be in a laboratory.430While completing the survey, respondents outside alaboratory may be affected by random factors such asdistractions at home or work or equipment and soft-ware difficulties. In addition, with online surveys, re-searchers do not have physical and social interaction435with the respondents, which can affect response rates,especially for experimental studies in child and familydevelopment and health and nutrition (i.e., Colvin etal., 2004; Daley et al., 2003; Selwyn & Robson, 1998).
Other factors related to the environment also can af-440fect response rates negatively. For example, the sameparticipant may submit surveys multiple times eitherintentionally or unintentionally. Also, the researchermay receive unsolicited responses from individualswho were forwarded the invitation to participate in the445study. Fortunately, safeguards can be implemented toverify the authenticity of responses. A website can beset up to use a cookie to obtain the IP address of theparticipant. The cookies, which are used to collect in-formation for a particular website, can then be used to450identify multiple submissions and remove them fromthe data set. However, participants and possibly a uni-versity’s human subjects committee may find the useof cookies too intrusive. An alternative is to assign aunique ID code to each e-mail using an e-mail man-455agement program. A website can be programmed toallow only one submission for each ID code.
Although the preceding techniques may help re-searchers boost response rates and reduce responsebias, it is still challenging, if not impossible, to calcu-460late the actual response rates for online studies (An-drews et al., 2003). For example, a researcher maychoose to post an invitation to participate in a surveyon a company site. If the consumer is interested in par-ticipating in the study, he or she can click on the invita-465tion and go to the survey. Although it is possible totrack the number of hits on a particular website, it is farmore difficult to determine how many unique visitorsthere were to that site. It is even more difficult to assessexactly who these consumers were demographically,470

Conducting Research Online: Challenges Facing Researchers
58
especially those who chose not to participate in thestudy.
If the invitation is posted on a website that the re-searchers do not control, they must rely on the host fordata needed to calculate a response rate. Some compa-475nies or organizations may be unwilling to release thisinformation because of concern that a competitor mayuse it to gain an advantage. For example, Cude andMorganosky (2000; Morganosky & Cude, 2002) se-cured the cooperation of an online grocer that was will-480ing to post an invitation to participate in the surveyafter a consumer submitted an online grocery order.However, the researchers were unable to calculate aresponse rate because the online grocer would not pro-vide information to them on the number of customers485who purchased groceries online.
With respect to conducting online studies of stu-dents, researchers such as Lawrence et al. (2003) andLyons (2003, 2004) were able to assess whether theirsamples were representative of the student populations490as a whole. They were also able to obtain fairly accu-rate response rates because they knew, for the mostpart, how many students had been sent e-mail invita-tions to participate in the study. However, even in thesecases, it was difficult for the researchers to determine495exact response rates because of possible problems withthe mailing lists such as multiple e-mail addresses forstudents and outdated addresses.
In the end, it is critical that researchers using onlinemethodologies establish, to the best of their abilities,500that their sample is representative of the population ofinterest and that every available means was used tosecure the highest possible response rates. Only thencan researchers assess whether an online survey is aneffective means to collect data from their target popula-505tions.
Survey Design and ImplementationOnce issues with the sample have been resolved,
FCS researchers can begin to consider the design oftheir survey. Developing an online survey and setting510up the website can require an extensive amount ofwork in the months prior to data collection. However,once the survey is posted, it can be completed, submit-ted, and downloaded into a central database in minutes.This section highlights the technical challenges re-515searchers may face prior to launching a survey.
The majority of the discussion in this article has as-sumed that most researchers will post their survey to awebsite. However, a researcher may choose to send thesurvey as an attachment by e-mail. There are several520issues to consider when choosing between an e-mailand an online survey. E-mail surveys might be useful ifthe researcher has a short turnaround time to completethe survey, the survey is short and simple in design,and/or the researcher does not have the technical exper-525tise to design and implement an online survey. How-ever, data collected from an e-mail survey must be
manually entered into a database, unlike the automateddata entry that results from an online survey. Wheneverpossible, more complex surveys should be imple-530mented online rather than e-mailed because onlinesurveys give the researcher more flexibility. Links,drop-down menus, and graphics can be used to helprespondents navigate the survey, especially if thesurvey includes questions in which the answers are535contingent on answers to earlier questions. Specifi-cally, hyperlinks to the required questions can be used,a technique not possible in e-mail surveys because ofdifferences in e-mail programs.
Fortunately, many of the principles of traditional sur-540vey design apply to online survey research as well. Forexample, as with any survey, it is critical that research-ers think about their target audiences and how muchtime they are likely to spend on a survey. Higher re-sponse rates will be generated if messages and ques-545tionnaires are kept short. For example, Volpe et al.(2002) limited the amount of time online investorsneeded to complete their survey to 15 minutes, notingthe busy schedules of investors. Obviously, the timerestriction meant that the researchers had to be selec-550tive about the number and types of investment topicscovered on the survey.
On the other hand, there are other opportunities andchallenges that are unique to online survey methodol-ogy (see Dillman, 2000, for an overview). For exam-555ple, in any survey the presentation and sequencing ofquestions are important because they can affect thequality of the data. A Web-based survey gives the re-searcher a broader choice of methods to reduce theprobability that questions are skipped in error. How-560ever, with this said, Dillman (2000) recommended thatresearchers avoid requiring respondents to answer eachquestion before they are allowed to move on to otherquestions. In addition, unless the order of the questionsis a major concern, Dillman (2000) also recommended565that the design of the survey should be flexible so thatrespondents can scroll quickly and easily from questionto question to get a sense of the length of the surveyand the types of questions being asked.
FCS researchers interested in collecting qualitative570or “free-text” data may find online surveys to be par-ticularly effective. Studies find that online surveys tendto result in more responses and longer responses toopen-ended questions than is typical of traditional mailor telephone surveys (Bachmann el al., 2000; Cude &575Morganosky, 2000; Joinson, 2001; Mehta & Sivades,1995; Moorefield & Proulx, 2004; Oppermann, 1995).Other studies also show that the quality of responses toonline surveys tends to be equal to or better than re-sponses to other survey methods (i.e., Moorefield &580Proulx, 2004; Tse, 1998). Joinson (2001), a behavioralscience researcher, has shown how online surveys canincrease the quantity of information individuals revealabout themselves. He found that the amount of infor-mation individuals reveal can be increased if the re-585

Conducting Research Online: Challenges Facing Researchers
59
searcher also discloses personal information such asbasic demographic information about himself or herself(i.e., a photograph, e-mail address, and telephone num-ber).
There are two main advantages to collecting qualita-590tive information online. First, software now exists thatfacilitates the coding by thematic content of the writtenresponses to open-ended questions (Colvin et al., 2004;Hill et al., 1996). Second, if a researcher plans to usesoftware to analyze the qualitative data, the traditional595first step—typing in the responses—is already com-pleted.
Once critical questions about the survey design havebeen answered, researchers must consider the technicalchallenges associated with posting the survey online.600Researchers who lack the skills to post a survey onlinethemselves have several options available. One ap-proach is to look within their local campus or commu-nity for individuals who have the expertise and skills toprogram the survey onto the Web. For example, a pri-605vate market research firm, a campus-based Survey Re-search Center, or an undergraduate or graduate pro-gram in management information systems (or otherrelated programs) are likely to include individuals whohave the skills to build an online survey. Professors and610students in an undergraduate or a graduate programeven may be looking for projects that the class or indi-vidual students in the class could complete. In addition,a project sponsor may have the resources to build anonline survey. For example, Hill et al. (1996) used615IBM’s existing Online Opinion Survey (OOS) pro-gram. The OOS program could be accessed by em-ployees from IBM’s mainframe computer network andhad built-in error checks that notified the respondent ifan invalid response had been entered.620
Another approach is to use one of several differentwebsites available to build a Web-based survey. A va-riety of software tools are now available on these sites.The tools are becoming increasingly sophisticated yetat the same time easy to use. A few of the sites include625www.surveymonkey.com, www.surveypro.com,www.infopoll.com, www.zoomerang.com, and www.ultrafeedback.com. A feature of many of the websitesis that they allow the researcher to obtain minute-by-minute updates and reports on survey responses and630response rates to each survey question. Essentially,researchers can instantaneously view the results assoon as any respondent has completed the survey. Allof the sites offer basic services at no cost and/or dis-counts for educational and nonprofit organizations.635Pricing generally varies with the number of questions,the number of responses, and the sophistication of thedesign options. For example, the recent price for oneservice was $19.95 per month for up to 1,000 re-sponses; another was charging $499 for 3 months for6401,000 responses.
Once the survey is designed, it is of critical impor-tance that researchers test the survey before it is
launched to ensure that it is working properly and theresponses entered are being collected and stored. It is645fairly common for technical difficulties to arise whenan online survey is first launched. Web browsers andsettings can vary by user, and these differences canaffect the appearance of the online survey. There alsomay be incompatibilities among different systems (i.e.,650different screen configurations or operating systems) ordifficulties with the server (Andrews et al., 2003; Dill-man, 2000; Stanton & Rogelberg, 2001). Researchersmust be prepared to address technical issues quickly.Also, survey respondents need to know who they can655contact if they have difficulty accessing the survey orquestions about the study. To minimize variations insurvey appearance and system incompatibilities, re-searchers may want to design an online survey thatdoes not exceed the “lowest common denominator” of660computer sophistication and complexity (i.e., monitorsize, browser version) of the target population beingsurveyed (Wharton et al., 2003).
Data Storage, Privacy, and ConfidentialityOnce an online survey has been developed and665
tested, it is ready to be posted to the website. The criti-cal questions researchers need to ask before it islaunched are: Where will the data that are entered bedownloaded and how will they be stored? The websitewhere the survey is posted must be on a server that has670the capabilities to download and store the data.
In most cases, researchers may be able to rely ontheir campus or other organization to provide this ser-vice, using their own server for little or no cost. How-ever, researchers may also want to look for hidden or675in-kind resources to host the survey from either theirown organization or a project sponsor (i.e., privatefirm, Survey Research Center, or other partner). Forexample, a project sponsor may have a substantial Webdivision that is capable of hosting the survey and stor-680ing the data on a local data server, resulting in lowersurvey instrumentation costs. The researcher’s organi-zation or the group or organization that built the onlinesurvey may have the resources to host the survey andstore the data. Finally, an advantage of using a website685such as surveymonkey.com or surveypro.com to buildan online survey is that the website will host the surveyand store the data, which the researchers maydownload at any time.
Whichever direction researchers choose to take, the690survey needs to be set up so that the data are collectedusing an appropriate database. Selection of the data-base depends, in part, on whether the data are quantita-tive or qualitative. For example, more qualitative re-sponses require larger amounts of storage space. Once695the data are stored, the information typically can betransferred to the researcher in multiple methods. Onesuch method would be a regular digest that is e-mailedto the researcher; this could be daily or weekly. Therealso can be a download-on-demand feature as well as700

Conducting Research Online: Challenges Facing Researchers
60
using file transfer protocol with the host server. Thesedownloads can be in ASCII text format or even Micro-soft Excel spreadsheets. Either of these formats can beimported into most statistical analysis programs such asSAS and SPSS.705
Given consumer privacy issues, researchers alsomust ensure that the data being entered are downloadedand stored on a secure server. One of the most commonmethods used by researchers to secure the data as theyare collected is to use an encryption method to design710the Web pages where information is gathered and sentto the database. There are different levels of encryp-tion; the current standard is 128-bit Secure SocketLayer encryption. Encrypted data can be opened onlyby the appropriate machines and are useless to anyone715intercepting the data during its transit from one serverto another (Department of Treasury, n.d.).
Several steps can be taken to secure the server(s) onwhich the data are stored and protect the data frompotential hackers or those with unauthorized access.720Access to the data can be limited to certain machinesand require a password for access (Andrews et al.,2003). For example, Colvin et al. (2004) housed theirsurvey on a secure server that could be accessed onlyby the primary researcher via a user name and pass-725word. Using Macromedia Dreamweaver 3 software andFrontPage, no identifying information such as e-mailaddresses or Web routing numbers were transportedwith the survey when it was submitted. Any survey thatis connected to the Internet also should be protected730from potential hackers through the use of a firewall. Afirewall is a software program that determines whichpackets of information can get to or from the computeror network; it can prevent outside users from accessingthe data (SearchSecurity.com, n.d.).735
Once the data entry process is secured, researchersmust communicate to the target population the stepsthey have taken to protect respondents’ anonymity andconfidentiality so that they feel comfortable providingand submitting information online. Although research-740ers increasingly are using online surveys, it is stilllikely that many potential respondents may be complet-ing a survey online for the first time. Those populationsthat lack experience are likely to be more sensitive tothe issue of consumer privacy. For example, research-745ers have found that women and older adults havegreater concerns about personal privacy than do menand younger individuals (Dommeyer & Gross, 2003).Groups that are more experienced with the Internettypically have fewer concerns about online privacy750issues. These groups, such as online shoppers, inves-tors, and students, typically are more experienced inusing remote purchasing methods (i.e., mail order) andcompleting transactions online (Miyazaki & Fernan-dez, 2001).755
Regardless of the level of experience, response ratesare likely to be higher if researchers are able to provideassurance that measures are in place to protect partici-
pant privacy and anonymity. Cho and LaRose (1999)provided researchers with a variety of measures that760can be used to address privacy concerns related toonline surveys. These include separating the consentform from the survey, compensating for the privacyintrusion by offering incentives, collecting data throughWeb pages (to separate respondents’ e-mail addresses765from the data), and offering alternative ways to respond(see also Stanton & Rogelberg, 2001). Researcherswho plan to collect data from some groups, such asemployees or military personnel, may find that onlinesurveys are inappropriate, especially if researchers are770unable to provide adequate assurance that the employerwill not have access to the information being collected.
In addition to providing assurance to their respon-dents, researchers also need to provide assurance andobtain approval to conduct their study from their insti-775tutional review board that protects human subjects (i.e.,Im & Chee, 2002; Stanton & Rogelberg, 2001). It iscritical that researchers set aside an appropriate amountof time to obtain approval on their campus or else-where before the study is conducted. Often, researchers780underestimate the amount of time it will take to obtainhuman subjects’ approval, especially for an onlinestudy, as these studies present special issues related todata security and confidentiality. Researchers should beaware that they may be asked to provide more instruc-785tion and orientation to respondents than they otherwisewould need to with an oral or written survey instru-ment. In addition, if a company or organization hasagreed to provide access to an e-mail list or online di-rectory of members or to post an invitation to partici-790pate on a website, that entity also may request or re-quire the opportunity to review the survey before thestudy can be conducted. The bottom line is that re-searchers need to plan early when using an online sur-vey because a significant amount of preparation and795technical assistance may be required to ensure the ano-nymity and confidentiality of the respondents.
ConclusionAs online access continues to grow, so too will the
use of online surveys in FCS research. As with any800data collection tool, one must consider the pros andcons. The challenges associated with online surveyingrange from increasing survey response rates and im-proving sample representativeness to survey design,confidentiality, and data storage. (See again the flow-805chart in Table 1 to review the process for conductingan online survey.) Researchers who have not previ-ously conducted an online study may be unaware ofsome of the challenges as well as the time and costsrequired for implementation. For example, unlike mail810surveys, the oversight of the actual data collection canbe time-consuming. In addition, unlike traditional mailor telephone surveys, a significant amount of time mustbe invested before an online study is launched. In par-ticular, a substantial amount of infrastructure must be815

Conducting Research Online: Challenges Facing Researchers
61
in place before the survey can be posted online. Beforeopting to conduct an online survey, researchers shouldconsider the objective(s) of the study, the target popu-lation, and their available resources.
With this said, online surveys can be a powerful data820collection tool. The numerous benefits associated withthe use of online surveys include larger sample sizes,faster response times, less data processing, and lowermarginal costs. Researchers in FCS are increasinglyturning to online surveys because, once a survey is825completed, the data can be downloaded quickly into adatabase for analysis, eliminating the need for dataentry, which can be time- and resource-intensive.
Yet FCS researchers must be aware of the challengesthat lie ahead as the use of online surveys continues. As830their uniqueness begins to fade, online survey responserates are likely to decline. New incentives may beneeded to generate interest and encourage continuedparticipation in online studies. Also, because onlinesurveying is still relatively new to FCS, editors, re-835viewers, and others who evaluate research may not befamiliar with the techniques, especially with respect tothe challenges associated with the generalizability ofthe findings. As more research is conducted usingonline surveying methods, researchers will have a bet-840ter sense of how to evaluate the validity of this type ofresearch and its contributions to the field. In the mean-time, this article lays a foundation by providing insightinto the opportunities and challenges that FCS re-searchers are likely to face when conducting online845survey research. A number of excellent resources andexamples from FCS have been cited that serve as astarting point to any investigator who wants to learnmore about online surveying techniques.
ReferencesAnderson, R. M., Donnelly, M. B., & Hess, G. E. (1992). An assessment of
computer use, knowledge, and attitudes of diabetes educators. DiabetesEducation, 18(1), 40–46.
Andrews, D., Nonnecke, B., & Preece, J. (2003). Electronic survey methodol-ogy: A case study in reaching hard-to-involve Internet users. InternationalJournal of Human-Computer Interaction, 16(2), 185–210.
Bachmann, D. P., Elfrink, J., & Vazzana, G. (2000). E-mail and snail mail faceoff in rematch. Marketing Research, 11(4), 10–15.
Baruch, Y. (1999). Response rates in academic studies: A comparative analy-sis. Human Relations, 52(4), 421–434.
Birnbaum, M. H. (2004). Human research and data collection via the Internet.Annual Review of Psychology, 55(1), 803–832.
Cho, H., & LaRose, R. (1999). Privacy issues in Internet surveys. Social Sci-ence Computer Review, 17(4), 421–434.
Cobanoglu, C., Warde, B., & Moreo, P. J. (2001). A comparison of mail, fax,and Web-based survey methods. International Journal of Market Research,43(4), 441–452.
Colvin, J., Chenoweth, L., Bold, M., & Harding, C. (2004). Caregivers of olderadults: Advantages and disadvantages of Internet-based social support.Family Relations, 53(1), 49–57.
Cook, C., Heath, F., & Thompson, R. L. (2000). A meta-analysis of responserates in Web- or Internet-based surveys. Educational and PsychologicalMeasurement, 60(6), 821–836.
Cooper, A., Morahan-Martin, J., Mathy, R. M., & Maheu, M. (2002). Towardan increased understanding of user demographics in online sexual activities.Journal of Sex & Marital Therapy, 28, 105–129.
Cude, B. J., & Morganosky, M. (2000). Consumer response to online groceryshopping. International Journal of Retail and Distribution Management, 28,17–26.
Daley, E., McDermott, R., McCormack-Brown, K., & Kittleson, M. (2003).Conducting Web-based survey research: A lesson in Internet designs.American Journal of Health Behavior, 27(2), 116–124.
Department of Treasury. (n.d.). 128 bit Secure Sockets Layer (SSL) encryption.Retrieved May 1, 2004, from http://www.michigan.gov/treasury/0%2C1607%2C7-121-1750_17289-52359—%2C00.html
Dillman, D. A. (2000). Mail and Internet surveys: The tailored design method(2nd ed.). New York: John Wiley.
Dommeyer, C. J., & Gross, B. L. (2003). What consumers know and what theydo: An investigation of consumer knowledge, awareness, and use of privacyprotection strategies. Journal of Interactive Marketing, 17(2), 34–51.
Farris, N. A., Stoupa, R. A., Mendenhall, J. D., & Mazzuca, K. B. (1994). Acomputerized education module for documenting patient outcomes. Com-puters in Nursing, 12(6), 272–276.
Gosling, S. D., Vazire, S., & Srivastava, S. (2004). Should we trust Web-basedstudies? A comparative analysis of six preconceptions about Internet ques-tionnaires. American Psychologist, 59(2), 93–104.
Hanna, S. D., Gutter, M. S., & Fan, J. X. (2001). A measure of risk tolerancebased on economic theory. Financial Counseling and Planning, 12, 53–60.
Hill, E. J., Hawkins, H. J., & Miller, B. C. (1996). Work and family in thevirtual office: Perceived influences on mobile telework. Family Relations,45(31), 293–301.
Im, E., & Chee, W. (2002). Issues in protection of human subjects in Internetresearch. Nursing Research, 51, 266–269.
Jackson, A., & DeCormier, R. (1999). E-mail survey response rates: Targetingincreases response. Marketing Intelligence & Planning, 17(3), 135–139.
Joinson, A. (2001). Knowing me, knowing you: Reciprocal self-disclosure inInternet-based surveys. Cyber Psychology & Behavior, 4, 587–591.
Katz, J., & Aspden, P. (1997). Motivations and barriers to Internet usage:Results of a national public opinion survey. Internet Research: ElectronicNetworking Applications and Policy, 7(3), 170–188.
Kwon, K. N., & Lee, J. (2003). Concerns about payment security of Internetpurchases: A perspective on current on-line shoppers. Clothing and TextilesResearch Journal, 21(4), 174–184.
Lawrence, F. C., Christofferson, R. C., Nester, S., Moser, B., Tucker, J. A., &Lyons, A. C. (2003). Credit card usage of college students: Evidence fromLouisiana State University (Research Information Sheet No. 107). BatonRouge: Louisiana State University, Agricultural Center.
Lenhart, A. (2003, April 16). The ever-shifting Internet population: A new lookat Internet access and the digital divide. Retrieved September 15, 2003,from http://www.pewinternet.org/reports/pdfs/PIP_Shifting_Net_Pop_Report.pdf
Litvin, S. W., & Kar, G. H. (2001). E-surveying for tourism research: Legiti-mate tool or a researcher’s fantasy? Journal of Travel Research, 39(3), 308.
Lyons, A. C. (2003). The credit usage and financial education needs ofMidwest college students (Report to Midwest College Administrators).Urbana/Champaign: University of Illinois at Urbana-Champaign.
Lyons, A. C. (2004). A profile of financially at-risk college students. Journalof Consumer Affairs, 38(1), 56–80.
McDonald, H., & Adam, S. (2003). A comparison of online and postal datacollection methods in marketing research. Marketing Intelligence & Plan-ning, 21(2), 85–95.
McKay, H. G., King, D., Eakin, E. G., Seeley, J. R., & Glasgow, R. E. (2001).The Diabetes Network Internet-Based Physical Activity Intervention: Arandomized pilot study. Diabetes Care, 24(8), 1328–1334.
Meadows, K. A., Fromson, B., Gillespie, C., Brewer, A., Carter, C., Locking-ton, T., et al. (1988). Development, validation, and application of computer-linked knowledge questionnaires in diabetes education. Diabetic Medicine,5(1), 61–67.
Mehta, R., & Sivades, E. (1995). Comparing response rates and responsecontent in mail versus electronic mail surveys. Journal of the Market Re-search Society, 37(4), 429–439.
Miyazaki, A. D., & Fernandez, A. (2001). Consumer perceptions of privacyand security risks for online shopping. Journal of Consumer Affairs, 35(1),27–44.
Moorefield, B. S., & Proulx, C. M. (2004, November). Couple identity andcouple-verification: Extending identity theory to gay male couples andfamilies. Discussion paper at the 33rd Theory Construction and ResearchMethodology Workshop, Vancouver, Canada.
Morganosky, M. A., & Cude, B. J. (2002). Consumer demand for online foodretailing: Is it really a supply side issue? International Journal of Retail andDistribution Management, 30, 451–458.
Murray, D., & Fisher, J. (2002). The Internet: A virtually untapped tool forresearch. Journal of Technology in Human Services, 19(2/3), 5–18.
Nosek, B. A., Banaji, M. R., & Greenwald, A. G. (2002). E-research: Ethics,security, design, and control in psychological research on the Internet.Journal of Social Issues, 58(1), 161–177.
Oppermann, M. (1995). E-mail surveys—potentials and pitfalls. MarketingResearch, 7, 29–33.

Conducting Research Online: Challenges Facing Researchers
62
Pollack, S., Foster, K., & Robinson, V. (2004). Making the financial grade:The state of personal financial knowledge and credit card use among fresh-men and sophomore college students in Georgia. Athens: University ofGeorgia, Carl Vinson Institute of Government.
Reips, U. (2002). Internet-based psychological experimenting: Five do’s anddon’ts. Social Science Computer Review, 20, 241–249.
SearchSecurity.com. (n.d.). Firewall. Retrieved May 1, 2004, fromhttp://searchsecurity.techtarget.com/sDefinition/0%2C%2Csid14_gci212125%2C00.html
Selwyn, N., & Robson, K. (1998). Using e-mail as a research tool. SocialResearch Update. Retrieved June 20, 2004, from http://www.soc.surrey.ac.uk/sru/SRU21.html
Solomon, D. J. (2001). Conducting Web-based surveys. Practical Assessment,Research & Evaluation, 7(19). Retrieved June 20, 2004, fromhttp://PAREonline.net
Stanton, J. M., & Rogelberg, S. G. (2001). Research methods and the Internetusing Internet/Intranet Web pages to collect organizational research data.Organizational Research Methods, 4(3), 200–217.
Taylor, H. (2000). Does Internet research work? International Journal ofMarket Research, 42(1), 51–63.
Tse, A. C. B. (1998). Comparing the response rate, response speed, and re-sponse quality of two methods of sending questionnaires: E-mail vs. mail.Journal of the Market Research Society, 40(4), 353–362.
UCLA Center for Communication Policy. (2003). The UCLA Internet Report:Survey the digital future—Year three. Retrieved January 7, 2004, fromhttp://ccp.ucla.edu/pdf/UCLA-Internet-Report-Year-Three.pdf
Vereecken, C. (2001). Paper pencil versus PC administered querying of a studyon health behaviour in school-aged children. Archives of Public Health,59(1), 43–61.
Volpe, R. P., Kotel, J. E., & Chen, H. (2002). A survey of investment literacyamong online investors. Financial Counseling and Planning, 13, 1–13.
Wharton, C., Hampl, J. S., Hall, R., & Winham, D. M. (2003). PCs or paperand pencil: Online surveys for data collection. Journal of American DieteticAssociation, 103(11), 1458, 1460.
Wilson, A., & Laskey, N. (2003). Internet based marketing research: A seriousalternative to traditional research methods? Marketing Intelligence & Plan-ning, 21(2), 79–84.

Conducting Research Online: Challenges Facing Researchers
63
Notes:

Conducting Research Online: Challenges Facing Researchers
64
Notes:


![[RTF]documents.routledge-interactive.s3.amazonaws.comdocuments.routledge-interactive.s3.amazonaws.com...In Meditation I, Descartes envisages the possibility that he is being telepathically](https://static.fdocuments.in/doc/165x107/5ae7f52b7f8b9a29048f6dd4/rtf-meditation-i-descartes-envisages-the-possibility-that-he-is-being-telepathically.jpg)