Measuring and Supporting Classroom Management- Outcomes, Systems
Upload
nickolas-cumberledgeCategory
view
218download
1
Learning Outcomes Assessment Plan


The mission of the Mathematics Department is to provide quality education in various areas of mathematics to support certificate and degree programs. The department is committed to prepare all students who lack basic math skills by offering developmental courses in arithmetic and introductory algebra. In addition, the department also offers courses in vocational technical math, college algebra and trigonometry, statistics and calculus to ensure that ASCC students acquire the necessary mathematical foundation for entry into the work force or for transferring to four-year institutions.

All Math courses(100%) have Learning Objectives that are aligned to department student learning outcomes and Institutional learning outcomes( stated on course syllabi).
Assessment of learning objectives: Implement formative assessment (informal evaluation) and summative assessment instruments such as homework, quizzes, tests, class discussions, students’ questions, and in-class individual/group oral presentations.

1. Understand and appreciate the fundamental concepts of mathematics and its usefulness in everyday life;
2. Comprehend, interpret and evaluate mathematical concepts presented by a math instructor.
3. Identify and apply acquired mathematical knowledge and skills to real work situations.
4. Demonstrate the ability to analyze, identify and assess mathematical problems and formulate effective solutions.
5. Apply technology to locate, interpret, organize and present mathematical data; and
6. Recognize relevance of mathematics to life-long learning.

Individual oral presentation/ (group presentation is the instrument that is implemented by the department to assess its SLOs with emphasis on students’ communication skills.
Approved rubric provided by Academic Affairs Division (AAD) is used to assess students’ communication skills.
In addition, the department also developed its own set of rubrics to assess its courses.
Since Fall 08, all math courses (100%) have been assessed using the identified assessment instrument.
Beginning this semester (Fall 09), each instructor has identified at least two courses that will assess Life skills.

Spring08 Summer08 Fall08 Spring09 Summer09
Math80
Math90
Math150
Math151
Math155
Math250
Math260
Math280
Math281

SLO#1
SLO#2 SLO#3 SLO#4 SLO#5 SLO#6
MATH80
MATH90
MATH150
MATH151
MATH155
MATH250
MATH260
MATH280
MATH281

Data for each math course has been analyzed
Overview of the Department’s strengths and Areas of improvement
Recommendations by the department based on the analysis

Fall 08 Mean Percent
Organization 3.5 87.5%Subject knowledge 3.5 87.5%Graphic 4 100%Mechanic 4 100%Eye contact 4 100 %Elocution 4 100 %
Fall 08 Mean Percent
Organization 3.5 87.5%Subject knowledge 3.5 87.5%Graphic 4 100%Mechanic 4 100%Eye contact 4 100 %Elocution 4 100 %
DEFINING THE “MEAN”0.0 - 1.9 Beginning level of LO
2.0 – 2.9 Developing level of LO
3.0 – 3.9 Accomplished level of LO
4.0 Exemplary level of LO

Spring08 Mean (%) Spring 09 Mean (%) Organization 3.7 93% Organization 4 100% Subject knowledge 3.7 93% Subject Knowledge 3.8 96% Graphics 3.4 85% Graphic 3 75% Mechanics3.85 96% Mechanics 3 75% Eye contact 3 75% Eye contact 4
100% Elocution 3.85 96% Elocution 4 100%
Spring08 Mean (%) Spring 09 Mean (%) Organization 3.7 93% Organization 4 100% Subject knowledge 3.7 93% Subject Knowledge 3.8 96% Graphics 3.4 85% Graphic 3 75% Mechanics3.85 96% Mechanics 3 75% Eye contact 3 75% Eye contact 4
100% Elocution 3.85 96% Elocution 4 100%
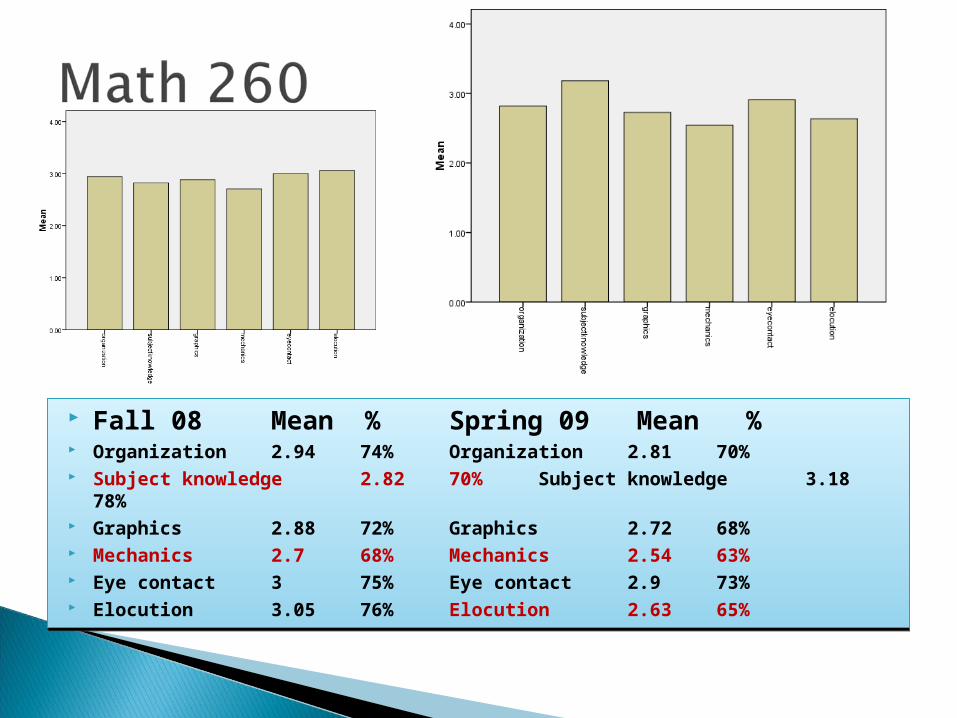
Fall 08 Mean % Spring 09 Mean % Organization 2.94 74% Organization 2.81 70% Subject knowledge 2.82 70% Subject knowledge 3.18 78% Graphics 2.88 72% Graphics 2.72 68% Mechanics 2.7 68% Mechanics 2.54 63% Eye contact 3 75% Eye contact 2.9 73% Elocution 3.05 76% Elocution 2.63 65%
Fall 08 Mean % Spring 09 Mean % Organization 2.94 74% Organization 2.81 70% Subject knowledge 2.82 70% Subject knowledge 3.18 78% Graphics 2.88 72% Graphics 2.72 68% Mechanics 2.7 68% Mechanics 2.54 63% Eye contact 3 75% Eye contact 2.9 73% Elocution 3.05 76% Elocution 2.63 65%

Summer09 Mean % Spring09 Mean % Fall 08 Mean %
organization 3.51 88% 3.3 83% 3.2 80%
Subject knowledge 3.27 82% 2.95 74% 3.11 78%
Graphic 2.97 74% 2.85 71% 2.7 68%
Mechanics 2.84 71% 2.93 74% 2.9 73%
Eye contact 2.94 74% 3 75% 2.95 74%
Elocution 2.75 69% 3.2 80% 3.38 83%
Summer09 Mean % Spring09 Mean % Fall 08 Mean %
organization 3.51 88% 3.3 83% 3.2 80%
Subject knowledge 3.27 82% 2.95 74% 3.11 78%
Graphic 2.97 74% 2.85 71% 2.7 68%
Mechanics 2.84 71% 2.93 74% 2.9 73%
Eye contact 2.94 74% 3 75% 2.95 74%
Elocution 2.75 69% 3.2 80% 3.38 83%

Fall08 Mean % Spring09 Summer09 Organization 3.8 95% 3.25 81% 3 75% Subject knowledge 3.36 84% 3.5 88% 3.3 83% Graphic 4 100% 2.87 72% 3 75% Mechanic 4 100% 2.75 69% 2.86 72% Eye Contact 4 100% 3.25 81% 2.66 67% Elocution 4 100% 2.75 69% 2.8 70%
Fall08 Mean % Spring09 Summer09 Organization 3.8 95% 3.25 81% 3 75% Subject knowledge 3.36 84% 3.5 88% 3.3 83% Graphic 4 100% 2.87 72% 3 75% Mechanic 4 100% 2.75 69% 2.86 72% Eye Contact 4 100% 3.25 81% 2.66 67% Elocution 4 100% 2.75 69% 2.8 70%

Fall08 Spring 09Summer 09
Organization 3 75% 3.1 78% 3.5 88%
Subject knowledge 3 75% 2.86 72% 3.3 83% Graphic 2.75 69% 2.82 72% 2.75 69% Mechanic 3.08 75% 2.82 72% 3.32 83% Eye Contact 3.14 78% 2.93 73% 3.25 81% Elocution 3.24 81% 3.12 78% 2.79 70%
Fall08 Spring 09Summer 09
Organization 3 75% 3.1 78% 3.5 88%
Subject knowledge 3 75% 2.86 72% 3.3 83% Graphic 2.75 69% 2.82 72% 2.75 69% Mechanic 3.08 75% 2.82 72% 3.32 83% Eye Contact 3.14 78% 2.93 73% 3.25 81% Elocution 3.24 81% 3.12 78% 2.79 70%

Summer 2009 Mean %
Organization 3.5 88%
Subject knowledge 3.28 82% Graphics 3.42 86% Mechanics 3.57 89%
Eye contact 3.42 86% Elocution 3.42 86%
Summer 2009 Mean %
Organization 3.5 88%
Subject knowledge 3.28 82% Graphics 3.42 86% Mechanics 3.57 89%
Eye contact 3.42 86% Elocution 3.42 86%

Spring 09 Mean % Summer 09 Mean % Organization 2.9 73% 2.85 71% Subject knowledge 2.6 67% 2.8 70% Graphics 1.4 37% 1.56 39% Mechanics 1.4 37% 2.6 66% Eye contact 2.61 65% 2.5 63% Elocution 2.8 70% 2.71 68%
Spring 09 Mean % Summer 09 Mean % Organization 2.9 73% 2.85 71% Subject knowledge 2.6 67% 2.8 70% Graphics 1.4 37% 1.56 39% Mechanics 1.4 37% 2.6 66% Eye contact 2.61 65% 2.5 63% Elocution 2.8 70% 2.71 68%

Fall 08 Mean % Spring 09 Summer09 Organization 2.76 69% 2.67 67% 2.78 70% Subject knowledge 2.79 70% 2.78 70% 3.10 78% Graphics 0 0% 1.10 28% 1.66 42% Mechanics 2.88 72% 2.81 70% 2.96 74% Eye contact 2.51 63% 2.66 67% 2.88 72% Elocution 2.6 65% 2.83 71% 2.62 66%
Fall 08 Mean % Spring 09 Summer09 Organization 2.76 69% 2.67 67% 2.78 70% Subject knowledge 2.79 70% 2.78 70% 3.10 78% Graphics 0 0% 1.10 28% 1.66 42% Mechanics 2.88 72% 2.81 70% 2.96 74% Eye contact 2.51 63% 2.66 67% 2.88 72% Elocution 2.6 65% 2.83 71% 2.62 66%

Strengths Visual improvement on some of the criteria for
several courses as we compare and contrast data from previous semester
The assessment instrument provided data on how teaching can be improved by exploring other teaching strategies
Data provided evidence on the areas of improvement for the department
Identification of math courses and objectives that need to be revisited and revised for the next catalog.
Visual data on alignment of learning objectives to student learning outcomes and addressing the institutional mission and outcomes.
The data provided the level of critical thinking and problem solving skills for all math students
Both remedial courses have low percentages on all criteria (78% is the highest for Math 80, and 73% for Math 90) . Data suggested possible need to identify another alternative assessment instrument for remedial courses.
Data suggested improvement on the following:
Percentages of Graphics criteria for remedial courses is generally low ( Need to address)
Lacking data for Math 281and Math 150, need to compare and contrast .
Factors contributing to students’ low performance in remedial courses. need to identify factors in order to address the needs of all students)
Percentage on subject knowledge, graphics and mechanics are generally lower than other criteria for all math courses (need to assure the learning objectives are met for all courses)
Math Tutorial -need to develop a strong math tutoring program for remedial courses (need to assure students are attending tutorial sessions)
Is there a correlation between students final grades and data provided by the instrument?

Need to review and revisit the whole math curriculum based on the results, review of course descriptions, course objectives, pre-requisites for next catalog. Also a need to review and probably revise student learning outcomes to assure the department is meeting all levels of Bloom’s taxonomy.
Need to review learning objectives for all courses, assure all learning objectives are met for successful entrance to the next level of math.
Identifying other possible assessment instruments for remedial courses
Need to revisit teaching strategies and learning styles for remedial courses with the emphasis on critical thinking and problem solving skills
Emphasize the need for students’ to attend Tutorial Program (Need to establish strong communication with existing tutoring programs offered on campus)-LSAMP, SSS, and Student Services.
Need to consider the time to implement the assessment instrument and how frequently the department needs to assess communication skills throughout the semester.


![Classroom Assessment: Every Student a LearnerChapter 1 • Classroom Assessment: Every Student a Learner [ 2 ] CLASSROOM ASSESSMENT LITERACY We define classroom assessment literacy](https://static.fdocuments.in/doc/165x107/5e2c1e27b7168d19a5615ed2/classroom-assessment-every-student-a-learner-chapter-1-a-classroom-assessment.jpg)