Learning Objectives for Section 1.2 Graphs and Lines Learning Objectives for Section 1.2 Graphs and...
12
Learning Objectives for Section 1.2 Graphs and Lines After this lecture and the assigned homework, you should be able to calculate the slope of a line. identify and work with the Cartesian coordinate system. graph lines using the slope-intercept method 1 graph lines using the slope intercept method. graph lines using the graphing calculator. graph lines using the intercepts. graph special forms of equations of lines. write equations of lines given two points. solve applications of linear equations. Linear Equations in Two Variables A linear equation in two variables is an equation that can be written in the standard form Ax + By = C, where A, B, and C are constants (A and B not both 0), and x and y are variables. Li i h li A hi i h i ll d 2 Linear equations graph lines. Anything not straight is called a curve. A solution of an equation in two variables is an ordered pair of real numbers that satisfy the equation. For example, (4,3) is a solution of 3x -2y = 6. (plug into eq.) The solution set of an equation in two variables is the set of all solutions of the equation. The graph of an equation is the graph of its solution set. Linear Equations How can you tell a linear equation from other equations? A linear equation can be written in the forms: Ax By C + = where A, B, and C are constants and x and y are variables. STANDARD FORM: 1. 3 (numbers) 2. A linear equation graphs a straight line. y mx b = + SLOPE-INTERCEPT FORM: where m is the slope and b is the y-intercept. POINT-SLOPE FORM: 1 1 ( ) y y mx x − = − where m is the slope and (x 1 ,y 1 ) is a point.
Transcript of Learning Objectives for Section 1.2 Graphs and Lines Learning Objectives for Section 1.2 Graphs and...

1
Learning Objectives for Section 1.2 Graphs and Lines
After this lecture and the assigned homework, you should be able tocalculate the slope of a line. identify and work with the Cartesian coordinate system. graph lines using the slope-intercept method
1
graph lines using the slope intercept method.graph lines using the graphing calculator.graph lines using the intercepts.graph special forms of equations of lines.write equations of lines given two points.solve applications of linear equations.
Linear Equations in Two Variables
A linear equation in two variables is an equation that can be written in the standard form Ax + By = C,
where A, B, and C are constants (A and B not both 0), andx and y are variables.Li i h li A hi i h i ll d
2
Linear equations graph lines. Anything not straight is called a curve.A solution of an equation in two variables is an ordered pair of real numbers that satisfy the equation.
For example, (4,3) is a solution of 3x - 2y = 6. (plug into eq.)
The solution set of an equation in two variables is the set of all solutions of the equation.The graph of an equation is the graph of its solution set.
Linear Equations
How can you tell a linear equation from other equations?
A linear equation can be written in the forms:Ax By C+ =
where A, B, and C are constants and x and y are variables.STANDARD FORM:
1.
3
(numbers)
2. A linear equation graphs a straight line.
y mx b= +SLOPE-INTERCEPT FORM:
where m is the slope and b is the y-intercept.
POINT-SLOPE FORM: 1 1( )y y m x x− = −where m is the slope and (x1,y1) is a point.

2
Slope of a Line
Slope of a line:
o( )1 1,x y run
risexxyym =
−−
=12
12
4
rise
runo ( )2 2,x y
Note: The slope of a line is the SAME everywhere on the line!!! You may use any two points on the line to find the slope.
Calculating Slope
Example 1: Calculate the slope between the given points.
a) (1, 2) and (3, –2)
5
Calculating Slope
Example 2: Calculate the slope between the given points.
(3, 7) and (1, 7)?
6

3
SlopeVerdict: vertical lines have NO SLOPE. In particular, the concept of slope simply does not work for vertical lines. The slope doesn't exist! Let's do the calculations. I'll use the points (4, 5) and (4, –3); the slope is:
7
Calculating Slope
Example 3: Calculate the slope between the given points.
c) (1, 2) and (5, 5)
8
Slope = 3/4
Calculating Slope
Example 4: Calculate the slope between the given points.
c) (4, 9) and (4, 3)
9

4
Determining Slope
yExample 5: Estimate the slope of the line graphed below.
10
xSlope = -2
(2,0) and (1, 2)
m = 0-2/2-1 = -2
Intercepts of a Line
x-intercept: where the graph crosses the x-axis.
The coordinates are (a, 0).T fi d h i t t l 0 d l f
11
y-intercept: where the graph crosses the y-axis.
The coordinates are (0, b).
To find the x-intercept, let y = 0 and solve for x.
To find the y-intercept, let x = 0 and solve for y.
Graphing Linear Equations
To graph linear equations, you may use A table of values (aka t-chart, x,y chart)The x- and y- intercepts
12
The x and y interceptsThe graphing calculatorThe slope-intercept method
(Personally, I usually find this method most useful)

5
Slope-Intercept Form
The equation
y = mx+b
is called the slope-intercept form of an equation of a line.
m represents the slopeb represents the y-coordinate of the y-
intercept
13
Y-intercept of a Line
y-intercept: where the graph crosses the y-axis. The coordinates are (0, b).
For instance, if b = 6, the line has a y-intercept at (0, 6).
As mentioned before…
Example 3: Give the coordinates of the y-intercept of the
14
a) y = 2x – 4 b) y = -5x + 9
Example 3: Give the coordinates of the y intercept of the graphs of the following equations:
y-intercept = -4 y-intercept = 9
Find the Slope and Intercept from the Equation of a Line
Example 6: Find the slope and y- intercept of the line whose equation is 3x – 4y = 12.
-4y = -3x +12 : added -3x to both sides
15
y
y = -3x + 12/-4 : Divided both sides by – 4
y = 3/4x – 3
Slope = ¾ and y-intercept = - 3

6
Using Slope-Intercept to Graph a Line
Example 7: Now graph the equation 3x – 4y = 12 using the slope-intercept method.
y1. Write equation in slope-intercept form.
16
x
y = 3/4x – 3
2. Plot y- intercept.
3. Plot other points by counting the slope from the y-intercept.
4. Draw the line.
5. Label the line. x and y intercepts
Using Slope-Intercept to Graph a Line
Example 8: Graph the equation 2x + 3y = 18 using the slope-intercept method.
yy = -2/3x + 9
17
x
(9,0), (0,6)
Using Intercepts to Graph a Line
Example 9: Graph 2x – 6y = 12 by first finding the intercepts.1. Compute the x- and y- intercepts.
2. Plot the intercepts.
18
3. Compute a 3rd point as a check.
4. Draw the line.
5. Label the line.

7
Using Intercepts to Graph a Line
Example 10: Graph 2x – 6y = 12 by finding the intercepts.
yx y0 -2
19
x
6 0-3 -3
Using a Graphing Calculator
Example 11: Graph 2x - 6y = 12 on a graphing calculator and find the intercepts.1. Get the equation in y = mx + b form. (Solve for y.)
20
2. Type the equation into the calculator.
• Hit and enter in the right side of the equation.
Using a Graphing Calculator (continued)
Example 11 continued: Graph 2x - 6y = 12 on a graphing calculator and find the intercepts.
3. Hit . Adjust the window settings, if necessary.
21
The standard window settings work well for this example, but other problems will require adjusting the window.

8
Using a Graphing Calculator (continued)
Example 11 continued: Graph 2x - 6y = 12 on a graphing calculator and find the intercepts.
4. Find the intercepts.To find the x-intercept,
22
Hit then (CALC menu). Choose 2: Zero. Then answer the following questions that appear by using the left and right arrows:
Left bound? pick a point to the left of the x-intercept, then hit
Right Bound? pick a point to the right of the x-intercept, then hit
Guess? Place the cursor on your guess of the x-intercept, then hit
Using a Graphing CalculatorExample
Example 12: Given y = -0.6x + 15.6 find the intercepts to one decimal place 1) algebraically and 2) using the graphing calculator.
1) Algebraically
23
Using a Graphing CalculatorExample (continued)
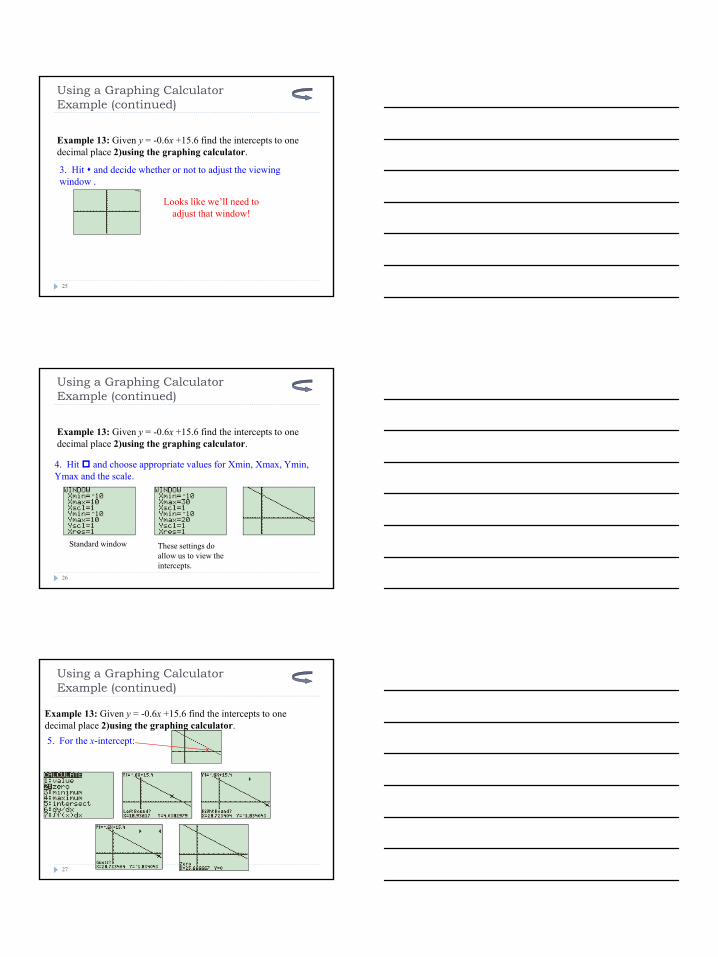
Example 13: Given y = -0.6x +15.6 find the intercepts to one decimal place 2)using the graphing calculator.
1. Solve for y, if not already done so.
2 Hi h i h i
24
2. Hit then type in the equation.
9
Using a Graphing CalculatorExample (continued)
Example 13: Given y = -0.6x +15.6 find the intercepts to one decimal place 2)using the graphing calculator.
3. Hit and decide whether or not to adjust the viewing window .
25
Looks like we’ll need to adjust that window!
Using a Graphing CalculatorExample (continued)
Example 13: Given y = -0.6x +15.6 find the intercepts to one decimal place 2)using the graphing calculator.
4. Hit and choose appropriate values for Xmin, Xmax, Ymin, Ymax and the scale
26
Ymax and the scale.
Standard window These settings do allow us to view the intercepts.
Using a Graphing CalculatorExample (continued)
Example 13: Given y = -0.6x +15.6 find the intercepts to one decimal place 2)using the graphing calculator.5. For the x-intercept:
27

10
Example
Example 14: Graph a) x = -4b) y = 2
y
28
x
Point-Slope Form
1 1( )y y m x x− = −
where m is the slope and (x y ) is a given point
The point-slope form of the equation of a line is
2 1
2 1
y y mx x−
=−
29
Cross-multiply and substitute the more general x for x2
where m is the slope and (x1, y1) is a given point.
It is derived from the definition of the slope of a line:
ExampleExample 15: Write the equation of a line that passes through the point (-4, 3) with a slope of 1/2. Give your answer in slope-intercept form.
30

11
Example
Example 16: Find the equation of the line through the points (-5, 7) and (4, 16).
Step 1 Find slope with point slope form: m = 1
31
p p p p
Step 2 Use points (4, 16) with point intercept form: y = mx + b16 = 1 · 4 + bb = 16 – (1)(4) so b = 12
Step 3: y = x + 12
Interpreting Slope
Lines that increase from left to right have a ___________ slope.
x
y
32
Lines that decrease from left to right have a ___________ slope.
x
y
Interpreting Slope
Lines that are horizontal have a slope of ____.
x
y
33
Lines that are vertical have an ____________ slope.
x
y

12
Application: Cost analysis
A small business mfg’s picnic tables. The weekly fixed cost is $1,200 and the variable cost is $45 per table. Find the total daily cost of producing x picnic tables. How many picnic tables can be produced for a total weekly cost of $4,800?
Step1: Let C be the total daily cost of producing x picnic tables
34
Step1: Let C be the total daily cost of producing x picnic tables.
Step2: C = $1,200 + 45x
Step3: For C = $4,800
Step4: $1,200 + 45x = $4,800, then solve for x
Step5: x = $4,800 - $1,200 / 45 = 80
Example: Given the points (4,3) and (4,1)a) Find the slope of the line connecting the points.b) Write the equation of the line connecting the points.
Given the equation, x – 2y = 5, find
35
a) The x-intercept. Write your answer as an ordered pair.b) The y-intercept. Write your answer as an ordered pair.
Write the equation of the line, in slope intercept form, that passes through the point (2, -4) with a slope of 1/3.
ScenarioSo, assume we have a product we want to sell for $10.00 and we want to sell 1,000 of them. For this example our total fixed costs are going to be $7,700 and our total variable costs are $4.50/unit. Our formula would look like this:
P=1 000 ($10 00 $4 50) $7 700 = $5 500 $7 700 = $2 200
36
P=1,000 ($10.00 - $4.50) - $7,700 = $5,500 - $7,700 = -$2,200 What happened? Instead of making money we have just lost $2,200. At break even the $2,200 number should be $0. We can't make money at 1000 units so how many must we really sell to break even?
BE = 1,400