
Learning from QRA for pipelines – A case study approach · Learning from QRA for pipelines – A...
22
Learning from QRA for pipelines – A case study approach 22 nd September 2014 8 th CCPS Asia Pacific Regional meeting on process safety
Transcript of Learning from QRA for pipelines – A case study approach · Learning from QRA for pipelines – A...

Learning from QRA for pipelines – A case study approach
22nd September 2014
8th CCPS Asia Pacific Regional meeting on process safety

Overview
• Introduction
• Scope & Objective
• QRA methodology
• Sensitivity analysis
• Observations
• Mitigation Measures
• Learning
• Areas requiring Attention

• Pipelines are a safe and efficient means of
transporting large quantities of crude oil
Require significantly less energy to operate
A much lower carbon footprint
Introduction

Pipeline Incidents
July 31stTaiwan: propylene pipeline explosion
June 27th India (Andhra Pradesh) : Natural Gas pipeline explosion

Introduction: The case studied is for a Pipeline Corridor-Gravity lines
• 3.85 Km long crude oil pipeline from tank farm to refinery pump
house is considered for the study.
• Risk associated with the pipeline is estimated
• Sensitivity analysis is carried out to understand the criticality by
varying inventory, failure frequency and population. Trends are
observed.
Case study
• The objective of the study is to use Sensitivity Analysis to help
identify mitigation measures which can have major impact on risk
reduction.
• To share the learning which at times goes beyond the technical aspects
Scope & Objective
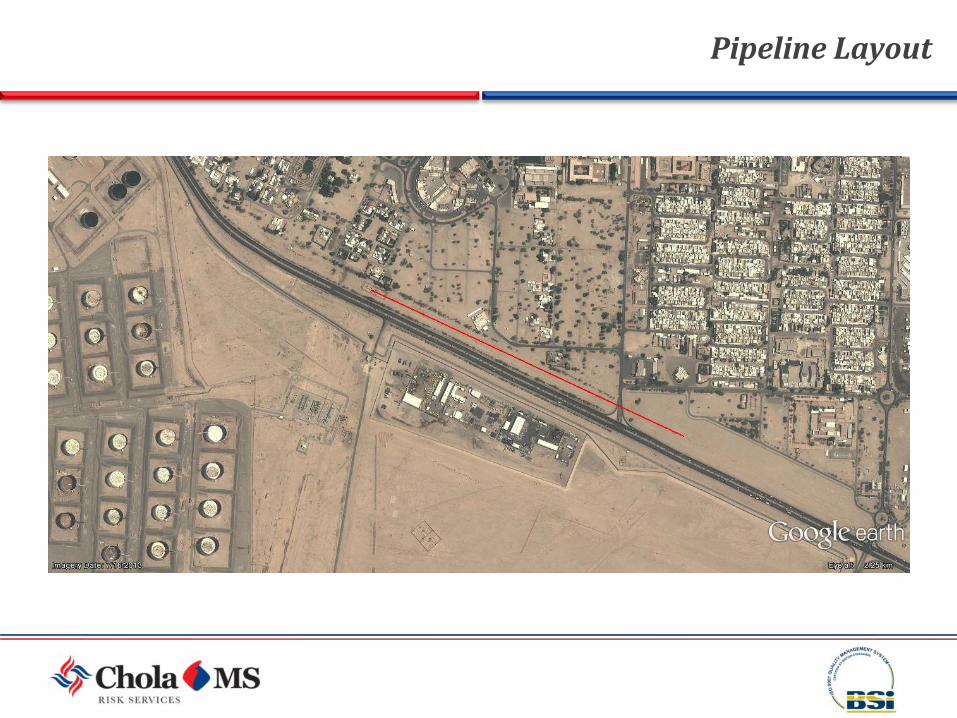
Pipeline Layout

QRA methodology
• Determines the potential for damage or
injury from specific incidents.
• A single release (e.g. Leak of gasoline
pipeline) could result in different possible
outcomes e. g
– Jet fire
– Pool fire
– Flash Fire
– Toxic dispersion
Consequence analysis

QRA methodology
Leak size(mm)
Jet fire: Distance to radiation levels (m)
1.5F Weather condition 5D Weather condition
6.0 Kw/m2
12.5 Kw/m2
37.5 Kw/m2
6.0 Kw/m2
12.5 Kw/m2
37.5 Kw/m2
70 78.9 52.9 13.1 74.3 53.3 34.1
FBR 330.7 239.0 112.3 264.6 193.7 124.6
Jet Fire Consequence analysis

QRA methodology
Leak size(mm)
Pool fire: Distance to radiation levels (m)
1.5F Weather condition 5D Weather condition
6.0 Kw/m2
12.5 Kw/m2
37.5 Kw/m2
6.0 Kw/m2
12.5 Kw/m2
37.5 Kw/m2
70 423.3 306.2 176.7 403.4 301.8 196.2
FBR 708.4 514.8 304.0 715.7 534.8 347.7
Pool fire: Consequence
analysis
QRA methodology
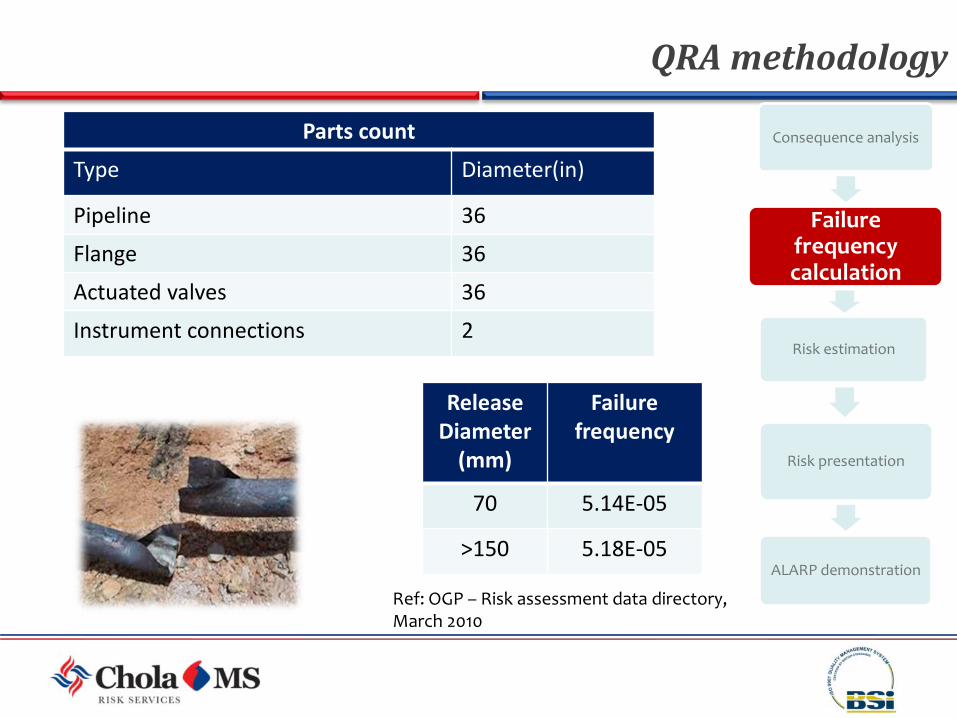
Failurefrequency calculation
Parts count
Type Diameter(in)
Pipeline 36
Flange 36
Actuated valves 36
Instrument connections 2
Release Diameter
(mm)
Failure frequency
70 5.14E-05
>150 5.18E-05
Ref: OGP – Risk assessment data directory, March 2010

QRA methodology
Risk estimation
• This combines the consequences and
likelihood of all incident outcomes from all
selected incidents to provide a measure of
risk.
Risk = Likelihood * Severity
•Risk depends on:
Consequence,
Base event frequency
Ignition probability
Population density in the area
Weather conditions etc.

QRA methodology
Risk presentation
• Individual risk
• Societal risk
Risk associated with pipeline (per average year)
Individual Risk Per Annum
4.64E-03
Societal Risk 1.78E-03

Case – 1 : Increase / decrease in Failure Frequency
• Considering the excavation, nature of pipeline, properties of
chemical flowing (corrosive nature) from the pipeline, failure
frequency may vary.
Sensitivity analysis
Risk 20% Increase in FF
20% Decrease in FF
Individual Risk Per Annum
5.58E-03 3.72E-03
Societal Risk 2.14E-03 1.43E-03
Note: All units are in “ per Average Year”

Sensitivity analysis
4.64E-03
5.58E-03
1.78E-03
2.14E-03
0.00E+00
1.00E-03
2.00E-03
3.00E-03
4.00E-03
5.00E-03
6.00E-03
Normal 20% Increase
20% Increase in failure frequency
IR
SR
4.64E-03
3.72E-03
1.78E-03
1.43E-03
0.00E+00
1.00E-03
2.00E-03
3.00E-03
4.00E-03
5.00E-03
Normal 20% Decrease
20% Decrease in failure frequency
IR
SR
Inference: Risk values directly varies with failure frequency.

Case – 2 : Increase / decrease of Population
• Considering the renovation of the society in the vicinity of the
pipeline or limit the people in the vicinity of pipeline Risk will differs.
Sensitivity analysis
Risk 100% Increase Population
50% Decrease in Population
Individual Risk Per Annum
7.61E-03 2.70E-03
Societal Risk 2.98E-03 1.62E-03
Note: All units are in “ per Average Year”

Sensitivity analysis
4.64E-03
7.61E-03
1.78E-03
2.98E-03
0.00E+00
1.00E-03
2.00E-03
3.00E-03
4.00E-03
5.00E-03
6.00E-03
7.00E-03
8.00E-03
Normal 2*population
100% Increase in Population
IR
SR
4.64E-03
2.70E-03
1.78E-03 1.62E-03
0.00E+00
1.00E-03
2.00E-03
3.00E-03
4.00E-03
5.00E-03
Normal 0.5 Population
50% Decrease in Population
IR
SR
Inference: Risk values directly varies with Population

Observations
• Risk increase or decrease is directly proportional to Failure
Frequency.
• Same is true for Population.
• Hence, ‘Rate of Change’ or slope of this line shall suggest which
parameter shall play a major role in risk reduction
• Consequence shall change based on other factors such as release
inventory, wind speed , easy availability of source of ignition etc.
• Hence, mitigation measures which bring reduction in inventory shall
impact the risk in a major way.

Mitigation Measures
• Target should be to choose a mitigation measure that will have maximum impact on the risk.
• Bund Wall along the pipeline in critical sections with sump / catch pit in safe areas which can contain the major leak.
• Evaluation of addition of Sectionalising valves interlocked with Leak Detection system can help in quick isolation and reduction in leaked quantity.
• Other soft measures such as High Security Fencing, Access Control helping in reducing failure frequency due to third party damage or Corrosion Monitoring and control or reducing population in designated areas.

Learning
• Considering the operation, Interlocking leak/fire detection system
with isolation valves as generally thought to be effective was not
recommended. As per operations group, they close the upstream
valve only, allowing the liquid to flow to Pump house which brings
in the desired reduction in released inventory.
• Require special focus on mitigation measures in Populated areas /
Road crossings etc.

Areas requiring Attention
• Mutual Risk Management --
– Additional Risk due to upcoming process facilities of other service
providers
– Increasing risk due to population increase and compromise on safe
distance from risk source
• Solution –
– Regulations / Guidelines to include ‘Mutual Risk’ aspect?
– Stricter monitoring of Violations – encroachments?

Cholamandalam MS Risk Services Limited (An ISO 9001:2008 Certified Company)
“Parry House” 4th Floor, No. 2, N.S.C. Bose Road, Chennai - 600 001, India Call : + 91 44 3044 5620-30 / Fax +91 44 3044 5550 /
E-mail [email protected] or visit www.cholarisk.com


![QRA Technical Guidance - National Environment … QRA Technical Guidance [Revision No: 3] [Date of Revision: 9th November 2016] Contents 1 QRA Study 2 2 Hazard Identification ...](https://static.fdocuments.in/doc/165x107/5afd2f647f8b9a3234914282/qra-technical-guidance-national-environment-qra-technical-guidance-revision.jpg)


