LEARNING BY DRILLING: INTERFIRM LEARNING AND...
52
LEARNING BY DRILLING: INTERFIRM LEARNING AND RELATIONSHIP PERSISTENCE IN THE TEXAS OILPATCH * R YAN KELLOGG This article examines learning-by-doing that is specific not just to individual firms but to pairs of firms working together in a contracting relationship. Using data from the oil and gas industry, I find that the productivity of an oil produc- tion company and its drilling contractor increases with their joint experience. This learning is relationship-specific: drilling rigs cannot fully appropriate the productivity gains acquired through experience with one production company to their work for another.This result is robust to ex ante match specificities. More- over, producers’ and rigs’contracting behavior is consistent with maximization of relationship-specific learning’s productivity benefits. JEL Codes: D24, L14, L23, L71. I. INTRODUCTION The economic consequences of learning-by-doing, the hypoth- esis that unit costs decrease with cumulative production, are well known. In industrial organization, learning-by-doing can ratio- nalize pricing below short-run marginal cost and lead to increases in industry concentration through the emergence of a low-cost dominant firm ( Spence 1981; Cabral and Riordan 1994; Benkard 2004; Besanko et al. 2010). In macroeconomics, on-the-job learn- ing and knowledge spillovers are widely believed to play impor- tant roles in driving endogenous economic growth (Arrow 1962; Lucas 1988; Stokey 1988; Parente 1994; Jovanovic and Nyarko 1996). This article uses a new data set to document a form of learning that has thus far received little attention: relationship- specific learning. Learning-by-doing can be relationship-specific when the productivity improvements associated with the accumu- lation of experience are specific to not just an individual firm but to pairs of firms working together in a contracting relationship. * I am grateful for financial support from the OpenLink Fund at the Cole- man Fung Risk Management Center. I thank the editor, Lawrence Katz, and three anonymous referees for suggestions that substantially improved the article. This article also benefited from discussions with Daniel Ackerberg, Maximil- ian Auffhammer, Severin Borenstein, Jennifer Brown, Meghan Busse, Michael Greenstone, Jun Ishii, Kai-Uwe K ¨ uhn, Jeffrey Perloff, and numerous seminar participants. Tay Feder provided excellent research assistance. I am particularly grateful to Richard Mason of RigData and Turner Williamson of the Texas Railroad Commission for many illuminating conversations about the onshore Texas drilling industry. c The Author(s) 2011. Published by Oxford University Press, on the behalf of President and Fellows of Harvard College. All rights reserved. For Permissions, please email: journals. [email protected]. The Quarterly Journal of Economics (2011) 126, 1961–2004. doi:10.1093/qje/qjr039. Advance Access publication on October 13, 2011. 1961 at University of California, Berkeley on December 7, 2011 http://qje.oxfordjournals.org/ Downloaded from
Transcript of LEARNING BY DRILLING: INTERFIRM LEARNING AND...

LEARNING BY DRILLING: INTERFIRM LEARNING ANDRELATIONSHIP PERSISTENCE IN THE TEXAS OILPATCH∗
RYAN KELLOGG
This article examines learning-by-doing that is specific not just to individualfirms but to pairs of firms working together in a contracting relationship. Usingdata from the oil and gas industry, I find that the productivity of an oil produc-tion company and its drilling contractor increases with their joint experience.This learning is relationship-specific: drilling rigs cannot fully appropriate theproductivity gains acquired through experience with one production company totheir work for another.This result is robust to ex ante match specificities. More-over, producers’ and rigs’contracting behavior is consistent with maximization ofrelationship-specific learning’s productivity benefits. JEL Codes: D24, L14, L23,L71.
I. INTRODUCTION
The economicconsequences of learning-by-doing, the hypoth-esis that unit costs decrease with cumulative production, are wellknown. In industrial organization, learning-by-doing can ratio-nalize pricing belowshort-run marginal cost andleadtoincreasesin industry concentration through the emergence of a low-costdominant firm (Spence 1981; Cabral and Riordan 1994; Benkard2004; Besanko et al. 2010). In macroeconomics, on-the-job learn-ing and knowledge spillovers are widely believed to play impor-tant roles in driving endogenous economic growth (Arrow 1962;Lucas 1988; Stokey 1988; Parente 1994; Jovanovic and Nyarko1996). This article uses a new data set to document a form oflearning that has thus far received little attention: relationship-specific learning. Learning-by-doing can be relationship-specificwhentheproductivity improvements associatedwiththeaccumu-lation of experience are specific to not just an individual firm butto pairs of firms working together in a contracting relationship.
∗I am grateful for financial support from the OpenLink Fund at the Cole-man Fung Risk Management Center. I thank the editor, Lawrence Katz, andthree anonymous referees for suggestions that substantially improved the article.This article also benefited from discussions with Daniel Ackerberg, Maximil-ian Auffhammer, Severin Borenstein, Jennifer Brown, Meghan Busse, MichaelGreenstone, Jun Ishii, Kai-Uwe Kuhn, Jeffrey Perloff, and numerous seminarparticipants. Tay Feder provided excellent research assistance. I am particularlygrateful to Richard Mason of RigData and Turner Williamson of the TexasRailroad Commission for many illuminating conversations about the onshoreTexas drilling industry.
c© The Author(s) 2011. Published by Oxford University Press, on the behalf of Presidentand Fellows of Harvard College. All rights reserved. For Permissions, please email: [email protected] Quarterly Journal of Economics (2011) 126, 1961–2004. doi:10.1093/qje/qjr039.Advance Access publication on October 13, 2011.
1961
at University of C
alifornia, Berkeley on D
ecember 7, 2011
http://qje.oxfordjournals.org/D
ownloaded from

1962 QUARTERLY JOURNAL OF ECONOMICS
For example, a contract accounting firm may improve the speedwithwhichit prepares aclient’s quarterlyreports as its employeesbecome familiar with the client’s personnel and accounts.
Relationship-specific learning is consequential because it im-plies that relationshipstabilityis important toproductivity. Whentwo firms accumulate experience working together, relationship-specificintellectual capital is created that cannot be appropriatedtopairings withotherfirms. If therelationshipis broken, this cap-ital is destroyed and productivity decreases. Relationship-specificlearning therefore gives firms an incentive to work with contrac-tors with which they have substantial experience, rather thanthose with which they have worked relatively little. This learningmay also be a mechanism behind recent documentation of forget-ting effects. Argote, Beckman, and Epple (1990), Benkard (2000),andThompson(2007) findevidencethat a firm’s recent productionexperience has a stronger impact on productivity than does olderexperience. Some of this experience depreciation may reflect anunobserved change in the firm’s contracting relationships and acommensurate loss of relationship-specific capital. Finally, likeforgetting, relationship-specific learning may be important atthe macroeconomic level: recessions that disrupt production andfracture relationships may result in a productivity decrease thatpersists beyond the rebound in output during the recovery.
Are relationship-specific learning effects sufficiently largethat they plausibly play a role in firms’ contracting or are a deter-minant of economic productivity? The literature is largely silenton this question. This article therefore empirically evaluates theimportance of relationship-specific learning using a new data setfrom the U.S. onshore oil and gas drilling industry. I ask threequestions. First, when production requires coordinated inputsfrom multiple firms, to what extent is productivity a functionof not just each firm’s individual experience but also the firms’joint experience? Second, do firms prefer to maintain long-termrelationships rather than regularly switch contracting partners,consistent with a desire to maximize relationship-specific learn-ing’s productivity benefits? Finally, through what mechanismsdoes relationship-specific learning operate?
The U.S. onshore drilling industry is well suited to thisinvestigation for several reasons. First, drilling requires inputsfrom two types of firms: production companies (“producers”) anddrilling companies. Producers—for example, ExxonMobil andChevron—are responsible for the technical design and planning
at University of C
alifornia, Berkeley on D
ecember 7, 2011
http://qje.oxfordjournals.org/D
ownloaded from

LEARNING BY DRILLING 1963
of wells to be drilled but do not actually drill themselves. Drillingis outsourced to companies that own and staff drilling rigs.Second, learning is an important source of productivity growthin this industry. Drilling cost-efficiency requires the technicaloptimization of drilling procedures as well as teamwork betweenproducer personnel and the rig crew—skills that may be acquiredthrough experience. Third, I have collected excellent data onboth drilling contracting andperformance, covering nearly 20,000wells drilled over 1991–2005, with which I can track drillingefficiency—measured as the number of days required todrill eachwell—for producers, rigs, and producer–rig pairs.
This article’s primary finding is that not only do producersand rigs learn from their own experience, they also benefit fromrelationship-specific learning. Specifically, a rig that works withonly one producer will, on average, benefit from productivityimprovements more than twice as large as those of a rig thatfrequently changes producers. Because I observe multiple wellsdrilled per producer–rig pair, I am able to use producer–rig fixedeffects to distinguish this learning effect from any ex ante matchspecificities that might cause certain firm pairs to drill moreeffectively and more frequently than others.
For the average well in my data set, I estimate thatrelationship-specific learning reduces drilling times by 4.9% onaverage, yielding cost savings of about $12,400 per well. Thesesavings give firms an incentive to maintain long-term relation-ships. Accordingly, the data indicate that producers prefer towork with rigs with which they have accumulated considerableexperience rather than those with which they have worked little.I find that this contracting pattern is difficult to explain withswitching costs or ex ante match specificities alone.
Finally, I examine the mechanism behind the observedrelationship-specific learning. Although these results are empir-ically weaker than the primary finding, the learning appearsto be driven primarily by the accumulation of personal interac-tions between the firms’ personnel rather than rigs’ accumula-tion of geologic or technical knowledge specific to the wells theydrill for their producers.Consistent with this result, I find thatfirms tend to choose a contractual form that increases cross-firm personal contacts when they anticipate working togetherfor an extended period of time—a situation in which maxi-mizing the rate of relationship-specific learning is particularlyimportant.
at University of C
alifornia, Berkeley on D
ecember 7, 2011
http://qje.oxfordjournals.org/D
ownloaded from

1964 QUARTERLY JOURNAL OF ECONOMICS
Though this article focuses on the oil and gas drilling indus-try, it seems likely that the prevalence of relationship-specificlearning extends beyond the oilpatch. Large construction andmanufacturing projects, for example, regularly involve multiplecontractors andsubcontractors workingundera lead, general con-tractor. In addition, while I focus on relationship-specificlearningas a phenomenon that occurs between firms, learning specificitiesare likely to be important within firms as well: workers maydevelopskills that arespecifictotheirparticularemployer. Becker(1964), Prendergast (1993), and Gibbons and Waldman (2004,2006) discuss the implications of job-specific learning for equilib-rium wage and promotion paths, explaining why, for example,wages increase with age at a decreasing rate.1 These theoriescould in principle be translated to the pricing of service contractsbetween firms when learning is relationship-specific.
Theremainderof thearticle is organizedas follows: Section IIprovides backgroundinformationontheoil andgas drillingindus-try, and Section III discusses industry mechanisms for learning-by-doing. Section IV describes the data used in this study.Section V presents a model of learning-by-doing anddiscusses theempirical strategy. Section VI provides the primary estimationresults. Section VII discusses relationship persistence betweenproducers and rigs, and Section VIII examines the mechanismsbehind relationship-specific learning. Section IX concludes.
II. INSTITUTIONAL BACKGROUND
II.A. Production Companies and the Drilling Problem
Oil and gas reserves are found in geologic formations knownas fields that lie beneath the Earth’s surface. The mission of aproduction company is to extract these reserves for processingand sale. To operate in any given field, a producer must firstobtain leases from the holders of that field’s mineral rights. Alease typically grants a right to operate in only a small part ofa field, and most fields are operated by several distinct producersholding different leases.2
1. For an example and survey of the empirical literature on wage dynamics,see Poletaev and Robinson (2008).
2. Leaseholding producers within a field may sometimes “unitize” their hold-ings by pooling them together, agreeing on ownership shares in the pooled unit,and naming one of the producers as the unit operator. See Wiggins and Libecap(1985) for a discussion of the economics of unitization.
at University of C
alifornia, Berkeley on D
ecember 7, 2011
http://qje.oxfordjournals.org/D
ownloaded from

LEARNING BY DRILLING 1965
A field’s reserves are typically buried under many layers ofrock that do not contain oil or gas. The objective of drilling a wellis topenetrate these overlying rock layers toreach the oil and gasin the field. Once a well is drilled to its target depth, the drillingrig is no longer needed and the well, if successful, will produce oiland/or gas for a period of several years.
There is significant variation in geology across fields, partic-ularly with regard to the depth at which they are buried. Somefields are as shallowas 3,000 feet deep and can be drilled in a fewdays, while others are more than 20,000 feet deepandcan requireseveral months of drilling. The types of rock that must be drilledthroughalsovaryconsiderably: thelayers ofsandstone, shale, andlimestone that may be encountered in one area will generally notbe the same as those found elsewhere.
Wells fall intotwobroad categories. “Wildcats” are those thatare drilled into a previously unexplored field, and their goal isto assess whether the field will be productive. “Development”wells, on the other hand, are drilled into fields in which previ-ously drilled wells already exist; their goal is to enhance fieldproduction. Most wells are vertical holes; however, horizontalanddirectional wells are sometimes drilledwhen surface featuresmake a vertical well impossible or when doing sowill improve thewell’s oil and gas production.
Even though producers do not physically drill their ownwells, they do design wells and write drilling procedures. Thisarrangement is a response to the fact that the optimal drillingprogram for any well is a function of the specific geologic featuresof the field in which it is drilled. Producers typically have moregeologicinformation than dodrillers, due totheir knowledge fromseismic imaging and previously drilled wells, and are thereforebetter placed to make these engineering decisions.3
II.B. Rigs and Contracting
The actual drilling of wells is conducted by drilling com-panies, which own drilling rigs and employ drilling crews. Theprimary features of a rig are a tall derrick, which allows pipe tobe drawn in and out of the well, and a motor that spins the drillpipe and drill bit during drilling. The size of this equipment
3. Very small producers, which drill infrequently and may not have engi-neering resources, sometimes outsource the planning and design function to thedriller.
at University of C
alifornia, Berkeley on D
ecember 7, 2011
http://qje.oxfordjournals.org/D
ownloaded from

1966 QUARTERLY JOURNAL OF ECONOMICS
determines a rig’s “depth rating,” the depth to which the rig isrecommendedtodrill. Apart fromthis rating, rigs generallydonothave field or producer-specific characteristics. The exceptions tothis rule are recently built or refurbishedrigs carrying equipmentthat eases the drilling of horizontal and directional wells.
Rigs aremobileandcaneasilychangelocations withina field;however, moves of more than 50 miles typically require severaldays and result in charging fees to the producer requesting themove. When under contract, rigs operate 24 hours a day and 7days a week, rotating crews in three 8-hour shifts. My interviewswith industry participants have indicated that while the averageemployment tenure of a rig crewman is approximately 1 year, therig foreman usually stays with a rig for much longer, and tenureslonger than 5 years are not uncommon.
It is natural to ask why this industry is vertically sepa-rated, particularly given the relationship-specific learning effectsidentified in this article. The answer lies in the spatial andtemporal variation with which producers drill wells. The drillingactivity of any producer fluctuates with oil production outcomesfrom recently drilled wells and the firm’s success in finding newfields. Successful wildcats and development wells often lead toadditional drilling, whereas “dry” unproductive holes do not.The mobility and nonspecificity of rigs allow them to smooththese fluctuations in drilling requirements across producers. Thissmoothingminimizes overall rigcapacityrequirements, as well asrig transportation and mobilization costs, without requiring theproducers to contract directly with each other.
Producers typically contract with rigs for the drilling of onewell at a time because they are generally reluctant tocommit toalong-term contract when the total number of wells they will drillis not known with certainty andcontingent on oil production fromthe first several wells drilled. For example, if a drilled well turnsout tobea dryhole, theproducerwill usuallynot want tofollowupwith additional drilling in the field. Long-term relationships arethereforegenerallymaintainedthroughrepeat contractingratherthan formal long-term contracts.4 Tothe extent that relationship-specific learning is important, this repeat contracting creates
4. Exceptions to single-well contracting tend to occur in large, well-established fields where geologic uncertainty is low. For example, trade publica-tions and interviews with industry participants have indicated that in the largeBarnett Shale gas field in east Texas, development wells are virtually guaranteedto find gas and producers there regularly sign long-term contracts with their rigs.
at University of C
alifornia, Berkeley on D
ecember 7, 2011
http://qje.oxfordjournals.org/D
ownloaded from

LEARNING BY DRILLING 1967
rents that can be bargained over at each renewal.5 However,unlike classic examples of relationship-specific investments fromthe transactions cost literature (Williamson 1975, 1985; Klein,Crawford, and Alchian 1978), relationship-specific learning doesnot generally require costly up-front investment, so the lack of along-term contract should not create an inefficiency.6
Producers initiate the contracting process by issuing arequest for quotation (RFQ) from drilling companies with rigsin the vicinity of the proposed well. The RFQ contains technicalspecifications regarding the well tobe drilled, including the well’stotal depth, the types of steel casing to be installed in the well,and properties of the “drilling mud” to be pumped through theborehole during drilling. The driller then includes in its bid, alongwith price, the identities of the rig and crew it proposes to drillthe well. In cases where a producer is following up an initial wellwith further drilling and wishes to retain its current rig, it willgenerally renew its current contract rather than hold anotherauction.
The RFQ will specify which of two standard contract typeswill be used: “dayrate” or “footage.” In a dayrate contract,the drilling company provides a rig and crew to drill the wellunder the producer’s direction, charging a daily payment for therig’s services. The producer is represented on the rig by one ofits personnel, known as the “company man,” who directs the rig’sdaily operations, typically in consultation with the rig’s foreman.The company man has final authority over decisions regarding,for example, which drill bit to use, the weight to place on the drillbit while drilling, and how to respond to problems such as stuckdrill pipe.
In a footage contract, the rig is compensated at a rate set indollars per foot drilled. This contract type is equivalent toa fixed-price contract because the well’s depth is specified in advance
5. I do not possess proprietary data on specific transactions with which theallocation of rents can be analyzed.
6. An inefficiency may arise if firms are capable of enhancing relationship-specific learning through costly investments such as job training. In the absenceof a long-term contract, firms may under-invest. In addition, bargaining over therents generated by relationship-specific learning should not lead to inefficienciesvia premature termination of relationships. In particular, neitherfirm shouldeverhave an incentive to terminate a relationship in order to prevent the other firmfrom obtaining too much bargaining power: both firms always hold an outsideoption to find another contracting partner and therefore cannot be made worseoff than they would be with a new partner.
at University of C
alifornia, Berkeley on D
ecember 7, 2011
http://qje.oxfordjournals.org/D
ownloaded from

1968 QUARTERLY JOURNAL OF ECONOMICS
in the RFQ. The producer may or may not place a companyman on the rig. If present, he may monitor the rig’s activitiesand consult with the foreman on drilling decisions but has nodirect contractual authority. The rig is free to make day-to-daydrilling decisions subject to the technical specifications of theRFQ.
Corts and Singh (2004) empirically examine the determi-nants of contract type in the offshore drilling industry and verifyseveral intuitive theoretical predictions. For example, dayratecontracts are used more frequently in situations in which there isa large amount of geologicuncertainty because producers are bet-ter equipped with the knowledge and technical staff to addressgeologic risk. The choice of contractual form also affects drillingperformance incentives. Under a footage contract, the rig willhave a direct monetary incentive to exert a high level of effortand drill quickly, but this incentive will not exist under a dayratecontract. However, indirect performance incentives are likely tobe important. Rig reputations are well known by producers, andrigs known to have effective, experienced crews can command adayrate premium over other rigs. Also, because the producer’scompany man is present on the rig on a dayrate contract, he canobservetheefforts of therigforemanandcrew. Inanenvironmentin which repeat contracting is common, this observability of effortcan generate implicit performance incentives for the contractor(Corts 2007).
III. FIRM-SPECIFIC AND RELATIONSHIP-SPECIFIC LEARNING
This paper considers learning that is both firm- andrelationship-specific. Firm-specific learning refers to improve-ments in a firm’s productivity that are associated with increasesin the firm’s experience. This “standard” learning-by-doing effecthas been widely documented in the literature, beginning withWright’s (1936) and Alchian’s (1963) studies of aircraft manufac-turing. Relationship-specific learning, on the other hand, refersto productivity increases that depend not only on a firm’s generalexperience but also on its joint experience with the particularfirms with which it works. These joint experience effects havereceived little attention, though McCabe (1996) finds evidencesuggestive of relationship-specific learning in the construction ofnuclear power plants: the productivity of primary constructioncontractors engaged in brief relationships with their utilities
at University of C
alifornia, Berkeley on D
ecember 7, 2011
http://qje.oxfordjournals.org/D
ownloaded from

LEARNING BY DRILLING 1969
was lower than that of contractors in long-term relationships.Huckman and Pisano (2006) similarly find evidence suggestingthat the performance of cardiacsurgeons, whooften work as free-lancecontractors across multiplehospitals, depends moreontheirhospital-specific experience than on their general experience.7
In the drilling industry, mechanisms exist for learning alongthree dimensions: (1) producer-level firm-specificlearning; (2) rig-level firm-specific learning; and (3) relationship-specific learningbetween producers and rigs working together. Producer-specificlearning occurs because producers accumulate and learn frominformation with every well they drill. For example, the optimalselection of drilling mud depends critically on the types of rockencountered throughout the well bore, and a producer may drillseveral wells before discovering the ideal mud composition via aneducated trial-and-error process. Producers’ learning is thereforetechnical in nature and tends to be field-specific. This learningis well recognized within the drilling industry, and several en-gineering case studies have documented how producers use pastexperience to reduce drilling times. See, for example, Brett andMillheim (1986) and Adeleye et al. (2004).
Because rigs are usually not involved in well design andplanning, rig-specific learning tends tobe less technical in naturethan producer-level learning. Instead, rigs’ learning comes fromimproved teamwork and developments in crew members’ skills.Forexample, crews becomemoreefficient at loweringdrillingpipeinto a hole, 90 feet at a time, after carrying out this same task onwells in the past.
Finally, several mechanisms of relationship-specific learningare possible. The rig’s crew may become familiar with the pro-ducer’s particular drilling procedures or the geology of its fields,or the producer’s company man may improve his knowledge of thecapabilities of therigandits crew. Industryparticipants havealsoindicated that repeated personal interactions between the firms’personnel are likely to be important. For instance, the ability torapidly solve drilling problems, such as the sticking of pipe inthe wellbore, is an important determinant of drilling efficiency.These problems may be more easily solved if the company manand rig foreman have, through repeated personal interactions,
7. Neither McCabe (1996) nor Huckman and Pisano (2006) addresses thepossibility that the estimated learning effects may be driven by match-specificheterogeneities.
at University of C
alifornia, Berkeley on D
ecember 7, 2011
http://qje.oxfordjournals.org/D
ownloaded from

1970 QUARTERLY JOURNAL OF ECONOMICS
developed a working relationship that allows them to collaborateeffectively.8
The intuition behind relationship-specificlearning has a par-allel inrecent theoretical work. EllisonandHolden (2009) developa model in which a principal hires an agent to repeatedly take anaction. The optimal action in each period is state-dependent, butthe principal cannot communicate a complete contingent plan tothe agent. Thus, in some states of the world, the agent may nottake the optimal action. However, once a state has been realizedand acted on, the principal gains the ability to communicate theoptimal action for that state, so the agent can take that actionwhen the state occurs again. In this way, the firms’ performanceimproves as they accumulate experience working together.
IV. DATA
The central empirical challenge of this article is to separatethe impact of relationship-specific learning from that of firm-specific learning. My approach uses two data sets of drillingactivity in Texas. I obtained the first of these from the Texas Rail-road Commission (TRRC), Texas’s oil and gas industry regulator.These data consist of well-level records of every well drilled inthe state from 1977 to 2005. Each observation identifies the fieldand county in which the well was drilled and the identity of theproducer that drilledit. I take the number of days requiredtodrilleach well as the difference between the well’s completion dateand the date drilling began. This latter date was not regularlyrecorded until 1991: only 67.7% of observations have a drillingtime prior to this date, compared with 89.8% afterward. I there-fore focus my analysis on 1991–2005, during which there exist106,946 TRRC observations with a recorded drilling time.9
8. This mechanism suggests that relationship-specific learning occurs be-tweentheproducer’s companymanandtherig’s crewratherthantheproducerandthephysical rig itself. Theideal empirical analysis wouldthereforeusedata ontheduration of relationships between producer and rig personnel (the rig foreman inparticular). However, I only possess data on relationships between producers andrigs, not personnel, soI am measuring the true relationship of interest with error.This error may not be too severe given that rig foremen typically have multiyearspells with a single rig but will nonetheless attenuate estimates of relationship-specific learning.
9. Although the TRRC asks producers toreport the date drilling began for alltheirwells, this reportingis not rigorouslyenforced. Beyondthemissingdata, 2.7%of the observations from 1991–2005 have drilling times that are clearly erroneousor technically infeasible. I drop wells with drilling times that are negative, wells
at University of C
alifornia, Berkeley on D
ecember 7, 2011
http://qje.oxfordjournals.org/D
ownloaded from

LEARNING BY DRILLING 1971
The TRRC data do not include the identity of the drillingrig that drilled each well. I therefore obtained information on rigactivity from Smith Bits (SB). Smith Bits is a manufacturer ofdrillingbits, andits fieldsalesforceissues weeklyreports onall on-shore rig activity in North America. These reports give each rig’slocation, by county, on every Friday from 1989 to 2005 and alsoprovide the identity of the production company towhich the rig iscontracted. Unlike the TRRC data, the unit of observation in theSB data is a rig-week, and I do not observe individual wells. Forexample, I might see in the SB data that a particular rig workedfor 25 consecutive weeks, but these data alone yield no informa-tion regarding how many wells it drilled during that time span.
I merge the SB rig location data into the TRRC’s drillingrecords to create a well-level data set in which each observationreports thewell’s drillingtime, location, producer, anddrillingrig.Unfortunately, a large fraction of wells in the TRRC data cannotbematchedtoriginformationintheSB data. Matchfailures occurfor four reasons: (1) wells drilled in less than one week will notappear in the SB data if there is nodrilling on a Friday; (2) namesof production companies are not harmonized across the two datasets; (3) the SB data have missing observations; and (4) when aproducer drills multiple wells simultaneously in the same county,it is not always possible to match a particular rig to a particularwell. OnlineAppendix1 discusses thedata mergeprocess indetailand notes that match failures are not systematic in a way thatcould bias the main empirical results.
The data merge yields a data set with 33,125 observations(wells) for which the producer and drilling rig are known. Ofthese wells, 7.7% are exploratory wildcats and are droppedbecause the field location is not recorded. In addition, be-cause horizontal and directional wells are typically best drilledwith specialized rigs, I omit these wells, comprising 20.2%of the data, from my analysis. I also drop dry holes, com-prising 14.3% of the remaining observations, because theirdrilling times can be artificially inflated if the producer keepsthe rig on-site while it attempts to coax the well to flow.10
with drilling times greater than 180 days, and wells that are more than 3,000 feetdeep and implausibly reported to have been drilled in a single day. The incidenceof these observations and those with missing drilling times is not correlated withthe experience variables that I ultimately use in my analysis.
10. Although horizontal, directional, and dry holes are not used in the finaldata set, I still “count” the fact that they were drilled when I calculate the
at University of C
alifornia, Berkeley on D
ecember 7, 2011
http://qje.oxfordjournals.org/D
ownloaded from

1972 QUARTERLY JOURNAL OF ECONOMICS
TABLE I
DISTRIBUTIONS OF WELLS, FIELDS, PRODUCERS, AND RIGS
25th 75thMin Percentile Median Percentile Mean Max
Number of wells 2 2 4 10 14.1 784per field
Number of wells 2 3 7 20.5 27.1 630per producer
Number of wells 2 4 8 19 14.1 157per rig
Number of 1 1 2 3 2.9 54producers perfield
Number of fields 1 1 3 6 5.5 124per producer
Number of rigs per 1 1 3 6 7.7 194driller
Notes. Data on wells, fields, and producers come from the Texas Railroad Commission (TRRC). Dataidentifying rigs and drilling companies come from Smith Bits (SB). Data shown include wells drilled from1991 to 2005 that successfully merged across the TRRC and SB data. This merge is summarized in SectionIV and described in more detail in the Online Appendix.
Finally, I drop all fields, producers, and rigs for which there isonly one observation because tracking learning for such entitiesis not possible. The final matched data set consists of 19,059wells, spread over 1,354 fields, 704 producers, and 1,339 rigs.Table I indicates that there is a large variance in drilling activityacross these entities. For example, in some fields I observe onlytwo wells, whereas in others I observe hundreds. Table I alsoindicates varianceinthenumberof producers workingwithinanyfield: some fields are drilled by only one producer and others aredrilled by more than 10. The summary statistics given at the topof Table II indicate that the sample average drilling time is 23.0days and the average well depth is 9,036 feet.
V. A MODEL OF LEARNING-BY-DOING IN THE DRILLING INDUSTRY
V.A. Production Function
This article models the objective of producers to be the mini-mizationofthetimeneededtodrill anygivenwell, as motivatedby
experience variables for the associated field, producer, and rig. Although the fieldlocations of wildcats are unknown, their drilling is included in the experience ofthe associated producer and rig.
at University of C
alifornia, Berkeley on D
ecember 7, 2011
http://qje.oxfordjournals.org/D
ownloaded from

LEARNING BY DRILLING 1973
TA
BL
EII
SA
MP
LE
SU
MM
AR
YS
TA
TIS
TIC
S
Nu
mbe
rof
Std
.ob
serv
atio
ns
Min
Med
ian
Mea
nD
ev.
Ma
x
Dri
llin
gti
me
(day
s)19
,059
218
23.0
19.2
179
Wel
ld
epth
(fee
t)19
,059
631
9,00
09,
036.
02,
817.
023
,000
Gas
wel
l(0
/1d
um
my)
19,0
590
10.
60.
51
Oil
and
gas
wel
l(0
/1d
um
my)
19,0
590
00.
00.
01
Nu
mbe
rof
wel
lsd
rill
edd
uri
ng
the
pas
t2
year
sin
:S
ame
fiel
d,s
ame
pro
du
cer
19,0
591
722
.151
.371
1S
ame
fiel
d19
,059
123
91.5
193.
31,
847
Sam
ep
rod
uce
r19
,059
166
148.
118
4.6
1,10
8N
um
ber
ofw
eek
sof
dri
llin
gw
ith
inp
ast
2ye
ars
by:
Sam
eri
g19
,059
165
60.8
30.5
105
Sam
eri
g,sa
me
pro
du
cer
19,0
591
1427
.731
.010
5
Not
es.
Dat
aon
wel
ls,
fiel
ds,
pro
du
cers
,d
rill
ing
tim
e,an
dw
ell
char
acte
rist
ics
com
efr
omth
eT
exas
Rai
lroa
dC
omm
issi
on(T
RR
C).
Dat
aid
enti
fyin
gri
gsan
dd
rill
ing
com
pan
ies
com
efr
omS
mit
hB
its
(SB
).D
ata
show
nin
clu
de
wel
lsd
rill
edfr
om19
91to
2005
that
succ
essf
ull
ym
erge
dac
ross
the
TR
RC
and
SB
dat
a.T
his
mer
geis
sum
mar
ized
inS
ecti
onIV
and
des
crib
edin
mor
ed
etai
lin
the
On
lin
eA
pp
end
ix.S
eeS
ecti
onV
.B.
for
det
ails
rega
rdin
gth
eco
nst
ruct
ion
ofth
eex
per
ien
ceva
riab
les.
at University of C
alifornia, Berkeley on D
ecember 7, 2011
http://qje.oxfordjournals.org/D
ownloaded from

1974 QUARTERLY JOURNAL OF ECONOMICS
their objective to minimize drilling costs. Although this approachis necessitated by the fact that I lack well-level cost data, it par-allels the way producers and engineers actually view drilling effi-ciency andis arguably superior tousing cost data were such infor-mation available. In practice, drilling engineers achieve cost sav-ings almost entirely by reducing the time necessary to drill wells.Given a particular well and rig, there is little scope for substitu-tion between drilling time and labor or capital. Rigs always work24 hours a day and 7 days a week, and adding crewmembers can-not increase the rate of penetration. Most capital drilling inputs,suchas thecasingandtubingthat areinstalledinthewell andtheequipment on the rig itself, are fixed functions of the well’s depthandtheparticularrig. Forthesereasons, learningcurvecasestud-ies in the petroleum engineering literature use drilling time astheir performance metric, even though the authors typically haveaccess todetailed cost data. Brett and Millheim (1986) argue thatthe drilling time metric is superior to a cost metric because costdata are polluted by inconsistent accounting methods and vari-ations in materials prices and rig rates. Moreover, rig rates arelikely to be endogenous in my empirical model because the ratescharged by rigs rise during periods of high drilling activity, creat-ing spurious correlation between drilling cost and experience.
My measure of drilling productivity is therefore the rate ofdrilling in feet per day, which firms try to maximize subjectto the constraints imposed by geology, safety, and the physicalcapabilities of the drilling rig used. Throughout this section, Iassume that the producer and rig are aligned in their objectiveto maximize the rate of drilling given the implicit performanceincentives discussed in Section II.B.11 For a given well—the unitof observation—let y denote the well’s inverse rate of drilling indays per foot. y is assumed to be determined by Equation (1):
(1) y = φ ∙ g(Ω) ∙ ν.
φ denotes the baseline drilling rate of the rig drilling the well,given its characteristics such as its horsepower. Ω denotes factorssuch as the efficiency of the rig crew and the decisions the firmsmake regarding how to drill the well—for example, the choiceof drilling mud, the weight to apply onto the drill bit, and theresponses to drilling problems such as stuck pipe. The function
11. The relationship between contractual form and drilling productivity isexplored in Section VIII.C.
at University of C
alifornia, Berkeley on D
ecember 7, 2011
http://qje.oxfordjournals.org/D
ownloaded from

LEARNING BY DRILLING 1975
g(Ω) translates these factors, which are unobservable, into theireffect on the rate of drilling. The firms’ objective to maximize therate of drilling therefore translates to an objective to minimizeg(Ω) by making optimal drilling decisions. That is, firms searchfor the optimal set of decisions Ω∗ that minimizes g(Ω). Finally,ν denotes field- and well-specific factors that impact the rate ofdrilling, such as the characteristics of the rock, the depth of thewell within the field (drilling times are superlinear in depth sothat drilling rates tend to be lower for deeper wells), and therealization of any drilling problems.12
Experience effects—learning-by-doing—do not enter directlyinto Equation (1) but instead affect drilling productivity by im-proving the quality of the factorsΩ, moving them closer toΩ∗ andleading to a decrease in g(Ω). Denote experience by E, and (post-poning the definition of E to the next subsection) let log(h(E)) de-note the learning process by which experience improves log(g(Ω))on average, so that Equation (2) denotes a projection of log(g(Ω))onto log(h(E)). In (2), log(η) denotes idiosyncratic deviations oflog(g(Ω)) from the expected learning curve given by log(h(E)),potentially reflecting a trial-and-error process of learning. Thedefinition of log(h(E)) as the average learning process implies thatlog(η) is orthogonal to log(h(E)).
(2) log (g(Ω)) = log (h(E)) + log (η).
Let p and r denote the producer and rig that drill the well, f thefield in which the well is drilled, and t the date at which drillingis complete. Allowing for producer-specific “baseline” drilling effi-ciencies that are independent of experience and for field-specificfactors within ν, Equations (1) and (2) can be combined to yieldthefixedeffect specification(3), inwhichγf , δp, andφr denotefield,producer, and rig fixed effects, respectively:
(3) log (yfprt) = log (h(E)) + γf + δp + φr + θXfprt + εfprt.
The disturbance εfprt is a composite error term: the sum of log(η)andlog(ν). Xfprt denotes a vectorof observablevariables that plau-sibly impact drilling productivity: (1) a cubic polynomial in thewell’s depth; (2) dummy variables for whether the well is drilledfor oil, gas, or both; (3) dummy variables for month-of-year that
12. Geologic heterogeneity is predominantly cross-field rather than withinfield. For example, regressing well depth on a set of field fixed effects yields anR2 of .88.
at University of C
alifornia, Berkeley on D
ecember 7, 2011
http://qje.oxfordjournals.org/D
ownloaded from

1976 QUARTERLY JOURNAL OF ECONOMICS
capture seasonal weather patterns; and (4) yearly dummy vari-ables that capture any industry-wide technological progress.13
V.B. Specification and Calculation of Experience
In the reference case model I let log(h(E)) take the form givenby Equation (5) below, yielding a log-log specification for learning-by-doing, as is common in the literature:
log (h(E)) = β1 log (Eft) + β2 log (Ept) + β3 log (Efpt)(4)
+ β4 log (Ert)+ β5 log (Eprt).
Eft denotes the industry’s overall experience in field f on datet, regardless of which firms have been drilling in the field. Ept
denotes the overall experience of producer p, and Efpt denotesthe experience of producer p in field f . These three variables areanalogous to the experience variables used in previous learning-by-doing studies, such as Thornton and Thompson (2001). Efpt
measures the experience of the leadfirm (p) at a particular type ofproject (f ), while Eft and Ept measure cross-firm and within-firmspillovers, respectively. The primary contribution of this articleis the addition of the Ert and Eprt terms. The former denotesthe overall experience of rig r, and the latter denotes the jointexperience that rig r and producer p have working together.
The coefficient β5 measures the strength of relationship-specific learning. For now, the specification is agnostic as towhether relationship-specific learning is driven by personal in-teractions between the producer and rig or by the rig’s increasingfamiliarity with the technical procedures specific to its producerand/or its producer’s fields (task-specificlearning, in the languageof Gibbons andWaldman[2004, 2006]). This distinctionwill beex-plored in Section VIII.B by breaking Eprt into field–rig, producer–rig, and field–producer–rig-specific components.
I measure Eft, Ept, and Efpt as the number of wells recentlydrilled, while Ert and Eprt are measuredas the number of weeks ofrecent drilling experience (I discuss why I use recent rather thantotal experience below). The Ert and Eprt variables are measuredin units of time rather than wells (Ert and Eprt) because rig-level learning occurs through the repetition of tasks and the
13. In alternative specifications, I use a polynomial function of time tocapturetechnological change. Doing sodoes not substantially affect the estimated results.
at University of C
alifornia, Berkeley on D
ecember 7, 2011
http://qje.oxfordjournals.org/D
ownloaded from
LEARNING BY DRILLING 1977
accumulation of interactions with the producer, both of whichshould be functions of time. Moreover, this calculation is neces-sitated by the data, because Smith Bits tracks drilling activityin rig-weeks rather than well by well. For the field and producerexperiencevariables, themeasures Eft, Ept, and Efpt that calculateexperienceas thenumberof days of recent drillingactivityexist inthe TRRC data and are potential alternatives to the Eft, Ept, andEfpt measures that count thenumberof wells drilled. I use Eft, Ept,and Efpt in the reference case empirical specification rather thanEft, Ept, and Efpt for several reasons. First, the field- andproducer-specific dimensions of learning tend to be technical and drivenby the geologic information gained with each penetration ratherthan the accumulation of days of experience (a counter-argumentwould be that if firms tend to learn more from mistakes thanfrom successes, measuring experience using time spent drillingmay be more appropriate). Second, the Efpt measure is used inthe petroleum engineering literature, not Efpt. Third, and finally,the use of Eft, Ept, and Efpt ultimately yields estimates of field-producer learning that are larger in magnitude than when Eft,Ept, and Efpt areused, consistent witha storyinwhich Eft, Ept, andEfpt are the true measures of experience, which Eft, Ept, and Efpt
measure with error (see columns (1) and (4) of Online AppendixTable A3).
Eft, Ept, and Efpt for a given well are defined as the numberof wells for which drilling was completed during the 2 years priorto date t—the completion date of the well in question.14 This wellitself is also included in Eft, Ept, and Efpt, implying that all wellsin the data set have at least one unit of experience and avoidinga logarithm of 0 in a log-log learning specification.15 I measure
14. Defining t as the completion date—the date drilling ended—rather thanthe date drilling began ensures that when the drilling of two wells partiallyoverlaps in time (because multiple rigs are being used simultaneously within afield or by a producer), the well that is completed first counts as experience for thesecondwell. I choosethis approachbecauseit allows thesecondwell tobenefit fromexperience gained through drilling the first well, which would have penetratedthrough any given depth a fewdays in advance of the second well. If twowells arecompleted on the same date, neither well counts as experience toward the other.
15. The “hat” versions of these variables, which are ultimately used as instru-ments and measure experience as the recently accumulated number of days ofdrilling, donot includethedrillingtimeof thewell completedat t in theexperiencecalculation. Instead, I treat the well completed at t as counting for only 1 day ofexperienceinall cases, therebyensuringthat theseexperiencemeasures arenever0 and enabling the log-log learning specification.
at University of C
alifornia, Berkeley on D
ecember 7, 2011
http://qje.oxfordjournals.org/D
ownloaded from

1978 QUARTERLY JOURNAL OF ECONOMICS
experience using drilling within the past 2 years rather than thetotal cumulative number of wells drilled because the majority ofthe fields and firms in the data set existed prior to the start ofthe sample.16 I therefore have nomeans tocalculate a cumulativeexperiencemeasure. Evenso, it is not clearthat experiencegainedmany years before time t is relevant to a producer’s expertiseat t. Studies by Argote, Beckman, and Epple (1990), Benkard(2000), and Thompson (2007) have demonstrated that experienceeffects decay with time as learning is “forgotten,” supportingthe importance of recent experience in determining productivity.Section VI.B discusses evidence of forgetting effects in the drillingindustry.
I measure a drilling rig’s stand-alone experience Ert as thenumber of weeks the rig was actively drilling within the 2 yearsprior to t. Producer–rig joint experience Eprt is defined similarly(both of these variables also always include a 1 for the currentweek). Finally, I calculate all five experience variables using theoriginal TRRC and SB data sets rather than the smaller dataset generated by the match of the TRRC data to the SB data.Were I insteadtouse this smaller data set, I wouldsystematicallyunderstateeachmeasureof experience. Summarystatistics forallfive experience measures are presented in Table II.
V.C. Estimation and Identification; Producer–Rig Matching
Giventhefixedeffects andcontrol variables Xfprt inEquations(3) and (5), the effects of producer and field-level learning (β1,β2, and β3) are identified through variations in each producer’sdrilling activity within and across each field. There exist numer-ous sources of such variation, including changes in oil and gasprices (whichwill haveheterogeneous effects across fields), discov-ery of new fields, and the identification of unexploited reserves inexisting fields (through seismicimaging technology, for example).The coefficients on Ert and Eprt are separately identified throughtwo sources of variation: (1) changes in the producer to which agiven rig is contracted; and (2) the employment of multiple rigs(either simultaneously or in series) by a producer. Such variationarises because once a producer and rig begin working together,they do not work with each other indefinitely. Eventually, the
16. The choice of 2 years is a compromise between capturing the tenures ofrig crews and rig foremen. I discuss the results’ robustness to measurements ofexperience using periods other than 2 years in Online Appendix 2.
at University of C
alifornia, Berkeley on D
ecember 7, 2011
http://qje.oxfordjournals.org/D
ownloaded from

LEARNING BY DRILLING 1979
producer will run out of wells that it wishes to drill, at leasttemporarily, and release the rig. For instance, the producer maycease drilling to evaluate the oil production from its new wellsbefore continuing with additional drilling. When the producerwishes to recommence drilling, it may not be able to work withits previous rig if that rig has contracted with another producer,and it will therefore start a relationship with a new rig.
Identification of relationship-specific learning in Equations(3) and (5) will fail if rigs have producer-specific characteristics(independently of human capital acquired through learning) andare likely to have longer relationships with producers with whichtheyarewell matchedintheirabilitytoefficientlydrill wells. Suchmatching would generate a negative correlation between Eprt andthe disturbance εfprt, leading to a downward-biased estimate ofβ5. As noted in Section II.B, however, a rig’s equipment is gen-erally not field- or producer-specific, apart from its depth rating,suggesting that match specificities are unlikely to be a seriousconcern. Nonetheless, I address the potential bias in Equation(3) arising from producer–rig specificities by adding fixed effectsηpr for producer–rig pairs to the specification, yielding Equation(5). Equation (5) is the reference case model on which I focus inestimation.
(5) log (yfprt) = log (h(E)) + γf + ηpr + θXfprt + εfprt.
With the inclusion of the ηpr, identification of relationship-specificlearning (β5) comes only from variation in joint experience withineach rig–producer pair.17 It is important to note that even withthe producer–rig fixed effects included in Equation (5), the spec-ification is, strictly speaking, only estimating a learning rate forthose producer–rig pairs that are actually observed in the data.If producers are more likely to work with rigs with which theyanticipatehavingsteeprelationship-specificlearningcurves, thenthe hypothetical learning rate for unobserved producer–rig pairscould be lower than the learning rate estimated from Equation(5). Short of being able to run a randomized experiment, it is notpossible to estimate an “average” learning rate over all possiblerig–producer pairs. However, it is not clear that such a learningrate is actually a parameter of greater economicinterest than the
17. β4 is still identified in the presence of producer–rig fixed effects becauserigs sometimes have multiple employment “spells” with a single producer, and Ert
will be different in each spell. β1, β2, andβ3 are identifiedwhen multiple rigs drillsimultaneously within a field, producer, and field–producer, respectively.
at University of C
alifornia, Berkeley on D
ecember 7, 2011
http://qje.oxfordjournals.org/D
ownloaded from

1980 QUARTERLY JOURNAL OF ECONOMICS
learning rate for relationships that actually occur in the industry,which is the learning rate estimated here.
A second potential impediment to the identification of learn-ing effects is serial correlation in the disturbance term εfprt, whichmay present a problem via an argument similar to that madein Benkard’s (2000) study of learning in aircraft manufacturing.For the experience variables that are measured in accumulateddrilling time—Ert and Eprt—positive shocks to εfprt in the recentpast increase the amount of experience. If the disturbances areserially correlated, then Ert and Eprt will be positively correlatedwith εfprt, leading to upward bias (toward 0) in the estimatedlearning rates. That is, serial correlation biases the estimatesaway from finding evidence of learning. This bias may be partic-ularly important for relationship-specific learning, because it islikelythat serial correlationis greaterforwells drilledinsequenceby the same producer and rig than for wells drilled by differentfirms. Conversely, for the variables Eft, Ept, andEfpt that calculateexperience as the number of wells drilled within the 2 years priorto date t, the bias from serial correlation works in the oppositedirection, exaggerating the estimated learning effect. This biasarises becauseproducers oftendrill wells oneright aftertheother.In such cases, the number of wells drilled within any fixed timeperiod (such as 2 years) will be inversely related to the numberof days required to drill each well. With serial correlation in thedisturbance, positiveshocks tothecurrent well’s drillingtimewillbe positively correlated with past shocks and therefore negativelycorrelated with experience, yielding a mechanical downward bias(away from 0) in the estimated learning rates.
Benkard (2000) addressed serial correlation by instrument-ing for experience using macroeconomicdemand and cost shifterssuch as the price of oil. This approach is not viable here becausealthough such shifters can explain changes in aggregate industryexperience, they cannot explain firm-, relationship-, or field-specificexperience. Fortunately, it appears that serial correlationinεfprt is not a substantial issueinthis setting: theestimatedfirst-order autocorrelation parameter of the residuals from Equation(5), withineachproducer–rigpair, is only0.081.18 This parameteris much smaller than the values near 0.5 found in Benkard’s
18. The autocorrelation parameter was estimated following Anderson andHsiao (1981) to address the small number of observations for some producer-rig pairs. That is, the first-differenced residuals were regressed on lagged first-differenced residuals, using the second lag of the residuals as an instrument.
at University of C
alifornia, Berkeley on D
ecember 7, 2011
http://qje.oxfordjournals.org/D
ownloaded from

LEARNING BY DRILLING 1981
(2000) study. Moreover, Benkard found that the interpretationof the results from the instrumental variables estimate was “es-sentially the same” as that from the noninstrumented estimate,despite the high autocorrelation parameter.19
Thus, the impact of serial correlation on the estimated pa-rameters of Equation (5) is likely to be minor: the coefficients onErt and Eprt will be biased slightly upward (toward 0), and thecoefficients on Eft, Ept, and Efpt will be biased slightly downward.Giventhat themainparameterof interest is thecoefficient on Eprt,the results will therefore be biased against finding evidence ofrelationship-specificlearning. Tobe conservative in the estimatedrates of learning associated with the Eft, Ept, and Efpt terms aswell, the reference case estimate of Equation (5) instruments forEft, Ept, and Efpt with measures of experience based on accumu-lated drilling time: Eft, Ept, and Efpt.20 Because serial correlationwill cause these instruments to be positively correlated withthe disturbance, this approach reverses the direction of bias. Asexpected, the difference between the reference case and nonin-strumented estimates of the coefficients on Eft, Ept, and Efpt isnot substantial. In particular, the estimated coefficient on Efpt is−0.023 in the reference case and−0.028 in the noninstrumentedestimate (see column (5) of Online Appendix Table A3 for the fullset of estimates from the noninstrumented model). The unbiasedestimate of this coefficient lies between these two bounds.
VI. PRIMARY ESTIMATION RESULTS FOR RELATIONSHIP-SPECIFIC
LEARNING
VI.A. Primary Specifications
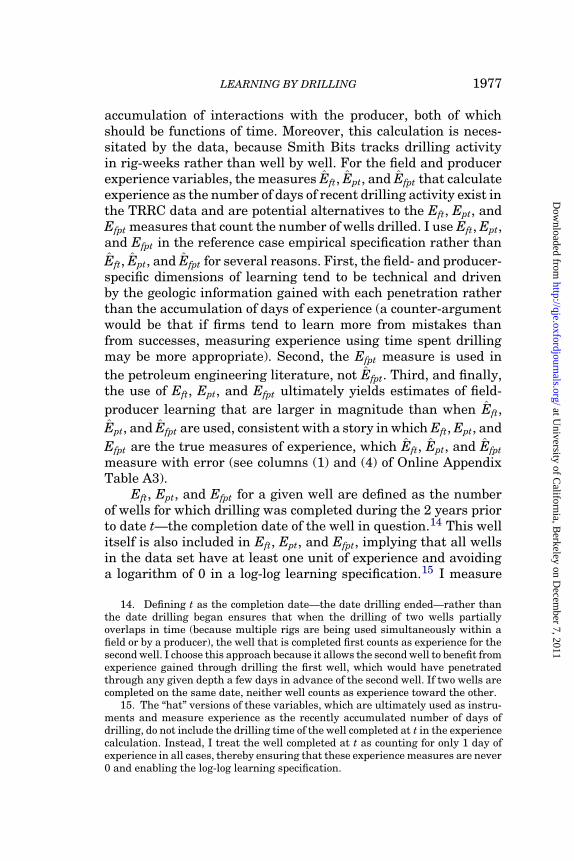
Table III, column (1), presents the estimated learning ratesfor the reference case model given by Equations (5) and (5). Theestimated coefficient on log (Ert)—the stand-alone experience ofthe drilling rig—is−0.014 andmarginally statistically significant(the p-value is .135). This point estimate implies that a rig with
19. Serial correlation is relevant only for the most recently produced units(wells, in my case), but the experience variables track production over a longperiodof time. Thus, serial correlationshouldcauseonlya small part of experienceto be correlated with the disturbance term, and least-squares estimates shouldtherefore not be substantially biased, consistent with the results from Benkard(2000).
20. The first stage estimates are strongly statistically significant, as shown inOnline Appendix Table A1.
at University of C
alifornia, Berkeley on D
ecember 7, 2011
http://qje.oxfordjournals.org/D
ownloaded from
1982 QUARTERLY JOURNAL OF ECONOMICST
AB
LE
III
LE
AR
NIN
G- B
Y-D
OIN
GE
ST
IMA
TE
S.D
EP
EN
DE
NT
VA
RIA
BL
EI Slog
Dri
llin
gT
ime
Wel
lD
ept h
(1)
(2)
(3)
(4)
(5)
(6)
(7)
No
pro
du
cer−
Fie
ldva
riab
les
All
vari
able
s,R
efer
ence
rig
fixe
dF
ield
vari
able
sF
ield
vari
able
sw
ith
wit
hL
ogof
exp
erie
nce
wit
h:
case
mod
elef
fect
sS
pli
nes
only
wit
hri
gF
Efo
rget
tin
gfo
rget
tin
g
Sam
efi
eld
−0.
009
−0.
010
spli
ne
−0.
001
−0.
010
−0.
002
−0.
011
(Eft
)(0
.012
)(0
.007
)(0
.008
)(0
.007
)(0
.008
)(0
.007
)S
ame
pro
du
cer
0.00
3−
0.01
5sp
lin
e−
0.01
5−
0.02
4∗∗
−0 .
016
−0.
016
(Ep
t)(0
.020
)(0
.011
)(0
.011
)(0
.011
)(0
.011
)(0
.011
)S
ame
fiel
d,s
ame
pro
du
cer−
0.02
3∗∗∗
−0 .
022∗∗∗
s pli
ne
−0.
038∗∗∗
−0 .
032∗∗∗
−0 .
048∗∗∗
−0 .
040∗∗∗
(Efp
t)(0
.007
)(0
.006
)(0
.006
)(0
.005
)(0
.007
)(0
.011
)S
ame
rig
−0.
014
−0.
019∗∗∗
s pli
ne
−−
−−
0.02
0∗∗∗
(Ert
)(0
.009
)(0
.006
)−
−−
(0.0
06)
Sam
ep
rod
uce
r,sa
me
rig
−0.
019∗∗∗
−0.
019∗∗∗
−0.
018∗∗∗
−−
−−
0.01
6∗∗∗
(Ep
rt)
(0.0
07)
(0.0
04)
(0.0
06)
−−
−(0
.004
)F
orge
ttin
gp
aram
eterδ
on−
−−
−−
−0.
928∗∗
−2.
495
Efp
t−
−−
−−
(0.4
43)
(1.7
18)
Pro
du
cer
fixe
def
fect
sY
YY
YY
YY
Rig
fixe
def
fect
sY
YY
NY
NY
Pro
du
cer
Xri
gfi
xed
effe
cts
YN
YN
NN
N
Not
es.V
alu
esin
par
enth
eses
ind
icat
est
and
ard
erro
rscl
ust
ered
onp
rod
uce
r.*,
**,*
**in
dic
ate
sign
ifica
nce
atth
e10
%,5
%,a
nd
1%le
vel.
All
spec
ifica
tion
su
se19
,059
obse
rvat
ion
s(w
ells
)co
veri
ng
1991
–200
5.A
llre
gres
sion
sin
clu
de
con
trol
sfo
rd
epth
and
wel
lty
pe,
mon
than
dye
arfi
xed
effe
cts,
and
fiel
dfi
xed
effe
cts.
Mea
sure
sof
fiel
dan
dp
rod
uce
r-sp
ecifi
cex
per
ien
ceE
ft,
Ep
t,an
dE
fpt
a re
base
don
the
nu
mbe
rof
rece
ntl
yd
rill
edw
ells
and
are
inst
rum
ente
du
sin
gth
ere
cen
tn
um
ber
ofd
ays
spen
td
rill
ing
(Eft
,E
pt,
and
Efp
t)as
dis
cuss
ed
inS
ecti
onV
.C.R
igan
dre
lati
onsh
ip-s
pec
ific
exp
erie
nce
Ert
and
Ep
rtar
em
easu
red
asth
ere
cen
tn
um
ber
ofw
eek
ssp
ent
dri
llin
g.
at University of C
alifornia, Berkeley on D
ecember 7, 2011
http://qje.oxfordjournals.org/D
ownloaded from

LEARNING BY DRILLING 1983
1 year’s experience will improve its drilling performance, inde-pendently of the producer with which it contracts, by 5.4%. Theestimated coefficient on log (Eprt)—the joint experience betweenthe rig and the producer to which it is currently contracted—is−0.019 and statistically significant at the 1% level. This estimateimplies that maintaining a stable relationship for a full yearwill yieldarelationship-specificproductivityimprovement of7.3%that is additional to the 5.4% stand-alone improvement. Thus, onaverage, rigs with stable contracting relationships are estimatedto improve their productivity more than twice as quickly as rigsthat frequently change contracting partners.
I use these estimated coefficients to obtain an estimate ofthe average cost savings obtained through relationship-specificlearning. In a counterfactual in which joint experience yieldsthe same productivity benefit as stand-alone experience (thatis, β5 equals 0 in (4)), the average drilling time in my samplewould be increased by 4.9%, equal to 1.13 days at the sampleaverage drilling time of 23.0 days.21 At the 2005 rig dayrate ofapproximately $11,000 per day for a well of average depth, thisefficiency gain translates to an average reduction in rig rentalcost of approximately $12,400 per well. Section VII examines theextent towhich this cost saving leads firms tomaintain long-termrelationships.
Otherestimatedcoefficients arealsoofeconomicinterest. Theestimated coefficient on field–producer-specific experience (Efpt)is −0.023 and statistically significant at the 1% level, indicat-ing that producers accumulate field-specific technical expertiseas they drill more wells, independently of the rigs they hire.There is little evidence of experience spillovers across producersworking in the same field or across fields drilled by the sameproducer: the estimated coefficients on Eft and Ept are negativebut small in magnitude and statistically insignificant. This resultcontrasts withthoseofIrwinandKlenow(1994)andThorntonandThompson (2001), whoidentify modest cross-firm spillovers in thesemiconductor and shipbuilding industries, respectively. Drillingindustry participants have indicated that the lack of spilloversmay be due to common pool extraction problems: when multipleproducers operate in the same field, an increase in productionby one firm may deplete the resource in a way that adverselyaffects the production of the other firms. Thus, producers may be
21. The 4.9% figure is equal tothe sample average of 100( exp (− β5Eprt)− 1).
at University of C
alifornia, Berkeley on D
ecember 7, 2011
http://qje.oxfordjournals.org/D
ownloaded from

1984 QUARTERLY JOURNAL OF ECONOMICS
unwilling toaideach other by sharing their drilling procedures.22
Still, manufacturers of semiconductors shouldalsobeunwillingtoshare knowledge, suggesting that motives for secrecy are unlikelyto be the sole driver of the difference in these results. Futureresearch is needed to understand the factors, such as rates ofemployee turnover, for example, that influence learning spilloverrates in different industries.
The estimated coefficients on the control variables Xfprt aregiven in Online Appendix Table A2 andgenerally agree with intu-ition. Thecombinationof coefficients onthewell depthpolynomialindicates that deeperwells haveslowerdrillingrates thanshallowwells. The impact of the presence of natural gas is impreciselyestimated. The pattern of month dummies suggests that drillingtimes tend to be lower in the spring and fall, when temperaturesare neither extremely hot nor cold, though the effects are not sta-tistically significant. The yearfixedeffects suggest the presence ofsome industry-wide technological improvement in the latter halfof the sample, though these coefficients are also not statisticallysignificant.
Column (2) of Table III examines the extent to which matchspecificities between producers and rigs bias the estimate ofrelationship-specific learning in the absence of producer–rig fixedeffects. This specification estimates the model given by Equations(3) and (5), in which there are separate fixed effects for producersandrigs but not fixedeffects forproducer–rigpairs. Theestimatedrate of relationship-specific learning is virtually unchanged: thenew point estimate on log (Eprt) is −0.0190 rather than −0.0193.This result is consistent with a limited effect of producer–rigmatch specificities on relationship durations, consistent with theindustry characteristics discussed in Section II.B.23
Column (3) of Table III verifies that the finding of substan-tial relationship-specific learning is not driven by the assumed
22. Conversations with industry participants have indicated that producerswill sometimes include confidentiality clauses in theirdrilling contracts topreventrig crews from sharing field-specific knowledge across producers.
23. As a robustness check, I estimated the reference case specification whileincluding field–producer and field–rig fixed effects in addition to the producer–rig fixed effects. Doing so does not substantially affect the estimated rate ofrelationship–specific learning: the estimated coefficient on producer–rig experi-ence is −0.017 with a standard error of 0.008. Including field–producer–rig fixedeffects yields nearly identical results.
at University of C
alifornia, Berkeley on D
ecember 7, 2011
http://qje.oxfordjournals.org/D
ownloaded from

LEARNING BY DRILLING 1985
log-log functional form of Equation (5). This specificationestimates a flexible functional form in which Eft, Ept, Efpt, and Ert
enter the specification as flexible splines, while Eprt continues toenter as a log-log function. That is, I model:
(6) log (h(E)) = s1(Eft) + s2(Ept) + s3(Efpt) + s4(Ert) + β5 log (Eprt).
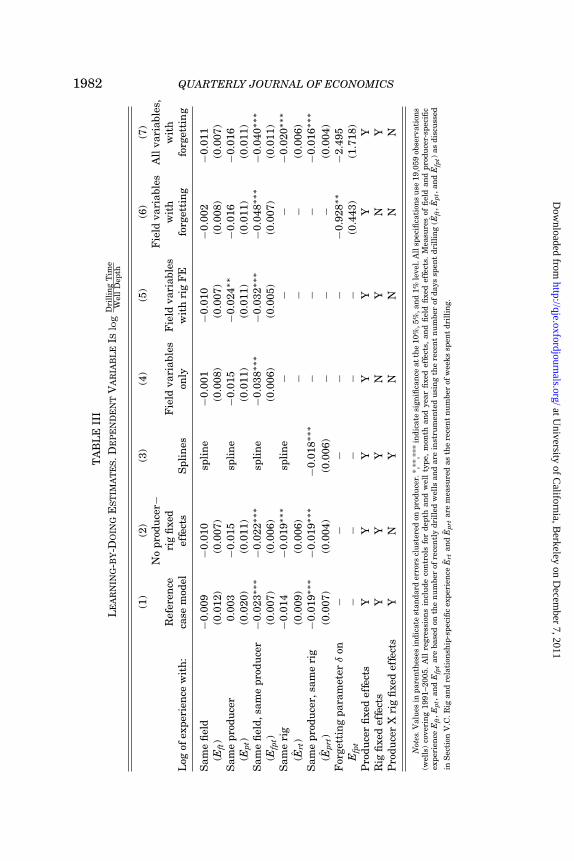
where s1through s4 each denotes a fourth-degree cubicspline. Theestimate of β5 from Equations (5) and (6) is−0.018, nearly identi-cal to that of the reference case, confirming that the relationship-specific learning result is not driven by the parameterizationin Equation (5). I also estimate a version of Equation (6) inwhich all five forms of experience enter through splines. Theestimatedfunction s5(Eprt) is plottedin Figure I alongside the log-log learningcurvefromestimatingEquation(6). Thesetwocurvesclosely overlie each other, indicating that the log-log relationshipis an appropriate choice of functional form.
Online Appendix 2 and Table A3 present additional tests ofthe robustness of the reference case results, focusing on alterna-tive measures of experience.
FIGURE I
Estimated Spline for Relationship-Specific Learning
Both the spline and log-log estimates of the impact of joint producer–rigexperience (Eprt) are from a model in which all other forms of experience aremodeled as splines.
at University of C
alifornia, Berkeley on D
ecember 7, 2011
http://qje.oxfordjournals.org/D
ownloaded from

1986 QUARTERLY JOURNAL OF ECONOMICS
VI.B. Relationship to Previous Learning Studies
To compare the foregoing results with previous work, I esti-mate the effect of producers’ experience on drilling productivitywhile omitting the influence of their relationships with rigs. Thisanalysis follows previous learning-by-doing studies that inves-tigate lead firm productivity but do not incorporate contractorrelationships into the analysis.
The specification given in Table III, column (4) uses only thefirst three measures of experience from Equation (5): Eft, Ept, andEfpt, omitting rig-based experience measures as well as rig andproducer–rig fixed effects. In this specification, the estimate ofthe coefficient on Efpt is−0.038, substantially larger in magnitudethat the −0.023 estimated in the reference case, in which rigswere taken into account. Column (5) includes rig fixed effects butcontinues to omit rig-based experience measures: the estimateof β3 in this case is −0.032, still greater than the referencecase estimate. These results demonstrate that investigations oflearning-by-doing that donot consider both the identities of firms’contracting partners and relationship-specific experience mayoverstate the contribution of lead firms’ experience to observedproductivity improvements.
Previous work (Argote, Beckman, and Epple 1990; Benkard2000; Thompson 2007) has also studied institutional forgetting:the decay of experience effects over time. Paralleling these stud-ies, I ask whether drilling experience from the distant past hasa smaller effect on current drilling rates than does recent ex-perience. I first examine forgetting effects in a setting in whichcontracting relationships are not accounted for, following theliterature. I focus ontheforgettingof field–producer-specificexpe-rienceEfpt giventhelackofevidenceof learningspillovers throughEft and Ept. I then examine the forgetting of this experiencewhile taking producers’ relationships with rigs’ into account toinvestigate the extent towhich forgetting effects can be explainedby relationship-specific learning.
Thus far, I have defined Efpt as the number of wells drilled byproducerp infield f duringthe2 years priorto t. Here, I defineEfpt
as a function of a decay parameter δ per expression (7), in whichNfpτ denotes the number of wells drilled by producer p in field fon date τ .
(7) Efpt(δ) =t∑
τ=t−730
(eδ(t−τ)/365 ∙Nfpτ ).
at University of C
alifornia, Berkeley on D
ecember 7, 2011
http://qje.oxfordjournals.org/D
ownloaded from

LEARNING BY DRILLING 1987
For negative values of δ, wells drilled on dates long beforet carry less weight in Efpt(δ) than do wells drilled near date t. Iestimate δ by inserting Equation (7) intoEquation (9), which doesnot include measures of experience that involve rigs:
log(yfpt) = β1 ∙ log(Efpt(δ)) + β2 ∙ log(Eft) + β3 ∙ log(Ept)(8)
+ γf + δp + θXfprt + εfpt.
I estimate Equation (9) using nonlinearmethodof moments. As inthenonforgettingestimates, I instrument forthethreeexperiencemeasures usingthemeasures of experiencebasedonaccumulateddrilling time.24 Estimation results are shown in column (6) ofTable III. I obtain a point estimate of δ equal to −0.928 with aclustered standard error of 0.443, consistent with the presence offorgetting.
The estimated rate of experience depreciation is somewhatlarge: the point estimate of δ implies that a well drilled 1 yearago makes a contribution to experience that is only 40% of thatmade by a well drilled 1 day ago. This depreciation rate is not asgreat as that estimated by Argote, Beckman, and Epple (1990) inshipbuilding (for which the corresponding figure is 3.2%), thoughgreater than that estimated by Benkard (2000) in aircraft manu-facturing (61%). Although this result could reflect literal humanforgetting of knowledge or turnover among producers’ personnel,it may also reflect losses of intellectual capital associated withchanges in producers’ drilling rigs. I investigate this possibilityby augmenting Equation (9) with rig fixed effects and variablesmeasuring rig andrelationship-specificexperience, per Equations(3) and (5).25 Although the new point estimate of δ from thisspecification, given in Table III, column (7), is still negative andquite large in magnitude at −2.49, it is estimated impreciselywith a standard error of 1.72. This imprecise estimate suggeststhat losses of relationship-specific capital between lead firms andcontractors may be one of the mechanisms behind the significantestimates of forgetting effects found in other studies. This resultalsorelates tothat ofThompson(2007), whofoundthat controlling
24. The estimation also instruments for the derivative of experience withrespect to δ using the derivative of drilling time-based experience with respectto δ.
25. I do not use producer–rig fixed effects in this specification because field-producer forgetting is not identified in their presence. Field–producer learningitself is only identified when a producer drills multiple wells simultaneously ina field; forgetting effects cannot be identified off of simultaneous drilling activity.
at University of C
alifornia, Berkeley on D
ecember 7, 2011
http://qje.oxfordjournals.org/D
ownloaded from

1988 QUARTERLY JOURNAL OF ECONOMICS
for labor turnover reduced the estimated rate of forgetting in theshipbuilding industry.
VII. EMPIRICAL ANALYSIS OF RELATIONSHIP PERSISTENCE
This section empirically examines whether the pattern bywhich producer–rig relationships are formed and broken is con-sistent with firms’ recognition of relationship-specific learning.Specifically, do producers prefer to use rigs with which they havesubstantial prior experience? If so, is this preference driven bylearning or by other factors?
It is clear from the data that firms do generally maintaintheir relationships. When a producer releases a rig, it is rare thatthe rig is replaced with a new one, instead, the producer simplyceases drilling, indicating that the relationshipendedbecause theproducer had noadditional work tooffer the rig. Specifically, only12.8% of terminations are followed by the hiring of another rigwithin 4 weeks. This fact alone, however, can be supported byexplanations other than learning, in particular by the presenceof switching costs. I therefore test for relationship persistence byfocusing on instances in which a producer has two rigs drillingin the same county. When the producer releases one of these tworigs, I ask whether the released rig is that having less producer-specificexperience. This last in–first out (LIFO) pattern would beconsistent withfirms’ maximizationofthebenefits ofrelationship-specific learning and would also be difficult to explain usingswitching costs alone because the test is conditioned on thesecosts being sunk. This pattern may, however, be consistent withthe presence of other ex ante match specificities as discussedshortly.26
26. Another alternative explanation is that the pattern reflects matching onthe speed of firm-specific (not relationship-specific) learning. That is, a givenproducer and rig may match because they anticipate fast rates of firm-specificlearning with that combination. However, it seems unlikely that such a story isthe primary driver of relationship persistence, since relationship-specific learningprovides a stronger incentive to maintain a relationship because its benefits arenot appropriable across firm pairs. The only incentive to maintain a relationshipthat is provided by accelerated firm-specific learning comes from the desire tocontinue learning at a high rate so that future rents will be larger. This incentivewill becomeweakovertimeas thefirm-specificlearningcurveflattens. Inaddition,a hazard analysis finds that the hazard rate for relationship termination declineswith relationship duration, more in line with the relationship-specific learninginterpretation than with the accelerated firm-specific learning interpretation.
at University of C
alifornia, Berkeley on D
ecember 7, 2011
http://qje.oxfordjournals.org/D
ownloaded from

LEARNING BY DRILLING 1989
I execute this analysis using the original SB data set, priorto its match with the TRRC data. There are 323,730 rig-weekobservations in this data set, and for each I observe the countyin which the rig is located and the producer for which the rigis drilling. Week-to-week, rigs maintain their relationship withtheirproducer89.5% of thetime. Rigs changeproducers in7.4% ofthe observations, implying that a switch occurs every 13 weeks onaverage. Rigs also occasionally exit the market on a temporary orpermanent basis; such exits together constitute 3.1% of the data.
I define all instances in which a producer has tworigs drillingin the same county as a “pair” and use these pairs as the unit ofobservation in my analysis.27 There are 907 unique pairs in thedata, and with 2 rigs per pair there exist 1,814 total observations,spread over 821 unique rigs and 531 unique county-producercombinations. Within each pair, I determine which rig leaves firsttowork for another producer. I capture this rig’s exit date and theproducer-specific experience Eprt of both rigs at that date. I thentest for a systematic relationship between each rig’s experienceand the identity of the rig that is released first: as the differencein producer-specific experience between the two rigs grows, doesit become more likely that the less-experienced rig is releasedfirst?
Figure II illustrates the evidence of relationship persistencein this sample. The horizontal axis plots the absolute value ofthe difference (in logs) of producer-specific experience betweenthe two rigs in each pair. Thus, points plotted on the right side ofthe graph represent observations in which the two rigs have verydifferent levels of producer-specific experience. All observationsare grouped into bins of width 0.2, and the vertical bars indicatethe number of pairs in each bin. Each plotted point indicates thefraction of pairs within each bin for which the less-experiencedrig was the first toexit. There exists a clear systematicpattern inthe data: as the difference in specific experience between the tworigs in each pair grows larger, it becomes more and more likelythat the less-experienced rig will exit first. This pattern is con-sistent with firms’ recognition of relationship-specific learning’sbenefits.
27. I exclude pairs in which both rigs change producers during the same week.I also exclude all pairs in which one or both rigs leave their producer to exit themarket rather than work for another firm. This restriction implies that the rigmovements I study in my analysis are not driven by a rig’s need for maintenanceor repairs.
at University of C
alifornia, Berkeley on D
ecember 7, 2011
http://qje.oxfordjournals.org/D
ownloaded from

1990 QUARTERLY JOURNAL OF ECONOMICS
FIGURE IILikelihood That the Least Experienced Rig is the First to Change Producers vs.
the Within-Pair Difference in Rigs’ Producer-Specific Experience
Regression analysis confirms these graphical results. I use aconditional logit model to estimate the effect of a rig’s producer-specific experience on its probability of being the first to exit itspair. Specifically, I estimate Equation (9), in which Experiencei1
denotes the producer-specific experience of rig 1 in pair i.
(9)
Pr (ExitFirstPair i, Rig 1) =exp (β ∙ log (Experiencei1))
exp (β ∙ log (Experiencei1)) + exp (β ∙ log (Experiencei2)).
Estimation results are reported in column (1) of Table IV: rigswithmoreproducer-specificexperiencearesignificantlyless likelyto exit first. The estimated marginal effect of −0.061 implies thatin a pair consisting of a rig with 12 months of experience anda rigwith 1 month of experience, the less-experienced rig has a 63.7%probability of being the first to exit.28
Column (2) of Table IV presents the results of estimatingEquation (9) when each rig’s total experience is used as theexplanatory variable. In this case, there is nosignificant relation-ship between experience and movements of rigs between produc-ers. This result reflects thefact that thegeneral experienceof a rigdoes not provide productivity benefits that are producer-specific.
28. Expanding the data set to use groups with more than two rigs (there are279 such groups) yields nearly the same point estimate of β as that found for thetwo-rig groups.
at University of C
alifornia, Berkeley on D
ecember 7, 2011
http://qje.oxfordjournals.org/D
ownloaded from

LEARNING BY DRILLING 1991
TA
BL
EIV
ES
TIM
AT
ES
FO
RT
HE
PR
OB
AB
ILIT
YT
HA
TA
RIG
I ST
HE
FIR
ST
TO
EX
ITI T
SP
AIR
.VA
LU
ES
SH
OW
NA
RE
MA
RG
INA
LE
FF
EC
TS:d
Pr
(Exi
tFir
st)
dX
(1)
(2)
(3)
(4)
(5)
Con
dit
ion
allo
git
Lin
ear
pro
babi
lity
mod
el
Log
ofri
g’s
pro
du
cer-
spec
ific
−0.
061∗∗∗
−−
0.05
9∗∗∗
−0.
067∗∗∗
0.03
6ex
per
ien
ce(E
prt
)(0
.012
)−
(0.0
11)
(0.0
24)
(0.0
52)
Log
ofri
g’s
tota
lex
per
ien
ce−
−0.
008
−−
−(E
prt
)−
(0.0
17)
−−
−P
air
FE
N/A
N/A
YY
YR
igF
EN
NN
YY
Rig
Xp
rod
uce
rfi
xed
effe
cts
NN
NN
Y
Not
es.M
argi
nal
effe
cts
are
calc
ula
ted
atth
esa
mp
lem
ean
s.V
alu
esin
par
enth
eses
ind
icat
est
and
ard
erro
rscl
ust
ered
onp
rod
uce
r.*,
**,*
**in
dic
ate
sign
ifica
nce
atth
e10
%,5
%,
and
1%le
vel.
All
spec
ifica
tion
su
se90
7”p
airs
”in
wh
ich
ap
rod
uce
rh
astw
ori
gsd
rill
ing
wel
lsfo
rit
inth
esa
me
cou
nty
.
at University of C
alifornia, Berkeley on D
ecember 7, 2011
http://qje.oxfordjournals.org/D
ownloaded from

1992 QUARTERLY JOURNAL OF ECONOMICS
Although a highly experienced rig may be more productive thanother rigs, its productivity when working for other producers willalsobehigher, andit is therefore likelytocommanda higherpricein the market.
Of course, there exist alternative explanations behind theLIFOpattern. First, it maybethat somerigs havelowerswitchingcosts than others and therefore change jobs frequently. A marketin which some rigs are “switchers” and others are “stayers” wouldgenerate a LIFO pattern even without relationship-specificlearn-ing. Second, ex ante match specificities would cause producers tohire rigs with which they match best first and then release thoserigs last.
To rule out heterogeneity in rig switching costs, I test fora LIFO pattern while including a set of rig fixed effects in thespecification. I do so using a linear probability model, since in-cluding rig fixed effects in a conditional logit is likely to lead toan incidental parameters problem that will cause the estimate ofβ to be inconsistent (Neyman and Scott 1948; Lancaster 2000).Fortunately, the baseline results do not appear to be sensitive tomodel choice. Column (3) of Table IV indicates that estimating alinear probability model with the log of producer-specific experi-ence and group fixed effects as covariates yields a marginal effectveryclosetothat of theconditional logit. Column(4)demonstratesthat, when rig fixed effects are added to the specification, I stillfind a strong systematic LIFO effect. The estimated marginaleffect is −0.067, compared with−0.059 in column (3), and is stillstatistically significant at the 1% level. Rig heterogeneity is notdriving the LIFO result.
Taking a step further and adding fixed effects for producer–rig interactions would eliminate the influence of match specifici-ties on this result. Unfortunately, within the 1,814 observationsin the sample there are 1,488 unique producer–rig combinations.The limited sample variation remaining after including thesefixed effects precludes inference, as indicated in column (5) ofTable IV. The standard error of the estimated marginal effect isnearly five times that of column (3), and this regression providesno evidence either for or against the LIFO pattern.
Supplemental evidence, however, supports the hypothesisthat the relationship persistence is not driven by preexistingmatch specificities. I first examine the extent to which thereis matching on an observable characteristic of rigs: their depthratings. For each rig in each pair, I use the absolute difference
at University of C
alifornia, Berkeley on D
ecember 7, 2011
http://qje.oxfordjournals.org/D
ownloaded from

LEARNING BY DRILLING 1993
between the rig’s depth rating and the average depth of the wellsit drills for the producer as a measure of the quality of the matchbetween the producerandrig. I then examine whetherthis “depthdifference” varies across the first and second rig to enter eachpair: a smaller difference for the first rig would be indicative ofmatching. I find that the distribution across pairs of the firstrig’s depth difference is very similar to that of the second rig.A Kolmogorov-Smirnov test on these distributions fails to rejectequality with a p-value of .565.29 This result indicates that atleast on the basis of observable depth ratings, the tworigs in eachpair are equally well matched to their wells, inconsistent with amatching story.
I also investigate preexisting performance differences be-tween the rigs in each pair by comparing the drilling times ofthe first well drilled by each rig. As with the depth differences,the data fail to reject equality of the initial performance of therig that enters first with that of the rig that enters second: theKolmogorov-Smirnov p-value is .528.30 This similarity betweenboth the initial performance and the depth rating of the tworigs in each pair suggests that the LIFO pattern in the data isnot driven by preexisting match specificities between producersand rigs, but is instead consistent with a recognition by firmsthat maintaining long-term relationships helps to maximize theproductivity benefits of relationship-specific learning.
VIII. MECHANISMS BEHIND RELATIONSHIP-SPECIFIC LEARNING
This section examines the mechanisms behind the observedrelationship-specific learning. Is this learning driven by repeatedpersonal interactions between the rigs’ and producers’ personnelor by rigs’ increasing familiarity with technical procedures spe-cific to particular producers and their fields? Understanding this
29. The average depth difference for the first rig toenter is 2,870 feet, whereasthat for the second rig is 2,939 feet. A paired t-test fails to reject equality of thesemeans with a t-statistic of 0.56.
30. This test uses a data set of 69 pairs for which both rigs can be matchedto a TRRC observation (and therefore a drilling time) either on entry or 1 weeksubsequent to entry. I adjust the drilling time of each rig for the effects ofthe producer’s field-specific experience and the rig’s overall experience per theestimatedreferencecase learningspecification(Table III, column(1)). Onaverage,the adjustedfirst-well drilling time of the first rig toenter is 2.2% higher than thatof the second rig (this difference has a t-statistic of 0.30). Without the experienceadjustment, this difference is 2.5%.
at University of C
alifornia, Berkeley on D
ecember 7, 2011
http://qje.oxfordjournals.org/D
ownloaded from

1994 QUARTERLY JOURNAL OF ECONOMICS
learning mechanism is important because it has implications forfirms’ optimal personnel and contracting practices. For example,if personal interactions are important, firms should have anincentive to maintain cross-firm relationships between their em-ployees by, for example, ensuring that their contracting partners’points of contact within their organizations do not frequentlychange.
This section presents three sets of results: (1) evidence thatrelationship-specific learning is driven by a producer’s relation-shipwithits specificrig, not therig’s broaderdrillingcompany; (2)evidence that rigs’ field-specific experience alone is insufficient todrive relationship-specificlearning; and (3) evidence that dayratecontracts (inwhichthereis morepersonal interactionbetweentheproducer’s and rig’s personnel) are associated with a more rapidrate of relationship-specific learning than are footage contracts.No single result is definitive on its own. For example, contractchoice is likely to be endogenous, and while the finding of accel-erated learning under dayrate contracts is robust to controls forfactors that plausibly influence both contract choice and learning,a definitive instrumental variable strategy is not available. Thethree sets of results are, however, mutually reinforcing in thatthey are all consistent with a substantial role for personal inter-actions in driving relationship-specific learning.
VIII.A. Rig versus Driller Specificity
I first examine whether the importance of producer–rig expe-rience is driven by producers’ relationships with particular rigsor by their relationships with the drilling companies owning therigs. I create two new experience variables: Edt measures theexperience (in weeks of active drilling within the past 2 years)of drilling company d, and Epdt measures the joint experience ofproducer p with driller d. Column (2) of Table V presents resultsobtained when these two variables are included in the referencecase learning specification (4) and (5). Neither Edt nor Epdt areestimatedtosignificantlyimpact drillingtimes, andthecoefficienton Eprt remains negative and statistically significant, indicat-ing that relationship-specific learning occurs at the producer–riglevel rather than the producer-drilling company level. This resultimplies that this learning is of a nature that cannot easily betransferred across rigs within a drilling company. In particular,what is being learned by the rigs cannot simply be technical
at University of C
alifornia, Berkeley on D
ecember 7, 2011
http://qje.oxfordjournals.org/D
ownloaded from

LEARNING BY DRILLING 1995
TA
BL
EV
EM
PIR
ICA
LA
NA
LY
SIS
OF
LE
AR
NIN
G- B
Y-D
OIN
GM
EC
HA
NIS
MS.D
EP
EN
DE
NT
VA
RIA
BL
EI S
log(
Dri
llin
gT
ime
Wel
lDep
th
)
(1)
(2)
(3)
(4)
(5)
(6)
(7)
Dri
llin
gF
ield
–C
ontr
act
Con
trac
tC
ontr
act
typ
e,R
efer
ence
com
pan
yp
rod
uce
r–ri
gC
ontr
act
typ
e,ty
pe,
fiel
dd
ura
tion
Log
ofex
per
ien
cew
ith
:ca
sem
odel
exp
erie
nce
exp
erie
nce
typ
eco
ntr
ols
FE
Xex
pco
ntr
o l
Sam
efi
eld
−0.
009
−0.
010
−0.
008
−0.
009
−0.
009
0.00
5−
0.01
0(E
ft)
(0.0
12)
(0.0
12)
(0.0
12)
(0.0
12)
(0.0
12)
(0.0
11)
(0.0
12)
Sam
ep
rod
uce
r0.
003
0.00
5−
0.00
20.
001
0.00
90.
005
0.01
0(E
pt)
(0.0
20)
(0.0
22)
(0.0
20)
(0.0
20)
(0.0
21)
(0.0
23)
(0.0
21)
Sam
efi
eld
,sam
ep
rod
uce
r−
0.02
3∗∗∗
−0.
022∗∗∗
−0.
015∗
−0.
023∗∗∗
−0.
024∗∗∗
−0.
027∗∗∗
−0.
024∗∗∗
(Efp
t)(0
.007
)(0
.007
)(0
.008
)(0
.007
)(0
.007
)(0
.007
)(0
.007
)S
ame
rig
−0.
014
−0.
019∗
−0.
013
−0.
012
−0.
012
−0.
022∗∗
−0.
011
(Ert
)(0
.009
)(0
.010
)(0
.012
)(0
.009
)(0
.009
)(0
.011
)(0
.009
)S
ame
pro
du
cer,
sam
eri
g−
0.01
9∗∗∗
−0 .
017∗
−0 .
004
−0.
012
spli
ne
−sp
lin
e(E
prt
)(0
.007
)(0
.009
)(0
.012
)(0
.007
)−
−−
Sam
efi
eld
,sam
eri
g−
−−
0.00
1−
−−
−(E
frt)
−−
(0.0
15)
−−
−−
Sam
efi
eld
,sam
ep
rod
uce
r,−
−−
0.01
9−
−−
−sa
me
rig
(Efp
rt)
−−
(0.0
16)
−−
−−
Sam
ed
rill
ing
com
pan
y−
0.01
8−
−−
−−
(Ed
t)−
(0.0
15)
−−
−−
−S
ame
pro
du
cer,
sam
ed
rill
ing
−−
0.00
5−
−−
−−
com
pan
y(E
pd
t)−
(0.0
10)
−−
−−
−D
ayra
teco
ntr
act
du
mm
y−
−−
0.02
20.
022
0.02
80.
022
−−
−(0
.016
)(0
.016
)(0
.017
)(0
.016
)
at University of C
alifornia, Berkeley on D
ecember 7, 2011
http://qje.oxfordjournals.org/D
ownloaded from

1996 QUARTERLY JOURNAL OF ECONOMICST
AB
LE
V
( CO
NT
INU
ED
)
(1)
(2)
(3)
(4)
(5)
(6)
(7)
Dri
llin
gF
ield
–C
ontr
act
Con
trac
tC
ontr
act
typ
e,R
efer
ence
com
pan
yp
rod
uce
r–ri
gC
ontr
act
typ
e,ty
pe,
fiel
dd
ura
tion
Log
ofex
per
ien
cew
ith
:ca
sem
odel
exp
erie
nce
exp
erie
nce
typ
eco
ntr
ols
FE
Xex
pco
ntr
ol
Inte
ract
ion
oflo
g(E
prt
)w
ith
:F
ract
ion
ofw
ork
ond
ayra
te−
−−
−0.
017∗∗
−0.
017∗
−0.
016
−0.
016∗
(α)
−−
−(0
.008
)(0
.010
)(0
.012
)(0
.010
)F
ield
’sav
erag
elo
g(d
rill
tim
e)−
−−
−0.
007
−0.
007
−−
−−
(0.0
11)
−(0
.011
)F
ield
’sst
d.d
ev.o
f−
−−
−−
0.09
0∗∗∗
−−
0.08
9∗∗∗
log(
dri
llti
me)
−−
−−
(0.0
33)
−(0
.034
)L
og(w
ell
dep
th)
−−
−−
−0.
004
−−
0.00
3−
−−
−(0
.008
)−
(0.0
08)
Log
(pro
du
cer
size
)−
−−
−0.
004
0.00
60.
005
−−
−−
(0.0
04)
(0.0
05)
(0.0
04)
Log
(dri
ller
size
)−
−−
−0.
001
−8.
4E-0
50.
002
−−
−−
(0.0
03)
(0.0
04)
(0.0
04)
Log
(tot
ald
ura
tion
of−
−−
−−
−−
0.00
9re
lati
onsh
ip)
−−
−−
−−
(0.0
06)
Inte
ract
ion
sof
fiel
dfi
xed
effe
cts
wit
hE
prt
NN
NN
NY
N
Not
es.V
alu
esin
par
enth
eses
ind
icat
est
and
ard
erro
rscl
ust
ered
onp
rod
uce
r.*,
**,*
**in
dic
ate
sign
ifica
nce
atth
e10
%,5
%,a
nd
1%le
vel.
All
spec
ifica
tion
su
se19
,059
obse
rvat
ion
s(w
ells
)co
veri
ng
1991
–200
5.A
llre
gres
sion
sin
clu
de
con
trol
sfo
rd
epth
and
wel
lty
pe,
mon
than
dye
arfi
xed
effe
cts,
fiel
dfi
xed
effe
cts,
and
pro
du
cer
Xri
gfi
xed
effe
cts.
Mea
sure
sof
fiel
dan
dp
rod
uce
r-sp
ecifi
cex
per
ien
ceE
ft,
Ep
t,an
dE
fpt
are
base
don
the
nu
mbe
rof
rece
ntl
yd
rill
edw
ells
and
are
inst
rum
ente
du
sin
gth
ere
cen
tn
um
ber
ofd
ays
spen
td
rill
ing
(Eft
,E
pt,
and
Efp
t)as
dis
cuss
edin
Sec
tion
V.C
.Rig
and
rela
tion
ship
-sp
ecifi
cex
per
ien
ceE
rtan
dE
prt
are
mea
sure
das
the
rece
nt
nu
mbe
rof
wee
ks
spen
td
rill
ing.
at University of C
alifornia, Berkeley on D
ecember 7, 2011
http://qje.oxfordjournals.org/D
ownloaded from

LEARNING BY DRILLING 1997
information about the producer’s procedures that can easily bewritten down and shared.
VIII.B. Rigs’ Field-Specific versus Producer-Specific Experience
I next examine whether the estimated producer–rig experi-ence effects are driven by the accumulation of each rig’s expe-rience with its current producer, with its current field, or withboth. Evidence on this question is already available in columns (2)and (5) of Table III, which compare rates of field- and producer-specific learning across specifications that do (column (2)) and donot (column (5)) include rig- and relationship-specific experienceas covariates. When Ert and Eprt are included, the estimatedimpacts of field–producer-specific experience Efpt and producer-specific experience Ept are attenuated. However, the estimatedimpact of field-specific experience Eft in both specifications isessentially identical in magnitude and statistically insignificant.If relationship-specific learning were primarily driven by rigs’field-specificexperience, the coefficient on Eft in column (5) shouldbe negative andsignificant, because rigs wouldcarry field-specificknowledgetodifferent producers workingwithinthesamefield.31
The absence of such an effect is consistent with the importance ofproducer-specificities rather than field-specificities in the mecha-nism behind the observed relationship-specific learning.
I attempt to further resolve the question of field-specificityversus producer-specificity by creating two new experience mea-sures. Efrt measures rig r’s experience in field f , regardless ofproducer, and Efprt measures rig r’s experience in field f withproducerp. This decompositionofexperienceis complicatedbythefact that the SB data do not contain field identifiers. Thus, eventhough I can identify each rig’s field location for each matchedobservation, I cannot do so for every week in which a rig isactive. I therefore estimate each rig’s field-specific experienceusing a two-step procedure. First, within the matched data, Ifind the fraction of wells drilled by each rig within the past 2years that were drilled in the same field as the rig’s current field.I then multiply this fraction by the total number of weeks therig has been active during the past 2 years, taken from the SBdata. Each rig’s field–producer-specific experience is calculated
31. Within-field, cross-producer rig moves dooccur in the data: 5,083 observa-tions are associated with rig-field pairs for which wells are drilled for more thanone producer.
at University of C
alifornia, Berkeley on D
ecember 7, 2011
http://qje.oxfordjournals.org/D
ownloaded from

1998 QUARTERLY JOURNAL OF ECONOMICS
similarly. The imputation of these variables suggests that theestimates that follow should be interpreted with caution becausethe estimated impacts of Efrt and Efprt may be attenuated bymeasurement error bias.
Inclusion of Efrt and Efprt in the reference case model yieldsthe estimates presented in column (3) of Table V. The estimatedcoefficients on Eprt and Efrt are small in magnitude and statis-tically insignificant, indicating a lack of evidence that either arig’s producer-specific or field-specific experience on its own issufficient to significantly improve drilling productivity. However,the sum of the coefficients on Eprt, Efrt, and Efprt is equal to−0.025and statistically significant at the 5% level, providing evidencethat accumulating experience within both the same producerand same field is beneficial to productivity.32 The importance ofrigs’ producer-specific experience is consistent with the resultsfrom columns (2) and (5) of Table III, discussed earlier, and theimportance of their field-specific experience is consistent withproducers having different company men and drilling proceduresacross fields, limiting the cross-field transferability of knowledge.The strength of this result is, however, limited by the fact thatit is no longer statistically significant at a conventional test sizewhen fixed effects for the triple interaction of field, producer, andrig identifiers are included in the specification.33
VIII.C. Relationship-Specific Learning and Contract Choice
Finally, I examine the difference in learning rates betweenproducers and rigs that work under a dayrate contract and those
32. A significant coefficient on the field–producer–rig-specificexperience termitself is not necessarytodrawthis conclusion. A test that a rig’s fieldandproducer-specific experienceare important, not just field-specific experience, requires thatthe sum of the coefficients on producer–rig and field–producer–rig experiencebe statistically significant—not the stronger condition that the coefficient onfield-producer–rig experience be statistically significant—since adding producer-specific experience within the same field affects both of these terms. The sum ofthese coefficients is−0.024 and statistically significant at the 5% level. Similarly,thesumof thecoefficients onfield–rigandfield–producer–rigexperienceis−0.020and also statistically significant at the 5% level.
33. These fixed effects address the possibility that the results are drivenby match-specificities between fields, producers, and rigs. The fixed effects add8,069 covariates to the specification and effectively remove from the sample 4,770observations that are associated with a field–producer–rig triple for which Iobserve only one well, thereby hindering inference. The sum of the coefficients onthe three experience variables is only statistically distinct from 0 with a p-valueof .232 in this specification.
at University of C
alifornia, Berkeley on D
ecember 7, 2011
http://qje.oxfordjournals.org/D
ownloaded from

LEARNING BY DRILLING 1999
that work under a footage contract. A differential learning ratebetweenthesetwocontract types canshedlight onthemechanismbehind relationship-specific learning because under a dayratecontract there is more interaction between producer and rig per-sonnel: the producer always has a company man assigned to therig and directs the rig’s operations in consultation with the rig’sforeman. Thedifferenceindirect monetaryincentives betweenthetwo contracts may also be important, as under a footage contractthe rig is the residual claimant and therefore has a particularlystrong incentive to improve its productivity.
To evaluate learning rates across different contract types, Iinclude in the regression an interaction of the log of producer-rig-specific experience Eprt with the fraction α of that experiencethat was obtained under dayrate contracts. The results of esti-mating this specification—which for the moment should only bethought of as descriptive rather than causal—are presented incolumn (4) of Table V. The estimated coefficient on α ∙ log Eprt isequal to −0.017 and is statistically significant at the 5% level,indicating that relationship-specific learning is stronger underdayrate contracts than under footage contracts.34 This regressionalsoincludes a dummy for whether any given well is drilledundera dayrate contract: the estimated coefficient on this dummy ispositive with a point estimate of 0.022 and is marginally sta-tistically significant with a p-value of .171. This result providessome evidence that the initial performance of a producer–rig pairis slightly better with a footage contract than with a dayratecontract and that this advantage is reversed as experience isaccumulated.
A causal interpretation of the coefficient on α ∙ log Eprt musttake into account the possibility that there exist factors thatinfluence both contract choice and the rate of learning. For ex-ample, firms may be more likely to choose a dayrate contractwhen drilling in fields that present substantial geologic risk,and learning curves in such fields may plausibly be relativelysteep. An ideal identification strategy would use an instrumentalvariable. Unfortunately, such a strategy does not appear to beviable. Candidate instruments, such as measures of firms’ sizethat proxy for their risk appetites, are insufficiently powerful to
34. The estimated coefficient of −0.012 (p-value = .118) on the uninter-actedproducer–rig-specificexperience variable indicates that relationship-specificlearning is still likely to be occurring under footage contracts, albeit with arelatively low magnitude.
at University of C
alifornia, Berkeley on D
ecember 7, 2011
http://qje.oxfordjournals.org/D
ownloaded from

2000 QUARTERLY JOURNAL OF ECONOMICS
yield informative results. In the absence of a viable instrumentalvariable strategy, the next best approach is toexamine the impactof dayrate contracting on learning while controlling for as manyobservable potentially confounding factors possible. This is theapproach I adopt here.
I examine three sets of observables that seem likely to in-fluence the contractual form chosen by a particular producer–rigpair working in a particular field. First, I use well depth, theaverage drilling time in the field being drilled (across all firms),and the variance of the drilling times in the field being drilled(also across all firms) to measure geologic risk. Second, I use thesizes of the producer and drilling company (as measured by theirtotal number of well-weeks of drilling) to proxy for the firms’willingness to bear risk. Third, I use the experience accumulatedby the pair (Eprt) to capture any systematic tendency to switchcontractual formoverthecourseof a relationship. Theimportanceof these factors in determining the choice of contract type isexamined empirically in Online Appendix 3 and Table A4; thefindings from this analysis generally agree with those from Cortsand Singh’s (2004) study of the offshore drilling industry. Inparticular, dayrate contracts are more likely when geologicrisk ishigh, when the producer is large, and later in relationships. CortsandSinghattributethis last result tothepossibilitythat repeatedinteractions improve trust and thereby reduce the importance ofdirect performance incentives.
Table V, column (5) examines the rate of learning underdayrate contracts while including interactions of the foregoingdeterminants of contract choice with Eprt to control for theirpotential impact on the rate of learning. Eprt itself enters thisspecification as a spline to address the possibility that the rate oflearning late in relationships—when dayrate contracts are morelikely—may be greater than or less than that given by the log-logfunctional form. Thecoefficient onrelationship-specificexperienceaccumulatedunderdayratecontracts, α∙log Eprt, is estimatedtobe−0.017. This estimate is essentially identical tothat from column(4), which omitted these controls, and is statistically significantat the 10% level. The result that learning is accelerated underdayrate contracts is therefore robust to controls for observable,relevant factors, though it may still be biased by unobservables.Column (5) of Table V also presents estimates of the coefficientson the other interaction terms: fields in which the variance ofdrilling times is particularly high are foundtohave relatively fast
at University of C
alifornia, Berkeley on D
ecember 7, 2011
http://qje.oxfordjournals.org/D
ownloaded from

LEARNING BY DRILLING 2001
learning rates, but interactions involving other factors such asfirm size are not estimated to have a significant effect.
Column (6) of Table V addresses unobservable field-specific factors that could influence both contract choice andlearning rates by including interactions of field dummies withrelationship-specific experience Eprt. The specification stillincludes interactions of firm size with Eprt. The point estimateon α ∙ log Eprt is −0.016, similar to the results in columns (4) and(5), though it is only statistically distinct from 0 with a p-valueof .196. This estimate is free of confounds driven by field-specificgeology, though it may still be biased if there are unobservedfirm-specific factors that affect both learning rates and the choiceof contractual form.35
These results suggest that the increase in personal contactunder dayrate contracts accelerates the rate of learning and thatthis effect dominates the direct learning incentives provided byfootagecontacts. I concludethis sectionbyconsideringanimplica-tion of these results for firms’ optimal choice of contractual form.Because the benefits of accelerated learning accrue over time, iffirms learn more quickly under dayrate contracts then the likeli-hood with which they use these contracts should increase withthe expected duration of their relationship. I examine whetherthis systematicpatternholds usingthesubsampleof producer–rigpairs that always usethesamecontractual form. I reducethedatato one observation per field–producer–rig triple and regress eachproducer−rig pair’s contract choice on the total duration of theirrelationship(inlogs) andonfield, producer, andrigfixedeffects.36
Because the actual relationship duration is equal to the ex anteexpected duration plus error, this regression yields an attenuated
35. Pushing further andadding interactions of producer andrig dummies withjoint experience removes substantial identifying variation, yielding an estimatedeffect of−0.012 with a standard error of 0.015.
36. Each producer–rig pair’s relationship duration is calculated from the SBdata as the difference between the first and last day the pair is observed. Thiscalculation drops the first year of SB data (1990) to avoid pairs that began workpriortothestart of thesample. Thetotal numberof pairs intheregressionis 6,996,and some pairs are observed multiple times due to the field fixed effects. Thesefixed effects are important because they control for geologic factors that mightinfluence both contract choice and relationship duration. A similar regressionthat uses only one observation per producer–rig pair and omits field fixed effectshas 5,054 observations and yields an estimated effect of 2.5% that is statisticallysignificant at the 1% level.
at University of C
alifornia, Berkeley on D
ecember 7, 2011
http://qje.oxfordjournals.org/D
ownloaded from

2002 QUARTERLY JOURNAL OF ECONOMICS
estimate of the relationship between expected duration and theinitial choice of contractual form.
I find that a one-unit change in the log of the relationshipduration is associated with a 3.0% increase in the likelihood thata dayratecontract is used. This result is statisticallysignificant atthe 1% level.37 The small magnitude of the estimated effect mayreflect both attenuation bias and forces that push in the oppositedirection. For example, under a conventional story of contractingcosts, footage contracts are more costly to write but provide astronger productivity incentive, and they should therefore befavoredinlongerrelationships becausetheinitial contractingcostcan be spread over a longer period.
This section has presented three sets of results that speak tothemechanismbehindrelationship-specificlearning. Althoughnosingle set of results is definitive, together all three are consistentwith a prominent role for cross-firm personal interactions indriving relationship-specificlearning. These findings suggest thatthe degree of contact between firms’ personnel should play a rolein operational and contracting decisions and are consistent withthe evidence that firms’ choices of contractual form depend on theexpected duration of their relationships.
IX. CONCLUSIONS
This article demonstrates that relationship-specific learningcan be an important driver of productivity improvement andplay a role in firms’ contracting decisions. I find that a drillingrig that accumulates experience with one producer improves itsproductivity more than twice as quickly as a rig that frequentlychanges contracting partners. As a consequence, producers andrigs have a strong incentive to maintain their relationships, andthe data demonstrate that producers are more likely to workwith rigs with which they have substantial prior experience thanthose with which they have worked relatively little. Moreover,the observed relationship-specific learning appears to be drivenprimarily by the accumulation of personal interactions betweenthe firms’ personnel, rather than by just the accumulation of field-or firm-specific technical knowledge.
37. Column (7) of Table V verifies that the finding of accelerated learningunderdayratecontracts fromcolumn(5) is robust tothe inclusionof aninteractionbetween relationship duration and producer–rig joint experience.
at University of C
alifornia, Berkeley on D
ecember 7, 2011
http://qje.oxfordjournals.org/D
ownloaded from

LEARNING BY DRILLING 2003
These results seem likely to generalize to other indus-tries in which outsourcing is common. For example, construc-tion contractors or management consulting firms may developrelationship-specific intellectual capital through joint work expe-rience with their clients. The importance of relationship-specificlearning presumably varies with industry and firm character-istics. Greater technical complexity in an industry’s productionprocess, for example, could drive steeper learning curves thanthose documented in this article.
Firms may also be able to take actions that influence theirrate of relationship-specific learning. To deepen interpersonal re-lationships, a leadfirm might embedsome of its employees withintheorganizations of its contractingpartners, oracontractormightset up offices near its clients. To the extent that these actionsare costly, it may be in the firms’ interests to develop contractingarrangements that alleviate ex post bargaining problems andpromote efficient investment. These personnel and contractingimplications of relationship-specificlearning are potentially valu-able subjects for future research.
DEPARTMENT OF ECONOMICS, UNIVERSITY OF MICHIGAN, AND
NATIONAL BUREAU OF ECONOMIC RESEARCH
SUPPLEMENTARY MATERIAL
An Online Appendix for this article can be found at QJEonline (qje.oxfordjournals.org).
REFERENCES
Adeleye, A. R., B. K. Virginillo, A. W. Iyoho, K. Parenteau and Henry Licis,“Improving Drilling Performance through Systematic Analysis of HistoricalData: Case Study of a Canadian Field,” Society of Petroleum Engineers paper87177 (2004).
Alchian, Armen, “Reliability of Progress Curves in Airframe Production,” Econo-metrica, 31 (1963), 679–694.
Anderson, T. W. and Cheng Hsiao, “Estimation of Dynamic Models with ErrorComponents,”Journal of the American Statistical Association, 76 (1981), 598–606.
Argote, Linda, Sara L. Beckman andDennis Epple, “The Persistence andTransferof Learning in Industrial Settings,” Management Science, 36 (1990), 140–154.
Arrow, Kenneth J., “The Economic Implications of Learning by Doing,” Review ofEconomic Studies, 29 (1962), 155–173.
Becker, Gary S., Human Capital; A Theoretical and Empirical Analysis, withSpecial Reference to Education (NewYork: Columbia University Press, 1964).
Benkard, C. Lanier, “Learning and Forgetting: The Dynamics of Aircraft Produc-tion,” American Economic Review, 90 (2000), 1034–1054.
at University of C
alifornia, Berkeley on D
ecember 7, 2011
http://qje.oxfordjournals.org/D
ownloaded from

2004 QUARTERLY JOURNAL OF ECONOMICS
——, “A Dynamic Analysis of the Market for Wide-Bodied Commercial Aircraft,”Review of Economic Studies, 71 (2004), 581–611.
Besanko, David, Ulrich Doraszelski, Yaroslav Kryukov, and Mark Satterthwaite,“Learning-by-Doing, Organizational Forgetting, and Industry Dynamics,”Econometrica, 78 (2010), 453–508.
Brett, J. F. and K. K. Millheim, “The Drilling Performance Curve: A Yardstick forJudging Drilling Performance,” Society of Petroleum Engineers paper 15362(1986).
Cabral, Luis M. B. and Michael H. Riordan, “The Learning Curve, Market Domi-nance, and Predatory Pricing,” Econometrica, 62 (1994), 1115–1140.
Corts, Kenneth S. “The Interaction of Implicit and Explicit Contracts in Con-structionandProcurement Contracting,”Universityof Torontoworkingpaper(2007).
Corts, KennethS. andJasjit Singh.“TheEffect of RepeatedInteractiononContractChoice: Evidence from Offshore Drilling,” Journal of Law, Economics, andOrganization, 20 (2004), 230–260.
Ellison, GlennandRichardHolden, “A TheoryofRuleDevelopment,”MITWorkingPaper (2009).
Gibbons, Robert andMichael Waldman, “Task-SpecificHumanCapital,” AmericanEconomic Review Papers and Proceedings, 94 (2004), 203–207.
——, “Enriching a Theory of Wage and Promotion Dynamics Inside Firms,”Journal of Labor Economics, 24 (2006), 59–107.
Huckman, Robert S. and Gary P. Pisano, “The Firm Specificity of Individual Per-formance: Evidence from Cardiac Surgery,” Management Science, 52 (2006),473–488.
Jovanovic, Boyan and Yaw Nyarko, “Learning by Doing and the Choice of Tech-nology,” Econometrica, 64 (1996), 1299–1310.
Klein, Benjamin, Robert G. Crawford, and Armen A. Alchian, “Vertical Integra-tion, Appropriable Rents, and the Competitive Contracting Process,” Journalof Law and Economics, 21 (1978), 297–326.
Lancaster, Tony, “The Incidental Parameter Problem since 1948,” Journal ofEconometrics, 95 (2000), 391–413.
Lucas, Robert E., “On the Mechanics of Economic Development,” Journal ofMonetary Economics, 22 (1988), 3–42.
McCabe, Mark J., “Principals, Agents, and the Learning Curve: The Case ofSteam-Electric Power Plant Design and Construction,” Journal of IndustrialEconomics, 44 (1996), 357–375.
Neyman, Jerzy and Elizabeth L. Scott, “Consistent Estimates Based on PartiallyConsistent Observations,” Econometrica, 16 (1948), 1–32.
Parente, Stephen L., “Technology Adoption, Learning-by-Doing, and EconomicGrowth,” Journal of Economic Theory, 63 (1994), 346–369.
Poletaev, Maxim and Chris Robinson, “Human Capital Specificity: Evidence fromthe Dictionary of Occupational Titles and Displaced Worker Surveys, 1984–2000,” Journal of Labor Economics, 26 (2008), 387–420.
Prendergast, Canice, “The Role of Promotion in Inducing Specific Human CapitalAcquisition,” Quarterly Journal of Economics, 108 (1993), 523–534.
Spence, Michael A., “The Learning Curve and Competition,” Bell Journal ofEconomics, 12 (1981), 49–70.
Stokey, NancyL., “LearningbyDoingandtheIntroductionof NewGoods,” Journalof Political Economy, 96 (1988), 701–717.
Thompson, Peter, “HowMuch Did the Liberty Shipbuilders Forget?” ManagementScience, 53 (2007), 908–918.
Thornton, Rebecca A. and Peter Thompson, “Learning from Experience andLearning from Others: An Exploration of Learning and Spillovers in WartimeShipbuilding,” American Economic Review, 91 (2001), 1350–1368.
Wiggins, Steven N. and Gary D. Libecap, “Oil Field Unitization: Contractual Fail-ure in the Presence of Imperfect Information,” American Economic Review, 75(1985), 368–385.
Williamson, Oliver E., Markets and Hierarchies: Analysis and Antitrust Implica-tions (New York: Free Press, 1975).
——, The Economic Institutions of Capitalism (New York: Free Press, 1985).Wright, T. P., “Factors AffectingtheCost ofAirplanes,”Journal of the Aeronautical
Sciences, 3 (1936), 122–128.
at University of C
alifornia, Berkeley on D
ecember 7, 2011
http://qje.oxfordjournals.org/D
ownloaded from

1
Online Appendices for “Learning by Drilling: Inter-Firm Learning and Relationship Persistence in the Texas Oilpatch”
by Ryan Kellogg
Appendix 1
The empirical analysis requires a well-level dataset in which each observation reports the
well’s drilling time, location, producer, and drilling rig. I construct this dataset by merging the
SB rig location data into the TRRC’s well-level drilling records. Unfortunately, a large fraction
of wells in the TRRC data cannot be matched to rig information in the SB data. Match failures
occur for four reasons. First, some wells in shallow fields are drilled in less than one week and
may therefore not be drilled on a Friday. Such wells have no corresponding record in the SB data
and are therefore impossible to match. Although these wells constitute only 6 percent of the
overall population, it is possible that this selection on the dependent variable may bias the
results. I address this concern by estimating (4) and (5) with data only for wells that are at least
8000 feet deep (12,128 observations). Such wells are essentially impossible to drill in less than
one week, and estimation with this sub-sample neutralizes the potential selection problem.
Results, presented in column (2) of table A3, are similar to those obtained from the full sample,
shown in column (1).
Second, 14.8 percent of the TRRC wells do not match because the producer names in the
TRRC data do not always agree with the producer names in the SB data. Often, two names are
similar only in part, and it is difficult to discern whether the two names do in fact point to the
same firm. I use information on firm addresses, officer names, and drilling frequency to carefully
match some similar names; however, I leave ambiguous cases unmatched to avoid the risk of
matching firms that are, in fact, distinct.
Third, 27.7 percent of the TRRC wells do not have a match because the SB data are not
as comprehensive as the TRRC data: SB records 23.3 percent fewer drilling-weeks than does the
TRRC. These match failures do not appear to be systematic; in particular, their incidence is not
significantly correlated with wells’ drilling times, the primary dependent variable of the analysis.
Specifically, I regress a flag for whether each TRRC observation matched at least one SB
observation on the log of the well’s drilling time and a set of field-by-producer fixed effects. The
point estimate on the log of drilling time is -0.0085—small in magnitude—with a standard error
of 0.0060.

2
Finally, some non-unique matches occur when a producer employs multiple drilling rigs
simultaneously in the same county. Because the SB data do not contain field or well information,
I am unable to distinguish which rig is drilling which well in such cases. While I am able to use
information on well depth and well type to match some of these wells to their rigs, there are
other cases in which there is no way to confidently match the data. I drop all wells that cannot be
matched uniquely, reducing the dataset by a further 20.4 percent of the original TRRC well
count.
Appendix 2
This appendix verifies the robustness of the reference case relationship-specific learning
result (column (1) of tables III and A3) to a series of alternative specifications and variable
definitions, the results of which are reported in table A3.1 Column (3) considers a specification in
which ˆrtE is replaced by ˆ
prtE , which measures the experience of rig r with producers other than
p. In this regression, the importance of relationship-specific learning is given by the difference
between the coefficients on ˆprtE and ˆ
prtE . I estimate this difference to be equal to -0.021, very
similar to the -0.019 estimate on ˆprtE in the reference case and statistically significant with a p-
value of .019.
The results reported in the main text measure field and producer experience using Eft, Ept,
and Efpt: the number of wells drilled within two years of date t. Table A3, column (4), presents
the results of estimating an alternative specification in which these experience variables are
measured directly by ˆftE , ˆ
ptE , and ˆfptE : the number of days of drilling within two years of date
t. The estimated relationship-specific learning effect is not substantially affected by this change.
The importance of the producer’s field-specific experience, however, is diminished relative to
the reference case model. The source of this change may be that, if Efpt is a better reflection of
the process by which learning occurs, then fptE measures experience with error and the point
estimate in column (4) reflects attenuation bias.
Column (5) estimates the model without instrumenting for Eft, Ept, and Efpt with ˆftE , ˆ
ptE ,
and ˆfptE . As expected, the difference between the reference case and non-instrumented estimates
of the coefficients on Eft, Ept, and Efpt are not substantial. These results reinforce the intuition that
the bias generated by serial correlation in the disturbance εfprt is minor. Moreover, the estimated
1 For additional specifications and robustness tests, see Kellogg, Ryan, "Learning by Drilling: Inter-Firm Learning and Relationship Persistence in the Texas Oilpatch," NBER Working Paper #15060.

3
relationship-specific learning effect is not substantially affected by using a least squares rather
than instrumental variables estimator.
Finally, I verify that the results are robust to changes in the length of time over which I
calculate the experience variables. The results in columns (6), (7), and (8) calculate experience
over one, three, and five years, respectively, rather than the reference case of two years. At the
one-year horizon, the point estimate on ˆprtE is reduced to -0.011, though it is still statistically
significant with a p-value of .057. At three and five year horizons, the estimated relationship-
specific learning rate is actually stronger than that estimated in the reference case.2
Appendix 3
This appendix examines the determinants of whether producers and rigs choose to work
together under dayrate or footage contracts. I focus on three sets of factors: those related to the
geologic risk and difficulty of drilling in a particular field, those related to the risk appetite of
each firm, and those related to the number of previous interactions between the producer and the
rig. Factors relating to geologic risk are measured using three variables: the average (across all
producers) of log(drilling time) across all wells drilled in the field, the standard deviation (across
all producers) of log(drilling time) across all wells drilled in the field, and the depth of the well
being drilled. The firms’ risk appetites are measured using proxies for firm size: the log of the
total number of well-weeks of drilling observed in the sample by each producer and drilling
company. Finally, I measure previous interactions using the log of each producer-rig pair’s joint
experience: ˆprtE .
For each drilled well in the sample, I regress the binary choice of contract on all six
variables and report the estimation results in column (1) of table A4. As with the learning
regressions in the main text, standard errors are clustered on producer to address
heteroscedasticity and serial correlation. The three measures of geologic difficulty and risk are
all estimated to be associated with a greater frequency of dayrate contracting, as expected.
Relatively large producers are estimated to be more likely to use dayrate contracts, and the
likelihood of dayrate contracting is also found to increase with the number of previous
interactions between the producer and the rig. All of these results are aligned with the findings of
Corts and Singh (2004) for offshore drilling in the Gulf of Mexico. The one finding that diverges
from that paper is that relatively large drilling companies tend to also favor dayrate contracts. A
2 The number of observations for these estimates is reduced because calculating experience over more than two years requires dropping observations that occur early in the sample.

4
theory of risk allocation would predict the opposite effect. One story that could explain this result
is that relatively large firms have well-known reputations for being efficient drillers; thus,
producers do not need to use footage contracts when working with them. Instead, they use
dayrate contracts that are less costly to write and induce faster learning.
The estimates in table A4, column (1), must be interpreted with caution because they are
subject to the criticism of Ackerberg and Botticini (2002). If there are unobserved characteristics
of firms (such as the portion of their risk tolerance that is not captured by the firm size variables)
that are correlated both with their choice of contract type and field in which to work, then the
estimated coefficients on the variables measuring geologic risk may be biased. Similarly, if fields
have unobserved characteristics that are not captured by the observed variables, then the
estimated coefficients on the firm size variables that proxy for risk appetites may be biased.
To address these concerns, I use fixed effects estimators that control for these unobserved
characteristics, under the assumption that the characteristics are constant over the sample. Table
A4, column (2), estimates the influence of firm size on contract choice in the presence of field
fixed effects, and still finds that both large producers and large drillers are more likely to choose
dayrate contracts. The finding that dayrate contracts are more likely late in a relationship is also
robust to these fixed effects. Column (3) replaces the field fixed effects with producer-driller
fixed effects. Here, I still estimate that relatively deep wells are more likely to be drilled under a
dayrate contract—the estimated coefficient actually increases substantially in magnitude, from
0.022 in column (1) to 0.186 in column (3). Because field depth is strongly correlated with
drilling times, this increase in the depth coefficient leads the estimated coefficient on fields’
average drilling times to be negative and marginally statistically significant with a p-value of
.128. The coefficient on the standard deviation of drilling times is still positive, though
attenuated in magnitude and statistically distinct from zero with a p-value of only .158. Repeated
contracting is still estimated to significantly increase the likelihood that a dayrate contract is
used. Overall, these fixed effects estimates indicate that the baseline results from column (1)
were not wholly driven by matching on unobserved characteristics, though accounting for this
matching does affect which particular field-level variables are estimated to be the most important
drivers of contractual form.

5
(1) (2) (3)
Log of experience based on drilling time: Same field (E ft ) Same producer (E pt )
Same field, same
producer (E fpt )
0.511***
0.002 0.013(0.012) (0.006) (0.012)
0.049***
0.685***
0.087***
(0.015) (0.031) (0.023)
0.012***
0.006**
0.439***
(0.004) (0.003) (0.010)
0.012 -0.009 -0.007(0.009) (0.009) (0.013)
0.020***
0.039***
0.065***
(0.005) (0.006) (0.009)
Number of observations 19059 19059 19059
Notes : Values in parentheses indicate standard errors clustered on producer. *,**,*** indicate significance at the 10%, 5%, and 1% level.
All specifications use 19,059 observations (wells) covering 1991-2005.
Table A1
First stage regressions for field and producer experience variables E ft , E pt , and E fpt
Same field
(E ft )
Same producer
(E pt )
Same field, same producer
(E fpt )
Same rig
(E rt )
Same producer, same rig
(E prt )
Dependent variable: log of experience based on well counts
All regressions include controls for depth and well type, month and year fixed effects, field fixed effects, and producer X rig fixed effects.
^
^
^
^
^

6
VariablePoint
estimate VariablePoint
estimateStandard
error
Log of experience with: September dummy 0.017 (0.014)
Same field (E ft ) -0.009 (0.012) October dummy -0.016 (0.016)
Same producer (E pt ) 0.003 (0.020) November dummy -0.010 (0.017)
Same field, same producer (E fpt ) -0.023 (0.007) *** December dummy -0.013 (0.019)
Same rig (E rt ) -0.014 (0.009) 1992 dummy -0.037 (0.037)
Same producer, same rig (E prt ) -0.019 (0.007) *** 1993 dummy 0.001 (0.037)
Well depth / 1000 -0.346 (0.144) ** 1994 dummy -0.020 (0.045)
(Well depth)2 / 1,000,000 0.034 (0.013) *** 1995 dummy -0.012 (0.047)
(Well depth)3 / 1,000,000,000 -8.9E-04 -3.5E-04 ** 1996 dummy 0.012 (0.052)
Gas well 3.3E-05 (0.025) 1997 dummy -0.004 (0.058)
Oil and gas well 0.201 (0.118) * 1998 dummy 0.024 (0.065)
February dummy -6.1E-04 (0.016) 1999 dummy 0.019 (0.073)
March dummy -0.017 (0.016) 2000 dummy -0.033 (0.070)
April dummy -0.017 (0.018) 2001 dummy -0.010 (0.075)
May dummy -0.027 (0.017) 2002 dummy -0.024 (0.078)
June dummy -0.032 (0.018) * 2003 dummy -0.060 (0.081)
July dummy -0.018 (0.017) 2004 dummy -0.099 (0.082)
August dummy -0.004 (0.015) 2005 dummy -0.099 (0.088)
Notes : Values in parentheses indicate standard errors clustered on producer. *,**,*** indicate significance at the 10%, 5%, and 1% level.
Specification uses 19,059 observations (wells) covering 1991-2005.
Regression includes field fixed effects and producer X rig fixed effects.
Table A2Learning-by-doing estimates for the reference case model (table IV, column (1)),
including control variables. Dependent variable is log(drilling time / well depth)
Standard error
Measures of field and producer-specific experience E ft, E pt, and E fpt are based on the number of recently drilled wells and are
instrumented using the recent number of days spent drilling (E ft, E pt, and E fpt) as discussed in Section V.C. Rig and relationship-specific
experience E rt and E prt are measured as the recent number of weeks spent drilling.
^
^
^ ^ ^
^ ^

7
(1) (2) (3) (4) (5) (6) (7) (8)
Log of experience with:Reference case model
Wells deeper than 8000
feet
Same rig, other producer
experience
Drilltime-based
experience No IVOne-year
experienceThree-year experience
Five-year experience
-0.009 -0.026*
-0.010 -0.005 -0.005 -0.016 -0.013 -0.025(0.012) (0.015) (0.012) (0.006) (0.011) (0.011) (0.013) (0.017)
0.003 0.019 0.003 -0.001 -0.005 -0.011 0.019 0.031(0.020) (0.021) (0.020) (0.014) 0.017 (0.016) (0.023) (0.024)
-0.023***
-0.018**
-0.022***
-0.010***
-0.028***
-0.025***
-0.018**
-0.019***
(0.007) (0.008) (0.007) (0.003) (0.007) (0.007) (0.008) (0.007)
-0.014 -0.019* - -0.014 -0.015 -0.014 -0.013 -0.010
(0.009) (0.012) - (0.009) (0.009) (0.009) (0.010) (0.011)
-0.019***
-0.017**
-0.024***
-0.021***
-0.017***
-0.011*
-0.023***
-0.027***
(0.007) (0.007) (0.006) (0.006) (0.006) (0.006) (0.007) (0.007)
- - -0.004 - - - - -
- - (0.005) - - - - -
Number of observations 19059 12128 19059 19059 19059 19059 17891 15515
Notes : Values in parentheses indicate standard errors clustered on producer. *,**,*** indicate significance at the 10%, 5%, and 1% level.
All specifications use 19,059 observations (wells) covering 1991-2005.
All regressions include controls for depth and well type, month and year fixed effects, field fixed effects, and producer X rig fixed effects.
Other producer, same rig
(E -prt )
Table A3Empirical analysis of learning-by-doing: robustness. Dependent variable is log(drilling time / well depth)
Same field, same producer
(E fpt )
Same field
(E ft )
Same producer
(E pt )
Same rig
(E rt )
Same producer, same rig
(E prt )
Measures of field and producer-specific experience E ft, E pt, and E fpt are based on the number of recently drilled wells and are instrumented using the recent number of days
spent drilling (E ft, E pt, and E fpt) as discussed in Section V.C. Exceptions are column (4), in which E ft, E pt, and E fpt are used directly as covariates, and column (5), in which
Eft, Ept, and Efpt are not instrumented. Rig and relationship-specific experience E rt and E prt are measured as the recent number of weeks spent drilling.
^
^
^
^ ^ ^ ^ ^ ^
^ ^

8
(1) (2) (3)
No fixed effects Field fixed effectsProducer and driller
fixed effects
0.075** - -0.037
(0.037) - (0.024)
0.168*** - 0.045
(0.056) - (0.032)
0.022*** - 0.186
**
(0.059) - (0.040)
0.048***
0.049** -
(0.013) (0.009) -
0.087***
0.076*** -
(0.009) (0.008) -
0.032***
0.031***
0.024***
(0.008) (0.005) (0.004)
Number of observations 19059 19059 19059
Notes : Values in parentheses indicate standard errors clustered on producer.
*,**,*** indicate significance at the 10%, 5%, and 1% level.
All specifications use 19,059 observations (wells) covering 1991-2005.
Log(driller size)
Table A4Empirical analysis of contract choice
Dependent variable is binary: 0 for footage contract, 1 for dayrate
Log of experience within same
producer and rig (E prt )
Mean log drilling time within field
Std. deviation of log drilling time within field
Log(well depth)
Log(producer size)
^