LEAR 2005 wachoviaconf
14
1 fast forward R 15 th Annual Wachovia Securities Nantucket Equity Conference June 30, 2005 15 th Annual Wachovia Securities Nantucket Equity Conference June 30, 2005
-
Upload
finance16 -
Category
Economy & Finance
-
view
161 -
download
0
Transcript of LEAR 2005 wachoviaconf

1
fast forward
R
15th Annual Wachovia SecuritiesNantucket Equity Conference
June 30, 2005
15th Annual Wachovia SecuritiesNantucket Equity Conference
June 30, 2005

2
Strategic Evolution
Seat Components to Seat Systems
Seat Systems to Total Interior Capability
Operational Excellence; Reduce Debt
1990-1994
1994-1999
1999-2003
Going Forward Profitably Grow the Business

3
$0.0$2.0$4.0$6.0$8.0
$10.0$12.0$14.0$16.0$18.0
1994 1995 1996 1997 1998 1999 2000 2001 2002 2003 2004
Lear’s Strategy has Supported Rapid Growth
Net Sales(in billions) SALES
CAGR18%
$3.1
Over The Last Ten Years, Over The Last Ten Years, Lear Has Been Focused On GrowthLear Has Been Focused On Growth
Net Income
CAGR 22%$17.0

4
NorthAmerica Europe Global
Seating Systems #1 #1 #1
Door Panels #1 #3 #2
Flooring & Acoustics #2 #8 #2
Headliners #2 #3 #3
Electrical Distribution #3 #3 #3
Instrument Panels #5 #4 #7
Global Market Leadership
Leadership Position in Leadership Position in Total InteriorsTotal Interiors
Source: 2003 Lear Market Share study
5
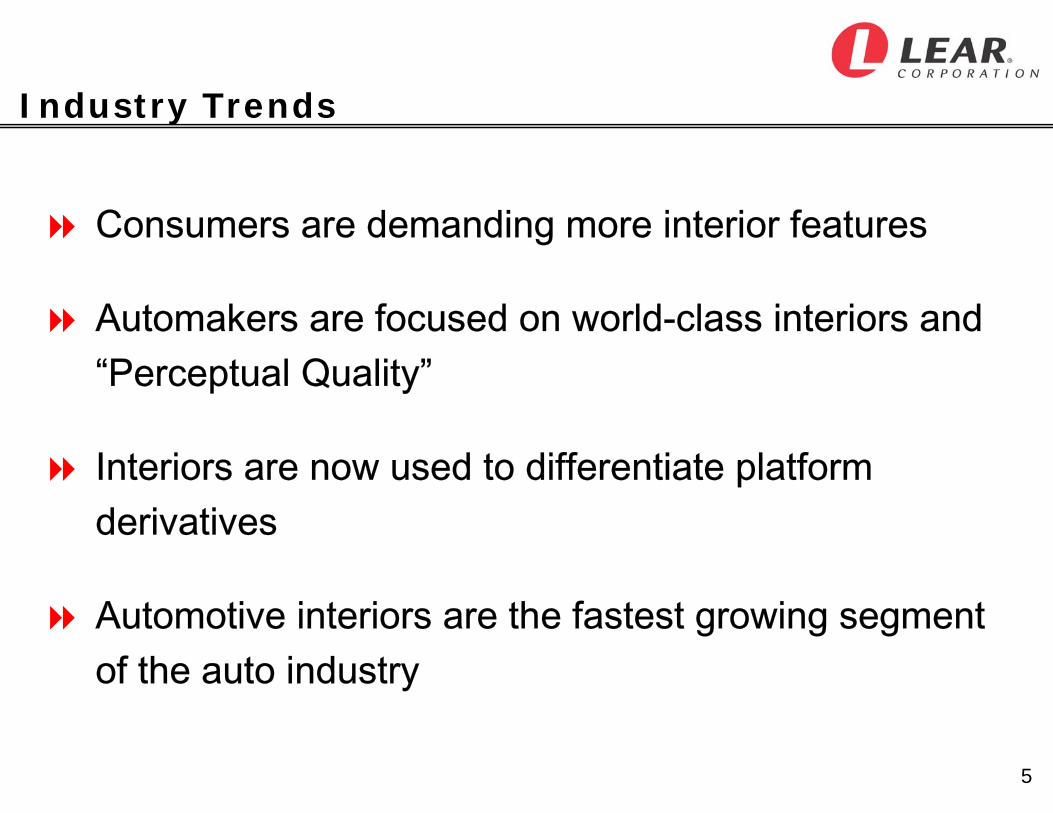
Industry Trends
Consumers are demanding more interior features
Automakers are focused on world-class interiors and “Perceptual Quality”
Interiors are now used to differentiate platform derivatives
Automotive interiors are the fastest growing segment of the auto industry

6
Reposition our business for
improved long-term profitability in North America
Improve our business
structure and grow our market share in Europe
Aggressively expand our presence in
Asia and with Asian OEMs
globally
Going Forward, We have a Focused Strategy to Grow Our Business Worldwide*
* Please see slide titled “Forward-Looking Statements” at the end of this presentation for further information.
Grow And Diversify Our Business WorldwideGrow And Diversify Our Business Worldwide* Please see slide titled “Forward-Looking Statements” at the end of this presentation for further information.

7
42%
65% 63%
58%
46%
2000 2001* 2002* 2003 2004
Net DebtNet Debt****
/Capital/Capital
We Have Strengthened Our Financial Position
* Includes ABS debt of $261 million in 2001 and $189 million in 2002 (implemented in 2001).
** Net debt represents total debt plus utilization of our ABS facility, less cash and cash equivalents. Please see slides titled “Use of Non-GAAP Financial Information” at the end of this presentation for further information.

8
We are Continuing to Diversify Our Sales Mix
Non-Traditional Big Three*
* Excludes affiliates of GM (other than Opel), Ford and DaimlerChrysler.
19%
46%
1994 2004
Presence In Asia Positions Us For Future GrowthPresence In Asia Positions Us For Future Growth
Recent Geographic Mix
North America55%
Europe39%
Rest of World 6%

9
Current Business Conditions
North American and European vehicle production down in the first half and for the full year
Adverse first quarter mix impact driven by sharp declines in high content platforms
Raw material prices, including steel and resin, negatively impacting earnings
Fierce global competition for market share
Significant Adverse Earnings Impact In First Half;Significant Adverse Earnings Impact In First Half;Improving Outlook For Balance Of 2005Improving Outlook For Balance Of 2005

10
2005 backlog up $150 million from last year on a comparable basis
Three-year backlog up $750 million from last year on a comparable basis
Interior and electronic / electrical represent 50% of the three-year backlog
European and Asian customers represent over half of the three-year backlog
Sales Backlog*
(in millions)Major New Business
Record Sales Backlog Supports Continued Growth
Record Net New Business Supports Continued Growth Record Net New Business Supports Continued Growth And Diversification Of SalesAnd Diversification Of Sales
* Please see slide titled “Forward-Looking Statements” at the end of this presentation for further information.
$1,550
$3,800
2005 2005 - 2007

11
Long-Term Outlook Remains Positive for Lear*
Near-term financial results severely depressed, reflecting transitional volume and cost factors
Strong three-year sales backlog of $3.8 billion
Platform mix to improve in 2006 with full-year benefit of major 2005 launches and introduction of GMT900
Global restructuring plan to improve long-term competitiveness
* Please see slide titled “Forward-Looking Statements” at the end of this presentation for further information.

12
In addition to the results reported in accordance with accounting principles generally accepted in the United States (“GAAP”) included throughout this presentation, the Company has provided information regarding “net debt,” a non-GAAP financial measure. Net debt represents total debt plus utilization under the Company’s ABS facility, less cash and cash equivalents.
Management believes that net debt provides useful information regarding the Company’s financial condition. Further, management uses net debt for planning and forecasting in future periods.
Net debt should not be considered in isolation or as a substitute for total debt or other balance sheet data prepared in accordance with GAAP. Also, net debt, as determined and presented by the Company, may not be comparable to related or similarly titled measures reported by other companies.
Set forth on the following slide is a reconciliation of net debt to total debt calculated and presented in accordance with GAAP.
Use of Non-GAAP Financial Information

13
(in millions)
Use of Non-GAAP Financial Information Net Debt
Note: Net Debt to Capital is defined as Net Debt divided by Net Debt plus Stockholders’ Equity.
Net debtShort-term borrowings $ 35.4 $ 17.1 $ 37.3 $ 63.2 $ 72.4Current portion of long-term debt 632.8 4.0 3.9 129.5 155.6Long-term debt 1,866.9 2,057.2 2,132.8 2,293.9 2,852.1Total debt 2,535.1 2,078.3 2,174.0 2,486.6 3,080.1Cash and cash equivalents ( 584.9 ) ( 169.3 ) ( 91.7 ) ( 87.6 ) ( 98.8 )Asset backed securitization - - 189.0 260.7 -Net debt $ 1,950.2 $ 1,909.0 $ 2,271.3 $ 2,659.7 $ 2,981.3
2003 2002 2001 2000December 31,
2004

14
This presentation contains forward-looking statements within the meaning of the Private Securities Litigation Reform Act of 1995, including statements regarding anticipated financial results. Actual results may differ materially from anticipated results as a result of certain risks and uncertainties, including but not limited to, general economic conditions in the markets in which the Company operates, fluctuations in the production of vehicles for which the Company is a supplier, labor disputes involving the Company or its significant customers or suppliers or that otherwise affect the Company, the Company’s ability to achieve cost reductions that offset or exceed customer-mandated selling price reductions, the outcome of customer productivity negotiations, the impact and timing of program launch costs, the costs and timing of facility closures, business realignment or similar actions, increases in the Company’s warranty or product liability costs, risks associated with conducting business in foreign countries, competitive conditions impacting the Company’s key customers, raw material cost and availability, the Company’s ability to mitigate the significant impact of recent increases in raw material, energy and commodity prices, the outcome of legal or regulatory proceedings to which the Company is or may become a party, unanticipated changes in cash flow and other risks described from time to time in the Company’s Securities and Exchange Commission filings.
This presentation also contains information on the Company’s sales backlog. The Company’s incremental sales backlog reflects: anticipated net sales from awarded new programs, less net sales from phased-out and cancelled programs. The calculation of backlog does not reflect customer price reductions on existing or newly awarded programs. The three-year backlog may be impacted by various assumptions embedded in the calculation, including vehicle production levels on new and replacement programs, foreign exchange rates and the timing of program launches.
The forward-looking statements in this presentation are made as of the date hereof, and the Company does not assume any obligation to update them.
Forward-Looking Statements