![ToyotaMethodsandBeyond - Management Roundtable, Inc.events.roundtable.com/Event_Center/Lean/LPD08/LeanPD2008.pdf · 2017-11-21 · SixSigma “[Theconference]provided anexcellentoverviewof](https://static.fdocuments.in/doc/165x107/5fa69f3965372f5f3b51f5eb/toyotamethodsandbeyond-management-roundtable-inc-2017-11-21-sixsigma-aoetheconferenceprovided.jpg)
Lean sixsigma
35
1 IW Best Plants Conference – April 24-25, 2007 – Indianapolis, IN Integrating Six Sigma and Lean Manufacturing The Challenges & Benefits Frank Garcia & Tom Lawton ADVENT DESIGN CORPORATION SIX SIGMA or LEAN MANUFACTURING Need to lower costs & reduce lead time? • Material flow is poor • Error rate is high • Can’t deliver ontime • Equipment too slow
description
Lean
Transcript of Lean sixsigma

1
IW Best Plants Conference – April 24-25, 2007 – Indianapolis, IN
Integrating Six Sigma and Lean Manufacturing
The Challenges & BenefitsFrank Garcia
&Tom Lawton
ADVENT DESIGN CORPORATION
SIX SIGMA or LEAN MANUFACTURING
Need to lower costs & reduce lead time?
• Material flow is poor• Error rate is high • Can’t deliver ontime• Equipment too slow

2
IW Best Plants Conference – April 24-25, 2007 – Indianapolis, IN
Six Sigma or Lean Manufacturing?
LEAN MANUFACTURING:
Reduce Lead Time by eliminating waste in the Value StreamProvides the Game Plan and Plays
SIX SIGMA:
Reduce process variationProvides the Play by Play Analysis and Instant Replay
Six Sigma or Lean Manufacturing?
LEAN MANUFACTURING: Flow Focused
Lean cannot bring a process under statistical control
SIX SIGMA: Problem Focused
Can not dramatically improve process speed or reduce invested capital
NEED BOTH!
3
IW Best Plants Conference – April 24-25, 2007 – Indianapolis, IN
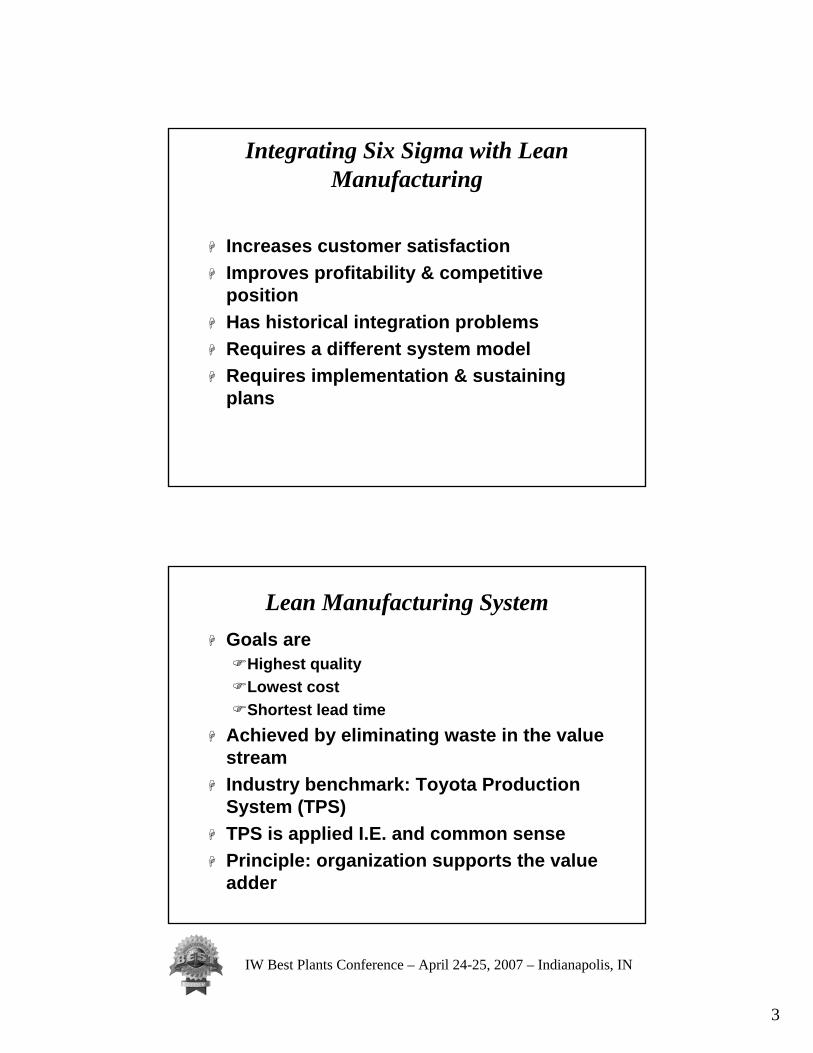
Integrating Six Sigma with Lean Manufacturing
Increases customer satisfactionImproves profitability & competitive positionHas historical integration problemsRequires a different system modelRequires implementation & sustaining plans
Lean Manufacturing SystemGoals are
Highest qualityLowest costShortest lead time
Achieved by eliminating waste in the value streamIndustry benchmark: Toyota Production System (TPS)TPS is applied I.E. and common sensePrinciple: organization supports the value adder
4
IW Best Plants Conference – April 24-25, 2007 – Indianapolis, IN
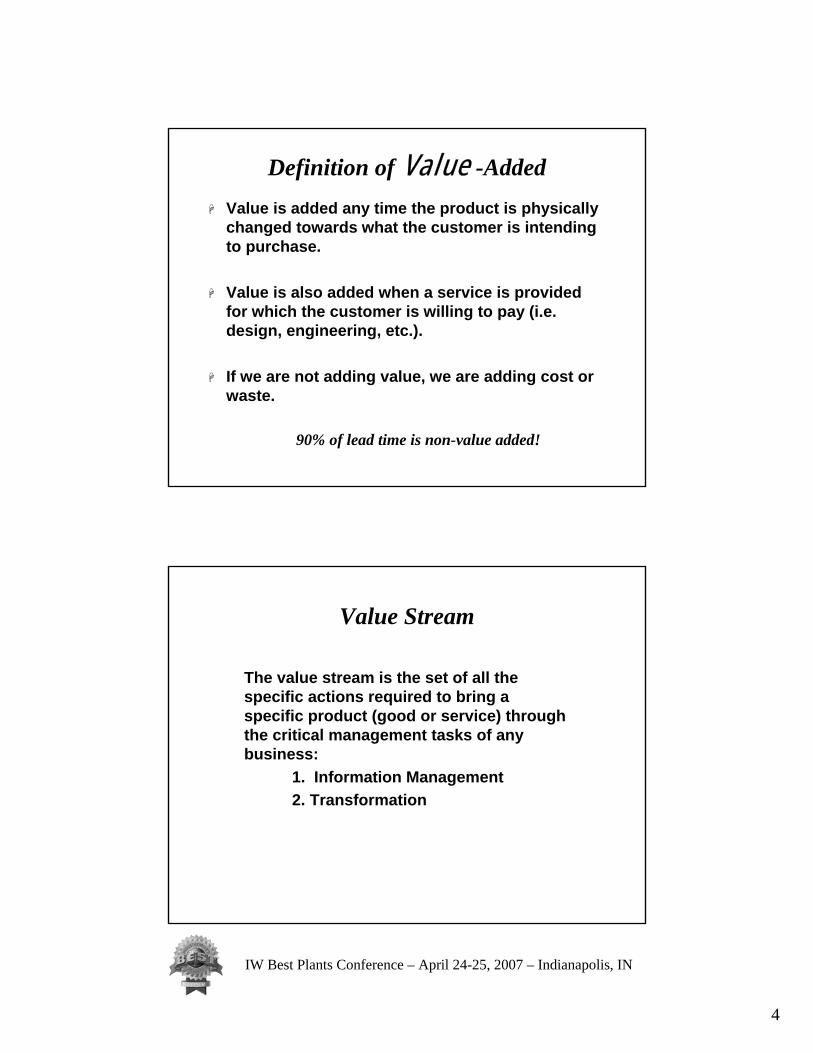
Definition of Value -AddedValue is added any time the product is physically changed towards what the customer is intending to purchase.
Value is also added when a service is provided for which the customer is willing to pay (i.e. design, engineering, etc.).
If we are not adding value, we are adding cost or waste.
90% of lead time is non-value added!
Value Stream
The value stream is the set of all the specific actions required to bring a specific product (good or service) through the critical management tasks of any business:
1. Information Management2. Transformation

5
IW Best Plants Conference – April 24-25, 2007 – Indianapolis, IN
The EIGHT Wastes
Inventory (more than one piece flow)Overproduction (more or sooner than needed)Correction (inspection and rework)Material MovementWaitingMotionNon-Value Added ProcessingUnderutilized People
Six Sigma System
A defined management process and CTQ goal (3.4 ppm) 3 sigma is 66,807 ppm!Driven from the topFocused on Voice of the CustomerA data analysis and problem solving methodologyStrong focus on variation reductionSupported by highly trained problem solvers

6
IW Best Plants Conference – April 24-25, 2007 – Indianapolis, IN
ScrapRework
WarrantyRejects
Uncovering Quality’s Hidden Costs
Lost Sales
Late Delivery
Engineering Change Orders
Long Cycle TimesExpediting Costs Excess Inventory
More Set-ups
Working Capital Allocations
Excessive MaterialOrders/Planning
Traditional(Tip of the Iceberg)
LostOpportunities
Additional Costs of Poor Quality
5 to 8 %15 to 20 %
Six Sigma Variation Reduction
Variation Reduction is Cost Reduction
Process Variation Should be Less Than Specs

7
IW Best Plants Conference – April 24-25, 2007 – Indianapolis, IN
Six Sigma’s (σ) Focus: Reducing Variance
“ You have heard us talk about span, the “evil” variance our customers feel in our responseto their requests for delivery, service or financing.”
A process mean tells us how the process is performing while the variance gives us an indication of process control.
Reducing the variance provides better control of the process.
What is Six Sigma (σ) Quality?Population mean (µ) or average One (1) σ represents
68% of the population
Two (2) σrepresents 95% of the population
Six (6) σrepresents 99.999997% of the populationWith 6 σ Quality, approximately 3.4 items in a
population of 1,000,000 items would be unacceptable.

8
IW Best Plants Conference – April 24-25, 2007 – Indianapolis, IN
Six Sigma System
20% margin improvement12 to 18% increase in capacity12% reduction in number of employees10 to 30% reduction in capital
Improving Profitability A 1 Sigma Improvement Yields…..
Source: Six Sigma - Harry & Schroeder
Six Sigma Financial Impact Areas:The Savings Categories
1. Cost Reduction (including cost at standard and costs not included in standard cost)
2. Cost Avoidance (can be difficult to document)
3. Inventory Reduction4. Revenue Enhancement5. Receivables Reduction

9
IW Best Plants Conference – April 24-25, 2007 – Indianapolis, IN
Six Sigma System
Customer centricity: What do they value?Financial resultsManagement engagement & involvementResource commitment: 1 to 3% of staff full timeExecution infrastructure: black & green belts, teams
A culture characterized by…..
Six Sigma Problem Solving Steps
Process
Define & MeasureValidate Data Collected
AnalyzeVital Few Factors For Root Causeof Problem
ImproveIdentify appropriate operating conditions
BreakthroughStrategy
Characterization
ControlSustain - Insure Results to Bottom Line
Optimization
10
IW Best Plants Conference – April 24-25, 2007 – Indianapolis, IN
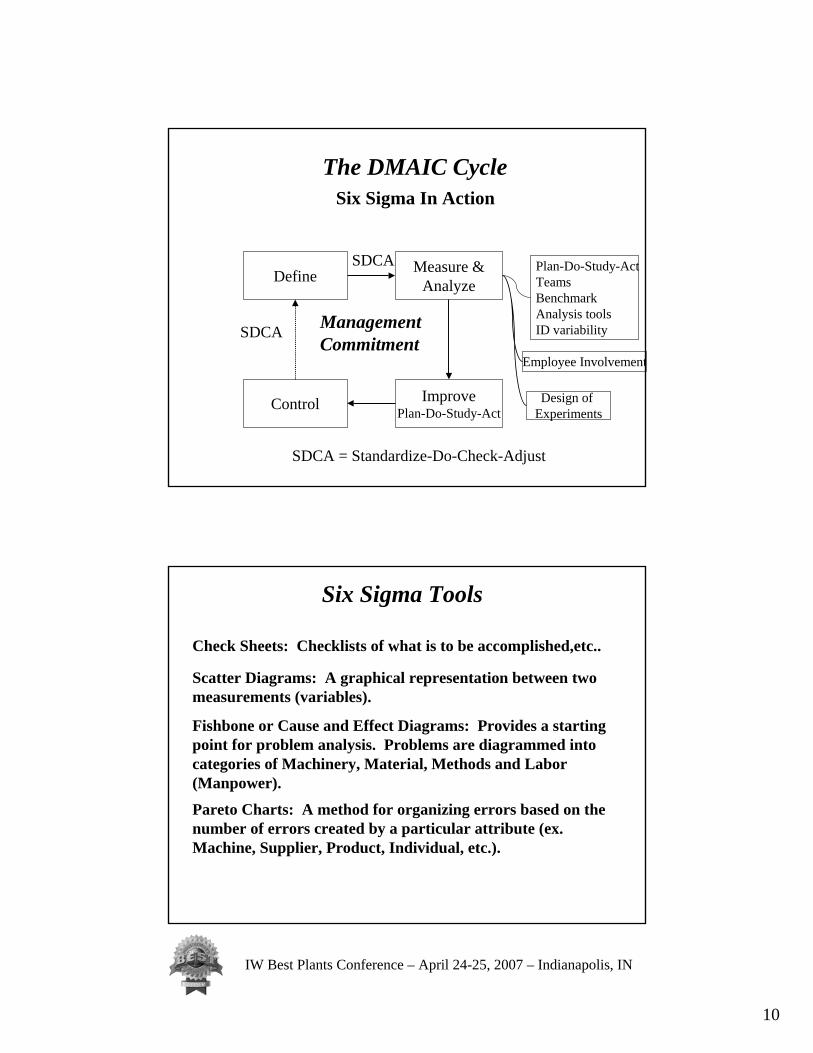
The DMAIC Cycle
Define
ImprovePlan-Do-Study-Act
Measure &Analyze
Control
Management Commitment
Plan-Do-Study-ActTeamsBenchmarkAnalysis toolsID variability
Employee Involvement
Design of Experiments
SDCA
SDCA
SDCA = Standardize-Do-Check-Adjust
Six Sigma In Action
Six Sigma Tools
Check Sheets: Checklists of what is to be accomplished,etc..
Scatter Diagrams: A graphical representation between two measurements (variables).
Fishbone or Cause and Effect Diagrams: Provides a starting point for problem analysis. Problems are diagrammed into categories of Machinery, Material, Methods and Labor (Manpower).
Pareto Charts: A method for organizing errors based on the number of errors created by a particular attribute (ex. Machine, Supplier, Product, Individual, etc.).

11
IW Best Plants Conference – April 24-25, 2007 – Indianapolis, IN
Six Sigma Tools
Process Maps or Flowcharts: Graphical representation of a process or system showing process or product transformation. In other words, what is being done, by who and what choices are being made.
Ideally process maps should include cycle times, defect information, etc.
FMEA’s (Potential Failure Mode and Effects Analysis): A detailed document which identifies ways in which a process or product can fail to meet critical requirements.
X-Y Matrix: A ranking method used to prioritize process inputs (X’s) to process outputs (Y’s).
Six Sigma Tools - Process Maps or Flowcharts
What are the X’s (Input variables) at each process step?
What are the Y’s (Output Variables) at each process step?
Remember Y = f (x)Remember Valued Added versus Non-Value Added
Remember Cycle Times and Defects

12
IW Best Plants Conference – April 24-25, 2007 – Indianapolis, IN
Traditional Six Sigma Implementation- Who is Involved
Senior Management
Master Black Belts
Technical Trainers, Mentors:
Full-Time Commitment
Black Belts
Project Leaders-Full-Time
Commitment
Green BeltsProject Leaders-
Part-Time Commitment
Champions and LeadersProvides direction, removes obstacles, reviews progress
The Bad News:Six Sigma Program: Implementation Issues
Some of the facts:
80% of Six Sigma Implementations fail.
Traditional Six Sigma implementations have largely been attempted at large Fortune 500 Companies due to the large investment in people, training and overall support.
Training costs alone for a “wave” of 25 people can cost $250,000 for this 4 to 6 month training period. Training costs and personnel requirements can overwhelm many smaller organizations.

13
IW Best Plants Conference – April 24-25, 2007 – Indianapolis, IN
Need for Six Sigma & Lean
Quality, Warranty, and CostCustomers Require Six SigmaCustomers Require Lean ManufacturingCompetitors are implementing Lean & Six SigmaStaying in business
External - Satisfying Customers…..
Need for Six Sigma & Lean
Operational Cost ReductionImprove ProductivityReduce Scrap and ReworkReduce Inventory & WIP
Engineering Design Cost Reduction Define-Measure-Analyze-Design-Verify (DMADV)
Stabilize & Quantify Process CapabilityInput for Product and Design Process
Internal - Improving Profitability through…..

14
IW Best Plants Conference – April 24-25, 2007 – Indianapolis, IN
You Can Apply Six Sigma Techniques to Complement Existing Lean Capabilities
Lean Training & Implementation
VSM
Inventory Reduction & Control
Waste Reduction
Process variation
Six SigmaAnalysis, Problem Solving &Training
Supply Chain Management
LeanTechniques
Lean Six Sigma Implementation
Only Six Sigma or Lean Implemented - big $ savings but money left on the tableSeparate Six Sigma & Lean initiatives competing for best resourcesDifficulty in sustaining the gain
Historical Implementation Problems

15
IW Best Plants Conference – April 24-25, 2007 – Indianapolis, IN
Lean Six Sigma Implementation
Need to implement in the correct orderPolicy deployment to align business objectives (Flow, Waste & Variation Reduction)Focus on shop floor results, not class room skillsExperienced teachers & coachesStandardized work to institutionalize the gains
Some Solutions…….
The Lean Six Sigma Strategy
Lean 6σ is a CHANGE STRATEGY for accelerating improvements in processes, products, and services to improve a company’s performance leading to improved financial performance and competitiveness of the organization.
Goals:
Improved Customer SatisfactionIncreased ProfitsImproved Process Capability by Reducing VarianceIncreased Market ShareSupport Continuous ImprovementSustained Gains for Completed Projects

16
IW Best Plants Conference – April 24-25, 2007 – Indianapolis, IN
Lean and the 6 σ Structure
LEAN Manufacturing Practices
Problem Solving
Yellow and Green Belt
Black Belt
M.B.B
Problem Solving Team Members
Waste reduction and Continuous Improvement
Functional 6Sigma Team Member. Familiar with tools
Problem solver, assists Black Belt. Working Knowledge of tools
Problem solver,Proficient with tools
Problem solver, Teacher, Mentor. Expert in use of the tools
FULL TIME COMMITMENT
25-50%
Training Costs- up to $2,500 Week (excludes lodging, travel and salary)
Why Not Rent a Belt (Black, Yellow or Green) Pay for only What You Need to Solve Real Business
Problems?
Easier for Small Business to JustifyFocused on Solving Companies’ ProblemsJoint Problem Solving and Knowledge/Skill TransferEasier to Meet Customer Mandates to Use Lean Six Sigma TechniquesProvides Evolutionary Approach to Lean/Six Sigma Implementation and Training

17
IW Best Plants Conference – April 24-25, 2007 – Indianapolis, IN
How Do We Use Lean Six Sigma TechniquesGet Management commitmentAssess the operation & understand the Process using a Value Stream Map (Product families & Production data)
Identify lean improvements & kaizenswithout automation Implement lean improvements using VSM planIdentify processes requiring Six Sigma analysisAnalyze, eliminate, and control variationStart the cycle again!
The Lean Six Sigma Cycle
Commitment &Assessment
ImplementationPlan
RecommendedSolutions
DO IT!
Continuous Improvement
Set UpLayoutCellsVisual
Variation Reduction
Information Systems
VSM
18
IW Best Plants Conference – April 24-25, 2007 – Indianapolis, IN
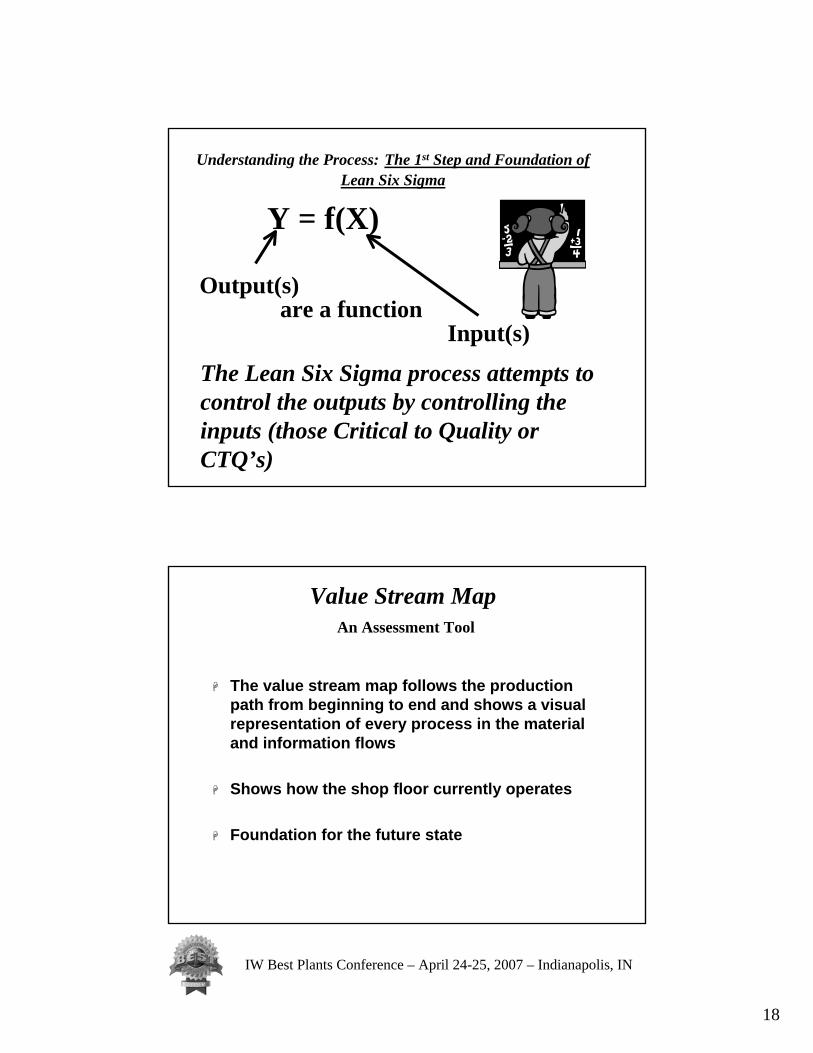
Understanding the Process: The 1st Step and Foundation of Lean Six Sigma
Y = f(X)
Output(s)are a function
Input(s)
The Lean Six Sigma process attempts to control the outputs by controlling the inputs (those Critical to Quality or CTQ’s)
The value stream map follows the production path from beginning to end and shows a visual representation of every process in the material and information flows
Shows how the shop floor currently operates
Foundation for the future state
Value Stream MapAn Assessment Tool

19
IW Best Plants Conference – April 24-25, 2007 – Indianapolis, IN
Using the Value Stream Mapping Tool
product family
current state drawing
future state drawing
plan and implementation
Understanding how the shop floorcurrently operates. The foundationfor the future state.
Designing a lean flow
CustomersSuppliers
File: VSM-A1
ProductionControl
I
Process
RawMaterials
FinishedGoods
Equipment
CycleTimesChangeOverReliabilityError Rate
LeadTime
Value Stream Map Concept
I
OrdersOrders
Schedules

20
IW Best Plants Conference – April 24-25, 2007 – Indianapolis, IN
Soak & Dry Packaging Labeling Case PackingCartoning Shipping
I I I I I I
C/T = 25 - 65 min.C/O = 10 min.Rel. = 100%
C/T = 1 sec.C/O = 5 min.Rel. = 85%
C/T = 3 sec.C/O = 2 min.Rel. = 80%
C/T = 1 sec.C/O = N/ARel. = 100%
C/T = 2 sec.C/O = N/ARel. = 100%
up to250
stonesin WIP
0 01 Operator 1/2 Operator1 Operator 1 Operator1/2 Operator125 Cans of Oil20,640 Round Stones49,000 Shaped Stones
4290Stones
90,504Stones
VariousCustomers
Andrea Aromatics(Scented Oils)
New JerseyPorcelain
(Round Stones)
Alanx(Shaped Stones)
30 Cans of OilEvery 2 Weeks
59,000 StonesEvery 2 Weeks
50,000+ StonesEvery 2 Months
(via stringer)
Average of 6,000Stones per Dayin Various SizeOrders (8 to 20 case& 200 to 400 caserange mainly)
Production Control Randomly PlacedOrders (Various Sizes)
Orders Every 2 Weeks
Order as Needed
Bi-WeeklyProduction Schedule
Daily ShippingOrders
11.6 Days
65 min.
0.7 Days
7 seconds
15.1 days 27.4 Days Lead Time
65 minutes, 7 secondsValue-Added Time
Value Stream Map (Current State)
DailyShipments
Existing Work Cell
AmeripackFlow Packager
APAIAutomatic
Stapler
Manual ManualMultipleBatch Tanks
Soak & Dry Packaging Labeling Case PackingCartoning Shipping
I I I I I
C/T = 25 - 65 min.C/O = 10 min.Rel. = 100%
C/T = 1 sec.C/O = 5 min.Rel. = 85%
C/T = 3 sec.C/O = 2 min.Rel. = 80%
C/T = 1 sec.C/O = N/ARel. = 100%
C/T = 2 sec.C/O = N/ARel. = 100%
up to250
stonesin WIP
0 01 Operator 1/2 Operator1 Operator 1 Operator1/2 Operator75 Cans of Oil40,000 Round Stones25,000 Shaped Stones
4290Stones
30,000Stonesin a supermarkettype arrangementwith stocking levelsby shape and scent
VariousCustomers
Andrea Aromatics(Scented Oils)
New JerseyPorcelain
(Round Stones)
Alanx(Shaped Stones)
12 to 16 Cansof Oil Once a
Week
30,000 StonesOnce a Week
25,000 StonesOnce a Month(via stringer)
Average of 6,000Stones per Dayin Various SizeOrders (8 to 20 case& 200 to 400 caserange mainly)
Production Control Randomly PlacedOrders (Various Sizes)
Orders Every Week
Monthly Order
Bi-WeeklyProduction Schedule(large orders)
Daily ShippingOrders
10.8 Days
65 min.
0.7 Days
7 seconds
5.0 days 16.5 Days Lead Time
65 minutes, 7 secondsValue-Added Time
Value Stream Map (Future State)
DailyShipments
Existing Work Cell
AmeripackFlow Packager
APAIAutomatic
Stapler
Manual ManualMultipleBatch Tanks
4 Cases
IncreaseReliability

21
IW Best Plants Conference – April 24-25, 2007 – Indianapolis, IN
Questions to Ask About the Value Stream
Is the step valuable?Is the step capable? Is the step available? Is the step adequate (capacity)?Is the step flexible?
Lean ManufacturingConcepts & Techniques
Flow: Setup Reduction, Cellular Manufacturing, Batch Size Reduction, Visual Workplace, Layout
Pull: Kanban Systems, Supply Chain Management, Point of Use
Perfection: Quality Systems including variation reduction, Training
22
IW Best Plants Conference – April 24-25, 2007 – Indianapolis, IN
Road Map to Lean Six Sigma
Stamping DegreasingDrying
Packing Shipping
I I I I
Run: 200-600pcs/minC/T = .003 min/pc.
C/O = 4.5 hrs.
Available: 590 min/shiftRel. = 90%
C/T =10 hrC/O = NoneRel. = 80%
2 Hours
1 Operator Shipper
50 to 70Racks
100 to 125Coils
20 to 40 Bins 1 Dayto
12 Weeks
VariousCustomers
Brass (40%)
4 Weeks LT
Beryllium Copper (30%)
6 Mos. LTIn Stock- 1 Week
Phosphor Bronze(30%)
10 Week LT6 Weeks Reroll
Every Week Every Week Every Week
Average of 1 mm pcs per dayin Various SizesOrders (2 to 13)
Omega PrecisionProduction ControlVista S oftware S ystem
Randomly PlacedOrders (Various Sizes)
Projected requirements
Order as Needed
Weekly ProductionSchedule Pressroom
Manager
Weekly ShippingList
10 Days
1.5day(avg)
2 Days
2.25 Days
1 Day to 12 Weeks 16.75 Days Lead Time+ coil lead time per average order3.75 Days ValueAdded Time
Value Stream Map (Current State) Stamping Orders With No Plating or Heat Treatment
(Potential Future State Changes in Red)
DailyShipments
1 unit
Manual 11 Stamping Presses
6 Operators
10 to 24 coils3 times /week
Average order = 208,000 pcs252,000 strokes
Standard Timefor Setup
AdjustmentSetupTime
Visual Statusof Presses
SankyoCoil Feeds
ReduceCycle Time
Layout isa Problem
AutoBagging
FormalProduction
Control
Single Pointof Control
2 Baskets - Strip1 Basket - Pieces
C/T = 2 Hr Strips Max 1000/Basket Min 200/Basket = 30 Min Pcs. 25,000 Pcs/BasketC/O = NoneRel. = 95%
Combine?•Lot Control Improvement
•Handling Reduction
Review WorkSchedule with
Suppliers
Pre-Control forRoll Changes
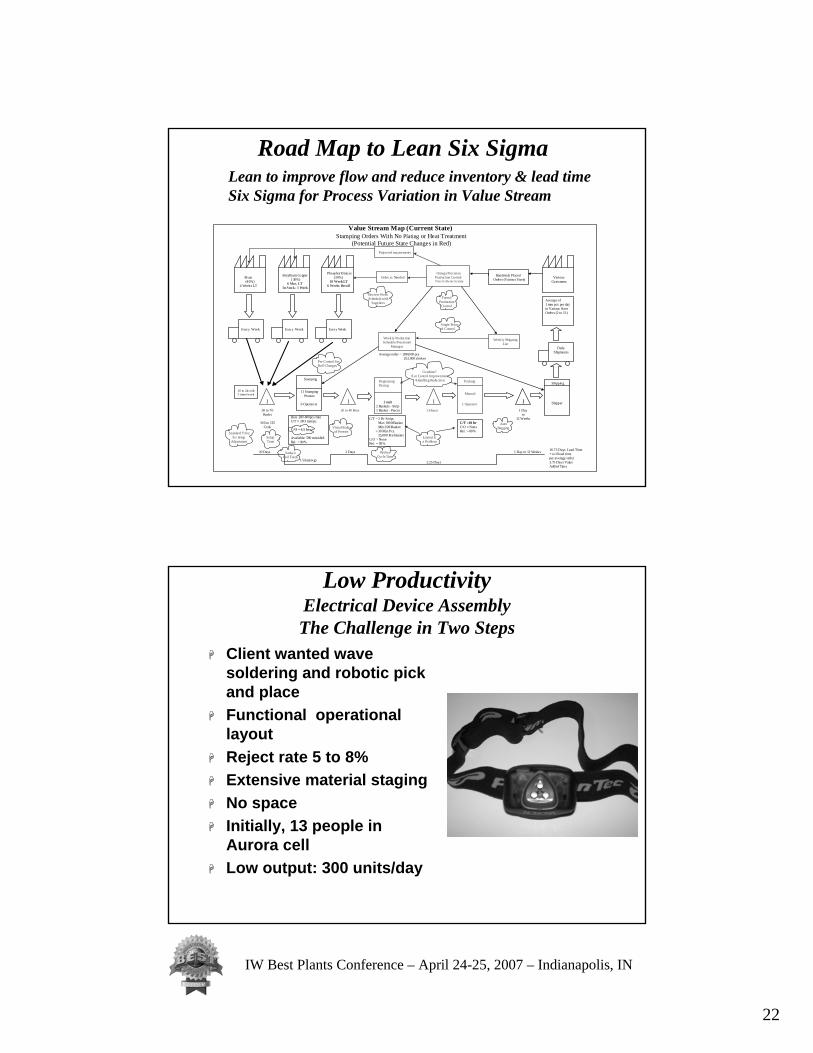
Lean to improve flow and reduce inventory & lead timeSix Sigma for Process Variation in Value Stream
Low Productivity Electrical Device AssemblyThe Challenge in Two Steps
Client wanted wave soldering and robotic pick and placeFunctional operational layoutReject rate 5 to 8%Extensive material stagingNo spaceInitially, 13 people in Aurora cellLow output: 300 units/day
23
IW Best Plants Conference – April 24-25, 2007 – Indianapolis, IN
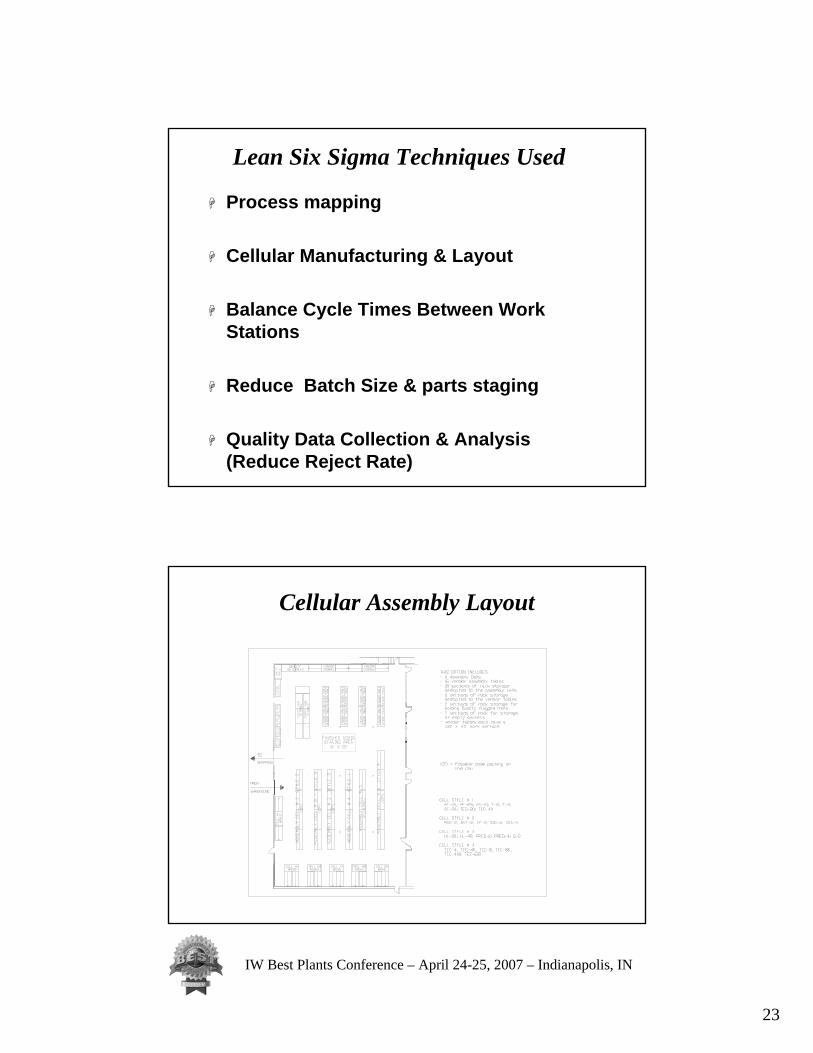
Lean Six Sigma Techniques Used
Process mapping
Cellular Manufacturing & Layout
Balance Cycle Times Between Work Stations
Reduce Batch Size & parts staging
Quality Data Collection & Analysis (Reduce Reject Rate)
Cellular Assembly Layout

24
IW Best Plants Conference – April 24-25, 2007 – Indianapolis, IN
Cell ChangesLED
SOLDER& CUT
LEDPLACEMENT
TESTPCBs
ASSEMBLY#1
COLD STAKETEST PCBs
CONTACTSASSEMBLY
&SOLDER
BUTTON &BATTERY
ASSEMBLYLABEL
ATTACHBACK
COVER,STAKE
STRAP &ATTACHSTRAP
TESTSAMPLES
GLUESWITCH/ATTACHSTRAP
PACK
REJECTDATA
WORKSTATION CYCLE TIME: 25sec., 1.25 min. PER 3 UNITS
LEDSOLDER& CUT
INSERTSWITCH
ACTIVATOR
REJECTDATA
ASSIST
1
2
3
4 5 6 7 8 9
ASSEMBLY#1
COLD STAKETEST PCBs
CONTACTSASSEMBLY
&SOLDER
BUTTON &BATTERY
ASSEMBLYLABEL
ATTACHBACK
COVER,STAKE
STRAP &ATTACHSTRAP
TESTSAMPLES
GLUESWITCH/ATTACHSTRAP
PACK
REJECTDATA
AFTER CHANGES WORKSTATION CYCLE TIME: 25sec., 1.25 min. PER 3 UNITS
PCBs fromsupplier
INSERTSWITCH
ACTIVATOR
REJECTDATA
1 2 3 4 5 6
Lean Six Sigma Changes
Cold staking fixtures
Powered screw drivers
Light test & Soldering fixtures
Quality data tracking via % defect control chart (p chart)

25
IW Best Plants Conference – April 24-25, 2007 – Indianapolis, IN
With Lean Six SigmaThe Results
Balanced cell at 24 sec per work stationTwo U-shaped cells3 piece flow1000 units/day per cell vs3006 people per cell vs 13Faster identification of quality problemsOperating at 5 to 6 sigmaBetter teamworkNo backlog
Reducing WIP & Improving Quality Wire Extrusion & Finishing
The Challenge
Client wanted to reduce WIP Reduce extrusion rejects (7% of footage)Eliminate material flow problemsImprove data collection and analysis

26
IW Best Plants Conference – April 24-25, 2007 – Indianapolis, IN
Lean Six Sigma Techniques Used
Value Stream Mapping
Cellular Manufacturing & Layout
Kanban Trigger Board
5S
Quality Data Collection & Analysis (Reduce Extrusion Reject Rate)
With Lean Six SigmaThe Results
50% reduction in raw material inventory60% reduction in raw material storage areaDoubling production output in same floor areaEliminating one production shiftBetter teamworkReducing extrusion reject rate to <1%

27
IW Best Plants Conference – April 24-25, 2007 – Indianapolis, IN
Reducing Lead Time & Improving Quality Steel Panel Fabrication
The Challenge
Client wanted to reduce lead time to less than one weekAutomated equipment had been installed but had problemsPanel rejects & rework (5%)Material flow problemsFew process controls or data collection
Shear Notch Corner Punch Stake & LabelBend Shipping
I
C/T = 4 min. C/O = N/ARel. = 99%
C/T = 2 min. C/O = 4 minRel. = 95%
C/T = 2 min.C/O = up to
30 min.Rel. = 99%
C/T = 2 min.C/O = N/A Rel. = 99%
C/T = 5 min.C/O = 30 to
60 sec.Rel. = 90%
1 Operator 1/2 Operator1 Operator 2 Operators1/2 Operator
Various Distributors(~ 24 for Smith Corp. &~ 6 for Jones Systems
Sheet GalvanizedSteel (4’ by 8’ or cut)
Up to an averageof 130,000 lbsdaily in peak
season
Production Control(normally working
24 to 48 hours ahead of
promised shipment)
Randomly PlacedOrders (normallysingle unit orders)
Blanket Annual PurchaseOrder with Daily Releases
2 to 5 days
4 min.
2 to 5 Working Days,Lead Time
32 minutes,Value-Added Time
Value Stream Map (Current State)
DailyShipments
1/2 Operator
Add Z Brace
C/T = 7 min.C/O = N/ARel. = 98% to
99%
1/2 Operator
2 min. 2 min. 5 min. 2 min. 7 min.
DailyProduction
Reports
DailyShippingSchedule
Rack
1 MaterialHandler
DailyProduction
Reports
Average volume of 1000systems per month in peakseason.Customers are mainlydistributors. There are afew dealers.
C/T = N/AC/O = N/ARel. = 100%
Radius & Band
C/T = 8 min.(average)
C/O = 2 to 30min.
Rel. = 80% to 100%
2 Operators
8 min.
Sheet GalvanizedSteel (4’ by 8’ or cut)
Sheet GalvanizedSteel (4’ by 8’ or cut)
Sheet GalvanizedSteel (4’ by 8’ or cut)
2 to 5 daysdependingon pre-cut
size
1 AccurshearAutomatedShear (P-3)
1 ManualNotcher (S-23)& 1 AutomatedNotcher (R-3)
3 Semi-AutoPunches
(S-1, S-2, & S-3)
1 ManualBrake (R-7)
& 1 AutomatedBrake (R-13)
1 AutomatedMachine (R-8)
1 AutomatedMachine (ACR)
1 Manual Table,1 Jig-less
Machine (R12),& 1 Jig Machine
(R1)
Specialty Punch
C/T = 2 min.C/O = N/ARel. = 99%
0 Operators
2 min.
4 Semi-AutoPunches
In StraightPanel Dept.

28
IW Best Plants Conference – April 24-25, 2007 – Indianapolis, IN
Lean & Six Sigma Techniques Used
Value Stream Mapping
Process flow diagrams
Setup time Analysis
Quality Data Collection & Analysis (Reduce Reject Rate & Variability)
Rack
1 MaterialHandler
C/T = N/AC/O = N/ARel. = 100%
Radius & Band
C/T = 8 min.(average)
C/O = 2 to 30min.
Reject rate = 5%Rel. = 80%
to 100%
2 Operators
8 min.
1 Manual Table,1 Jig-less
Machine (R12),& 1 Jig Machine
(R1)
Improve reliability and changeovercapability of R1 and R12 machines.Reduce panel reject rate.
Work to 1 to 2 days lead time
INITIAL IMPROVEMENT CONCEPTS
2 to 5 Working Days,Lead Time

29
IW Best Plants Conference – April 24-25, 2007 – Indianapolis, IN
6 Foot Long Custom Radius Panel Fabrication
Partially finished panels are stocked insixteen different configurations. Panelsare finished to order. Work is done inthree different areas as noted.
RawMaterial Stock
14 Ga. Galvanized Steel(pre-cut 53-15/16” by 6’3-15/16” sheets)
Notch& Punch(TrumpfMachine)
Ship
Bend& Stake
Add Z Brace(s)(if required)
Label
Radius& Band
(R12 - JiglessMachine)WIP Stock
16 Different Panelswith Various Cutouts
Trumpf Area
Custom Panel Dept.
Straight Panel Dept.
PanelMaterial
Rack
RawMaterial Stock
11 Ga. Galvanized Steel(4’ by 8’ standard sheets)
Shear& Cut
BandMaterial
DON'T MEETCURVATURETEMPLATE
REQUIREMENTS ATSETUP
(4' & 6' RADIUSPANELS)
OPERATORS MEASUREMENT
EQUIPMENT
MATERIAL(PANELS, STEEL)
NO SPECS
SET UP VALUESCHANGE
MAINTENANCECHANGESSETTINGS
OPEATORPREFERENCE
NO TRUST ANGLES
SEGMENTLENGTH
LOCATION PANEL OFSPECIALTY PUNCHES
ON PANEL
NO SPECSPUNCHLOCATION
VARIES
STRAIGHT PANEL
DIFFERENTSTEEL PROPERTIES
GALVINIZED COATINGDIFFERENT ON
PANELS
SURFACE FINISHVARIES
YIELD STRENGTH VARIES
PLATETHICKNESS
VARIES HOT VS COLD ROLL
COATINGVARIES
NO SPECS
PANEL NOTCH POSITIONVARIES
MOUNTINGWRONG
POOR TRANSDUCERSELECTION
INDEXES VARY
CRUDE INDEXSYSTEM DESIGN
AIR CYLINDEROPPOSING
HYDRAULIC INHEAD
ASSEMBLY
NOTCH O.D.SPACING VARIES.09 IN
AIR PRESSURE LOW
MAINTENANCE
BADBEARINGSON LOWERFORMING
TOOL
POOR MAINT
RADIUS VARIESSIDE TO SIDE
NO SPECS 3 SUPPLIERS
DIFFERENTEQUIPMENT
USED
UNDERSTANDING ROOT CAUSES of R12 PROBLEMSCAUSE AND EFFECT DIAGRAM
Red = Most Important Causes
NO SPECS
NO DIMENSIONAL SPECS OR TOLERANCES
RADIUS TEMPLATEACCURACY
DIFFERENTMEASURES USED ON
R1 & R12
DIFFERENT SETUPPROCEDURES
OPERATORJUDGEMENT RADIUS
USE OF AIR vs.HYDRAULICS
SPECIALTY PUNCH
WIDTH OF STEEL BETWEENNOTCHES VARIES 3.75 to 4.0 in.
ACROSS RADIUS
3 SUPPLIERS
3 SUPPLIERS
INDEXES VARY
PANEL WIDTH VARIES
SHEET DIMENSIONSVARY
PANELS CATCH ATLAST 2 BENDS
CONVEYOR NOTADJUSTED
PANEL NOTSQUARE. wIDTH
TOO LARGE
PANELSQUARENESS
DIGITAL READOUTUSELESS
BACKING SHOEADJ.USTMENT.
BANDS HAVECAMBER
3 SUPPLIERS
INACCURATECUTTING

30
IW Best Plants Conference – April 24-25, 2007 – Indianapolis, IN
Process ImprovementsSeparating Process & Machine Issues
Common setup procedureReplace measurement gagesEstablished process capabilityImplemented process controls for panel dimensionsIdentified realtime data requirementsCompleted identified maintenance actionsImplemented PM program
Why Lean Automation?
“After implementing lean improvements such as cellular
manufacturing and setup reduction, selective automation can add value
and reduce human variability.”
Richard Schonberger, June 2002
31
IW Best Plants Conference – April 24-25, 2007 – Indianapolis, IN
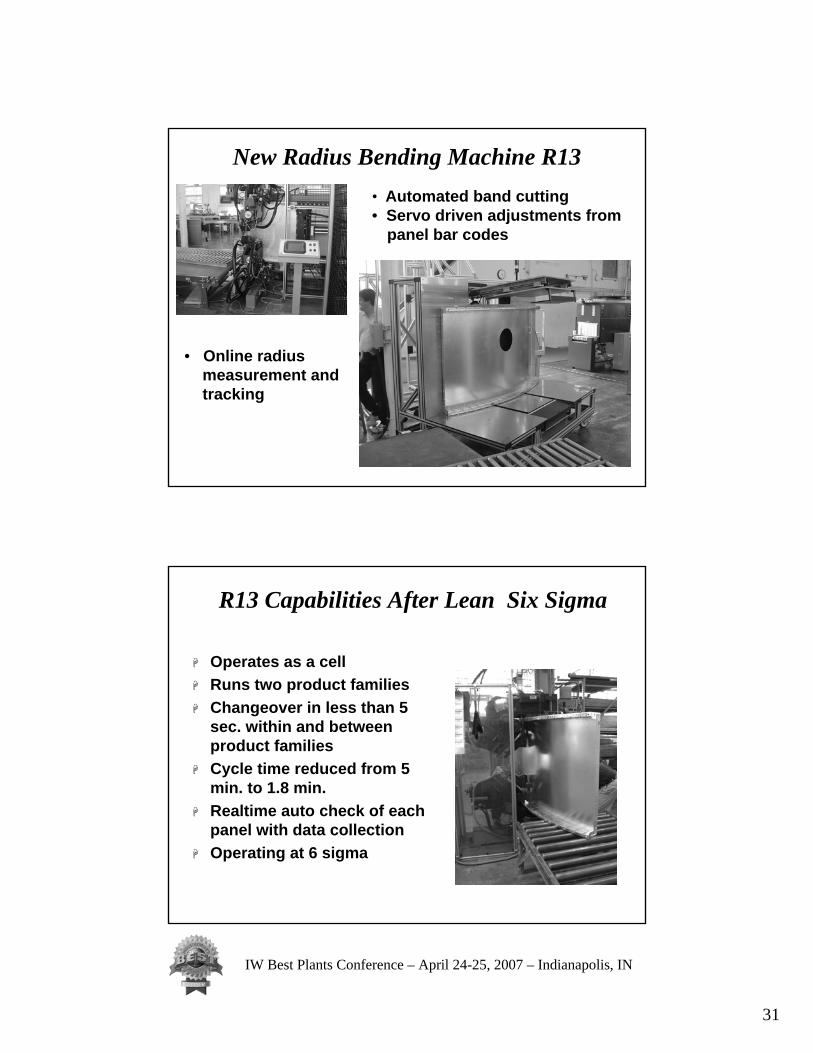
New Radius Bending Machine R13• Automated band cutting• Servo driven adjustments from
panel bar codes
• Online radius measurement and tracking
R13 Capabilities After Lean Six Sigma
Operates as a cellRuns two product familiesChangeover in less than 5 sec. within and between product familiesCycle time reduced from 5 min. to 1.8 min.Realtime auto check of each panel with data collectionOperating at 6 sigma

32
IW Best Plants Conference – April 24-25, 2007 – Indianapolis, IN
As lead time decreases…………..
the need for realtime data increases!
Lean Six Sigma in the Fast Lane!
Automation Provides Realtime Data to Control Variation for Six Sigma
Enhances Define-Measure-Analyze-Improve-Control methodology (DMAIC)
Online measurement of process parameters
Direct data input into control charts
Provide realtime controls as control limits are understood
Process Control

33
IW Best Plants Conference – April 24-25, 2007 – Indianapolis, IN
R13 Process Controls & System Status
Realtime Data Collection for Six Sigma Analysis
Diagnostics for Rapid Identification of Problems
Realtime Data From R13Index Count V2022
Target Chord Height V2030
Top Chord Height V2046
Bot. Chord Height V2066
Delta Top / Bot. V2032
Top Dev. V2050
Bot. Dev. V2070
Bend Angle Offset V1610
Bend Angle Factor V1612
Bend Factor Top V1614
Bend Factor Bot. V1616
Panel Radius (Feet) V1706
Panel Length (Inches) V1710
Cycle Time V2014 Remarks
Template Dev. Top
Template Dev. Bot.
31 14.051 14.089 14.118 0.029 0.039 0.067 0.000 1.325 0.797 0.921 4.000 75.375 131.2
1 14.051 14.593 14.898 0.305 0.543 0.848 0.000 1.325 0.795 0.951 4.000 75.375 139.5 formula2 14.051 14.089 13.947 0.142 0.039 -0.104 0.000 1.325 0.781 0.880 4.000 75.375 132.9 general, using values from 3'R3 14.051 14.008 13.748 0.259 -0.043 -0.302 0.000 1.325 0.781 0.880 4.000 75.375 131.74 14.051 14.014 13.803 0.211 -0.036 -0.248 0.000 1.325 0.781 0.880 4.000 75.375 131.65 14.051 13.960 13.652 0.307 -0.091 -0.398 0.000 1.325 0.781 0.885 4.000 75.375 132.46 14.051 14.055 13.844 0.211 0.005 -0.207 0.000 1.325 0.781 0.900 4.000 75.375 132.07 14.051 13.824 13.817 0.007 -0.227 -0.234 0.000 1.325 0.781 0.905 4.000 75.375 132.38 14.051 13.796 13.824 0.027 -0.254 -0.227 0.000 1.325 0.781 0.910 4.000 75.375 132.09 14.051 13.926 13.974 0.048 -0.125 -0.077 0.000 1.325 0.790 0.920 4.000 75.375 131.6
10 14.051 14.001 13.967 0.033 -0.050 -0.083 0.000 1.325 0.795 0.920 4.000 75.375 132.311 14.051 13.980 13.967 0.013 -0.070 -0.083 0.000 1.325 0.795 0.920 4.000 75.375 131.112 14.051 14.014 14.063 0.049 -0.036 0.013 0.000 1.325 0.795 0.920 4.000 75.375 131.313 14.051 13.980 13.960 0.020 -0.070 -0.090 0.000 1.325 0.795 0.920 4.000 75.375 130.914 14.051 14.137 14.214 0.077 0.086 0.163 0.000 1.325 0.800 0.925 4.000 75.375 132.615 14.051 14.117 14.173 0.056 0.066 0.122 0.000 1.325 0.800 0.925 4.000 75.375 129.216 14.051 14.137 14.152 0.015 0.086 0.102 0.000 1.325 0.800 0.925 4.000 75.375 131.017 14.051 14.103 14.118 0.015 0.052 0.067 0.000 1.325 0.798 0.922 4.000 75.375 133.018 14.051 14.089 14.097 0.008 0.039 0.047 0.000 1.325 0.798 0.922 4.000 75.375 131.419 14.051 14.178 14.104 0.074 0.127 0.054 0.000 1.325 0.798 0.922 4.000 75.375 131.020 14.051 14.144 14.173 0.029 0.093 0.122 0.000 1.325 0.797 0.921 4.000 75.375 132.621 14.051 14.130 14.104 0.026 0.079 0.054 0.000 1.325 0.797 0.921 4.000 75.375 131.022 14.051 14.076 14.097 0.022 0.025 0.047 0.000 1.325 0.797 0.921 4.000 75.375 130.923 14.051 14.123 14.070 0.053 0.073 0.019 0.000 1.325 0.797 0.921 4.000 75.375 3.924 14.051 14.069 14.043 0.026 0.018 -0.008 0.000 1.325 0.797 0.921 4.000 75.375 136.525 14.051 14.089 14.070 0.019 0.039 0.019 0.000 1.325 0.797 0.921 4.000 75.375 0.026 14.051 14.089 14.104 0.015 0.039 0.054 0.000 1.325 0.797 0.921 4.000 75.375 131.6 bands from stock, COE belt broken27 14.051 14.096 14.022 0.074 0.045 -0.029 0.000 1.325 0.797 0.921 4.000 75.375 136.928 14.051 14.089 14.097 0.008 0.039 0.047 0.000 1.325 0.797 0.921 4.000 75.375 131.329 14.051 14.082 14.111 0.029 0.032 0.060 0.000 1.325 0.797 0.921 4.000 75.375 131.230 14.051 14.117 14.152 0.036 0.066 0.102 0.000 1.325 0.797 0.921 4.000 75.375 131.331 14.051 14.089 14.118 0.029 0.039 0.067 0.000 1.325 0.797 0.921 4.000 75.375 131.2
Log Data

34
IW Best Plants Conference – April 24-25, 2007 – Indianapolis, IN
How Do We Use Lean Six Sigma Techniques
Get Management commitmentAssess the operation using a Value Stream Map (Product families & Production data)
Identify lean improvements & kaizenswithout automation Implement lean improvements using VSM planIdentify processes requiring Six Sigma analysisAnalyze, eliminate, and control variationStart the cycle again!
Lean Six Sigma
Operating costs
Process speed(lead time)
Inventory & invested capital
Quality
Customer satisfaction
Operating flexibility
Methodology that maximizes shareholder value by achieving the fastest rate of improvement in…..

35
IW Best Plants Conference – April 24-25, 2007 – Indianapolis, IN
Contact Information
Advent Design CorporationCanal Street and Jefferson Ave.
Bristol, PA 19007
www.adventdesign.com800-959-0310
Frank Garcia, Director Planning & [email protected]