leaflet cheat sheet - · PDF fileUse install.packages ("leaflet") ... Leaflet Cheat Sheet...
1
Quick Start Installation Use install.packages("leaflet") to installize the package or directly from Github devtools::install_github("rstudio/leaflet"). First Map m <- leaflet() %>% # leaflet works with the pipe operator addTiles() %>% # setup the default OpenStreetMap map tiles addMarkers(lng = 174.768, lat = -36.852, popup = "The birthplace of R”) # add a single point layer m Leaflet Cheat Sheet an open-source JavaScript library for mobile-friendly interactive maps for GeoJSON and TopoJSON Map Widget Initialization m <- leaflet(options = leafletOptions(...)) center Initial geographic center of the map zoom Initial map zoom level minZoom Minimum zoom level of the map maxZoom Maximum zoom level of the map Map Methods m %>% setView(lng, lat, zoom, options = list()) Set the view of the map (center and zoom level) m %>% fitBounds(lng1, lat1, lng2, lat2) Fit the view into the rectangle [lng1, lat1] - [lng2, lat2] m %>% clearBounds() Clear the bound, automatically determine from the map elements Data Object Both leaflet() and the map layers have an optional data parameter that is designed to receive spatial data with the following formats: Base R The arguments of all layers take normal R objects: df <- data.frame(lat = ..., lng = ... ) leaflet(df) %>% addTiles() %>% addCircles() sp package library(sp) Useful functions: SpatialPoints, SpatialLines, SpatialPolygons, ... maps package library(maps) Build a map of states with colors: mapStates <- map("state", fill = TRUE, plot = FALSE) leaflet(mapStates) %>% addTiles() %>% addPolygons(fillColor = topo.colors(10, alpha = NULL), stroke = FALSE) Markers Popups and Labels Use markers to call out points, express locations with latitude/longitude coordinates, appear as icons or as circles. Data come from vectors or assigned data frame, or sp package objects. Icon Markers Regular Icons: default and simple addMarkers(lng, lat, popup, label) add basic icon markers makeIcon/icons (iconUrl, iconWidth, iconHeight, iconAnchorX, iconAnchorY, shadowUrl, shadowWidth, shadowHeight, ... ) customize marker icons iconList() create a list of icons Awesome Icons: customizable with colors and icons addAwesomeMarkers, makeAwesomeIcon, awesomeIcons, awesomeIconList Marker Clusters: option of addMarters() clusterOptions = markerClusterOptions() freezeAtZoom Freeze the cluster at assigned zoom level Circle Markers addCircleMarkers(color, radius, stroke, opacity, ... ) Customize their color, radius, stroke, opacity Lines and Shapes Kejia Shi @ Data Science Institute, Columbia University in the City of New York, Kejia.Shi@Columbia.edu addPopups(lng, lat, ...content..., options) Add standalone popups options = popupOptions(closeButton=FALSE) addMarkers(..., popup, ... ) Show popups with markers or shapes addMarkers(..., label, labelOptions... ) Show labels with markers or shapes labelOptions = labelOptions(noHide, textOnly, textsize, direction, style) addLabelOnlyMarkers() Add labels without markers Polygons and Polylines addPolygons(color, weight=1, smoothFactor=0.5, opacity=1.0, fillOpacity=0.5, fillColor= ~colorQuantile("YlOrRd", ALAND)(ALAND), highlightOptions, … ) highlightOptions(color, weight=2, bringToFront=TRUE) highlight shapes Use rmapshaper::ms_simplify to simplify complex shapes Circles addCircles(lng, lat, weight=1, radius, ... ) Rectangles addRectangles(lng1, lat1, lng2, lat2, fillColor="transparent", ... ) Basemaps addTiles() providers$Stamen.Toner, CartoDB.Positron, Esri.NatGeoWorldMap Default Tiles Third-Party Tiles addProviderTiles() Use addTiles() to add a custom map tile URL template, use addWMSTiles() to add WMS (Web Map Service) tiles Shiny Integration Adapted from Rstudio materials https://rstudio.github.io/leaflet/ 2017/05/01 There are two options to use the GeoJSON/TopoJSON data. * To read into sp objects with the geojsonio or rgdal package: geojsonio::geojson_read(...,what=“sp”) rgdal::readOGR(...,“OGRGeoJSON”) * Or to use the addGeoJSON() and addTopoJSON() functions: addTopoJSON/addGeoJSON(... weight, color, fill, opacity, fillOpacity... ) Styles can also be tuned separately with a style: {...} object. Other packages including RJSONIO and jsonlite can help fast parse or generate the data needed. To integrate a Leaflet map into an app: * In the UI, call leafletOutput(“name”) * On the server side, assign a renderLeaflet(...) call to the output * Inside the renderLeaflet expression, return a Leaflet map object Modification To modify an existing map or add incremental changes to the map, you can use leafletProxy(). This should be performed in an observer on the server side. Other useful functions to edit your map: fitBounds(0, 0, 11, 11) similar to setView fit the view to within these bounds addCircles(1:10, 1:10, layerId = LETTERS[1:10]) create circles with layerIds of "A", "B", "C"... removeShape(c("B", "F")) remove some of the circles clearShapes() clear all circles (and other shapes) Inputs/Events Object Events Object event names generally use this pattern: input$MAPID_OBJCATEGORY_EVENTNAME. Triger an event changes the value of the Shiny input at this variable. Valid values for OBJCATEGORY are marker, shape, geojson and topojson. Valid values for EVENTNAME are click, mouseover and mouseout. All of these events are set to either NULL if the event has never happened, or a list() that includes: * lat The latitude of the object, if available; otherwise, the mouse cursor * lng The longitude of the object, if available; otherwise, the mouse cursor * id The layerId, if any GeoJSON events also include additional properties: * featureId The feature ID, if any * properties The feature properties Map Events input$MAPID_click when the map background or basemap is clicked value -- a list with lat and lng input$MAPID_bounds provide the lat/lng bounds of the visible map area value -- a list with north, east, south and west input$MAPID_zoom an integer indicates the zoom level
Transcript of leaflet cheat sheet - · PDF fileUse install.packages ("leaflet") ... Leaflet Cheat Sheet...
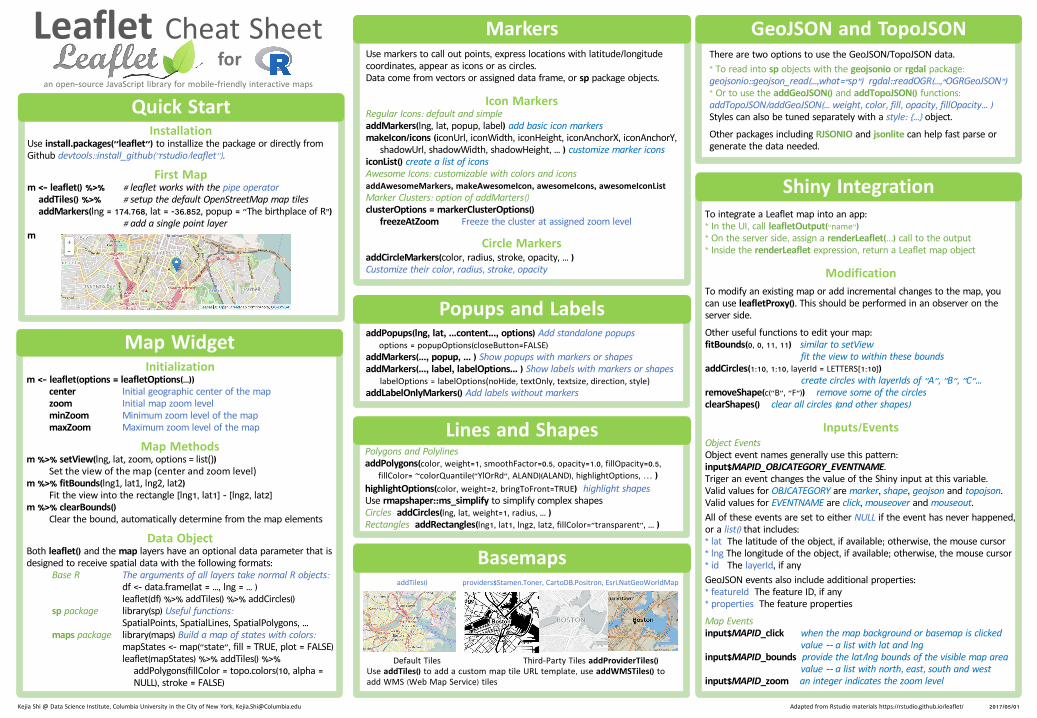
Quick StartInstallation
Use install.packages("leaflet") to installize the package or directly fromGithub devtools::install_github("rstudio/leaflet").
First Mapm <- leaflet() %>% # leaflet works with the pipe operator
addTiles() %>% # setup the default OpenStreetMap map tilesaddMarkers(lng = 174.768, lat = -36.852, popup = "The birthplace of R”)
# add a single point layerm
Leaflet Cheat Sheetan open-source JavaScript library for mobile-friendly interactive maps
forGeoJSON and TopoJSON
Map WidgetInitialization
m <- leaflet(options = leafletOptions(...))center Initial geographic center of the mapzoom Initial map zoom levelminZoom Minimum zoom level of the mapmaxZoom Maximum zoom level of the map
Map Methodsm %>% setView(lng,lat,zoom,options=list())
Settheviewofthemap(centerandzoomlevel)m %>% fitBounds(lng1,lat1,lng2,lat2)
Fit the view into the rectangle [lng1, lat1] - [lng2, lat2]m %>% clearBounds()
Clear the bound, automatically determine from the map elements
Data ObjectBoth leaflet() and themap layers have an optional data parameter that isdesigned to receive spatial data with the following formats:
Base R The arguments of all layers take normal R objects:df <- data.frame(lat = ..., lng = ... )leaflet(df) %>% addTiles() %>% addCircles()
sp package library(sp) Useful functions:SpatialPoints, SpatialLines, SpatialPolygons, ...
maps package library(maps) Build a map of states with colors:mapStates <- map("state", fill = TRUE, plot = FALSE)leaflet(mapStates) %>% addTiles() %>%
addPolygons(fillColor = topo.colors(10, alpha = NULL), stroke = FALSE)
Markers
Popups and Labels
Use markers to call out points, express locations with latitude/longitudecoordinates, appear as icons or as circles. Data come from vectors or assigned data frame, or sp package objects.
Icon MarkersRegular Icons: default and simpleaddMarkers(lng, lat, popup, label) add basic icon markersmakeIcon/icons (iconUrl, iconWidth, iconHeight, iconAnchorX, iconAnchorY,
shadowUrl, shadowWidth, shadowHeight, ... ) customize marker iconsiconList() create a list of iconsAwesome Icons: customizable with colors and iconsaddAwesomeMarkers, makeAwesomeIcon, awesomeIcons, awesomeIconListMarker Clusters: option of addMarters()clusterOptions = markerClusterOptions()
freezeAtZoom Freeze the cluster at assigned zoom level
Circle MarkersaddCircleMarkers(color, radius, stroke, opacity, ... )Customize their color, radius, stroke, opacity
Lines and Shapes
Kejia Shi @ Data Science Institute, Columbia University in the City of New York, [email protected]
addPopups(lng, lat, ...content..., options) Add standalone popupsoptions = popupOptions(closeButton=FALSE)
addMarkers(..., popup, ... ) Show popups with markers or shapesaddMarkers(..., label, labelOptions... ) Show labels with markers or shapes
labelOptions = labelOptions(noHide,textOnly,textsize,direction,style)addLabelOnlyMarkers() Add labels without markers
Polygons and PolylinesaddPolygons(color, weight=1, smoothFactor=0.5, opacity=1.0, fillOpacity=0.5,
fillColor= ~colorQuantile("YlOrRd", ALAND)(ALAND), highlightOptions, … )highlightOptions(color, weight=2, bringToFront=TRUE) highlight shapesUse rmapshaper::ms_simplify to simplify complex shapesCircles addCircles(lng, lat, weight=1, radius, ... )Rectangles addRectangles(lng1, lat1, lng2, lat2, fillColor="transparent", ... )
BasemapsaddTiles() providers$Stamen.Toner, CartoDB.Positron, Esri.NatGeoWorldMap
Default Tiles Third-Party Tiles addProviderTiles()Use addTiles() to add a custom map tile URL template, use addWMSTiles() toadd WMS (Web Map Service) tiles
Shiny Integration
Adapted from Rstudio materials https://rstudio.github.io/leaflet/ 2017/05/01
There are two options to use the GeoJSON/TopoJSON data.* To read into sp objects with the geojsonio or rgdal package:geojsonio::geojson_read(...,what=“sp”) rgdal::readOGR(...,“OGRGeoJSON”)* Or to use the addGeoJSON() and addTopoJSON() functions:addTopoJSON/addGeoJSON(... weight, color, fill, opacity, fillOpacity... )Styles can also be tuned separately with a style: {...} object.
Other packages including RJSONIO and jsonlite can help fast parse orgenerate the data needed.
To integrate a Leaflet map into an app:* In the UI, call leafletOutput(“name”)* On the server side, assign a renderLeaflet(...) call to the output* Inside the renderLeaflet expression, return a Leaflet map object
ModificationTo modify an existing map or add incremental changes to the map, youcan use leafletProxy(). This should be performed in an observer on theserver side.
Other useful functions to edit your map:fitBounds(0, 0, 11, 11) similar to setView
fit the view to within these boundsaddCircles(1:10, 1:10, layerId = LETTERS[1:10])
create circles with layerIds of "A", "B", "C"...removeShape(c("B", "F")) remove some of the circlesclearShapes() clear all circles (and other shapes)
Inputs/EventsObject EventsObject event names generally use this pattern: input$MAPID_OBJCATEGORY_EVENTNAME.Triger an event changes the value of the Shiny input at this variable.Valid values for OBJCATEGORY aremarker, shape, geojson and topojson. Valid values for EVENTNAME are click, mouseover and mouseout.All of these events are set to either NULL if the event has never happened, or a list() that includes:* lat The latitude of the object, if available; otherwise, the mouse cursor* lng The longitude of the object, if available; otherwise, the mouse cursor* id The layerId, if anyGeoJSON events also include additional properties:* featureId The feature ID, if any* properties The feature properties
Map Eventsinput$MAPID_click when the map background or basemap is clicked
value -- a list with lat and lnginput$MAPID_bounds provide the lat/lng bounds of the visible map area
value -- a list with north, east, south and westinput$MAPID_zoom an integer indicates the zoom level