LEAF TRAITS OF CANOPY TREES ON A PRECIPITATION...
116
LEAF TRAITS OF CANOPY TREES ON A PRECIPITATION GRADIENT IN PANAMA: INTEGRATING PLANT PHYSIOLOGICAL ECOLOGY AND ECOSYSTEM SCIENCE By LOUIS STEPHEN SANTIAGO A DISSERTATION PRESENTED TO THE GRADUATE SCHOOL OF THE UNIVERSITY OF FLORIDA IN PARTIAL FULFILLMENT OF THE REQUIREMENTS FOR THE DEGREE OF DOCTOR OF PHILOSOPHY UNIVERSITY OF FLORIDA 2003
Transcript of LEAF TRAITS OF CANOPY TREES ON A PRECIPITATION...

LEAF TRAITS OF CANOPY TREES ON A PRECIPITATION GRADIENT IN
PANAMA: INTEGRATING PLANT PHYSIOLOGICAL ECOLOGY AND ECOSYSTEM SCIENCE
By
LOUIS STEPHEN SANTIAGO
A DISSERTATION PRESENTED TO THE GRADUATE SCHOOL OF THE UNIVERSITY OF FLORIDA IN PARTIAL FULFILLMENT
OF THE REQUIREMENTS FOR THE DEGREE OF DOCTOR OF PHILOSOPHY
UNIVERSITY OF FLORIDA
2003

ACKNOWLEDGMENTS
Many people and organizations contributed to the work presented in this
dissertation, and I am grateful for all of their help. I thank my committee members Steve
Mulkey, Kaoru Kitajima, Jack Putz, Tim Martin and Joe Wright, and everyone in the
Plant Ecology group for five years of stimulating interactions and discussions leading to
the ideas presented here. I am grateful to Guillermo Goldstein, Rick Meinzer, Ted
Schuur, Michelle Mack, Tom Kursar, Lissy Coley, Klaus Winter, Steve Hubbell, and
Allen Herre for comments and discussions on this project at various stages of its
development. Tim Jones, Dave Woodruff, Katy Balatero, Mirna Sarmaniego, Aurelio
Virgo, Augustin Somoza, Elizabeth Osorio, Steve Davis, Eric Graham, Aurelio Virgo,
Kate Moran and Sarah Bouchard helped with lab and field procedures. I thank Edwin
Andrade, Jose Herrera, Oscard and Pitti for their patience and skill in operating the
canopy crane. Rick Condit and Suzanne Lao of CTFS provided generous use of their tree
database. Funding was provided by the U.S. Environmental Protection Agency, the
Smithsonian Tropical Research Institute (STRI), the Florida-Georgia Alliance, the
Mellon Foundation, and the University of Florida. Katia Silvera, the Silvera family and
my parents provided support throughout the project.
ii

TABLE OF CONTENTS Page ACKNOWLEDGMENTS .................................................................................................. ii
LIST OF TABLES............................................................................................................. vi
LIST OF FIGURES .......................................................................................................... vii
ABSTRACT....................................................................................................................... ix
CHAPTER 1 INTRODUCTION ........................................................................................................1
2 LEAF PHOTOSYNTHETIC TRAITS OF CANOPY TREES ALONG A PRECIPITATION GRADIENT IN LOWLAND TROPICAL FOREST ....................3
Introduction...................................................................................................................3 Materials and Methods .................................................................................................5
Site Characterization and Species .........................................................................5 Photosynthesis .......................................................................................................7 Leaf Structure and Chemistry................................................................................8 Two-Site Comparisons ..........................................................................................9 Data Analysis.......................................................................................................10
Results.........................................................................................................................10 Soil Water Potential.............................................................................................10 Photosynthesis .....................................................................................................10 Leaf Structure and Chemistry..............................................................................11 Two-Site Comparisons ........................................................................................12
Discussion...................................................................................................................12 3 NUTRIENT CYCLING ON A PRECIPITATION GRADIENT IN LOWLAND
TROPICAL FOREST.................................................................................................25
Introduction.................................................................................................................25 Materials and Methods ...............................................................................................27
Study Site.............................................................................................................27 Foliar Chemistry..................................................................................................28 Litterfall Collection and Processing ....................................................................28 Leaf Litter Chemistry ..........................................................................................29 Nutrient Availability............................................................................................29
iii

Extractable nitrogen and phosphorus ...........................................................29 Nitrogen mineralization and nitrification.....................................................30 Ion exchange resins ......................................................................................30 Soil nutrient pools ........................................................................................31
Results.........................................................................................................................31 Foliar Chemistry..................................................................................................31 Litter Production and Chemistry .........................................................................31 Nutrient Availability............................................................................................32
Extractable nitrogen and phosphorus ...........................................................32 Ion exchange resins ......................................................................................33 Soil nutrient pools ........................................................................................33
Discussion...................................................................................................................33 Foliar Chemistry..................................................................................................33 Litter Production and Chemistry .........................................................................34 Nutrient Availability............................................................................................35 Conclusions .........................................................................................................36
4 HYDRAULIC CONDUCTIVITY AND WOOD DENSITY SCALE WITH LEAF
PHOTOSYNTHETIC TRAITS IN PANAMANIAN FORES CANOPY TREES ....46
Introduction.................................................................................................................46 Materials and Methods ...............................................................................................48
Study Site and Species.........................................................................................48 Gas Exchange Measurements..............................................................................49 Hydraulic Conductivity .......................................................................................49 Wood Density......................................................................................................50 Foliar Analysis.....................................................................................................50
Results.........................................................................................................................51 Discussion...................................................................................................................52
5 LEAF DECOMPOSITION IN A WET TROPICAL FOREST: LINKING LEAF
TRAITS WITH NUTRIENT CYCLING ...................................................................59
Introduction.................................................................................................................59 Materials and Methods ...............................................................................................61
Study Site and Species.........................................................................................61 Litter Collection and Decomposition ..................................................................61 Initial Litter Quality.............................................................................................62 Gas Exchange and Leaf Chemistry .....................................................................62
Results.........................................................................................................................64 Discussion...................................................................................................................65
Plant Growth Forms and Ecosystem Processes...................................................65 Litter Quality and Decomposition .......................................................................66 Photosynthesis and Decomposition.....................................................................66
iv

6 TEST OF GAS EXCHANGE MEASUREMENTS ON EXCISED BRANCHES OF TEN TROPICAL TREE SPECIES: A TECHNICAL REPORT ...............................77
Introduction.................................................................................................................77 Materials and Methods ...............................................................................................79
Study Sites and Species .......................................................................................79 Gas Exchange Measurements..............................................................................80
Results and Discussion ...............................................................................................82 Time Course Measurements ................................................................................82 Response to Light ................................................................................................83 Response to CO2..................................................................................................85 Conclusions .........................................................................................................87
7 CONCLUSIONS ........................................................................................................94
LIST OF REFERENCES...................................................................................................95
BIOGRAPHICAL SKETCH ...........................................................................................106
v

LIST OF TABLES
Table page 2-1. Site characteristics for 1 ha census plots ....................................................................16
2-2. Study species from four sites along precipitation gradient.........................................17
2-3. Correlation coefficients between leaf defensive characteristics.................................18
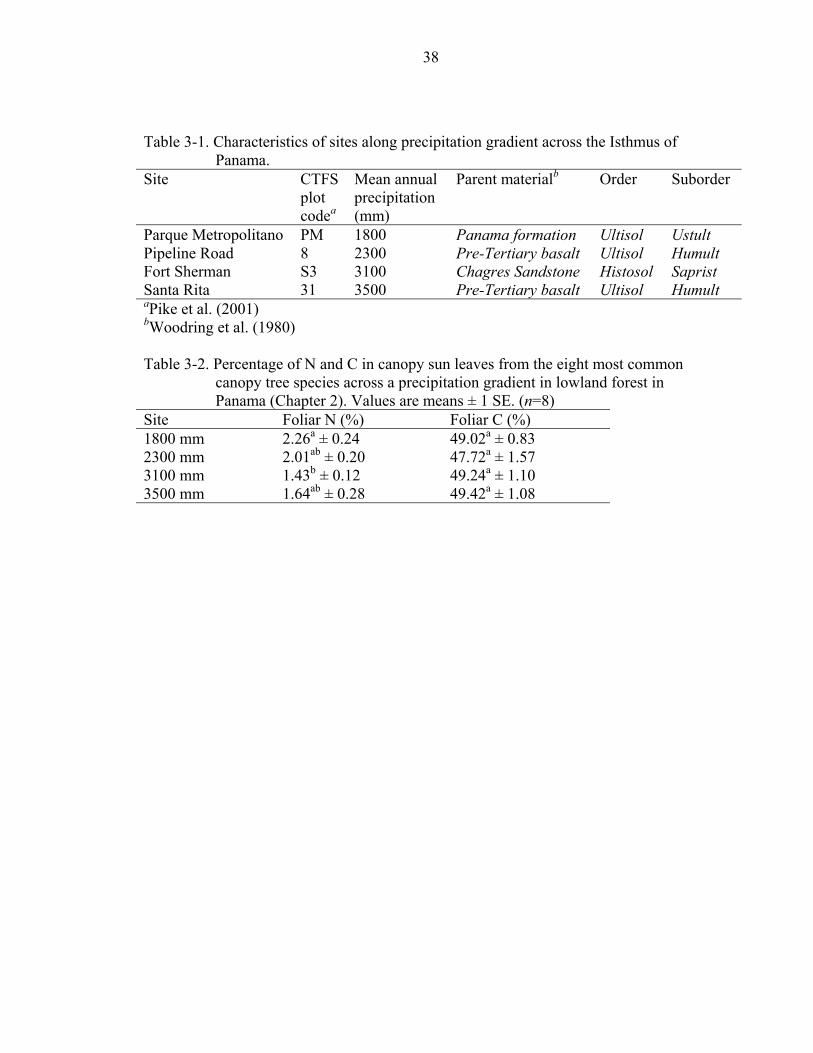
3-1. Characteristics of sites along precipitation gradient...................................................38
3-2. Percentage of N and C in canopy sun leaves..............................................................38
3-3. Litterfall rates separated by component......................................................................39
3-4. Soil chemistry to a depth of 10 cm.............................................................................40
3-5. Bulk soil chemistry from the surface 10 cm of soil....................................................41
3-6. Soil bulk density and water content............................................................................41
4-1. Area-based maximum photosynthetic rate (Aarea).......................................................55
5-1. Summary of study species and leaf litter decomposition rate (k)...............................68
5-2. Leaf litter decomposition rates and initial litter quality .............................................69
5-3. Regressions of litter chemical parameters and leaf litter decomposition ...................70
5-4. Regressions of leaf chemical and structural parameters.............................................70
5-5. Results of general linear model ..................................................................................70
6-1. Light-saturated rate of net CO2 assimilation ..............................................................88
6-2. Repeated measures analysis of variance.....................................................................88
6-3. Means of model parameters........................................................................................89
vi

LIST OF FIGURES
Figure page 2-1. Seasonal variation in soil water potential (Ψsoil) ........................................................19
2-2. Relationship between mean annual precipitation and photosynthesis........................20
2-3. Relationship between mean annual precipitation and leaf N concentration...............21
2-4. Relationship between mean annual precipitation and lamina thickness.....................22
2-5. Maximum photosynthetic O2 evolution rate (Pmass) ...................................................23
2-6. Seasonal variation in leaf water potential (Ψleaf) ........................................................24
3-1. The difference between seasonal maximum and minimum litterfall rates .................42
3-2. Relationship between carbon isotope composition of soil and litter ..........................43
3-3. Soil N mineralization rates for the top 10 cm.............................................................44
3-4. Soil N concentration as a function of (A) litter lignin and (B) litter lignin:N............45
4-1. Leaf photosynthetic rate per unit area ........................................................................56
4-2. Leaf nitrogen per unit area (Narea)...............................................................................57
4-3. Stem saturated water content......................................................................................58
5-1. Relationship between leaf litter decomposition rate (k) and initial litter lignin .........71
5-2. Relationship between leaf litter decomposition rate (k) and initial litter carbon........72
5-3. Relationship between leaf litter decomposition rate (k) and nitrogen ........................73
5-4. Relationship between leaf litter decomposition rate (k) and specific leaf area ..........74
5-5. Relationship between Amass specific leaf area and leaf N ...........................................75
5-6. Schematic diagram depicting how photosynthesis is related to decomposition.........76
6-1. Percent of maximum photosynthesis..........................................................................90
vii

6-2. Percent of maximum stomatal conductance ...............................................................91
6-3. Representative curves of net CO2 assimilation as a function of PFD.........................92
6-4. Representative curves of net CO2 assimilation as a function of internal CO2 ............93
viii
Abstract of Dissertation Presented to the Graduate School of the University of Florida in Partial Fulfillment of the Requirements for the Degree of Doctor of Philosophy
LEAF TRAITS OF CANOPY TREES ON A PRECIPITATION GRADIENT IN PANAMA: INTEGRATING PLANT PHYSIOLOGICAL
ECOLOGY AND ECOSYSTEM SCIENCE
By
Louis Stephen Santiago
August 2003
Chair: Stephen S. Mulkey Major Department: Botany
There is increasing awareness in ecology of the importance of species effects on
processes at the ecosystem scale. This dissertation uses a comparative approach involving
many species along a precipitation gradient (1800-3500 mm/yr) in lowland Panama to
understand how species traits vary among different plant communities, and how these
traits feed back into ecosystem processes such as decomposition and soil nutrient
availability. As precipitation increases from South to North across the Isthmus of
Panama, there is a gradual change in canopy leaf traits from short-lived leaves with high
photosynthetic rates in seasonally dry forest, to relatively long-lived leaves with lower
photosynthetic rates and increased allocation to structural defense in wet forest. Increases
in leaf litter lignin:N also accompany increases in precipitation, indicating a decrease in
potential decomposability of leaf litter in wetter sites. Leaf litter lignin:N was negatively
correlated with soil N mineralization rates, and positively correlated with total soil N
pools indicating that slowly decomposing litter reduces mineralization, but conserves N
ix

in the soil organic matter matrix. Leaf litter lignin:N was the strongest litter quality
predictor of decomposition at the one site where decomposition was studied.
Decomposition was positively related to specific leaf area, leaf N concentration and
photosynthetic rate per unit mass suggesting that these traits may be useful predictors of
the effects of species on ecosystem processes. Photosynthetic rate per unit area and
stomatal conductance were positively related to leaf specific hydraulic conductivity and
negatively related to branch wood density indicating that leaf traits controlling gas
exchange correlate with processes at the branch and whole plant levels of organization.
Overall this dissertation provides evidence that many plant traits are correlated along a
minimal number of axes, and that these traits can be used to predict the movement of
matter and energy between plants and their environments.
x

CHAPTER 1 INTRODUCTION
This dissertation is an attempt to understand how changes in plant community
composition along a precipitation gradient feed back into nutrient cycling and ecosystem
processes. This research area integrates plant physiology, community ecology, and
ecosystem science. The ideas in this dissertation are also based on studies of how species
respond to environmental factors, and the effects that species have on those factors
(Cornelissen 1996; Hobbie 1992; Wardle et al. 1998). Several studies have demonstrated
that many plant species traits are correlated, and that suites of traits appear to have
evolved in response to specific environmental regimes vary along a minimal number of
axes (Chapin 1980; Grime 1977; Tilman 1988). More recently, it has been shown that
leaf physiological traits governing the carbon economy of the leaf are interrelated and
reflect fundamental evolutionary tradeoffs and biochemical constraints (Reich et al.
1992). Together, these studies suggest that if we can link the effects of plant species on
ecosystem processes with ecophysiological or life history characteristics, then we may
augment our understanding of ecosystem functioning, by drawing upon evolutionary and
ecological principles.
In this dissertation, I take two main approaches to understanding how species
traits feed back into ecosystem processes. The first is along a precipitation gradient in
lowland Panama. As precipitation increases in the lowland tropics, there is a gradual
change in canopy species from deciduous species in seasonally dry forest, to evergreen
species in wet, aseasonal forest. Leaf turnover represents a major pathway of energy and
1

2
matter between the plant and soil components of the ecosystem. Therefore, along this
precipitation gradient, I present data on how patterns of canopy phenology are related to
photosynthesis, and leaf life span. In turn, I relate leaf traits to indices of litter quality and
discuss ways in which variation in species composition along this precipitation gradient
can influence the cycling of nutrients and the size of soil nutrient pools.
The second approach I take to understanding how species traits feed back into
ecosystem processes is at one wet forest site along the precipitation gradient. At this site I
present data on how leaf physiological traits that control carbon assimilation and water
loss are related to hydraulic and biophysical characteristics at the branch and whole plant
scale, and discuss how relationships between leaf and branch physiology reflect
evolutionary tradeoffs. I also compare how plant growth forms vary in the litter quality
and decomposition rates of their leaves, and whether leaf litter decomposition can be
predicted from leaf physiological characteristics. Together, this collection of studies
provides evidence that changes in plant community composition with precipitation in
lowland Panama can influence nutrient cycling, and that leaf physiological characteristics
provide information about the potential effects of species on ecosystem processes.

CHAPTER 2 LEAF PHOTOSYNTHETIC TRAITS OF CANOPY TREES ALONG A PRECIPITATION GRADIENT IN LOWLAND TROPICAL FOREST
Introduction
Tropical forests often exhibit gradients of vegetation structure and species
composition in relation to precipitation (Gentry 1988; Schimper 1898; Wright 1992).
Forests on the dry side of this gradient commonly have a higher proportion of deciduous
canopy species that lose their leaves during seasonal dry periods when low soil water
availability may limit physiological activity. Deciduous leaves of tropical forest reduce
whole-plant transpiration and respiration during drought; and often have higher rates of
photosynthesis per unit leaf mass (Pmass) than evergreen species (Chabot and Hicks 1982;
Eamus and Prior 2001; Prado and DeMoraes 1997; Reich et al. 1992). In contrast,
evergreen leaves have lower Pmass, but exhibit a potentially longer photosynthetic season;
and appear to reduce demand on soil nutrients required to replace leaves (Chabot and
Hicks 1982; Cunningham et al. 1999; Vázquez and Givnish 1998). These respective costs
and benefits partially explain why deciduous trees dominate seasonally dry tropical
forest; why evergreen species dominate wet, aseasonal forest; and suggest that Pmass of
canopy species should decrease with increasing precipitation in the tropics. There are few
data available for photosynthetic traits on broad precipitation gradients in lowland
tropical forest. On a global scale, however, Pmass and specific leaf area are reported to
increase with increasing moisture availability (Niinemets 2001; Reich et al. 1999). The
purpose of our study is to determine how patterns of canopy phenology are related to
3
4
photosynthesis and leaf life span along a regional precipitation gradient in lowland
Panama.
Interest in leaf trait variation along climate gradients dates back to the time of
Theophrastus and formed some of the earliest ecological works. Recent studies have
focused on precipitation as a driver of resource availability with direct and indirect
effects on plant processes. For example, plants of relatively dry environments in Australia
exhibited more sclerified vasculature than did species in high rainfall sites, possibly
reflecting adaptation to resist wilting and minimize cell damage when water availability
is low (Cunningham et al. 1999). Relatively high leaf N per unit area in dry habitats in
Australia may represent a mechanism by which plants capitalize on higher light
availability in dry habitats (Cunningham et al. 1999; Mooney et al. 1978). Leaf N of
montane forest species in Hawaii was also reported to decrease with increasing
precipitation and was related to decreasing soil N availability with increasing
precipitation (Schuur and Matson 2001), suggesting that evergreenness in wet tropical
forest may be a response to relatively low nutrient availability (Monk 1966). Precipitation
may therefore directly affect vegetation structure and community composition through
constraints imposed by water deficit, or indirectly through effects on availability of light
and/or nutrients (Schuur and Matson 2001).
Most studies of leaf trait variation with climate have been conducted along
gradients with a maximum precipitation below 2500 mm yr-1 (Cunningham et al. 1999;
Mooney et al. 1978; Werger and Morris 1991). Other studies on precipitation gradients
with maximum precipitation above 5000 mm yr-1 have focused on phenotypic changes
within individual plant species (Austin and Vitousek 1998; Schuur and Matson 2001). In

5
contrast, our study addresses variation in leaf traits caused by large changes in species
community composition over short (10 km) distances (Condit et al. 2002). I measured
leaf physiological and structural traits to understand how patterns of resource allocation
to leaves are related to climate on this regional gradient, which lies at the high end of the
global precipitation range (1800 to 3500 mm yr-1). Specifically I wanted to link the leaf
functional traits of dominant species to shifts in community phenology and leaf longevity
characteristics.
Materials and Methods
Site Characterization and Species
Our study was conducted in lowland tropical forest along a precipitation gradient in
the Panama Canal Watershed. Mean annual precipitation (MAP) across this part of the
Panamanian Isthmus ranges from 1800 mm yr-1 on the Pacific Coast to 4000 mm yr-1 on
the Caribbean Coast (Condit 1998). I selected four 1-ha lowland forest study plots
established by the Center for Tropical Forest Science (CTFS) over a range of
precipitation with minimal changes in altitude and therefore temperature (Table 2-1). All
sites have a mean monthly precipitation of >100 mm during the wet season (between
May and December) but dry season length (mean number of 30-day periods with <100
mm precipitation) varies between 129 days at the 1800 mm site and 67 days near the
3500 mm site (ACP 2002) Between December and May, the probability of a site
receiving <100 mm of monthly precipitation varies from 80% at the 1800 mm site to 22%
at the 3500 mm site (Paton and Wright 2003). Variation in rainfall during the study
period (2000-2002) was within 15% of MAP at all sites. Variation in the amount and
distribution of annual precipitation has the potential to influence light availability and
relative humidity. Average daily photosynthetically active radiation (PAR) decreases

6
with increasing precipitation from 32.3 mol m-2 at the 1800 mm site (Juan Posada,
unpublished data); to 31.9 mol m-2 at Barro Colorado Island in the middle of the isthmus
and to 31.4 mol m-2 at the 3100 mm site (Paton and Wright 2003). Mean relative
humidity appears to be highest on the wet Caribbean coast (94.6% at the 3100 mm site);
the 1800 mm site and Barro Colorado Island maintain values of 87.9 and 84.0%,
respectively (Paton and Wright 2003).
The soils in the Panama Canal forests are well-drained clays high in Ca, Mg and
N; and low in K and P relative to other tropical soils (Dietrich et al. 1982; Kursar et al.
1995; Yavitt et al. 1993). All of the study sites are on volcanic substrate (except Ft.
Sherman, which lies on sedimentary substrate). However, similarities in soil
characteristics between sedimentary and volcanic substrates on Barro Colorado Island
(which lies in the middle of the isthmus) suggest that in this area nutrient availability is
determined more by weathering and nutrient cycling by vegetation than by parent
material (Yavitt 2000).
Soil water potential (Ψsoil) was measured with the filter paper technique (Deka et al.
1995) at six randomly selected locations in each 1-ha study plot, nine times over a 14-
month period (February 2001 to March 2002). One 42.5 mm diameter filter paper
(Whatman no. 42, batch #711492, Whatman, Kent, UK) was equilibrated for 6 days with
a fresh soil sample taken from 15 to 20 cm depth. Then the gravimetric moisture content
of the filter paper was used to predict water potential using the regression equation of
Deka et al. (1995). Assuming that gravitational and solute potential are negligible, the
resulting values represent soil matric potential. I also determined the gravimetric soil
water content on a 5 g subsample by drying at 105°C for 24 h.

7
At each site, I mesaured the eight canopy tree species with the largest relative
proportion of basal area. Species composition and phenological habit of the most
common canopy trees change rapidly across this gradient, as species richness increases
steeply with mean annual precipitation (Table 2-2) (Pyke et al. 2001). One recent study
comparing beta-diversity (how species composition changes with distance) of tree
communities between lowland forests in Ecuador and Peru found that distant forests
(>1000 km) with similar climate shared a much larger proportion of the most common
species than would be expected by chance (Pitman et al. 2001). In contrast, tree
community composition varies substantially even over 10 to 20 km distances in Panama;
and such variation appears to be regulated largely by climate variation (Condit et al.
2002). All study plots are located in mature forest (>500 yr), except the 1800 mm site,
which is a forest of mixed age (70-100 yr). Measurements on the largest canopy trees at
the 1800 mm site are comparable to other sites even though this forest is younger,
because canopy composition was representative of mature moist and dry forest (Croat
1978).
Photosynthesis
At the 1800 and 3100 mm sites, canopy leaves were collected using canopy cranes
maintained by the Smithsonian Tropical Research Institute. The youngest fully expanded
mature leaves were cut at the petiole; and immediately sealed in a darkened humidified
container. At the 2300 and 3500 mm sites, leaves were collected from the upper canopy
using a shotgun and then treated the same. Canopy trees were defined as individuals with
approximately 80% of the crown exposed to full sun. All leaves were collected before
1030 h the day after rainfall and were transported to the laboratory within 2.5 h where
photosynthesis was measured immediately.

8
Photosynthetic capacity was measured as the maximum rate of O2 evolution with a
Clark electrode (Model LD2, Hansatech, Norfolk, UK) (Delieu and Walker 1981) on 3 to
8 leaves of each of 2 to 4 individuals for a total of 15 leaves per species from a site. A 10-
cm2 leaf disk was placed in a sealed chamber containing 10% CO2 and maintained at
29°C. Leaves were first induced with 250 and 560 µmol photosynthetic photon flux
density (PPFD) before the maximum rate of O2 evolution at 2000 µmol was measured.
Light was provided by a quartz-halogen lamp (Björkman and Demmig 1987) with
attenuation achieved by inserting neutral density filters and verified with a quantum
sensor (Model LI 190SB, Li-Cor Inc., Lincoln, NE). At each light level, a stable signal
was usually obtained in 5 to 7 min. The chamber was flushed with 10% CO2 for 2 min
between changes in light intensity. The high concentration of CO2 in the O2 electrode
chamber bypasses all stomatal and cuticular resistance, so that the measured maximum
rate reflects the Rubisco-limited rate of photosynthesis; and thus is a good index of
enzyme allocation to photosynthetic capacity. Maximum rates of photosynthetic O2
evolution were correlated with measurements of CO2 assimilation conducted with an
infrared gas analyzer (Model 6400, Li-Cor, Inc.) on a subset of study species (r2=0.82;
P<0.0001; n=12).
Leaf Structure and Chemistry
After photosynthetic measurements, I measured lamina thickness between primary
and secondary veins with a digital caliper (Mitutoyo Inc., Japan). Leaf discs were dried
overnight at 65°C; weighed for determination of specific leaf area (SLA); and ball milled.
All leaf discs from the same tree were pooled for chemical analysis. One composite
sample from each tree was analyzed for N using an elemental analyzer (Model NCS

9
2500, Carlo Erba, Milano, Italy). A separate subsample was analyzed for δ15N at the
University of Georgia Institute of Ecology. Leaf carbon fraction analyses were performed
on a single composite sample per species at a site using forest-product techniques (Ryan
et al. 1989). Dried leaf samples were digested in a detergent solution by which soluble
and nutritionally available cell contents were separated from neutral detergent fiber
(NDF), which includes all cell wall constituents and is not immediately nutritionally
available. A dilute acid detergent solution was then used to determine acid detergent fiber
(ADF, lignocellulose) before lignin was separated from cellulose in 72% H2SO4. Leaf
toughness was measured in the field on freshly collected leaves with a penetrometer
(Pesola, Switzerland), which measured the maximum force during punching through the
lamina between primary and secondary veins at a steady, slow rate with a 1 mm diameter
plunger. Such measurements are not equivalent to the material property of fracture
toughness, which is a more theoretically relevant measure of toughness against herbivore
action. However, leaf toughness was correlated with fracture toughness for species at the
1800 mm site (Kaoru Kitajima, unpublished data).
Two-Site Comparisons
Canopy access at the two crane sites allowed for ease in data collection of leaf
water potential and leaf life span of study species. Leaf water potentials (Ψleaf) were
measured at predawn (0600 h) and midday (1200 h) for the study species at the 1800 and
3100 mm sites using a pressure chamber (PMS Instruments, Corvallis, Oregon, USA). At
both sites, canopy cranes were used to collect three terminal shoots from two individuals
per species from the upper canopy in July 2001, October 2001, and February 2002
representing the early and late wet season and dry season, respectively. Leaf life span was

10
measured on marked sun leaves that were censused every 6 weeks for 5 years as part of a
larger study on canopy leaf dynamics (S. Joseph Wright, unpublished data).
Data Analysis
Analyses of the statistical effect of climate on leaf traits were conducted with
one-way general linear models, to test whether leaf traits varied significantly with
precipitation. Analyses of the relationships between leaf traits were performed with
one-way analyses of covariance to test for heterogeneity of means around regression
slopes. Each analysis of covariance was conducted independently with Pmass as the
dependent variable; MAP as the grouping factor; and leaf N, SLA or leaf life span as the
covariate. Mean Ψleaf between sites was compared by repeated measure analysis of
variance and profile analysis with site as a between-subject factor; and measurement date
and time of day as multiple within-subject factors (von Ende 1993). All analyses were
conducted using SAS version 6.12 (SAS 1985).
Results
Soil Water Potential
Soil water potential reinforced precipitation data, demonstrating that the main
difference between sites is the length and intensity of the dry season and not differences
during the wet season (Figure 2-1). Furthermore, maximum gravimetric soil moisture, an
index of soil water-holding capacity, increased with precipitation from a maximum of
49.4 to 89.1% of dry soil mass from the driest to wettest site.
Photosynthesis
Mean annual precipitation (MAP) explained 13% of the variation in area-based
maximum photosynthetic rates (Parea) of the eight most abundant canopy tree species at
each of the sites (Figure 2-2A). The Parea showed a marginally significant decrease with
11
increasing MAP. When photosynthesis was expressed on a mass basis (Pmass), MAP
explained 42% of the variation and Pmass decreased significantly with increasing
precipitation (Figure 2-2B). There was no clear relationship between leaf N per unit area
and MAP (r2=0.00, P=0.95). However, MAP explained 21% of the variation in leaf N per
unit mass and 34% of the variation in δ15N, both of which decreased significantly with
increasing precipitation (Figure 2-3A,B). Both photosynthesis and leaf N showed
stronger correlations with precipitation when expressed on a mass basis than on an area
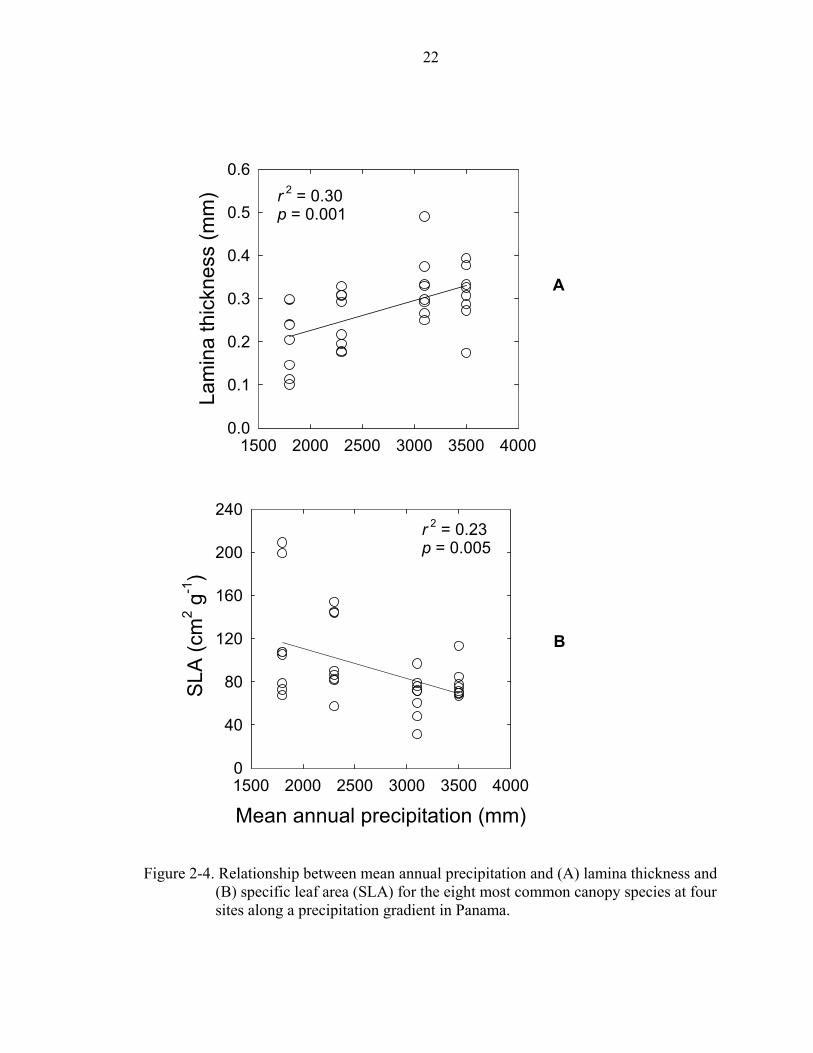
basis because there was an increase in leaf thickness with increasing MAP (Figure 2-4A).
In a related index of leaf structure, SLA decreased with increasing MAP (Figure 2-4B).
Analysis of covariance revealed no heterogeneity of means around regression
slopes caused by MAP in the relationship between Pmass and leaf life span (F=0.23;
P=0.58) or leaf N (F=0.51; P=0.68), and only a marginally significant heterogeneity of
slope caused by MAP in the relationship between Pmass and SLA (F=2.95; P=0.05).
Therefore, species from all sites were regressed together in the same predictive
relationships, regardless of site, although species from different sites tended to occupy
different ranges of the relationship (Figure 2-5). The Pmass was positively correlated with
leaf N across all species and sites; and this predictive relationship improved from an r2 of
0.56 to 0.78 by removing the statistical outlier (Figure 2-5A). The Pmass and SLA were
positively correlated across all species and sites; and were expressed as a log-linear
function (Figure 2-5B).
Leaf Structure and Chemistry
Toughness of canopy leaves significantly increased with MAP and lamina
thickness (Table 2-3). Fiber (NDF) and cellulose concentration were positively related to

12
lamina thickness; thus the proportion of leaf cell-wall material increases as leaves
increase in thickness. With increasing precipitation, I also noted trends toward reduced
nutritional content and increased antiherbivore defense (fiber and lignin per unit leaf N)
(Table 2-3) (Cunningham et al. 1999).
Two-Site Comparisons
Median leaf life spans were longer at the 3100 mm site than they were at the
1800 mm site (t=-6.25; P=0.003; df=4); and were negatively correlated with Pmass (Figure
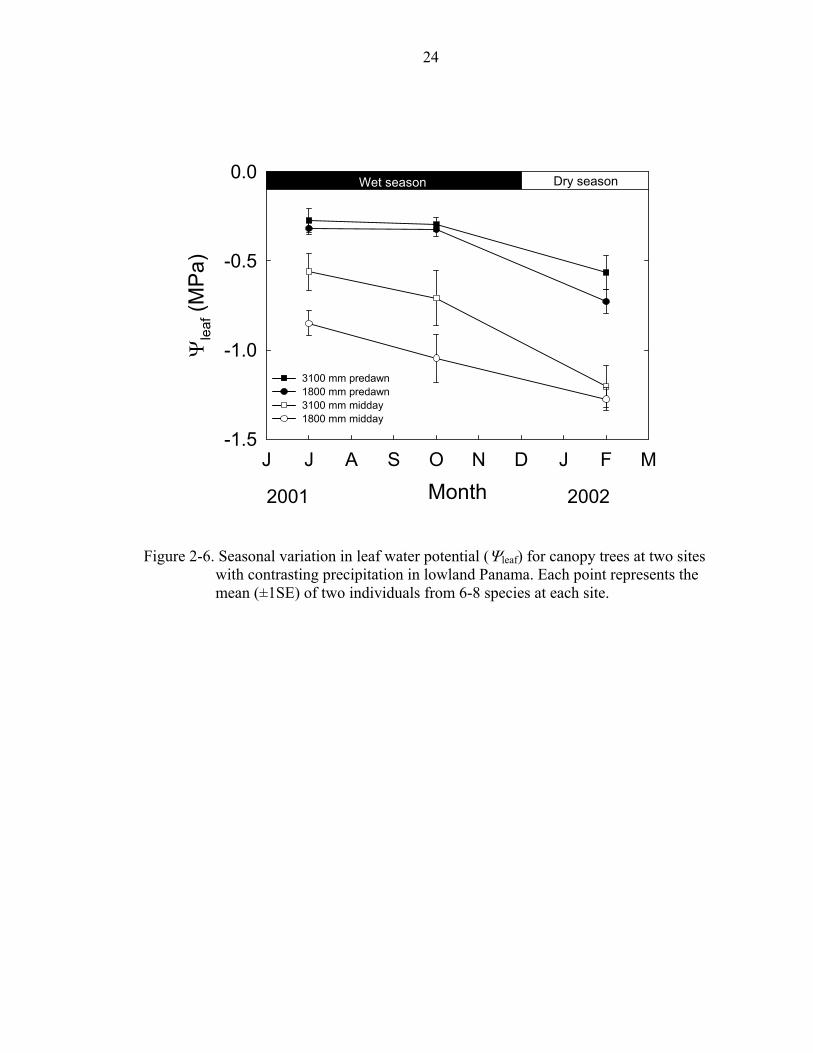
2-5C). Midday leaf water potential (Ψleaf) was lower at the 1800 mm site than at the 3100
mm site during the early (F1,14=6.11; P<0.05) and late wet season (F1,14=3.17; P<0.1;
Figure 2-6); but not during the dry season. There were no significant differences in
predawn Ψleaf among sites during any measurement period.
Discussion
As precipitation increases from South to North across the Isthmus of Panama, there
is a gradual change in canopy leaf traits from short-lived leaves with high Pmass in
seasonally dry forest, to relatively long-lived leaves with lower Pmass and increased
allocation to structural defense in wet forest. Relatively high Pmass and short leaf life
spans of canopy leaves in seasonally dry forest may allow canopy species to take
advantage of high light availability when water is available; and to minimize water loss
and respiration costs during rainless periods. Longer leaf life spans exhibited by canopy
trees in wetter forest appear to place constraints on Pmass by necessitating increased
allocation to structural defenses. Although substantial variation in leaf traits exist along
this precipitation gradient, it is important to note that precipitation drives the expression
of leaf traits through soil moisture and tree water status (Reich 1995; Reich and Borchert
13
1984); and potentially by influencing light and nutrient availability, although these
indirect effects are less documented (Schuur and Matson 2001).
Our data show coupling between Ψsoil and seasonality in precipitation and show
how variation in dry season intensity among study sites appears to be the greatest source
of variation in soil water availability among sites (Figure 2-1). The range of Ψsoil values
observed are consistent with other studies of lowland Neotropical and West African
forest reporting upper soil values near 0 MPa during the wet season to –3.5 MPa or lower
during dry periods (Goldstein et al. 1986; Holbrook et al. 1995; Veenendaal et al. 1996).
Our values of predawn and midday Ψleaf are also comparable to studies conducted in
seasonally dry tropical forest in Venezuela, Australia, and Costa Rica (Borchert 1994;
Eamus and Prior 2001; Goldstein et al. 1986; Medina and Francisco 1994; Sobrado
1986). Differences in midday Ψleaf between the 1800 and 3100 mm sites during the wet
season but not during the dry season (despite strong differences in Ψsoil in the dry season)
indicate that differences in atmospheric water content and stomatal function can affect
Ψleaf independently of Ψsoil. Additionally, two of the deciduous species at the 1800 mm
site had no leaves during February 2002 and were therefore not measured; whereas the
remaining species maintained Ψleaf values between –1.0 and –1.5 MPa and thus
minimized variation between the 1800 and 3100 mm sites, resulting in no statistical
difference among the measured species. Sobrado (1986) and Medina and Francisco
(1994) also found a stronger decrease in Ψleaf in deciduous than in evergreen species
during the dry season, suggesting that maintaining functional leaves during the dry
season requires greater resistance to desiccation, possibly through allocation to deeper
roots.

14
Several studies have addressed the effects of precipitation on nutrient availability
as a factor governing the expression of leaf traits at the community scale (Austin and
Vitousek 1998; Givnish 2002; Schuur and Matson 2001). Evergreen vegetation tends to
dominate nutrient-poor habitats (Monk 1966). Dominance of evergreen species in wet
forest is consistent with the notion of reduced nutrient availability as precipitation
increases. Both Schuur and Matson (2001) and Austin and Vitousek (1998) found the
lowest foliar N concentrations at highest precipitation sites along precipitation gradients
in Hawaiian montane forest. Decreasing leaf N per unit mass in lowland Panamanian
forest is consistent with this line of reasoning. Decreasing foliar δ15N with increasing
precipitation has been interpreted as signifying increasing N-limited conditions (Austin
and Vitousek 1998; Schuur and Matson 2001; Shearer and Kohl 1986). However, our
bulk soil δ15N did not match this pattern (Chapter 3). Thus decreasing foliar δ15N with
increasing precipitation in lowland Panamanian canopy trees may reflect the fact that
species with shorter leaf life spans retranslocate leaf N more frequently than evergreen
species and that δ15N becomes enriched during re-assimilation of nitrate and leaf N re-
metabolism (Evans 2001).
Decreasing leaf N with increasing precipitation may also reflect diminishing
returns for N allocation to canopy leaves if the decrease in light availability with
increasing precipitation is sufficiently strong to drive such a pattern. A difference of
0.9 mol m-2 for average daily PAR exists across this precipitation gradient. It is unknown
whether this amount could contribute to patterns of N allocation to canopy leaves.
Reduced N allocation to leaves with lower light availability is consistent with the
functional convergence hypothesis (which predicts that plants should only allocate

15
resources to photosynthetic capacity that can be used despite constraints imposed by
limiting resources such as light and water) (Field 1991). One species at the 1800 mm site,
Luehea seemannii, increased rates of CO2 assimilation, branch growth, and fruit
production in response to experimental light enrichment; supporting the notion that
canopy trees of lowland forest have the potential to acclimate to higher light availability
(Graham et al. 2003). Therefore, decreasing light availability with increasing
precipitation may contribute to relatively low photosynthetic rates in wet tropical forest.
Our pattern of decreasing Pmass and SLA with increasing moisture availability on
a regional precipitation gradient is consistent with the notion of a bimodal distribution of
leaf longevity (Chabot and Hicks 1982; Kikuzawa 1991). On a global scale,
deciduousness is highest in mid-precipitation and mid-latitude ecosystems. Our
relationships between Pmass and leaf life span and between leaf N and SLA show slopes
similar to those of global comparisons (Reich et al. 1992). This suggests that fundamental
tradeoffs between leaf traits are constant; but at the high end of global precipitation
range, where water availability may exceed biological demand for much of the annual
cycle, Pmass and SLA decrease with increasing precipitation, in contrast to the pattern of
increasing Pmass and SLA with increasing precipitation common in other biomes (Reich et
al. 1999).

16
Table 2-1. Site characteristics for 1 ha census plots in the Panama Canal Watershed. Basal area, species richness, and tree density represent species with stems >10 cm in diameter.
Site
Mean annual precipitation (mm yr-1)
Elevation (m)
Basal area (m2 ha-1)
Species richness (no. ha-1)
Tree density (no. ha-1)
Parque Metropolitano 1800 60 25.39 36 318 Pipeline Road 2300 210 26.59 95 560 Fort Sherman 3100 140 32.50 87 569 Santa Rita 3500 282 25.74 162 497

17
Table 2-2. Study species from four sites along precipitation gradient in Panamanian lowland tropical forest, including phenological classification into deciduous (losing leaves for more than a few weeks), brevi-deciduous (losing leaves once per year and immediately flushing a new set) and evergreen. Classification based on field observations and the Flora of Barro Colorado Island (Croat 1978).
Species Family Phenology 1800 mm Anacardium excelsum Anacardiaceae Brevi-deciduous Astronium graveolens Anacardiaceae Deciduous Calycophyllum candidissimum Rubiaceae Evergreen Chrysophyllum cainito Sapotaceae Evergreen Enterolobium cyclocarpum Fabaceae Deciduous Luehea seemannii Tiliaceae Brevi-deciduous Pseudobombax septenatum Bombacaeae Deciduous Spondias mombin Anacardiaceae Deciduous 2300 mm Poulsenia armata Moraceae Brevi-deciduous Pourouma bicolor Moraceae Evergreen Sterculia apetala Sterculiaceae Deciduous Tabebuia guayacan Bignoniaceae Deciduous Tapirira guianensis Anacardiaceae Evergreen Terminalia amazonica Combretaceae Brevi-deciduous Trattinickia aspera Burseraceae Deciduous Virola sebifera Myristicaceae Evergreen 3100 mm Aspidosperma cruenta Apocynaceae Evergreen Brosimum utile Moraceae Evergreen Calophyllum longifolium Clusiaceae Evergreen Dussia mundia Fabaceae Evergreen Manilkara bidentata Sapotaceae Evergreen Marila laxiflora Clusiaceae Evergreen Poulsenia armata Moraceae Brevi-deciduous Tapirira guianensis Anacardiaceae Evergreen 3500 mm Aspidosperma cruenta Apocynaceae Evergreen Carapa guianensis Meliaceae Evergreen Cassipourea eliptica Rhizophoraceae Evergreen Erisma blancoa Vochysiaceae Evergreen Sacaglottis trygynum Hernandiaceae Evergreen Sterculia costaricana Sterculiaceae Brevi-deciduous Virola koschnyi Myrsticaceae Evergreen Zygia ramiflora Fabaceae Evergreen

18
Table 2-3. Correlation coefficients between leaf defensive characteristics and mean annual precipitation and lamina thickness for 32 species of lowland tropical forest canopy trees at four levels of mean annual precipitation.
Mean annual precipitation (mm yr-1)
Lamina thickness (mm)
r P r P Toughness (kg) 0.535 0.0016 0.843 <0.0001 Fiber—NDF (% dry mass) 0.127 0.490 0.356 0.0454 Fiber—ADF (% dry mass) 0.124 0.500 0.276 0.1270 Lignin (% dry mass) 0.077 0.674 0.091 0.6223 Cellulose (% dry mass) 0.168 0.358 0.434 0.0130 NDF:N 0.470 0.0067 0.674 <0.0001 ADF:N 0.438 0.0121 0.600 0.0003 Lignin:N 0.376 0.0339 0.442 0.0113
Note: Bold type indicates significant correlation.

19
J F M A M J J A S O N D J F
Ψso
il (M
Pa)
-4
-3
-2
-1
0
3500 mm3100 mm2300 mm1800 mm
2001 2002DateJ F M A M J J A S O N D J F
Soil
Gra
vim
etric
Wat
er C
onte
nt
(% o
f wet
mas
s)
20
30
40
50
60
70
80
90
100
Wet seasonDry season Dry season
Wet seasonDry season Dry season
A
B
Figure 2-1. Seasonal variation in (A) soil water potential (Ψsoil) and (B) gravimetric water
content determined between 15-20 cm depth in four 1-ha lowland tropical forest study plots in Panama. Points represent mean (±1SE) (n=6).

20
1500 2000 2500 3000 3500 4000
P area
( µm
ol O
2 m-2
s-1
)
5
10
15
20
25
30r 2 = 0.13p < 0.05
Mean annual precipitation (mm)1500 2000 2500 3000 3500 4000
P mas
s (nm
ol O
2 g-1
s-1
)
0
50
100
150
200
250
300
350r 2 = 0.42p < 0.0001
A
B
Figure 2-2. Relationship between mean annual precipitation and maximum
photosynthetic oxygen evolution rate (A) per unit area (Parea) and (B) per unit mass (Pmass) for the eight most common canopy species at four sites along a precipitation gradient in lowland Panamanian forest.

21
1500 2000 2500 3000 3500 4000
Leaf
N (m
g g-1
)
5
10
15
20
25
30
35
40
r 2 = 0.21p < 0.01
Mean annual precipitation (mm)1500 2000 2500 3000 3500 4000
δ15N
(‰)
-2
-1
0
1
2
3
4
5
6
A
B
r 2 = 0.34p < 0.001
Figure 2-3. Relationship between mean annual precipitation and (A) leaf N concentration
per unit mass and (B) N isotopic composition (δ15N) for the most common canopy species (excluding legumes) at four sites along a precipitation gradient in Panama.
22
Mean annual precipitation (mm)1500 2000 2500 3000 3500 4000
SLA
(cm
2 g-1
)
0
40
80
120
160
200
240r 2 = 0.23p = 0.005
1500 2000 2500 3000 3500 4000
Lam
ina
thic
knes
s (m
m)
0.0
0.1
0.2
0.3
0.4
0.5
0.6r 2 = 0.30p = 0.001
A
B
Figure 2-4. Relationship between mean annual precipitation and (A) lamina thickness and
(B) specific leaf area (SLA) for the eight most common canopy species at four sites along a precipitation gradient in Panama.

23
Leaf N (mg g-1)
5 10 15 20 25 30 35 40
P mas
s (nm
ol O
2 g-1
s-1
)
0
50
100
150
200
250
300
350r 2 = 0.78p < 0.0001
Log (SLA)
1.4 1.6 1.8 2.0 2.2 2.4
P mas
s (nm
ol O
2 g-1
s-1
)
0
50
100
150
200
250
300
350r 2 = 0.66p < 0.0001
Median leaf life span (days)
100 200 300 400 500 600
P mas
s (nm
ol O
2 g-1
s-1
)
0
50
100
150
200
250
300
350r 2 = 0.52p = 0.005
A
B
C
Figure 2-5. Maximum photosynthetic O2 evolution rate (Pmass) as a function of (A) leaf N
from study species at the 1800 mm (open circles), 2300 mm (open triangles), 3100 mm (closed circles), and 3500 mm (closed triangles) sites. The outlier from the 3500 mm site (Zygia ramiflora) was not included in the regression due to large studentized residuals; Pmass=95.56⋅(leaf N)–17.81. (B) Pmass as a function of log-transformed specific leaf area (SLA); Pmass=301⋅log(SLA)–429.7. (C) Pmass as a function of median leaf life span for study species at the 1800 mm (open circles) and 3100 mm (closed circles) canopy crane sites Pmass=0.53⋅(leaf life span)–314.93.
24
MonthJ J A S O N D J F M
Ψle
af (M
Pa)
-1.5
-1.0
-0.5
0.0
3100 mm predawn1800 mm predawn3100 mm midday1800 mm midday
Wet season Dry season
2001 2002
Figure 2-6. Seasonal variation in leaf water potential (Ψleaf) for canopy trees at two sites
with contrasting precipitation in lowland Panama. Each point represents the mean (±1SE) of two individuals from 6-8 species at each site.

CHAPTER 3 NUTRIENT CYCLING ON A PRECIPITATION GRADIENT IN LOWLAND
TROPICAL FOREST
Introduction
Water availability has the potential to control components of nutrient cycles, such
as nutrient pool sizes and fluxes between pools in terrestrial ecosystems. Water may
affect nutrient cycling directly through soil processes such as leaching, weathering and
decomposition of organic matter. Water may also influence nutrient cycling indirectly,
through effects on plant community composition, since many of the plant characteristics
that influence nutrient cycles, such as litter quality and productivity, vary with
precipitation. Lowland tropical forest is important in global nutrient cycles and therefore,
understanding how nutrient pool sizes and cycling respond to water availability is crucial.
Studies of nutrient cycling in humid montane tropical forest (>2000 mm precipitation
yr-1) suggest that C pool sizes increase whereas N availability decreases with increasing
precipitation (Austin and Vitousek 1998; Schuur et al. 2001; Schuur and Matson 2001).
These montane forest studies were conducted in Hawaii, where precipitation may vary
while other state factors such as parent material, species composition and temperature
remain constant (Vitousek 1995). The purpose of this study is to use a precipitation
gradient to sample patterns of nutrient cycling in lowland tropical forests that vary in soil
parent material and plant community composition.
As precipitation inputs exceed biological demand, such as in the wet tropics,
several key soil processes that influence soil nutrient cycling and storage are likely to
25
26
occur. Removal of highly mobile nutrients in the soil solution may occur via leaching, a
process that may contribute to reduced nutrient availability under conditions of high
water inputs (Radulovich and Sollins 1991; Schuur and Matson 2001). Where poorly
drained soils are prevalent, oxygen availability may limit microbial activity that
mineralizes N. Several lines of evidence also suggest that water availability may affect
soil nutrient pools by weathering soil to produce secondary minerals with a higher
surface area and thus higher capacity to adsorb organic matter (Torn et al. 1997).
Therefore, water availability has the potential to shape ecosystem nutrient dynamics
through effects on the size of soil nutrient pools and the rate at which nutrients become
available for plant uptake.
Differences in water availability also result in distinct species assemblages that
have the potential to influence nutrient cycling through effects on litter productivity and
quality. Species in low resource environments tend to minimize tissue turnover and
produce long-lived leaves with high concentrations of carbon-based defenses and slow
rates of decomposition (Chapin 1980). In contrast, species from high resource habitats
produce relatively short-lived leaves with higher photosynthetic rates and higher N
concentrations, resulting in faster decomposition rates (Chapin 1980). The influence of
litter quality in determining nutrient availability is thought to increase with actual
evapotranspiration (AET) (Meentemeyer 1978). Tropical forest has high AET, so litter
quality is expected to have a strong effect on nutrient availability. I present data on
nutrient cycling from a precipitation gradient in lowland tropical forest in Panama.
Substantial changes in species composition of canopy trees exist along this precipitation
gradient (Chapter 2). The objective was to use the precipitation gradient to sample

27
diversity of leaf phenological patterns across plant communities, which are also affected
by soil properties.
Materials and Methods
Study Site
This study was conducted in lowland tropical forest along a rainfall gradient in
Central Panama (Chapter 2). Mean annual precipitation (MAP) across these sites varied
from 1800 mm yr-1 at the driest site to approximately 3500 mm yr-1 at the wettest site
(ACP 2002). Four 1-ha lowland forest study plots established by the Center for Tropical
Forest Science (CTFS) over a range of precipitation with minimal changes in altitude and
temperature were used as study sites (Table 3-1). All sites have a mean monthly
precipitation >100 mm during the wet season between May and December, but dry
season length (mean number of 30-day periods with <100 mm precipitation) varies
between 129 days at the 1800 mm site and 67 days near the 3500 mm site (Condit 1998).
Variation in rainfall during the study period (2000-2002) was within 15% of MAP at all
sites.
The soils in the Panama Canal forests are generally well-drained and rich in clay,
Ca, Mg and N, but poor in K and P relative to other tropical soils (Dietrich et al. 1982;
Kursar et al. 1995; Yavitt et al. 1993). All of the study sites lie on volcanic substrate
except the 3100 mm site, which lies on sedimentary substrate (Table 3-1). The 1800 mm
site is derived from the early to late Oligocene, principally agglomerate, generally
andesitic in fine-grained tuff and includes stream-deposited conglomerate (Woodring et
al. 1980). Soils of the 2300 and 3500 mm sites are described as derived from altered
basaltic and andesitic lavas and tuff, including dioritic and dacitic intrusive rocks. The

28
3100 mm site is derived from the late Miocene or early Pliocene with massive, generally
fine-grained sandstone (Woodring et al. 1980).
Species composition and phenological habit of the most common canopy trees
change rapidly across this gradient as species richness increases steeply with mean annual
precipitation (Pyke et al. 2001). The dominant canopy tree species in drier forest tend to
exhibit shorter leaf life spans and a dry season deciduous leaf phenology (S.J. Wright,
unpublished data).
Foliar Chemistry
As part of a larger study on photosynthetic leaf traits of canopy tree species along
this precipitation gradient (Chapter 2), the eight canopy tree species at each site with the
largest relative proportion of basal area were studied. Young, fully-expanded mature sun
leaves were collected from 2-4 individuals for a total of 15 leaves per species from a site.
Leaves were collected using canopy cranes maintained by the Smithsonian Tropical
Research Institute at the 1800 and 3100 mm sites. At the 2300 and 3500 mm sites, leaves
were collected from the upper canopy using a shotgun. Leaf material was dried for 48 h.
at 65°C. Leaf samples from the same tree were pooled for chemical analysis. One
composite sample from each tree was analyzed for C and N using an elemental analyzer
(Model NCS 2500, Carlo Erba, Milano, Italy).
Litterfall Collection and Processing
Litter was collected in 0.25 m2 traps randomly located at 20X20-m grid points in
each 1 ha plot. Large items, such as palm fronds often fell across traps and only material
that fell in the area above the trap was collected. Litter was collected 11 times at intervals
ranging from 1 to 12 weeks for the period between February 2001 and February 2002.
Litter used in chemical analyses was collected at intervals of 7-10 days in February-June
29
2001, October 2001, and February 2002. Litter collected at intervals >2 weeks were
adjusted for mass loss within traps using decomposition data from the 3100 mm site
(Chapter 5), and were not used in chemical analyses. Litter was sorted into four classes:
(1) fine woody debris ≤1 cm in diameter; (2) leaves; (3) reproductive structures including
fruits, flowers and seeds; and (4) other components of litterfall including insects, frass,
canopy soil, and items too decomposed to identify. Litter was dried for 48 hours at 65°C
and the separate classes were weighed. Entire samples from each site and pickup date
were ground in a Wiley mill (mesh size 40) and homogenized. A 120-ml subsample was
then retained for further chemical analyses.
Leaf Litter Chemistry
Leaf carbon fraction analyses were performed using a series of increasingly
aggressive extractants (Ryan et al. 1989). Dried, ground litter samples were digested in a
detergent solution to separate labile cell contents from neutral detergent fiber (NDF),
which includes all cell wall components. A dilute acid detergent solution was then used
to determine acid detergent fiber (ADF, lignocellulose) before cellulose was separated
from lignin and insoluble ash in 72% H2SO4. Litter C and N concentrations were
determined with an elemental analyzer (Model ECS 4010, Costech, Valencia, CA).
Isotopic ratios of C (δ13C) and N (δ15N) were determined with a continuous flow isotope
ratio mass spectrometer (Model Delta plus XL, Thermo Finnigan, Germany).
Nutrient Availability
Extractable nitrogen and phosphorus
Soil cores were taken at each of the four sites in July 2002, approximately 2 months
after the beginning of the 8-month wet season when nutrient availability is expected to be

30
highest. Six 10 cm deep soil samples were taken with a slide hammer corer at random
locations in each 1 ha plot. Samples were returned to the lab and hand sorted to remove
roots and rocks, and three subsamples were taken. Weakly sorbed P from the first 10 g
subsample was extracted in 50 ml 0.5 M NaHCO3 (Crews et al. 1995; Miller et al. 2001).
Extracts were shaken for one minute and after 24 h a 10-ml sample of the supernatant
was removed and frozen until transported to the University of Florida for analysis. I
extracted NH4 and NO3 from the second 10-g subsample for 24 h in 50 ml 2 M KCl.
Nitrogen mineralization and nitrification
The third 10-g subsample of each core was weighed into a 100-ml sample cup,
covered, and allowed to incubate aerobically for 10 days in a dark cabinet at 24°C. After
10 days, incubated samples were extracted in 2M KCl as described above and the
difference in NO3 and NH4 was recorded as net mineralization (Riley and Vitousek
1995).
Ion exchange resins
Soil nutrient availability was determined with ion exchange resins (Binkley and
Matson 1983). Three grams of anion exchange resin (Biorad, AG 1-X8, 20-50 mesh, Cl-
form) and the same amount of cation exchange resin (Biorad, AG 50W-X8 20-50 mesh,
H+ form) were weighed into separate 5X6 cm undyed monopolyester bags (approx. 190
µm mesh size). At each of the four sites, resin bags were placed vertically 4 to 7 cm deep.
One anion and one cation resin bag were secured to a plastic stake with monofilament
line at 6 random locations in each 1 ha plot. Resin bags were collected from the field after
21 days and rinsed with DI water to remove soil particles. Ions were extracted with 20 ml
of 0.5 M HCl and then neutralized with 20 ml of 0.5 M NaOH. PO4 and NO3 from anion

31
extracts and NH4, K, Ca and Mg from cation extracts were measured colorimetrically
using an autoanalyzer at the University of Florida, Food and Agricultural Sciences Soils
Testing Lab to determine nutrient content per bag.
Soil nutrient pools
The remaining sample of each soil core was dried at 50°C for 48 h, and sifted to
pass through a 2-mm sieve. Total soil C and N as well as δ13C and δ15N were analyzed on
an elemental analyzer (Model ECS 4010, Costech) connected to a continuous flow
isotope ratio mass spectrometer (Model Delta plus XL, Thermo Finnigan, Germany).
Bulk density of surface 10 cm was estimated using 5 cm diameter volumetric cores dried
at 105°C. Soil moisture was determined gravimetrically on bulk density samples and
expressed as grams of water per unit mass of dry soil.
Results
Foliar Chemistry
Foliar N of the eight most common canopy tree species was highest at the 1800 mm
site and lowest at the 3100 mm site, showing a general decrease in foliar N as
precipitation increases (Table 3-2). In contrast, foliar C values were similar at all sites.
Foliar C:N of the eight most common canopy tree species decreased significantly with
increasing precipitation (r2=0.32; P<0.001), and was largely driven by changes in N.
Litter Production and Chemistry
Total litter production varied from 12.47 Mg ha-1 yr-1 at the 1800 mm site to 9.80
Mg ha-1 yr-1 at the 3500 mm site. Fine woody litterfall represented 11-17% of total litter
and was about 20% higher at the two wetter sites (Table 3-3). Leaf litter represented 60-
75% of total litter and was 45% higher at the 1800 mm site than the other three sites
(Table 3-3). Reproductive structures comprised 7-15% of total litter fall and showed no

32
clear pattern with precipitation (Table 3-3). Other litter components were 5-9% of total
litter production (Table 3-3). Litterfall rates were seasonal with more litter falling during
the dry season, and seasonal differences between maximum and minimum litterfall rates
decreased with increasing precipitation (Figure 3-1).
There was significant variation in mean litter N concentration of leaf litter with
precipitation (F=5.07; P<0.05) and values tended to increase with increasing
precipitation (Table 3-3). There was also significant variation in litter δ15N among sites
with different soil parent material (Table 3-3; F=28.05; P<0.0001), but values did not
vary in any predictable manner with precipitation. Litter δ13C decreased linearly with
increasing precipitation indicating greater integrated water use efficiency of leaves in
drier forest (Figure 3-2). Litter C increased (F=33.01; P<0.0001) with increasing
precipitation and may be related to variation in litter lignin concentration among sites
(Table 3-3; F=11.76; P<0.001). Litter lignin:N significantly increased with increasing
precipitation (F=3.74; P<0.05) whereas cellulose concentration showed no significant
variation with precipitation (Table 3-3).
Nutrient Availability
Extractable nitrogen and phosphorus
Extractable P was significantly higher at the driest site than at the three wetter sites
(Table 3-4; F=3.50; P<0.05). Extractable NO3 was significantly higher at the wettest site
than at the three drier sites (Table 3-4; F=4.80; P<0.05). Extractable NH4, net N
mineralization and nitrification showed no clear pattern with precipitation (Table 3-4),
but N mineralization decreased linearly with increasing litter lignin:N (Figure 3-3)
indicating an effect of litter quality on N availability.

33
Ion exchange resins
Resin exchangeable NO3 was about 420% higher at the two sites on pre-tertiary
basalt (2300 and 3500 mm sites) compared to the other two sites (Table 3-4; F=5.81,
P<0.01). There were no clear patterns in exchangeable NH4 or K, but exchangeable Ca
decreased 76% from the driest to wettest sites (Table 3-4; F=11.75; P<0.0005) and
measurable quantities of exchangeable Mg were only detected at the driest site (Table
3-4).
Soil nutrient pools
Total soil N and C pools of the top 10 cm were higher at the two wetter sites than at
the two drier sites (Table 3-5). Soil N showed an exponential increase in relation to litter
lignin concentration (Figure 3-4A) and a strong linear increase in relation to litter
lignin:N (Figure 3-4B) suggesting that lignin-bound proteins in the soil organic matter
matrix comprise a large part of the total soil N pool. Soil δ13C and δ15N were more
enriched than litter inputs, possibly due to faster turnover of lighter isotopes (Figure 3-2;
Table 3-5) (Nadelhoffer and Fry 1988). Soil bulk density decreased with increasing
precipitation (Table 3-6).
Discussion
Foliar Chemistry
Our results suggest that patterns of foliar C per unit N reflect changes in species
composition across this precipitation gradient. Decreasing foliar N of canopy species may
reflect increased allocation of carbon-based leaf defenses to canopy leaves in association
with longer leaf life spans in wetter forest. Decreasing foliar N with increasing
precipitation does not appear to be caused by reduced N availability with increasing
precipitation as has been observed on rainfall gradients in Hawaii given that soil N

34
availability did not decrease with increasing precipitation. This pattern, whether driven
by photosynthetic or anti-herbivore allocation patterns, may provide an important
feedback to nutrient availability by affecting litter quality since litter C:N is negatively
correlated with decomposition rate (Chapter 5).
Litter Production and Chemistry
Patterns of litterfall suggest that the driest site may be slightly more productive than
wetter forests. The primary differences are greater leaf litter production and stronger
seasonality from the 1800 mm site, which has the highest proportion of dry season
deciduous tree species. Therefore increased leaf litter production at the driest site may be
the result of increased leaf turnover. However, in order to understand the extent to which
productivity is regulated by water availability, other components of productivity such as
root growth, trunk growth and respiration need to be incorporated. Nonetheless, litterfall
is often the greatest fraction of productivity (Clark et al. 2001a). Several recent studies
have also revealed that productivity in humid tropical forest may actually decline at high
annual precipitation (>2500 mm) (Clark et al. 2001b; Schuur and Matson 2001).
Therefore, assuming that all sites are at steady state, the result reported here is consistent
with reduced ecosystem productivity at extremely high precipitation in the tropics due to
light or nutrient limitation (Schuur and Matson 2001).
The reduction in leaf litter quality with increasing precipitation suggests that
nutrient mineralization slows with increasing precipitation. Because fine root litter
quality may respond similarly to leaves (Ostertag 2001), belowground litter may
contribute to reduced nutrient mineralization in sites with lower litter quality (Figure 3-
3). Decomposition rates at the 3100 mm site decrease substantially with increases in litter
lignin:N (r2=0.38; P<0.05; Chapter 5). Changes in litter lignin and lignin:N suggest that

35
compound specific changes in litter quality may be important across this gradient. The
increase in lignin suggests that a higher proportion of litter will enter directly into the
slow decomposing pool or organic matter (Vitousek et al. 1994). This is a potential
explanation for the increase in soil C and N storage with increasing precipitation and
decreasing litter quality.
Nutrient Availability
The availability of P, Ca and Mg varied in relation to precipitation, whereas N
appeared more responsive to parent material. Decreasing available P, Ca and Mg with
increasing precipitation is consistent with the observation that weathering can leach these
elements from the soil profile and reduce availability to plants. Relatively high P
availability at the 1800 mm site may contribute to higher litterfall productivity, since P is
often considered to be the most limiting nutrient in lowland tropical forest, and both P
availability and litterfall productivity are highest at the 1800 mm site and relatively low at
all other sites. However, litterfall is extremely variable and measurements over several
years are needed to determine if this trend is robust.
In contrast to P, N appeared to be under stronger regulation of parent material
with both sites on tertiary basalt exhibiting high exchangeable NO3. Both Austin and
Vitousek (1998) and Schuur and Matson (2001) found decreasing N availability with
increasing precipitation in Hawaiian montane forests in sites with consistent parent
material. Our results suggest that parent material may alter the relationship between
precipitation and N availability in tropical forest.
The results of increasing total soil N and C with increasing precipitation support
the notion that soil organic matter increases with increasing precipitation in humid forest
(Schuur et al. 2001). Soil N pools in this part of Panama are high relative to both

36
temperate and montane tropical forest (Austin and Vitousek 1998; Schuur and Matson
2001; Vitousek and Sanford 1986). The increases in soil N and C pools with increasing
litter lignin and litter lignin:N suggest that lower quality litter may function to increase
soil organic matter accumulation. Since soil waterlogging appears to be of minimal
importance in these study sites, the observed increase in soil organic matter with
increased precipitation may reflect an indirect effect of precipitation on species
composition with more evergreen species producing lower quality litter as precipitation
increases.
Total soil N increases as a function of litter lignin:N, whereas soil N
mineralization rates decrease with increasing litter lignin:N (Figure 3-3) (Scott and
Binkley 1997). Therefore, as lignin:N increases, it appears that a higher proportion of soil
N is tightly held in the organic matter matrix and the mineralization rate of that N is
slower. Lower litter quality may function as an N conservation mechanism to prevent N
losses through leaching by decreasing the rate of organic N reactivity.
Conclusions
Overall, the results suggest that variation in plant community composition along
this precipitation gradient can have substantial effects on soil nutrient pools and on how
nutrients are cycled by vegetation. Several general patterns, such as decreasing litter
quality and decreasing soil availability of PO4, Ca and Mg with increasing precipitation
appear to corroborate patterns described for island ecosystems. Despite the diversity of
soil substrates and plant community compositional changes across even short distances in
Panama, there appear to be some patterns of C and N cycling and accumulation that are
consistent with previous findings in Hawaiian ecosystems, where greater control over soil
and species has generated theoretical predictions. Clearly, reduced litter quality and

37
increased soil nutrient pools with increasing precipitation, which I have shown to be
related, are two components of nutrient cycling that vary similarly in Panamanian
lowland forest and Hawaiian montane forest. However, other patterns of N cycling are
more strongly related to soil parent material than precipitation, making some predictions
developed in relatively homogeneous island systems more difficult to apply in more
heterogeneous landscapes. Further studies in lowland continental tropical forest are likely
to contribute to our understanding of nutrient cycling in humid ecosystems and dispel
myths or corroborate patterns observed in model island systems.
38
Table 3-1. Characteristics of sites along precipitation gradient across the Isthmus of Panama.
Site CTFS plot codea
Mean annual precipitation (mm)
Parent materialb Order Suborder
Parque Metropolitano PM 1800 Panama formation Ultisol Ustult Pipeline Road 8 2300 Pre-Tertiary basalt Ultisol Humult Fort Sherman S3 3100 Chagres Sandstone Histosol Saprist Santa Rita 31 3500 Pre-Tertiary basalt Ultisol Humult aPike et al. (2001) bWoodring et al. (1980) Table 3-2. Percentage of N and C in canopy sun leaves from the eight most common
canopy tree species across a precipitation gradient in lowland forest in Panama (Chapter 2). Values are means ± 1 SE. (n=8)
Site Foliar N (%) Foliar C (%) 1800 mm 2.26a ± 0.24 49.02a ± 0.83 2300 mm 2.01ab ± 0.20 47.72a ± 1.57 3100 mm 1.43b ± 0.12 49.24a ± 1.10 3500 mm 1.64ab ± 0.28 49.42a ± 1.08
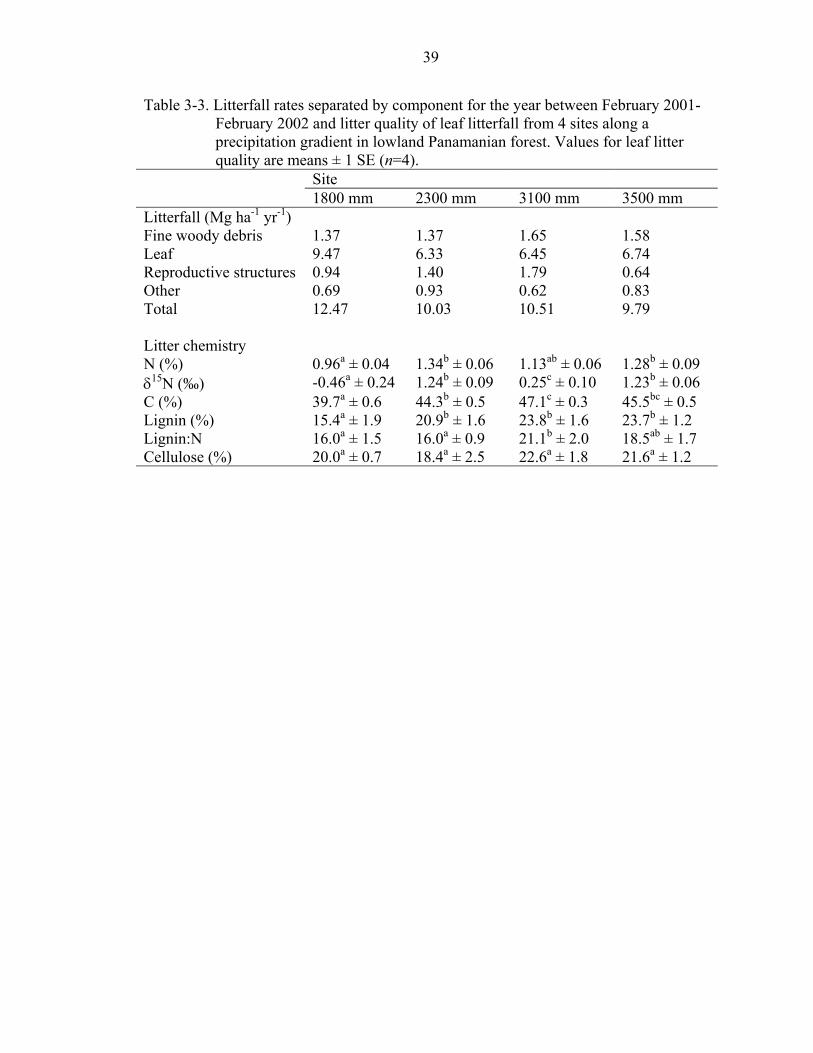
39
Table 3-3. Litterfall rates separated by component for the year between February 2001-February 2002 and litter quality of leaf litterfall from 4 sites along a precipitation gradient in lowland Panamanian forest. Values for leaf litter quality are means ± 1 SE (n=4).
Site 1800 mm 2300 mm 3100 mm 3500 mm Litterfall (Mg ha-1 yr-1) Fine woody debris 1.37 1.37 1.65 1.58 Leaf 9.47 6.33 6.45 6.74 Reproductive structures 0.94 1.40 1.79 0.64 Other 0.69 0.93 0.62 0.83 Total 12.47 10.03 10.51 9.79 Litter chemistry N (%) 0.96a ± 0.04 1.34b ± 0.06 1.13ab ± 0.06 1.28b ± 0.09 δ15N (‰) -0.46a ± 0.24 1.24b ± 0.09 0.25c ± 0.10 1.23b ± 0.06 C (%) 39.7a ± 0.6 44.3b ± 0.5 47.1c ± 0.3 45.5bc ± 0.5 Lignin (%) 15.4a ± 1.9 20.9b ± 1.6 23.8b ± 1.6 23.7b ± 1.2 Lignin:N 16.0a ± 1.5 16.0a ± 0.9 21.1b ± 2.0 18.5ab ± 1.7 Cellulose (%) 20.0a ± 0.7 18.4a ± 2.5 22.6a ± 1.8 21.6a ± 1.2

40
Table 3-4. Soil chemistry to a depth of 10 cm. Values with different letters are significantly different at a P-value of 0.1.
Site 1800 mm 2300 mm 3100 mm 3500 mm Extractable nutrients (mg kg-1)
P 5.26a ± 0.78 3.21b ± 0.53 2.85b ± 0.77 3.33b ± 0.36 NO3 0.07a ± 0.08 0.73a ± 0.61 0.23a ± 0.25 3.73b ± 1.59 NH4 2.73a ± 1.19 2.95a ± 0.28 3.91a ± 0.40 4.73a ± 0.85 Net N nitrification (mg kg-1 d-1)
0.71a ± 0.20 1.13a ± 0.21 0.57a ± 0.20 0.94a ± 0.43
Net N mineralization (mg kg-1 d-1)
0.74a ± 0.18 1.17a ± 0.17 0.35b ± 0.15 0.74a ± 0.38
Exchangeable nutrients (mg kg resin-1 21 d-1)
NO3 2.34a ± 1.46 14.75b ± 1.80 3.82a ± 2.10 17.4b ± 5.20 NH4 0.47a ± 0.08 0.55a ± 0.10 0.50a ± 0.02 0.54a ± 0.01 PO4 8.01a ± 2.01 0.30b ± 0.10 0.33b ± 0.04 0.10b ± 0.03 K 671a ± 67 491b ± 13 470b ± 14 570ab ± 33 Ca 41.11a ± 8.45 21.96b ± 5.57 3.38c ± 0.93 9.93bc ± 0.41 Mg 3.56a ± 1.74 < 0.01b < 0.01b < 0.01b

41
Table 3-5. Bulk soil chemistry from the surface 10 cm of soil. Values with a different letters are significantly different (P<0.05; n=6)
Site Total C (g/kg)
Total N (g/kg)
Bulk δ15N (‰)
X ± 1 SE X ± 1 SE X ± 1 SE 1800 mm 25.21a ± 2.79 2.86a ± 0.81 2.99a ± 0.61 2300 mm 28.60ab ± 3.12 2.73a ± 0.17 6.57b ± 0.58 3100 mm 70.66c ± 5.40 5.25b ± 0.45 4.06c ± 0.64 3500 mm 39.57b ± 4.76 3.90ab ± 0.36 5.67d ± 0.72
Table 3-6. Soil bulk density and water content in the surface 10 cm of soil. Values are means (± 1 SE) of averages measured using 6 samples per site during the early wet season of 2002.
Site Soil bulk density (g cm-3) Water content (g g-1) 1800 mm 0.92 ± 0.02 0.53 ± 0.02 2300 mm 0.73 ± 0.03 0.58 ± .001 3100 mm 0.51 ± 0.02 0.82 ± 0.02 3500 mm 0.60 ± 0.02 0.98 ± .006

42
Mean Annual Precipitation1500 2000 2500 3000 3500 4000
Max
-min
litte
rfall
rate
10
15
20
25
30
35
40
45
r 2 = 0.98
Figure 3-1. The difference between seasonal maximum and minimum litterfall rates as a
function of mean annual precipitation for four forest sites along a precipitation gradient in lowland Panama. Values are means (n=11).
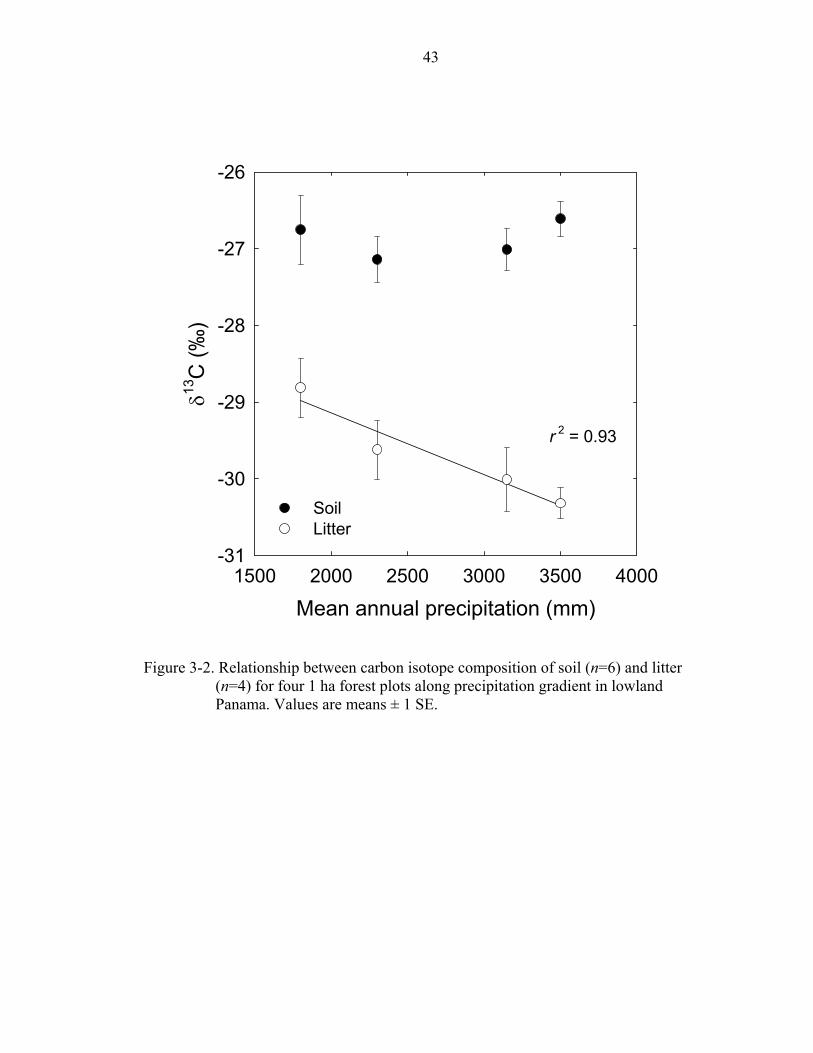
43
Mean annual precipitation (mm)1500 2000 2500 3000 3500 4000
δ13C
(‰)
-31
-30
-29
-28
-27
-26
SoilLitter
r 2 = 0.93
Figure 3-2. Relationship between carbon isotope composition of soil (n=6) and litter
(n=4) for four 1 ha forest plots along precipitation gradient in lowland Panama. Values are means ± 1 SE.

44
Litter lignin:N14 16 18 20 22 24
N m
iner
aliz
atio
n ra
te
(mg
kg-1
)
0.00
0.25
0.50
0.75
1.00
1.25
1.50r 2 = 0.77
Figure 3-3. Soil N mineralization rates for the top 10 cm (n=6) as a function of litter
lignin to N ratio (n=4) for four forest sites in lowland Panama that vary in mean annual precipitation: 1800 mm (open circle); 2300 mm (open triangle); 3100 mm (closed circle); 3500 mm (closed triange). Values are means ± 1 SE.

45
Litter Lignin (%)12 14 16 18 20 22 24 26
Soil
N (g
kg-1
)
1
2
3
4
5
6
Litter Lignin:N12 14 16 18 20 22 24
Soil
N (g
kg-1
)
1
2
3
4
5
6
r 2 = 0.99
r 2 = 0.81
A
B
Figure 3-4. Soil N concentration as a function of (A) litter lignin and (B) litter lignin to N
ratio for four forest study sites in lowland Panama. Values are means ± 1 SE. Symbols as in Figure 3-3.
CHAPTER 4 HYDRAULIC CONDUCTIVITY AND WOOD DENSITY SCALE WITH LEAF PHOTOSYNTHETIC TRAITS IN PANAMANIAN FOREST CANOPY TREES
Introduction
Species often exhibit substantial variation in rates of carbon gain and resource use.
In species-rich tropical forests, the extent to which observed patterns of resource
utilization and carbon gain are species-specific is uncertain. Results of recent studies
point to substantial convergence in plant functioning among species from diverse biomes
(Reich et al. 1997). For example, maximum photosynthetic rates, stomatal conductance,
and leaf surface area per unit mass (specific leaf area; SLA) are positively correlated and
tend to decrease with increasing leaf life span across a wide array of study sites and
angiosperm taxa (Ackerly and Reich 1999; Reich et al. 1999; Reich et al. 1997).
However, within sites, variation in photosynthetic rate and leaf life span is as great or
greater than variation in mean differences among biomes (Reich et al. 1999).
Understanding hydraulic properties of the branch or whole plant scale may explain
additional within-site variation in leaf characteristics among individuals and species
(Meinzer and Goldstein 1996).
Convergence in regulation of carbon economy at the leaf level may also be related
to the life history features of a species. Photosynthesis, SLA, and leaf nitrogen
concentration are generally related to rapid growth, high allocation to photosynthetic
tissue, early attainment of reproductive age, and regeneration in high resource habitats
(Cornelissen et al. 1997; Poorter and Remkes 1990; Reich et al. 1992; Wright and
46
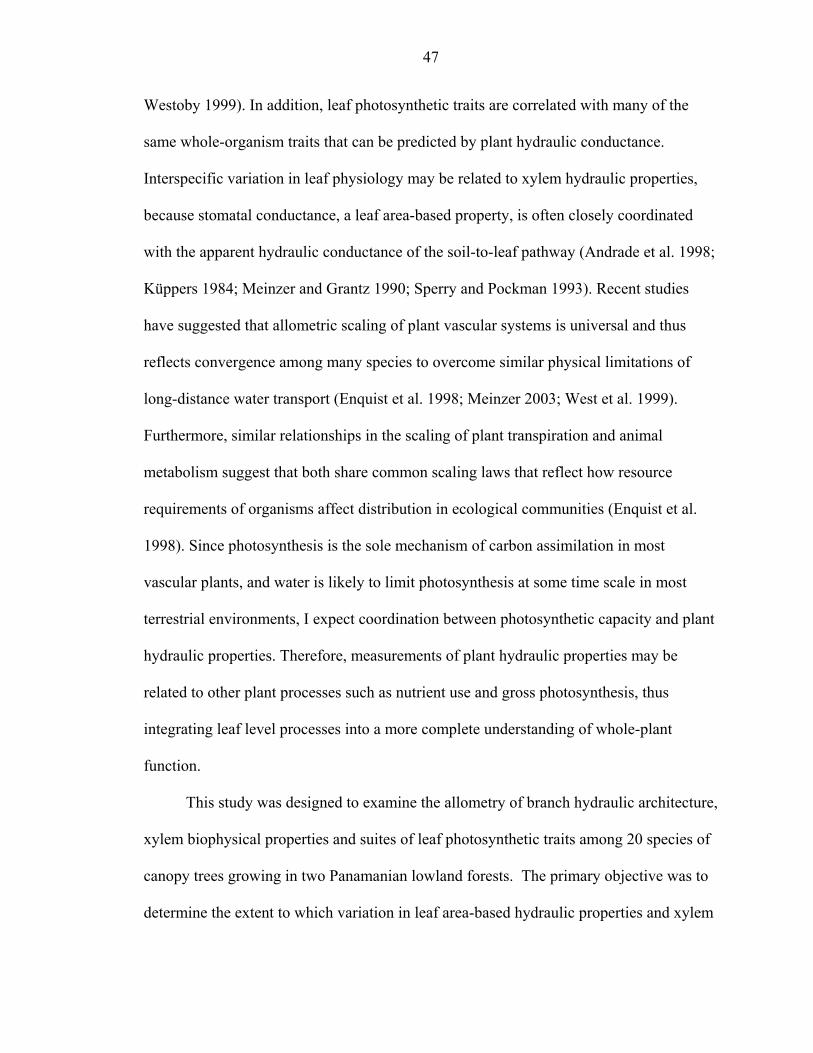
47
Westoby 1999). In addition, leaf photosynthetic traits are correlated with many of the
same whole-organism traits that can be predicted by plant hydraulic conductance.
Interspecific variation in leaf physiology may be related to xylem hydraulic properties,
because stomatal conductance, a leaf area-based property, is often closely coordinated
with the apparent hydraulic conductance of the soil-to-leaf pathway (Andrade et al. 1998;
Küppers 1984; Meinzer and Grantz 1990; Sperry and Pockman 1993). Recent studies
have suggested that allometric scaling of plant vascular systems is universal and thus
reflects convergence among many species to overcome similar physical limitations of
long-distance water transport (Enquist et al. 1998; Meinzer 2003; West et al. 1999).
Furthermore, similar relationships in the scaling of plant transpiration and animal
metabolism suggest that both share common scaling laws that reflect how resource
requirements of organisms affect distribution in ecological communities (Enquist et al.
1998). Since photosynthesis is the sole mechanism of carbon assimilation in most
vascular plants, and water is likely to limit photosynthesis at some time scale in most
terrestrial environments, I expect coordination between photosynthetic capacity and plant
hydraulic properties. Therefore, measurements of plant hydraulic properties may be
related to other plant processes such as nutrient use and gross photosynthesis, thus
integrating leaf level processes into a more complete understanding of whole-plant
function.
This study was designed to examine the allometry of branch hydraulic architecture,
xylem biophysical properties and suites of leaf photosynthetic traits among 20 species of
canopy trees growing in two Panamanian lowland forests. The primary objective was to
determine the extent to which variation in leaf area-based hydraulic properties and xylem

48
biophysical properties can explain variation in leaf gas exchange characteristics. Specific
questions included: 1) Does allocation to leaf photosynthetic capacity correspond to
capacity for hydraulic water supply? 2) Is hydraulic conductivity correlated with
physiological leaf traits such as life span, nitrogen concentration and water use
efficiency? 3) Does wood density constrain hydraulic conductivity to affect leaf gas
exchange? 4) Can photosynthetic traits be predicted from xylem biophysical properties?
Materials and Methods
Study Site and Species
The study was conducted from two canopy cranes operated by the Smithsonian
Tropical Research Institute (STRI) in the Republic of Panama. Each crane is equipped
with a gondola suspended by cables from a rotating boom that allows coverage of
approximately 0.82 ha of forest. One crane is located in Parque Metropolitano, a
secondary dry forest on the edge of Panama City that receives approximately 1800 mm of
precipitation annually with a distinct dry season between December and April (Condit
1998). The other crane is located in an old-growth forest at Fort Sherman on the
Caribbean side of the Panamanian Isthmus where mean annual precipitation is 3100 mm
and the dry season is shorter and less intense than at Parque Metropolitano. During the
dry season of 2002 (Feb-Mar), physiological and morphological characteristics in the
upper crown of one to four individuals of 20 canopy tree species were measured. Both
rare and common species were included in the study (Table 4-1). I measured at least five
sun-exposed terminal branches in all species. In rare species with only one individual at
the study site, sample branches were taken from different portions of the crown.

49
Gas Exchange Measurements
Maximum rates of net CO2 assimilation (A) and stomatal conductance (gs) were
measured with a portable photosynthesis system (Model 6400, Li-Cor, Inc., Lincoln, NE,
USA) between 0700 and 1100 h. Two to four newly formed mature leaves per branch
were measured at 400 µmol CO2, and 1200 µmol m-2 s-1 photosynthetic photon flux
density (PPFD) provided by a red blue light source (model 6400-02B #SI-710, Li-Cor,
Inc.). Only gas exchange values measured at a leaf to air vapor pressure deficit (VPDl)
below 1.5 kPa were used because significant stomatal closure above this value was
observed.
Hydraulic Conductivity
Hydraulic conductivity (kh) was measured on twigs excised from 1.0-1.5-m- long
branches. Branches were longer than the measured maximum vessel length determined
by the air pressure technique (Ewers and Fisher 1989). Upper crown branches exposed to
full sun were cut directly after gas exchange measurements on days with similar
environmental conditions and transported to the laboratory. In the laboratory, the first
fully developed twigs supporting the leaves on which gas exchange was measured were
excised from the rest of the branch under filtered water (0.2 µm) to prevent xylem
embolism. After removing 3 to 4 mm of bark from each end, the cut ends were shaved
with Teflon coated razor blades and connected to the hydraulic conductivity apparatus
(Sperry et al. 1988). Pith areas were plugged with plasticine when necessary. The
hydraulic conductivity apparatus consisted of a beaker supplying filtered (0.2 µm) water
under low (1.4 kPa) gravitational pressure to the stem. A low hydraulic head insured no
embolisms were removed and the apparatus was frequently flushed with 10% bleach

50
solution to avoid microbial growth. Flow rates were determined volumetrically 5-15
minutes after connection when they became steady. Initial kh was estimated as the rate of
water flux (J, mmol s-1) in a stem when a pressure gradient (dP/dx, MPa m-1) was applied
across the stem
kh = J /(dP/dx). (4-1)
Maximum kh was measured after a 20-min high-pressure flush from a captive air
tank when flow rates reached steady values. After hydraulic measurements, stem length,
xylem diameter and pith diameter were measured for the calculation of kh and specific
conductivity (ks), kh per unit xylem area. Leaf area distal to the branch segment where kh
was measured was recorded with a leaf area meter (model LI-3100, Li-Cor Inc.), and
used to calculate leaf specific conductivity (LSC), kh per unit leaf area.
Wood Density
After conductivity measurements, outer bark, phloem and pith were removed from
sample stems, wet mass was determined and stems were dried for 48 h at 65°C and
weighed to determine the saturated water content (SWC). Wood density was measured as
the ratio of xylem dry mass to xylem volume. Percent loss of conductivity (PLC) was
calculated from the ratio of initial to maximum kh.
Foliar Analysis
After measurement of their area, gas exchange leaves were dried for 48 h at 65°C
and weighed for the determination of specific leaf area (SLA; cm2 g-1) so that
photosynthesis could be calculated both on a unit leaf area and leaf mass basis. Leaves
were ground in a Wiley mill and one composite sample per branch was analyzed for total
leaf nitrogen and carbon isotope discrimination (δ13C) on an elemental analyzer
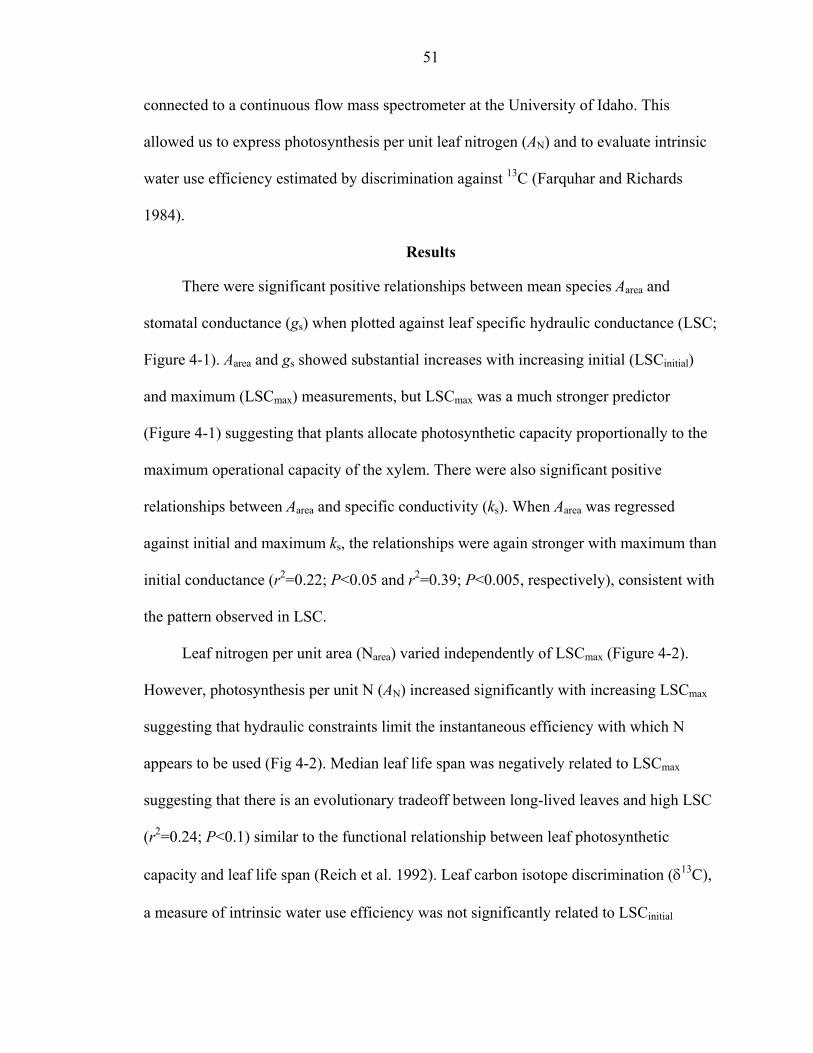
51
connected to a continuous flow mass spectrometer at the University of Idaho. This
allowed us to express photosynthesis per unit leaf nitrogen (AN) and to evaluate intrinsic
water use efficiency estimated by discrimination against 13C (Farquhar and Richards
1984).
Results
There were significant positive relationships between mean species Aarea and
stomatal conductance (gs) when plotted against leaf specific hydraulic conductance (LSC;
Figure 4-1). Aarea and gs showed substantial increases with increasing initial (LSCinitial)
and maximum (LSCmax) measurements, but LSCmax was a much stronger predictor
(Figure 4-1) suggesting that plants allocate photosynthetic capacity proportionally to the
maximum operational capacity of the xylem. There were also significant positive
relationships between Aarea and specific conductivity (ks). When Aarea was regressed
against initial and maximum ks, the relationships were again stronger with maximum than
initial conductance (r2=0.22; P<0.05 and r2=0.39; P<0.005, respectively), consistent with
the pattern observed in LSC.
Leaf nitrogen per unit area (Narea) varied independently of LSCmax (Figure 4-2).
However, photosynthesis per unit N (AN) increased significantly with increasing LSCmax
suggesting that hydraulic constraints limit the instantaneous efficiency with which N
appears to be used (Fig 4-2). Median leaf life span was negatively related to LSCmax
suggesting that there is an evolutionary tradeoff between long-lived leaves and high LSC
(r2=0.24; P<0.1) similar to the functional relationship between leaf photosynthetic
capacity and leaf life span (Reich et al. 1992). Leaf carbon isotope discrimination (δ13C),
a measure of intrinsic water use efficiency was not significantly related to LSCinitial
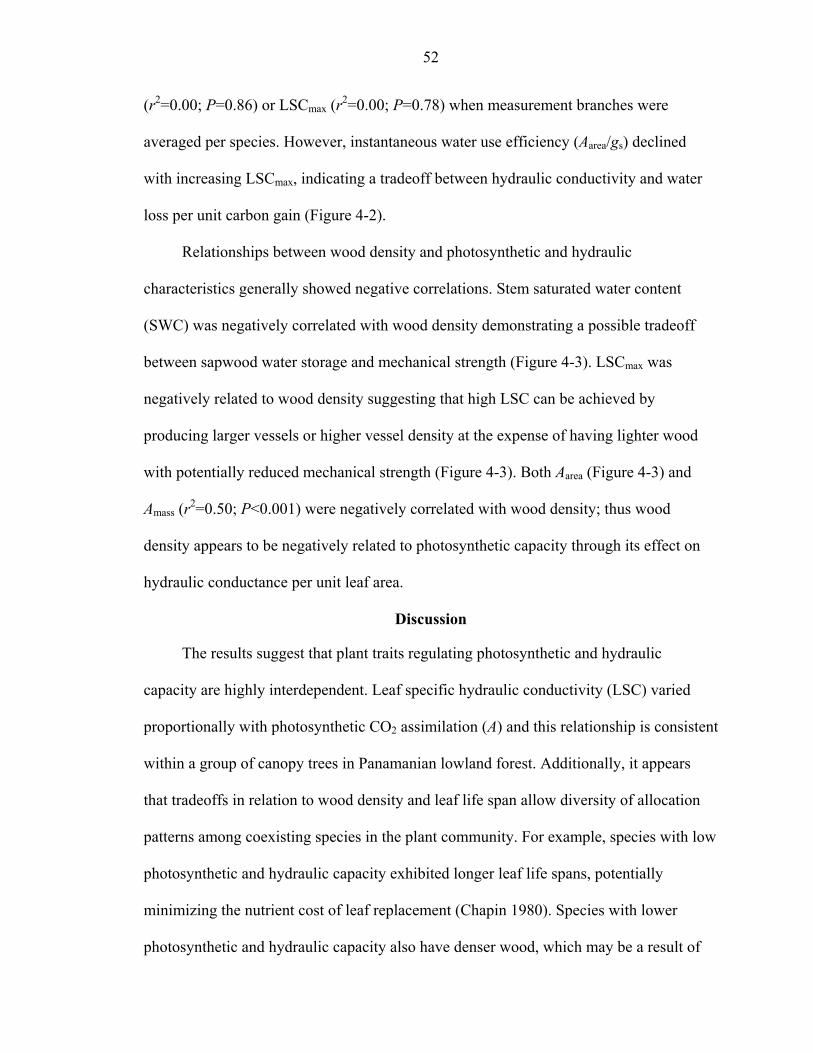
52
(r2=0.00; P=0.86) or LSCmax (r2=0.00; P=0.78) when measurement branches were
averaged per species. However, instantaneous water use efficiency (Aarea/gs) declined
with increasing LSCmax, indicating a tradeoff between hydraulic conductivity and water
loss per unit carbon gain (Figure 4-2).
Relationships between wood density and photosynthetic and hydraulic
characteristics generally showed negative correlations. Stem saturated water content
(SWC) was negatively correlated with wood density demonstrating a possible tradeoff
between sapwood water storage and mechanical strength (Figure 4-3). LSCmax was
negatively related to wood density suggesting that high LSC can be achieved by
producing larger vessels or higher vessel density at the expense of having lighter wood
with potentially reduced mechanical strength (Figure 4-3). Both Aarea (Figure 4-3) and
Amass (r2=0.50; P<0.001) were negatively correlated with wood density; thus wood
density appears to be negatively related to photosynthetic capacity through its effect on
hydraulic conductance per unit leaf area.
Discussion
The results suggest that plant traits regulating photosynthetic and hydraulic
capacity are highly interdependent. Leaf specific hydraulic conductivity (LSC) varied
proportionally with photosynthetic CO2 assimilation (A) and this relationship is consistent
within a group of canopy trees in Panamanian lowland forest. Additionally, it appears
that tradeoffs in relation to wood density and leaf life span allow diversity of allocation
patterns among coexisting species in the plant community. For example, species with low
photosynthetic and hydraulic capacity exhibited longer leaf life spans, potentially
minimizing the nutrient cost of leaf replacement (Chapin 1980). Species with lower
photosynthetic and hydraulic capacity also have denser wood, which may be a result of

53
smaller diameter vessels that constrain maximum xylem conductance but also allow
increased biomechanical support and an increased xylem pressure threshold (Hacke et al.
2001). Furthermore, species with lower photosynthetic and hydraulic capacity show
evidence of higher water use efficiency, thus tradeoffs result in several solutions to
balancing carbon gain with water loss. These results indicate that understanding xylem
hydraulic capacity adds information to leaf level measurements when comparing species
and links photosynthetic allocation patterns with processes at the branch and whole
organism levels of organization.
The relationship between photosynthesis and hydraulic conductance reflects a
balance between carbon gain and water loss, thus the primary feature regulated by LSC is
probably stomatal conductance (gs), and therefore transpiration. Species usually have
specific operating ranges or minimum values of leaf water potential governed by stomatal
regulation (Meinzer and Grantz 1991). Thus, if LSC increases as a result of partial
defoliation or leaf shading, gs usually increases, but leaf water potential remains about the
same because the transpiration/LSC relationship is conserved (Meinzer and Grantz 1991;
Pataki et al. 1998). Therefore, the coordination of photosynthetic and hydraulic capacity
may be more a consequence of the often reported coupling of A and gs, and of gs with
LSC rather than a direct relationship between A and LSC. A appears to belong to a suite
of coordinated characteristics related to plant hydraulic architecture and wood density.
High rates of photosynthesis in relation to LSC will not impair plant functioning, but
excessive transpiration can result in xylem cavitation and turgor loss. Therefore, the data
showing proportional allocation to photosynthetic and hydraulic capacity may mean that
54
species only invest in transport capacity that can be supported without experiencing
physiological damage.
Understanding the contributions of individual species to productivity and resource
use in species-rich tropical forest is challenging. Previous attempts to understand and
model inter-species physiological variation have involved dividing species into discrete
functional groups. Recent studies of regulation of water use among diverse tropical forest
canopy tree species have shown that contrasting patterns of regulation at the leaf level
tend to converge when appropriate scaling and normalizing factors are applied (Andrade
et al. 1998; Goldstein et al. 1998; Meinzer et al. 1997). The data suggest that continuous
scaling relationships work to collapse inter-species variation into functional relationships
that reflect plant capacity for carbon gain and tradeoffs that allow a broad spectrum of
capacities. Therefore, understanding where a species falls along a functional evolutionary
tradeoff continuum may be more informative than the discrete functional group approach.

55
Table 4-1. Area-based maximum photosynthetic rate (Aarea), maximum leaf specific
hydraulic conductivity (LSCmax), and wood density for study species from two lowland tropical forest sites in Panama.
Species Family Aarea (µmol m-2 s-1)
LSCmax (mmol m-1 s-1 MPa-1)
Wood density (g cm-3)
Fort Sherman Aspidosperma cruenta Apocynaceae 9.7 15.81 0.70 Dussia mundia Fabaceae 12.3 37.44 0.53 Guateria dumentosa Annonaceae 12.2 38.42 0.42 Humiriastrum diguense Hernandiaceae 11.2 34.05 0.58 Manilkara bidentata Sapotaceae 10.3 42.04 0.61 Marila laxifolia Clusiaceae 9.9 29.89 0.48 Miconia borealis Melastomataceae 16.8 81.00 0.50 Nectandra purpurescens Lauraceae 11.1 58.91 0.55 Ocotea ira Lauraceae 12.6 45.78 0.58 Poulsenia armata Moraceae 11.8 39.49 0.43 Pourouma bicolor Moraceae 13.7 49.90 0.45 Simarouba amara Simaroubaceae 17.5 102.37 0.41 Tapirira guianense Anacardiaceae 12.9 61.99 0.43 Trattinickia aspera Bursuraceae 12.2 43.00 0.57 Virola sebifera Myristicaceae 13.5 60.78 0.50 Vochysia ferruginea Vochysiaceae 18.3 120.69 0.35 Parque Metropolitano Chrysophyllum cainito Sapotaceae 9.9 33.84 0.61 Cordia alliodora Boraginaceae 15.4 61.59 0.47 Ficus insipida Moraceae 19.2 123.14 0.34 Luehea seemannii Tiliaceae 17.0 115.19 0.33
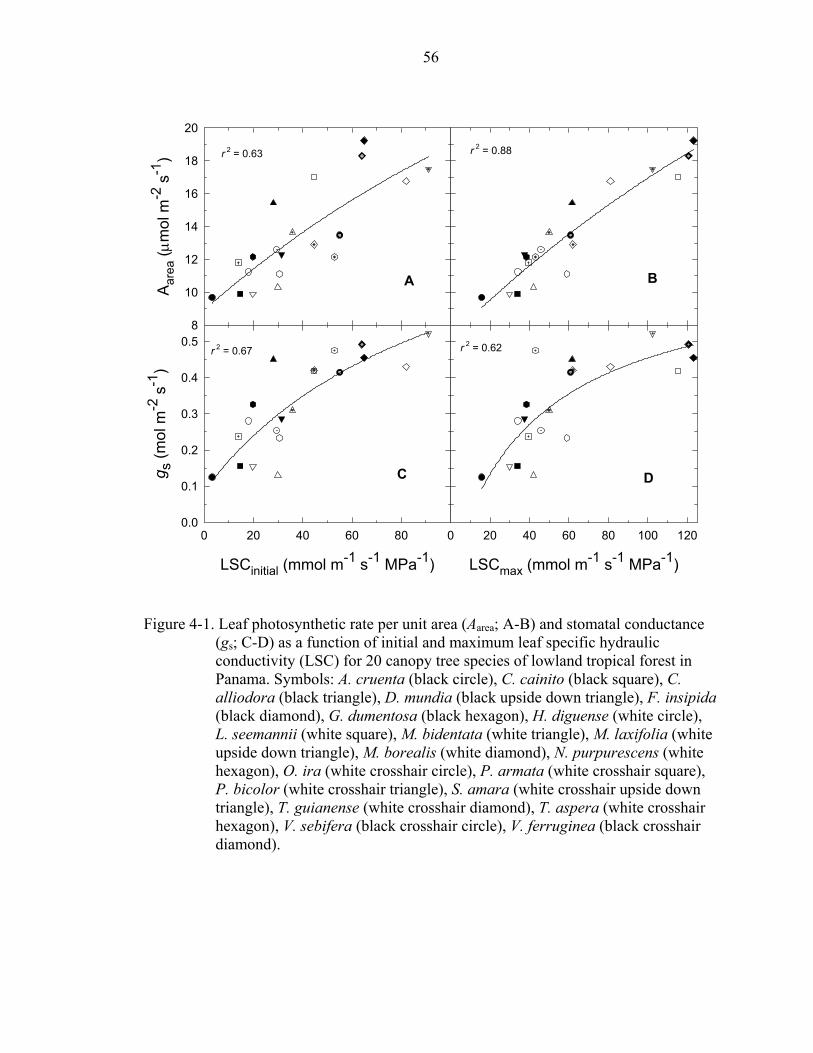
56
A are
a (µ
mol
m-2
s-1
)
8
10
12
14
16
18
20
r 2 = 0.88r 2 = 0.63
LSCinitial (mmol m-1 s-1 MPa-1)
0 20 40 60 80
g s (m
ol m
-2 s
-1)
0.0
0.1
0.2
0.3
0.4
0.5
LSCmax (mmol m-1 s-1 MPa-1)
0 20 40 60 80 100 120
r 2 = 0.67 r 2 = 0.62
A B
C D
Figure 4-1. Leaf photosynthetic rate per unit area (Aarea; A-B) and stomatal conductance (gs; C-D) as a function of initial and maximum leaf specific hydraulic conductivity (LSC) for 20 canopy tree species of lowland tropical forest in Panama. Symbols: A. cruenta (black circle), C. cainito (black square), C. alliodora (black triangle), D. mundia (black upside down triangle), F. insipida (black diamond), G. dumentosa (black hexagon), H. diguense (white circle), L. seemannii (white square), M. bidentata (white triangle), M. laxifolia (white upside down triangle), M. borealis (white diamond), N. purpurescens (white hexagon), O. ira (white crosshair circle), P. armata (white crosshair square), P. bicolor (white crosshair triangle), S. amara (white crosshair upside down triangle), T. guianense (white crosshair diamond), T. aspera (white crosshair hexagon), V. sebifera (black crosshair circle), V. ferruginea (black crosshair diamond).

57
LSCmax (mmol m-1 s-1 MPa-1)
0 20 40 60 80 100 120
A are
a/g s
(µm
ol m
ol-1
)
20
30
40
50
60
70
80
Nar
ea (m
ol m
-2)
0.00
0.04
0.08
0.12
0.16
0.20
0.24
A N (µ
mol
CO
2 [m
ol N
]-1 s
-1)
20
40
60
80
100
120
140
r 2 = 0.59
r 2 = 0.44
Figure 4-2. Leaf nitrogen per unit area (Narea), leaf photosynthetic rate per unit leaf
nitrogen (AN), and instantaneous water use efficiency (Aarea/gs) as a function of maximum leaf specific hydraulic conductivity (LSCmax) for 20 canopy tree species in lowland Panama. Symbols as in Figure 4-1.
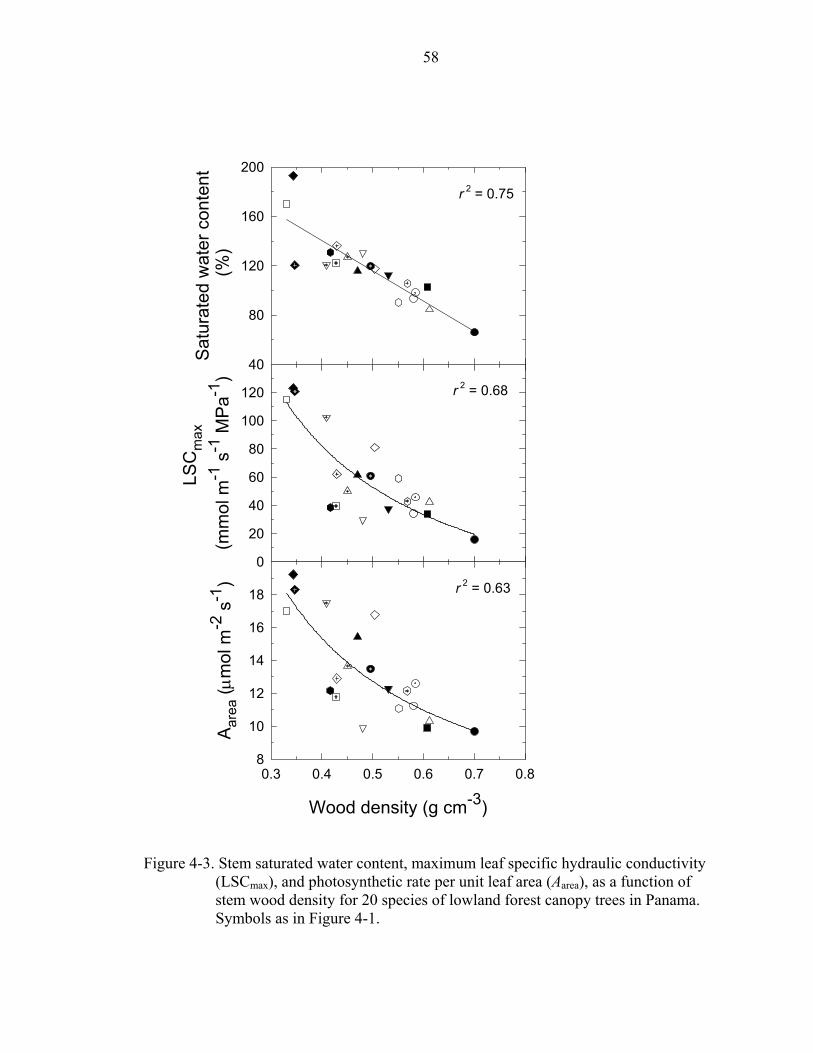
58
Satu
rate
d w
ater
con
tent
(
%)
40
80
120
160
200
LSC
max
(mm
ol m
-1 s
-1 M
Pa-1
)
0
20
40
60
80
100
120
Wood density (g cm-3)
0.3 0.4 0.5 0.6 0.7 0.8
A are
a (µ
mol
m-2
s-1
)
8
10
12
14
16
18 r 2 = 0.63
r 2 = 0.68
r 2 = 0.75
Figure 4-3. Stem saturated water content, maximum leaf specific hydraulic conductivity
(LSCmax), and photosynthetic rate per unit leaf area (Aarea), as a function of stem wood density for 20 species of lowland forest canopy trees in Panama. Symbols as in Figure 4-1.

CHAPTER 5 LEAF DECOMPOSITION IN A WET TROPICAL FOREST: LINKING LEAF TRAITS
WITH NUTRIENT CYCLING
Introduction
Climate, substrate, and the decomposer community are the three primary factors
controlling decomposition processes. In tropical wet forest, it has been proposed that the
structure and chemistry of substrate should have a relatively large effect, because tropical
forest tends to have warm moist climate and high biological diversity (Meentemeyer
1978). Substrate chemistry of leaf litter is a product of the resources allocated to the
living leaf, minus the nutrients retranslocated during senescence. Several general patterns
relating species to litter quality have been noted. For example, species from low resource
habitats often have leaves of low nutrient content that may decompose relatively slowly,
whereas species in high resource habitats generally produce leaves that have higher
nutrient content and decomposable readily (Chapin 1980). Furthermore, leaves share
interdependent characteristics such as photosynthetic rate, N concentration, specific leaf
area and leaf life span (Reich et al. 1997). The purpose of this paper is to evaluate the
extent to which such functional leaf characteristics predict litter quality and
decomposition rates among species in a wet lowland tropical forest.
Of the variety of leaf chemical components that are correlated with decomposition
rate, it is generally accepted that litter lignin:N ratio is the strongest predictor
(Cornelissen 1996; Hobbie 1996; Melillo et al. 1982). Considerably less work has gone
into investigating which leaf chemical, structural, or physiological traits of functioning
59

60
leaves predict decomposition (Cornelissen 1996; Cornelissen and Thompson 1997;
Grime et al. 1996; Wardle et al. 1998). This approach is of interest because it allows the
potential for understanding how growth and reproduction are related to the
decomposability of plant tissue. For example, Cornelissen and Thompson (1997) found
that specific leaf area (SLA), leaf life span, and leaf N were significant predictors of %
mass loss during decomposition among herbaceous monocots, suggesting that
relationships between leaf physiological traits of living leaves may be extended into leaf
litter decomposition. Furthermore, antiherbivore defenses have been found to continue to
work against decomposing organisms (Grime et al. 1996; Wardle et al. 2002). Thus leaf
physiology and antiherbivore defenses, two major determinants of leaf structure and
function, might be related to the effects of any one species on decomposition and nutrient
cycling.
It would be informative to link leaf physiology and antiherbivore defense to
decomposition because of the body of ecological literature that relates suites of leaf
functional traits to growth strategies in specific environmental regimes (Chapin 1993;
Coley et al. 1985; Grime 1977; Westoby 1998). Leaf physiological traits, especially
photosynthesis and water use efficiency, have been correlated with fitness in some
studies, although mostly through correlations with other traits (Arntz and Delph 2001;
Dudley 1996; Geber 1990; Lechowicz 1984). Therefore, it appears that many traits are
correlated along a minimal number of functional axes. The goal of this study is to
determine if it is possible to extend our understanding of correlated plant traits to include
leaf decomposition rate.
61
Materials and Methods
Study Site and Species
The study was conducted at the Fort Sherman canopy crane site on the Caribbean
coast of Central Panama. The site contains a 5-ha plot of lowland tropical forest within
the 12,000 ha San Lorenzo protected area. Mean annual rainfall at the site is 3100 mm,
with a mild dry season from January to March. I accessed the canopy with a 52-m-tall
construction crane equipped with a gondola and operated by the Smithsonian Tropical
Research Institute. Thirty six plant species that represent a broad selection of growth
forms including palms, lianas, monocot herbs, canopy trees and pioneer trees were
selected for study (Table 5-1).
Litter Collection and Decomposition
Leaf litter was collected during the dry season, between January and April, 2001,
when many species shed or exchange leaves. Senescent leaves were collected by hand
directly from at least three individuals of each study species. Entire leaves with complete
discoloration were gently shaken and harvested only if they came off the plant with a
light touch, indicating a well-formed abscission zone. Palm fronds and monocot herb
leaves remain on the plant for several months after retranslocation, so the most recent
senescing leaf or frond that had no remaining green pigmentation was selected.
Leaves were air dried in an air-conditioned laboratory (45% RH and 24ºC) for >1
month. Ten grams of litter from each species was set aside for initial litter quality
chemical analyses. Two to three grams of litter from each species were placed in 1X1 mm
mesh nylon-covered fiberglass window screen. Leaves of several species can weigh more
than 3 g and for these species one entire leaf was placed in each bag. For palms, a leaflet
was separated from the rachis and treated as a leaf. Four sizes of litter bags: 10X10,

62
10X30, 20X20 and 30X30 cm were used to accommodate different leaf sizes and
minimize folding. Litterbags were heat sealed with a dry iron and placed in the field on
March 30, 2001, about one month before the beginning of the rainy season that year.
Dowel rods (1/4” diameter, 15 cm long) were placed in the field with litterbags as a
standard to compare with other decomposition studies (LIDET 1995).
At 1, 3, 6, 14, and 24 months, 5 bags per species were collected from the field.
Bags were gently rinsed with distilled water to remove adhered soil particles and any
roots that had grown into the bags were removed with tweezers. A subsample of each
species was weighed fresh for moisture content, while the rest of the bags were placed in
the freezer overnight. The contents of each litterbag were then dried for 48 hours at 65°C.
Dried samples were weighed and ground in a Wiley mill through a 40 size mesh.
Initial Litter Quality
A subsample of litter from each species was dried for 48 hours at 65°C for the
determination of initial litter quality. Carbon fraction analyses were performed using a
series of increasingly aggressive extractants (Ryan et al. 1989). Dried litter samples were
digested in a detergent solution which separated non-polar extractives (cell contents)
from neutral detergent fiber (NDF), which includes cell wall constituents and fractions
that are not immediately nutritionally available. A dilute acid detergent solution was then
used to determine acid detergent fiber (ADF, lignocellulose) before lignin was separated
from cellulose in 72% H2SO4. A separate subsample was analyzed for C and N using an
elemental analyzer (Carlo Erba, Milano, Italy).
Gas Exchange and Leaf Chemistry
In the wet season of 2000 and 2001 (June-November), maximum rates of net CO2
assimilation (A) and stomatal conductance (gs) were measured with an infrared gas

63
analyzer (Model 6400, Li-Cor, Inc., Lincoln, NE, USA) between 0700 and 1100 h. Five
newly formed mature leaves from three individuals of each species were measured at 370
µmol mol-1, (slightly higher than ambient CO2 concentration), and 1500 µmol m-2 s-1
photosynthetic photon flux density (PFD) provided by a red blue light source (model
6400-02B #SI-710, Li-Cor, Inc.). Only gas exchange values measured at a leaf-to-air
vapor pressure deficit (VPDl) below 1.5 kPa were used because significant stomatal
closure was observed above this value. Gas exchange was measured on leaves growing in
the highest light environment in which the species tends to grow. For canopy trees,
lianas, pioneer trees and some palms, terminal leaves were accessed using the canopy
crane. For monocot herbs and understory palms, measurements were made from the
forest floor.
Following photosynthetic measurements, lamina thickness was measured between
primary and secondary veins with a digital caliper (Mitutoyo, Japan). Leaves were dried
for 48 hours at 65°C, weighed for determination of specific leaf area (SLA) and ball
milled to a fine powder. All leaves from the same individual were pooled for chemical
analysis. One composite sample from each individual was analyzed for C and N using an
elemental analyzer (Carlo Erba, Milano, Italy). Leaf toughness was measured in the field
on freshly collected leaves with a penetrometer (Pesola, Switzerland), which measured
the maximum force during punching through the lamina between primary and secondary
veins at a steady, slow rate with a 1 mm diameter plunger. Such measurements do not
replicate the action by which herbivores puncture leaves (fracture toughness) but leaf
toughness was correlated with fracture toughness in a study of 42 tropical tree species
(Choong et al. 1992), so I use it as an index of allocation to structure and potential
64
resistance to decomposition. Leaf polyphenol concentration was analyzed with the
Prussian Blue Procedure in a subset of the species studied, including canopy trees,
pioneer trees, lianas, and one palm (S. Joseph Wright, unpublished data).
Results
Decomposition rate (k) varied from a minimum of 0.41 in the canopy tree
Vochysia ferruginea to a maximum of 4.58 in the pioneer tree, Piper hispidum. Overall,
there were no significant differences in k among plant growth forms (F=1.76; P= 0.1617;
Table 5-2). Several indices of litter quality varied significantly between the monocots,
(palms and monocot herbs), and dicots (canopy trees, pioneer trees, and lianas). For
example, non-polar extractives were significantly lower in monocot herbs and palms than
other growth forms (F=7.86; P=0.0002). Litter cellulose concentration was significantly
higher in monocot herbs and palms (F=7.16; P=0.0003), and acid detergent fiber (ADF)
was higher in palms than other growth forms (F=6.43; P=0.0007).
Litter lignin concentration was negatively related to decomposition rate (Table
5-3, Figure 5-1). Although litter N concentration was not a significant predictor of
decomposition, the composite variable, litter lignin:N, was the strongest predictor of
decomposition rate (Table 5-3, Figure 5-1). Litter C concentration and C:N were also
negatively related to decomposition (Table 5-3, Figure 5-2). No other indices of litter
quality were related to decomposition except ADF, and this relationship was weak
(Table 5-3).
Several chemical and structural traits of living leaves were significantly related to
decomposition. Leaf N and C:N were significantly related to decomposition (Table 5-4,
Figure 5-3). SLA was positively related to decomposition (Table 5-4, Figure 5-4), and
species with tougher leaves tended to decompose more slowly (Table 5-4). Leaf N and

65
SLA, two of the strongest leaf predictors of decomposition were also significant
predictors of photosynthetic rate (Figure 5-5), indicating a relationship between leaf
physiology and decomposition through these structural and chemical traits.
Although lignin and lignin:N were the strongest predictors of decomposition,
there were several species with low lignin concentrations that decomposed slowly. A
general linear model including the effects of lignin and polyphenol concentration
explained more of the variance in decomposition than lignin alone (Table 5-5). This
result suggests that although lignin is probably the best general leaf defensive
characteristic for predicting decomposition, other antiherbivore defenses may play a
similar role in deterring decomposers following senescence (Grime et al. 1996; Wardle et
al. 2002), and when combined with lignin appear to explain a greater proportion of the
variance.
Discussion
Plant Growth Forms and Ecosystem Processes
In high diversity tropical ecosystems, it has been difficult to relate resource use
characteristics of individual plant species to system-wide processes such as nutrient
storage and cycling. This predicament has led to the functional group approach, in which
species with similar resource use characteristics are grouped into a smaller, more
manageable number of functional groups. This approach greatly simplifies modeling of
plant processes and has achieved success in many ecosystems (Chapin et al. 1995; Ewel
and Bigelow 1996; Körner 1993; Tilman et al. 1997). However, it appears that
continuous functions reflecting convergence in leaf physiology can also be used to
simplify the effects of many species. Therefore, my results suggest that for predicting the
effect of a species on an ecosystem process such as litter decomposition, it is more

66
important to know the value of a continuous variable such as litter lignin:N than any
discrete classification such as growth form, canopy position, successional status, or
phylogenetic association.
Litter Quality and Decomposition
The result that litter lignin:N is the strongest predictor of decomposition reported
in this study is consistent with numerous other decomposition studies (Cornelissen 1996;
Hobbie 1996; Melillo et al. 1982; Ostertag and Hobbie 1999). Similarly, the result that
litter C concentration and C:N are significantly related to decomposition corroborates
much of what exists in the ecological literature. Mechanistically, it is important to note
that the ratio of lignin to N reflects a ratio between leaf defense and photosynthetic
potential. High leaf lignin concentration is a characteristic of species in low resource
habitats and species with long-lived leaves, and is considered a general antiherbivore
defense (Chapin 1980; Coley 1983; Reich et al. 1997). To some degree, litter N is a
reflection of the physiological capacity of the leaf. Therefore, litter lignin:N is a ratio of
defense and structure to physiological capacity, although effects on decomposition are
more strongly driven by lignin. Viewed in this respect, the strongest predictor of litter
decomposition integrates plant allocation along the axes of defense and potentially
carbon gain.
Photosynthesis and Decomposition
Photosynthesis is the primary function of leaves and therefore most of the features
of leaves are under strong selection to maximize carbon gain over the life of the leaf
(Kikuzawa 1991; Mulkey et al. 1995; Reich et al. 1997). Ecologists have identified a
suite of highly interdependent leaf characteristics that occur repeatedly and appear
important in the exploitation of specific habitats (Chapin 1980). Specific leaf area (SLA)

67
and leaf N are two of these leaf characteristics that are positively related with
photosynthesis across broad groups of plant species (Reich et al. 1992). SLA and leaf N
are also the strongest leaf predictors of decomposition in this study and suggest that
allocation to photosynthetic capacity is related to decomposition through these
correlations (Figure 5-6). Interestingly, leaf N was correlated with decomposition rate,
but litter N was not. Leaf N may be related to a host of other leaf characteristics that
influence decomposition. Although photosynthetic rate and decomposition rate may show
a positive correlation, litter does not photosynthesize. Therefore, it is necessary to
consider chemical and structural leaf components that are related to photosynthesis to
understand how decomposition is a product of selection to maximize carbon gain in
leaves.

68
Table 5-1. Summary of study species and leaf litter decomposition rate (k) organized by growth form. All leaf litter material was collected in lowland wet tropical forest at Fort Sherman, Panama.
Species Family Growth form k (yr-1) Aspidosperma cruenta Apocynaceae Canopy tree 1.27 Brosimum utile Moraceae Canopy tree 0.47 Calophyllum longifolium Clusiaceae Canopy tree 0.46 Carapa guianensis Meliaceae Canopy tree 0.45 Dussia mundia Leguminosae Canopy tree 1.11 Manilkara bidentata Sapotaceae Canopy tree 0.66 Nectandra purpurascens Lauraceae Canopy tree 0.57 Pourouma bicolor Cecropiaceae Canopy tree 0.44 Simarouba amara Simaroubaceae Canopy tree 1.01 Tapirira guianensis Anacardiaceae Canopy tree 0.96 Vochysia ferruginea Vochysiaceae Canopy tree 0.41 Apeiba membranaceae Tiliaceae Pioneer tree 1.05 Cecropia insignis Cecropiaceae Pioneer tree 1.00 Jacaranda copaia Bignoniaceae Pioneer tree 0.80 Clidemia octona Melastomataceae Pioneer tree 0.69 Ochroma pyrmidale Bombacaceae Pioneer tree 0.58 Piper hispidum Piperaceae Pioneer tree 4.58 Trema micrantha Ulmaceae Pioneer tree 1.55 Arrabidaea verrucosa Bignoniaceae Liana 0.72 Cayaponia granatensis Cucurbitaceae Liana 0.72 Doliocarpus dentatus Dilleniaceae Liana 0.44 Heisteria scandens Olacaceae Liana 1.40 Maripa panamensis Convolvulaceae Liana 0.82 Phryganocydia corymbosa Bignoniaceae Liana 1.24 Pleonotoma variabilis Bignoniaceae Liana 0.48 Tontelea richardii Hippocrateaceae Liana 0.56 Costus pulverulentus Zingiberaceae Monocot herb 0.64 Diffenbachia pittieri Araceae Monocot herb 3.18 Heliconia pogonantha Heliconiaceae Monocot herb 0.81 Stromanthe jacquinii Maranthaceae Monocot herb 0.80 Zingiber officinale Zingiberaceae Monocot herb 1.76 Calyptrogyne costatifrons Palmae Palm 0.61 Carloduvica palmata Cyclanthaceae Palm 0.90 Genoma cuneata Palmae Palm 0.79 Oenocarpus mapora Palmae Palm 0.64 Socratea esxorrhiza Palmae Palm 0.46 Dowels 0.18

69
Table 5-2. Leaf litter decomposition rates and initial litter quality of study species from Fort Sherman, Panama, averaged by growth form. Values are mean ± 1 SE. Values with the same letter are not significantly different (P>0.05).
Canopy trees (n=11)
Pioneer trees (n=7)
Lianas (n=8)
Monocot herbs (n=5)
Palms (n=6)
k (yr-1) 0.71a ± 0.10 1.47a ± 0.58 0.80a ± 0.13 1.44a ± .054 0.68a ± 0.08 C (%) 47.27a ± 1.38 43.23a ± 2.66 46.45a ± 2.07 40.71a ± 1.40 41.98a ± 1.11N (%) 0.90a ± 0.09 1.22a ± 0.18 1.10a ± 0.08 1.02a ± 0.06 1.14a ± 0.16 C:N 58.42a ± 6.42 39.23a ± 5.95 44.42a ± 5.57 40.29a ± 1.44 38.69a ± 3.89Lignin (%) 16.03a ± 1.66 13.67a ± 2.71 16.46a ± 3.17 11.96a ± 1.62 21.48a ± 3.19Lignin:N 19.90a ± 3.34 11.81a ± 2.76 16.80a ± 4.93 11.74a ± 1.37 19.9a ± 4.30 Non-polar extractives (%)
54.23a ± 3.49 55.48a ± 5.07 50.35a ± 3.01 35.81b ± 6.33 29.59b ± 1.65
Cellulose (%)
18.41a ± 1.90 18.01a ± 3.00 19.56a ± 2.72 27.67b ± 1.71 32.61b ± 1.82
Fiber—ADF (%)
45.77a ± 3.49 44.52a ± 5.07 49.65a ± 3.01 64.18a ± 6.33 70.39b ± 1.64

70
Table 5-3. Regressions of litter chemical parameters and leaf litter decomposition rate (k). All plant growth forms were combined for analyses. Only statistically significant regressions (P<0.1) are reported. ADF, acid detergent fiber. (n=36)
Parameter Regression equation r2 Significance Litter C ln(k)=6.91-1.89·Litter C 0.17 0.0122 Litter C:N ln(k)=2.29-0.66·Litter C:N 0.15 0.0181 Lignin ln(k)=1.66-0.70·Lignin 0.30 0.0005 Lignin:N ln(k)=1.53-0.65·Lignin:N 0.38 <0.0001 ADF ln(k)=1.78-0.55·ADF 0.09 0.0772 Table 5-4. Regressions of leaf chemical and structural parameters and leaf litter
decomposition rate (k). All plant growth forms were combined for analyses. Only statistically significant regressions (P<0.1) are reported. SLA, specific leaf area. (n=36)
Parameter Regression equation r2 Significance Leaf N ln(k)=-0.97+1.15·Leaf N 0.20 0.0059 Leaf C:N ln(k)=2.48-0.85·Leaf C:N 0.19 0.0077 Lamina toughness ln(k)=0.66-0.18·lamina toughness 0.10 0.0575 SLA ln(k)=-2.43+0.48·SLA 0.21 0.0050 Table 5-5. Results of general linear model for combined effects of leaf phenol (measured
with the Prussian Blue Procedure) and litter lignin on litter decomposition rate. This analysis was conducted on a subset of the study species for which phenol data was available. The analysis included canopy trees, pioneer trees, lianas and one palm.
k Parameter Estimate P Intercept 2.005 0.0052 Phenols -1.243 0.0589 Lignin -0.839 0.0026 Phenols*Lignin 0.439 0.1146 Overall model p-value 0.0044 Model R2 0.49 n 23

71
A
B
ln litter lignin (%)1.6 1.8 2.0 2.2 2.4 2.6 2.8 3.0 3.2 3.4 3.6
ln k
(yr-1
)
-1.5
-1.0
-0.5
0.0
0.5
1.0
1.5
2.0
canopy treespioneer treeslianasmonocot herbspalms
r 2 = 0.30
ln litter lignin:N1.5 2.0 2.5 3.0 3.5 4.0
ln k
(yr-1
)
-1.5
-1.0
-0.5
0.0
0.5
1.0
1.5
2.0r 2 = 0.38
Figure 5-1. Relationship between leaf litter decomposition rate (k) and (A) initial litter
lignin concentration and (B) initial litter lignin to nitrogen ratio for 36 lowland tropical wet forest plant species from Fort Sherman, Panama.
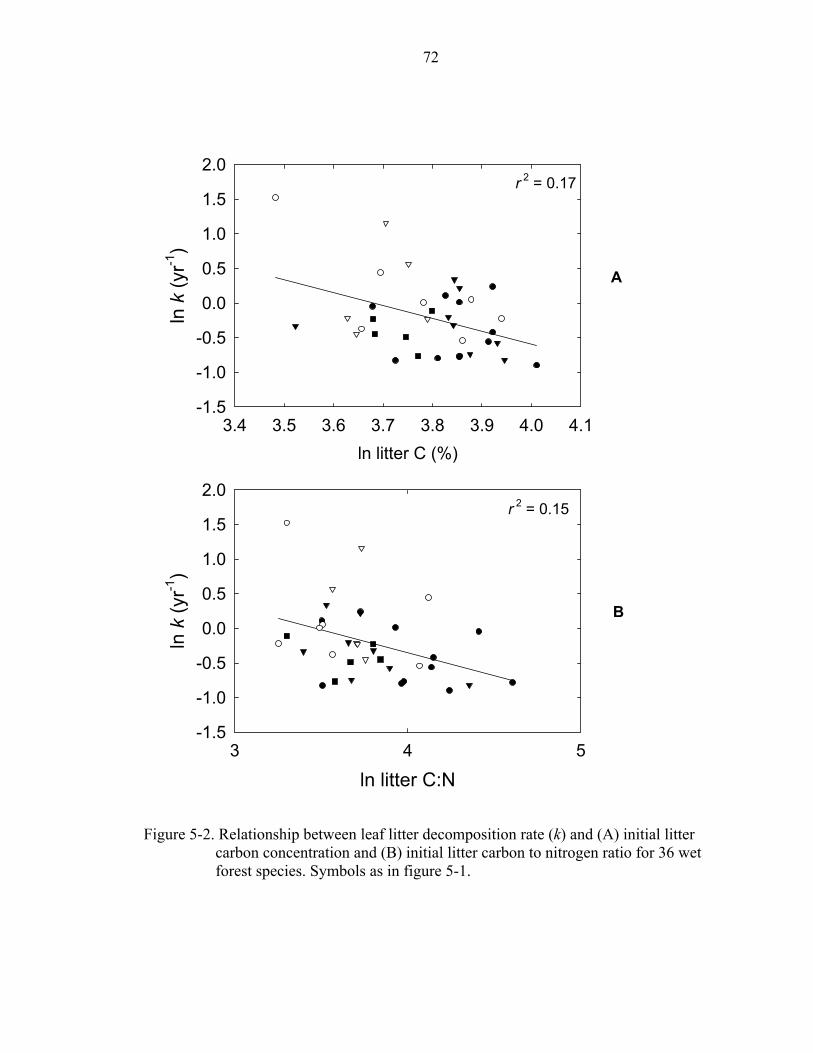
72
ln litter C (%)3.4 3.5 3.6 3.7 3.8 3.9 4.0 4.1
ln k
(yr-1
)
-1.5
-1.0
-0.5
0.0
0.5
1.0
1.5
2.0r 2 = 0.17
ln litter C:N3 4 5
ln k
(yr-1
)
-1.5
-1.0
-0.5
0.0
0.5
1.0
1.5
2.0r 2 = 0.15
A
B
Figure 5-2. Relationship between leaf litter decomposition rate (k) and (A) initial litter
carbon concentration and (B) initial litter carbon to nitrogen ratio for 36 wet forest species. Symbols as in figure 5-1.

73
A
B
ln leaf N (%)0.0 0.5 1.0 1.5
ln k
(yr-1
)
-2
-1
0
1
2
r 2 = 0.20
ln leaf C:N2.0 2.5 3.0 3.5 4.0
ln k
(yr-1
)
-2
-1
0
1
2r 2 = 0.19
Figure 5-3. Relationship between leaf litter decomposition rate (k) and (A) nitrogen
concentration of living leaf and (B) carbon to nitrogen ratio of living leaf for 36 wet forest species. Symbols as in figure 5-1.

74
ln SLA (cm2 g-1)3.5 4.0 4.5 5.0 5.5 6.0
ln k
(yr-1
)
-2
-1
0
1
2r 2 = 0.21
Figure 5-4. Relationship between leaf litter decomposition rate (k) and specific leaf area
(SLA) for 36 wet forest species. Symbols as in figure 5-1.

75
SLA (cm2 g-1)0 50 100 150 200 250 300 350
A mas
s (nm
ol g
-1 s
-1)
0
50
100
150
200
250
r 2 = 0.25
Leaf N (%)1.0 1.5 2.0 2.5 3.0 3.5 4.0
A mas
s (nm
ol g
-1 s
-1)
0
50
100
150
200
250
r 2 = 0.21
A
B
Figure 5-5. Relationship between leaf photosynthetic rate per unit mass (Amass) and (A)
specific leaf area (SLA) and (B) leaf nitrogen concentration for 36 wet forest species. Symbols as in figure 5-1.

76
SLA
Amass k
Leaf N
Figure 5-6. Schematic diagram depicting how photosynthesis is related to decomposition rate (k) through correlation with specific leaf area (SLA) and leaf nitrogen concentration.

CHAPTER 6 TEST OF GAS EXCHANGE MEASUREMENTS ON EXCISED BRANCHES OF TEN
TROPICAL TREE SPECIES: A TECHNICAL REPORT
Introduction
Plant physiological parameters that describe CO2 uptake and water loss are used to
model biosphere-atmosphere interactions at local and regional scales (Running and
Coughlan 1988; Williams et al. 1996) and to predict the sensitivity of vegetation to
climate change at regional to global scales (Neilson and Marks 1994). Measurements
from the upper canopy are important for calculations of net primary productivity (NPP)
and direct gas exchange measurements are needed to understand the extent to which NPP
is controlled by plant community type and environmental heterogeneity (Haxeltine and
Prentice 1996; Woodward et al. 1995). Towers, scaffolds, walkways and construction
cranes have been employed to obtain physiological parameters from intact branches in
the upper canopy of mature forest (Mulkey et al. 1996). However, these structures are not
available everywhere and there is a need for reliable estimates of leaf-level processes in
places where it is not practical or feasible to build such structures. Researchers have
measured gas exchange of canopy leaves by cutting or shooting small branches and re-
cutting stems under water to re-establish the xylem water column in the form of a
potometer before measurement (Dang et al. 1997; Koyama 1981; Reich et al. 1995; Reich
et al. 1998). Other researchers have measured gas exchange of montane forest trees
(Gerrish 1992) or conifers (Ginn et al. 1991; Samuelson 1998) by simply detaching a
group of leaves or fascicles and placing them in a cuvette for immediate measurement.
77

78
Although numerous physiological observations on excised foliage have been
published, there is evidence that excision may alter gas exchange measurements in
several ways. Even if a stem is double cut to re-establish the xylem water column,
cavitation, changes in xylem pressure, and reductions in hydraulic conductance can result
(Boari and Malone 1993; Stahlberg and Cosgrove 1995). These alterations in the xylem
stream can influence stomatal responses (Sperry et al. 1993; Williamson and Milburn
1995) and inhibit the transport of hormones and nutrients, which are important for
regulating shoot water potential and stomatal control (Tardieu and Davies 1993; Zhang
and Davies 1990). The time scale at which these changes occur is likely to be important
in determining the degree of excision-induced effects on gas exchange. However, these
responses vary widely across the plant kingdom leaving us with little information
regarding the reliability of gas exchange measurements on excised foliage; few studies
provide verification of how leaves on excised stems perform (Dang et al. 1997; Ginn et
al. 1991).
The purpose of this study is to compare gas exchange rates measured on excised
and attached branches of tropical forest canopy trees. I investigated how measurements of
gas exchange and biochemical parameters derived from photosynthetic light and CO2
response curves varied between leaves on excised and attached branches. Our main
objective was to determine if excision causes significant effects on measured gas
exchange rates and parameters, i.e. I wanted to know if the effect of excision on gas
exchange parameters is greater than the range of values observed on intact branches.
Second, I hoped to evaluate whether species differ in their gas exchange responses to
excision, and if there are any characteristics that might be used to predict the degree

79
excision-induced effects. Although measuring gas exchange on excised branches is a
convenient technique for acquiring data, it seems important to address the limitations of
this approach so as to prevent the collection of spurious data and to interpret the results of
studies that reported gas exchange results from excised stems.
Materials and Methods
Study Sites and Species
The study was conducted from two construction cranes operated by the
Smithsonian Tropical Research Institute (STRI) in the Republic of Panama. Each crane is
equipped with a gondola suspended by cables from a rotating boom that allows coverage
of approximately 0.82 ha of forest. The first crane is located in Parque Metropolitano, a
secondary dry forest on the edge of Panama City that receives approximately 1800 mm of
precipitation annually with a distinct dry season between December and April. The
second crane is located at Fort Sherman, on the Caribbean side of the Panamanian
Isthmus in old growth forest that receives approximately 3100 mm of precipitation
annually with a shorter and less intense dry season.
Ten tree species from 9 families, representing a variety of leaf morphology and
gas exchange rates were investigated. At Fort Sherman, Apeiba membranacea Spruce ex.
Benth. (Tiliaceae), Jacaranda copaia (Aubl.) D. Don (Bignoniaceae) and Vochysia
ferruginea Mart. in Mart. & Zucc. (Vochysiaceae) have relatively high rates of
photosynthesis and stomatal conductance (Table 6-1). Aspidosperma cruenta Woods
(Apocynaceae), Brosimum utile (Moraceae), Manilkara bidentata (Sapotaceae) and
Simarouba amara Aubl. var. typica Cronq. (Simaroubaceae), in contrast, have lower rates
of photosynthesis and stomatal conductance, and tend to have thicker leaves. At Parque
Metropolitano, Anacardium excelsum (Bertero & Balb.) Skeels (Anacardiaceae) has

80
relatively low rates of photosynthesis and stomatal conductance, whereas Pseudobombax
septenatum (Jacq.) Dug. (Bombacaceae) and Luehea seemannii Tr. & Planch. (Tiliaceae)
have higher rates of photosynthesis and stomatal conductance. All nomenclature follows
(Croat 1978).
Gas Exchange Measurements
Net CO2 assimilation (A) and stomatal conductance (gs) were measured with an
infrared gas analyzer (Model 6400, Li-Cor, Inc., Lincoln, NE, USA) on leaves of
branches with full sun exposure. One gas exchange measurement was taken on a newly
formed mature intact and attached leaf at ambient temperature, 37.26 Pa CO2 (equivalent
to 370 µmol mol-1, slightly higher than ambient), and 1500 µmol m-2 s-1 photosynthetic
photon flux density (PFD) provided by a red blue light source (model 6400-02B #SI-710,
Li-Cor, Inc.). The segment of branch was then excised 100 cm from the measured leaf
and immediately shortened to 50 cm by re-cutting under water to re-establish the xylem
water column. Successive gas exchange measurements were taken within 3 min and then
several times up to 60 min after excision.
The response of A to PFD was measured on newly formed fully expanded mature
leaves at a range of PFD from 0 to 1500 µmol m-2 s-1, 37.26 Pa CO2, and ambient relative
humidity. Measurements were made at ambient temperature unless leaf temperature
exceeded 33º C, in which case, peltier plates adjacent to the cuvette were used to
maintain the block temperature at 33º C. I first measured A at 1500 µmol m-2 s-1 PFD,
then light was decreased in a stepwise fashion for a total of 10 measurement points down
to 0 µmol m-2 s-1. Once the light response curve was completed, the branch was
immediately re-cut under water as described above and the curve was repeated in the

81
gondola with the stem in a potometer on a leaf of similar age adjacent to the original leaf.
An attempt was made to maintain the cut stem in sunlight to prevent stomatal closure as a
result of low light availability in the gondola. Trials were performed on two to four
branches per species. Parameters for light response curves were fit to a nonrectangular
hyperbola (Sims and Pearcy 1991), which allows calculation of apparent quantum yield
on the basis of incident photons (Φ), the light-saturated rate of gross CO2 assimilation at
saturating irradiance (Amax), the radius of curvature (Θ) and dark respiration (Rd).
The response of A to intercellular CO2 partial pressure (pi) was measured on three
branches per species. I conducted measurements on intact branches by first inducing the
leaf with 1700 µmol m-2 s-1 PFD and 37.26 Pa CO2. Measurements were then taken at 0
Pa CO2 and the concentration was increased over a total of 14 measurement points to a
final concentration of 151 Pa. The branch was then cut and re-cut as described above and
a second CO2 response curve was conducted on a leaf of similar age adjacent to the
original leaf to avoid feedback inhibition.
Parameters for CO2 response curves were modeled by two equations that describe
CO2-limited and rubisco-limited rates of photosynthesis (Lambers et al. 1998; von
Caemmerer and Farquhar 1981). CO2-limited rate of photosynthesis [A(c)] can be
calculated as
(6-1) ( )A c
V pp K
Rc i
i mday( )
max=
−+
−Γ
Where Vcmax is the rate of CO2 assimilation at saturating pi, Γ is the CO2
compensation point, Km is the Michaelis-Menten constant for the carboxylation reaction

82
and Rday is the rate of respiration during photosynthesis. The rubisco-limited rate of
calculated as: calculated as: photosynthesis [A(j)] can be can be
( )( )A j
J pp
Ri
iday( )
max=
−+
−Γ
Γ4 2
(6-2)
(6-2)
Where Jmax is the maximum rate of electron transport and all other parameters
follow equation 1. Repeated measure analysis of variance (ANOVA) was used to assess
the effect of excision on light and CO2 response curves with branches as a random factor
nested within treatments.
Where Jmax is the maximum rate of electron transport and all other parameters
follow equation 1. Repeated measure analysis of variance (ANOVA) was used to assess
the effect of excision on light and CO2 response curves with branches as a random factor
nested within treatments.
Results and Discussion Results and Discussion
Time Course Measurements Time Course Measurements
After excision, all species showed a reduction in both A and gs within 3 min
(Figures 6-1 and 6-2). However, after 10 min, most species showed fewer fluctuations
and appeared to stabilize for the remainder of the 60 min measurement period. This
pattern indicates that hurrying to take a measurement on an excised branch may
minimize, but not necessarily avoid changes in gas exchange rates caused by excision. At
Ft. Sherman, the three species with the highest A for attached leaves, A. membranacea, J.
copaia, and V. ferruginea (Table 6-1), also maintained the highest A at 60 min after
excision (Figure 6-1). The other four species at Ft. Sherman, A. cruenta, B. utile, M.
bidentata, and S. amara, suffered a greater reduction in A 60 min after cutting (Figure 6-
1) and all produce latex or resin in the stem. A. cruenta, B. utile and M. bidentata,
After excision, all species showed a reduction in both A and gs within 3 min
(Figures 6-1 and 6-2). However, after 10 min, most species showed fewer fluctuations
and appeared to stabilize for the remainder of the 60 min measurement period. This
pattern indicates that hurrying to take a measurement on an excised branch may
minimize, but not necessarily avoid changes in gas exchange rates caused by excision. At
Ft. Sherman, the three species with the highest A for attached leaves, A. membranacea, J.
copaia, and V. ferruginea (Table 6-1), also maintained the highest A at 60 min after
excision (Figure 6-1). The other four species at Ft. Sherman, A. cruenta, B. utile, M.
bidentata, and S. amara, suffered a greater reduction in A 60 min after cutting (Figure 6-
1) and all produce latex or resin in the stem. A. cruenta, B. utile and M. bidentata, are
from plant families well-known for this characteristic: the Apocynaceae, Moraceae,
Sapotaceae, respectively. Simarouba amara has a clear yellow resin, also characteristic of
its family, the Simaroubaceae (Croat 1978). Wounding stimulates latex and resin
production (Kramer and Kozlowski 1979), which acts as a wound response and can

83
physically clog the xylem and prevent water loss and pathogen attack. However, once an
excised stem is in water, if latex or resin leaks in the vicinity of the cut section of active
xylem it can clog the xylem thus inhibiting water supply to the leaf and reducing A and
gs. Therefore, these data suggest that species with latex or resin do not perform well
following excision.
At Parque Metropolitano, L. seemannii maintained a mean of 86.5% of intact
photosynthetic rates 60 min after excision (Figure 6-1), whereas P. septenatum
maintained only 13.4 and 5.5% of the average intact values for A and gs, respectively,
after excision (Figs. 6-1 and 6-2). A. excelsum, maintained only 26.6 and 48.6% of intact
A and gs, respectively after excision. With the exception of P. septenatum, species at
Parque maintained higher percentages of intact gs than A 60 min after excision (Figs. 6-1
and 6-2). In contrast, all species in the wetter forest at Ft. Sherman maintained a higher
percentage of intact A, relative to gs 60 min after excision (Figs. 6-1 and 6-2). This trend
may be indicative of greater stomatal sensitivity in wet forest trees as a result of
acclimation to humid conditions.
Response to Light
Photosynthetic light response curves following excision varied among species
(Figure 6-3). Species such as A. membranacea and L. seemannii showed no differences
between intact and excised branches, whereas B. utile and S. amara showed substantial
differences in light-saturated photosynthesis (Figure 6-3). Although the curve from the
excised branch was always lower, this difference was less than the variation between
leaves from different branches, so excision did not significantly reduce A as a function of
PFD in any of the six species investigated (Table 6-2). Therefore, the light response curve
of any excised leaf is likely to reach lower values than measurements on the same leaf

84
when it is attached, but these lower values are also likely to fall within the range of values
for attached leaves.
Excision decreased the calculated value of Amax in A. cruenta, B. utile, and S.
amara (Table 6-3) but not in the other three species investigated. Since Amax is probably
the most widely used parameter derived from light response curves and half of the
species tested showed significant reductions upon excision, estimates of Amax derived
from light response curves on excised foliage must be interpreted with caution. Minor
differences between Θ, Φ, and Rd from intact and excised light response curves were also
observed in some cases (data not shown), but these differences were generally within the
95% confidence interval of the parameter in curve fitting.
Overall, most species appeared to perform better during light response curves than
over time course measurements. Maintaining a portion of the leaf in the constant
environment of the cuvette may help maintain consistency. How a leaf's ability to
respond to short-term changes in light and VPD is affected following excision is
unknown, but measurements suggest that constant conditions may result in more accurate
measurements. (Reich et al. 1995) kept excised branches in sunlight, which is likely to
have maintained the leaf in an induced state. In that study, attached foliage from pioneer
species was compared with excised foliage from mature canopy species and it was found
that the excised foliage of canopy species produced lower gas exchange rates. Since
excision can negatively affect gas exchange rates in a systematic way, it is difficult to
discern whether the lower gas exchange rates of canopy trees observed by Reich et al.
(1995) are the result of excision-induced effects or represent characteristics that have
evolved to specific environmental regimes. In either case, the species-specific responses

85
to excision presented in this paper suggest that it is important to consider the sensitivity
to excision when comparing species or functional groups.
Response to CO2
The effect of branch excision on leaf photosynthetic CO2 responses was again
species specific (Figure 6-4). Excision changed the general shape of the curve in A.
cruenta, B. utile, and S. amara, whereas in A. membranacea, L. seemannii, and V.
ferruginea, lower maxima were the main effect. L. seemannii and V. ferruginea were the
only species exhibiting a significant effect of excision on photosynthetic responses to pi
(Table 6-2). In the other four species, A as a function of pi was reduced following
excision, but the magnitude of the effect of excision was small compared to the range of
values encountered between branches and therefore, no statistical effect was detected.
The reduction in A during CO2 response curves following excision may be
indicative of non-uniform stomatal closure. Heterogeneous gas exchange over small areas
of the leaf has been shown to occur in response to water stress (Downton et al. 1988).
Heterogeneous stomatal closure has also been implicated in causing errors in estimating
pi and may explain observed reductions in A even when pi does not appear to be limiting
(Mansfield et al. 1990). Cheeseman (1991) demonstrated through simulation models that
the effects of heterogeneous stomatal behaviour can only account for minor effects in
calculating pi, and therefore, on CO2 response curves. Yet, the effects of patchy stomatal
closure on CO2 response curves presented by (Cheeseman 1991) are similar to the
patterns of reduction following excision in this study, suggesting that stem water status is
altered by excision and the reduction in gs is heterogeneous over the leaf surface.
Therefore, non-uniform stomatal behaviour may explain why for several species the main
effect of excision on the CO2 response curve was a slight reduction of the maximum. This
86
reduction probably reflects changes in stomatal behaviour rather than a reduction of the
biochemical functioning of the photosystem.
Excision reduced the calculated values of both Vcmax and Jmax in L. seemannii and S.
amara whereas in A. membranacea and A. cruenta, only the calculation of Vcmax was
significantly affected (Table 6-3). In spite of multi-fold variation in Vcmax and Jmax among
species, and in some cases between treatments, there was strong correlation between
these two parameters (r2=0.89). Excision did not produce a significantly different
relationship (t=-0.174; P>0.25) between Jmax and Vcmax, so a single linear regression was
used. A slightly positive intercept of 13.7 µmol m-2 s-1 was observed, along with a slope
of 1.63. These results are consistent with those reported in a review of 109 species
(Wullschleger 1993). In that study, Wullschleger (1993) also reported linear regression
between Jmax and Vcmax with a positive intercept and a slope of 1.64. The consistency of
the relationship between Jmax and Vcmax suggests that effects on water transport and
patchy stomatal behavior are responsible for the differences in calculating biochemical
parameters, rather than changes in biochemical activity.
Declining values of A at high pi in CO2 response curves on both attached and
excised branches indicate an apparent limitation by triose phosphate utilization (Sharkey
1985) in L. seemannii and V. ferruginea (Figure 6-4). Limitation of A by TPU was once
thought to occur rarely, but there is now increasing evidence that this limitation may be
more common under conditions of high light and high pi (Harley et al. 1992;
Wullschleger 1993). Tropical forest canopies often experience high light and our data
indicate that TPU limitation can be important for at least two species in these forests.

87
This finding has implications for modeling the responses of tropical forest to increases in
atmospheric CO2.
Conclusions
I investigated the utility of a technique for measuring gas exchange on excised
foliage in tropical forest canopy trees. Responses to excision were species specific and
there is some evidence that responses are related to phylogeny, potentially allowing
prediction of how a species might perform. All species with latex or resin performed
relatively poorly after excision and I suggest that these types of wound responses can
clog cut xylem ends, thus reducing water transport. Patterns of reduction of A and gs in
time course measurements, light and CO2 response curves appear to be mediated by
stomatal closure as opposed to reductions in biochemical photosynthetic capacity. I
recommend individual trials on all species to be investigated. It appears that anatomical,
morphological, and possibly, phylogenetic differences can influence the response of gas
exchange measurements to excision. Therefore, patterns of response to excision at
taxonomic levels higher than species, and different growth forms, such as trees, vines and
shrubs, should also be considered in broad species comparisons of photosynthetic
measurements on excised branches.
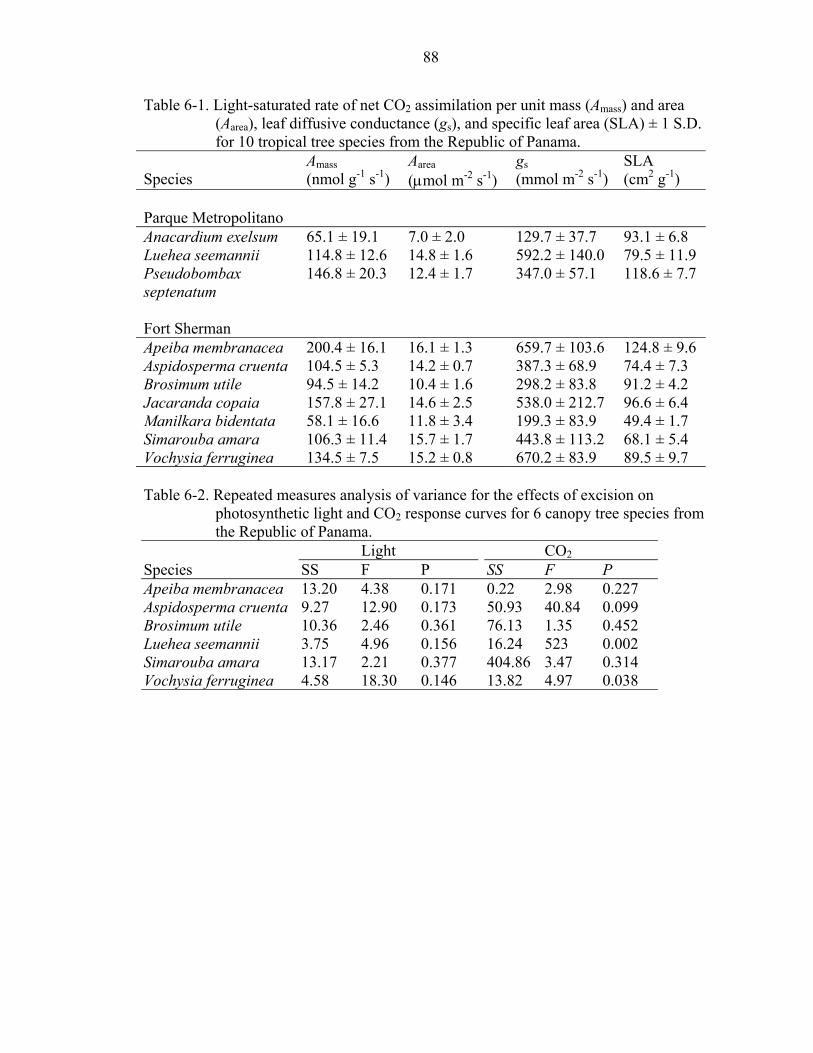
88
Table 6-1. Light-saturated rate of net CO2 assimilation per unit mass (Amass) and area (Aarea), leaf diffusive conductance (gs), and specific leaf area (SLA) ± 1 S.D. for 10 tropical tree species from the Republic of Panama.
Species
Amass (nmol g-1 s-1)
Aarea (µmol m-2 s-1)
gs (mmol m-2 s-1)
SLA (cm2 g-1)
Parque Metropolitano Anacardium exelsum 65.1 ± 19.1 7.0 ± 2.0 129.7 ± 37.7 93.1 ± 6.8 Luehea seemannii 114.8 ± 12.6 14.8 ± 1.6 592.2 ± 140.0 79.5 ± 11.9 Pseudobombax septenatum
146.8 ± 20.3 12.4 ± 1.7 347.0 ± 57.1 118.6 ± 7.7
Fort Sherman Apeiba membranacea 200.4 ± 16.1 16.1 ± 1.3 659.7 ± 103.6 124.8 ± 9.6 Aspidosperma cruenta 104.5 ± 5.3 14.2 ± 0.7 387.3 ± 68.9 74.4 ± 7.3 Brosimum utile 94.5 ± 14.2 10.4 ± 1.6 298.2 ± 83.8 91.2 ± 4.2 Jacaranda copaia 157.8 ± 27.1 14.6 ± 2.5 538.0 ± 212.7 96.6 ± 6.4 Manilkara bidentata 58.1 ± 16.6 11.8 ± 3.4 199.3 ± 83.9 49.4 ± 1.7 Simarouba amara 106.3 ± 11.4 15.7 ± 1.7 443.8 ± 113.2 68.1 ± 5.4 Vochysia ferruginea 134.5 ± 7.5 15.2 ± 0.8 670.2 ± 83.9 89.5 ± 9.7 Table 6-2. Repeated measures analysis of variance for the effects of excision on
photosynthetic light and CO2 response curves for 6 canopy tree species from the Republic of Panama.
Light CO2 Species SS F P SS F P Apeiba membranacea 13.20 4.38 0.171 0.22 2.98 0.227 Aspidosperma cruenta 9.27 12.90 0.173 50.93 40.84 0.099 Brosimum utile 10.36 2.46 0.361 76.13 1.35 0.452 Luehea seemannii 3.75 4.96 0.156 16.24 523 0.002 Simarouba amara 13.17 2.21 0.377 404.86 3.47 0.314 Vochysia ferruginea 4.58 18.30 0.146 13.82 4.97 0.038

89
Table 6-3. Means of model parameters from photosynthetic light and CO2 response curves on leaves of intact (IN) and excised (EX) branches determined by least-squared estimates. Values of light-saturated rate of gross photosynthesis (Amax) from light response curves, and maximum rate of carboxylation (Vcmax) and electron transport (Jmax) from CO2 response curves followed by the same letter are not significantly different (P<0.05) based on Duncan’s multiple range test. Comparisons are only valid within species.
Species Method Amax (µmol m-2 s-1)
Vcmax (µmol m-2 s-1)
Jmax (µmol m-2 s-1)
Apeiba membranacea IN
EX 20.0a
18.9a 51.9a
42.5b 102.9a
86.3a
Aspidosperma cruenta IN EX
16.0a 13.8b
56.2a
45.1b 92.3a
81.4a
Brosimum utile IN EX
12.8a 9.8b
35.0a
29.2a 64.5a
54.5a
Luehea seemannii IN EX
14.9a 13.3a
38.3a
27.5b 82.7a
65.2b
Simarouba amara IN EX
17.9a 15.6b
61.4a
32.9b 108.8a
59.9b
Vochysia ferruginea IN EX
16.6a 14.8a
50.9a
53.6a 108.1a
104.0a

90
0
20
40
60
80
100 Fort Sherman
Parque Metropolitano
Time after cut (min)0 10 20 30 40 50 60
% In
tact
pho
tosy
nthe
sis
0
20
40
60
80
100
Figure 6-1. Percent of maximum photosynthesis of 3-5 leaves from excised branches at
two canopy crane sites: Fort Sherman and Parque Metropolitano, Republic of Panama. Species at Fort Sherman: (filled circle) Apeiba membranacea, (open circle) Aspidosperma cruenta,(filled upside down triange) Brosimum utile, (open upside down triange) Jacaranda copaia, (filled square) Manilkara bidentata, (open square) Simarouba amara var. typica and (filled diamond) Vochysia ferruginea. Species at Parque Metropolitano: (open diamond) Anacardium excelsum, (filled triange) Luehea seemannii, and (open triangle) Pseudobombax septenatum.

91
0
20
40
60
80
100
Time after cut (min)0 10 20 30 40 50 60
% In
tact
sto
mat
al c
ondu
ctan
ce
0
20
40
60
80
100 Parque Metropolitano
Fort Sherman
Figure 6-2. Percent of maximum stomatal conductance of 3-5 leaves from excised
branches at two canopy crane sites: Fort Sherman and Parque Metropolitano, Republic of Panama. Symbols as in Figure l.

92
0 500 1000 1500-4
0
4
8
12
Vochysia ferruginea
PAR (µmol m-2 s-1)
0 500 1000 1500
0
5
10
15
Aspidosperma cruenta
0 500 1000 1500
0
5
10
15
Luehea seemannii
Apeiba membrancea
0 500 1000 1500
0
5
10
15
IntactExcised
Simarouba amara
0 500 1000 1500-5
0
5
10
15
20
Brosimum utile
0 500 1000 1500
Net
CO
2 ass
imila
tion
(µm
ol m
-2 s
-1)
-4
-2
0
2
4
6
8
10
Figure 6-3. Representative curves of net CO2
assimilation as a function of PFD, under 370 µmol mol-1 CO2, and ambient temperature (30-33 °C) and relative humidity (70-85%) for leaves of intact and excised branches.

93
Luehea seemannii
0 20 40 60 80 100 120 140 160-10
-5
0
5
10
15
20
25
Simarouba amara
0 20 40 60 80 100 120 140-10
-505
1015202530
0 20 40 60 80 100 120 140 160-10
-5
0
5
10
15
20
25
IntactExcised
Apeiba membranacea
Vochysia ferruginea
Internal CO2 partial pressure (Pa)
0 20 40 60 80 100 120 140-5
0
5
10
15
20
25
Aspidosperma cruenta
0 20 40 60 80 100 120 140-10
-5
0
5
10
15
20
25
0 20 40 60 80 100 120 140
Net
CO
2 ass
imila
tion
( µm
ol m
-2 s
-1)
-5
0
5
10
15
20Brosimum utile
Figure 6-4. Representative curves of net CO2
assimilation as a function of internal CO2 partial pressure (pi) under 1700 µmol m-2 s-1 PFD, and ambient temperature (30-33 °C) and relative humidity (70-85%) for leaves of intact and excised branches.

CHAPTER 7 CONCLUSIONS
This dissertation emphasizes the relationship between leaf physiological traits and
effects of plant species and communities on processes at the ecosystem scale. It appears
that plant allocation to leaf photosynthetic capacity has the potential to reveal itself at
larger spatial and temporal scales. The leaf traits evaluated in this dissertation have been
shown to be interrelated and appear to have evolved in response to specific
environmental regimes (Chapin 1980; Reich et al. 1992). The result that there is a
relationship between leaf physiology and leaf litter decomposition suggests that the body
of ecological literature on plant traits and life history characteristics may be extended to
understand the effects of species on ecosystem processes.
94

LIST OF REFERENCES
Ackerly DD, Reich PB (1999) Convergence and correlations among leaf size and function in seed plants: a comparative test using independent contrasts. American Journal of Botany 86:1272-1281
ACP (2002) Panama Canal Authority, Meteorology and Hydrology Branch, http://www.stri.org/tesp/ACP.htm. November 2002, Republic of Panama
Andrade JL, Meinzer FC, Goldstein G, Holbrook NM, Caverier J, Jackson P, Silvera K (1998) Regulation of water flux through trunks, branches and leaves in trees of a lowland tropical forest. Oecologia 115:463-471
Arntz AM, Delph LF (2001) Pattern and process: evidence for the evolution of photosynthetic traits in natural populations. Oecologia 127:455-467
Austin AT, Vitousek PM (1998) Nutrient dynamics on a precipitation gradient in Hawai'i. Oecologia 113:519-529
Binkley D, Matson P (1983) Ion exchange resin bag method for assessing forest soil nitrogen availability. Soil Science Society of America Journal 47:1050-1052
Björkman O, Demmig B (1987) Photon yield of O2 evolution and chlorophyll fluorescence characteristics at 77K among vascular plants of diverse origins. Planta 170:489-504
Boari F, Malone M (1993) Wound-induced hydraulic signals: Survey of occurrence in a range of species. Journal of Experimental Botany 44:741-746
Borchert R (1994) Water status and development of tropical trees during seasonal drought. Trees 8:115-125
Chabot BF, Hicks DJ (1982) The ecology of leaf life spans. Annual Review of Ecology and Systematics 13:229-259
Chapin FS, III (1980) The mineral nutrition of wild plants. Annual Review of Ecology and Systematics 11:233-260
Chapin FS, III (1993) Functional role of growth forms in ecosystem and global processes. In: Ehleringer JR, Field CB (eds) Scaling Physiological Processes. Academic Press, New York, pp 287-308
95

96
Chapin FS, III, Shaver GR, Giblin AE, Nadelhoffer KJ, Laundre JA (1995) Responses of Arctic tundra to experimental and observed changes in climate. Ecology 76:694-711
Cheeseman JM (1991) PATCHY: simulating and visualizing the effects of stomatal patchiness on photosynthetic CO2 exchange studies. Plant, Cell and Environment 14:593-599
Choong MF, Lucas PW, Ong JSY, Pereira B, Tan HTW, Turner IM (1992) Leaf fracture toughness and sclerophylly: their correlations and ecological implications. New Phytologist 121:597-610
Clark DA, Brown S, Kicklighter DW, Chambers JQ, Thomlinson JR, Ni J (2001a) Measuring net primary production in forests: Concepts and field methods. Ecological Applications 11:356-370
Clark DA, Brown S, Kicklighter DW, Chambers JQ, Thomlinson JR, Ni J, Holland EA (2001b) Net primary production in tropical forests: an evaluation and synthesis of existing field data. Ecological Applications 11:371-384
Coley PD (1983) Herbivory and defensive characteristics of tree species in a lowland tropical forest. Ecological Monographs 53:209-233
Coley PD, Bryant JP, Chapin FS, III (1985) Resource availability and plant anti-herbivore defense. Science 230:895-899
Condit R (1998) Ecological implications of changes in drought patterns: Shifts in forest composition in Panama. Climate Change 39:413-427
Condit R, Pitman N, Leigh EG, Chave J, Terborgh J, Foster RB, Nuñez P, Aguilar S, Valencia R, Villa G, Muller-Landau HC, Losos E, Hubbell SP (2002) Beta-diversity in tropical forest trees. Science 295:666-669
Cornelissen JHC (1996) An experimental comparison of leaf decomposition rates in a wide range of temperate plant species and types. Journal of Ecology 84:573-582
Cornelissen JHC, Thompson K (1997) Functional leaf attributes predict litter decomposition rate in herbaceous plants. New Phytologist 135:109-114
Cornelissen JHC, Werger MJA, Castro-Díez P, vanRheenen JWA, Rowland AP (1997) Foliar nutrients in relation to growth, allocation and leaf traits in seedlings of a wide range of woody plant species and types. Oecologia 111:460-469
Crews TE, Kitayama K, Fownes JH, Riley RH, Herbert DA, Mueller-Dombois D, Vitousek PM (1995) Changes in soil phosphorus fractions and ecosystem dynamics across a long soil chronosequence in Hawaii. Ecology 76:1407-1424

97
Croat TB (1978) Flora of Barro Colorado Island. Stanford University Press, Stanford, California
Cunningham SA, Summerhayes B, Westoby M (1999) Evolutionary divergences in leaf structure and chemistry, comparing rainfall and soil nutrient gradients. Ecological Monographs 69:569-588
Dang Q-L, Margolis HA, Coyea MR, Sy M, Collatz GJ (1997) Regulation of branch-level gas exchange of boreal trees: roles of shoot water potential and vapor pressure difference. Tree Physiology 17:521-535
Deka RN, Wairiu M, Mtakwa PW, Mullins CE, Veenendaal EM, Townsend J (1995) Use and accuracy of the filter-paper technique for measurement of soil matric potential. European Journal of Soil Science 46:233-238
Delieu T, Walker D (1981) Polarographic measurement of photosynthetic oxygen evolution by leaf-disks. New Phytologist 89:165-178
Dietrich WE, Windsor DM, Dunne T (1982) Geology, climate, and hydrology of Barro Colorado Island. In: Leigh EG, Rand AS, Windsor DM (eds) The Ecology of a Tropical Forest. Smithsonian Institution Press, Washington D.C., pp 21-46
Downton WJS, Loveys BR, Grant WJR (1988) Stomatal closure fully accounts for the inhibition of photosynthesis by abscisic acid. New Phytologist 108:263-266
Dudley SA (1996) Differing selection on plant physiological traits in response to environmental water availability: a test of adaptive hypotheses. Evolution 50:92-102
Eamus D, Prior L (2001) Ecophysiology of trees of seasonally dry tropics: comparisons among phenologies. Advances in Ecological Research 32:113-197
Enquist BJ, Brown JH, West GB (1998) Allometric scaling of plant energetics and population density. Nature 395:163-166
Evans RD (2001) Physiological mechanisms influencing plant nitrogen isotope composition. Trends in Plant Science 6:121-126
Ewel JJ, Bigelow SW (1996) Plant Life-Forms and Tropical Ecosystem Functioning. In: Orians, Dirzo, Cushman (eds) Biodiversity and Ecosystem Functioning in Tropical Forests. Springer-Verlag, Berlin, pp 101-126
Ewers FW, Fisher JB (1989) Techniques for measuring vessel lengths and diameters in stems of woody plants. American Journal of Botany 76:645-656
Farquhar GD, Richards RA (1984) Isotopic composition of plant carbon correlates with water-use efficiency of wheat genotypes. Australian Journal of Plant Physiology 33:539-552

98
Field CB (1991) Ecological scaling of carbon gain to stress and resource availability. In: Mooney HA, Winner WE, Pell EJ (eds) Response of Plants to Multiple Stresses. Academic Press, New York, pp 35-65
Geber MA (1990) The cost of meristem limitation in Polygonum arenastrum: negative genetic correlations between fecundity and growth. Evolution 44:799-819
Gentry AH (1988) Changes in plant community diversity and floristic composition on environmental and geographical gradients. Annals of the Missouri Botanical Garden 75:1-34
Gerrish G (1992) Changing photosynthetic capacity during leaf ontogeny in juvenile and mature Metrosideros polymorpha trees. Pacific Science 46:315-324
Ginn SE, Seiler JR, Cazell BH, Kreh RE (1991) Physiological and growth responses of eight-year-old pine stands to thinning. Forest Science 37:1030-1040
Givnish TJ (2002) Adaptive significance of evergreen vs. deciduous leaves: solving the triple paradox. Silva Fennica 36:703-743
Goldstein G, Andrade JL, Meinzer FC, Holbrook NM, Cavelier J, Jackson P, Celis A (1998) Stem water storage and diurnal patterns of water use in tropical forest canopy trees. Plant, Cell and Environment 21:397-406
Goldstein G, Sarmiento G, Meinzer FC (1986) Patrones diarios y estacionales en las relaciones hídricas de árboles siempreverdes de la sabana tropical. Oecologia Plantarum 7:107-119
Graham EA, Mulkey SS, Kitajima K, Phillips NG, Wright SJ (2003) Cloud cover limits net CO2 uptake and growth of a rainforest tree during tropical rainy seasons. Proceedings of the National Academy of Sciences 100:572-576
Grime JP (1977) Evidence for the existence of three primary strategies in plants and its relevance to ecological and evolutionary theory. American Naturalist 111:1169-1194
Grime JP, Cornelissen JHC, Thompson K, Hodgson JG (1996) Evidence of a causal connection between anti-herbivore defence and the decomposition rate of leaves. Oikos 77:489-494
Hacke UG, Sperry JS, Pockman WT, Davis SD, McCulloh KA (2001) Trends in wood density and structure are linked to prevention of xylem implosion by negative pressure. Oecologia 126:457-461
Harley PC, Thomas RB, Reynolds JF, Strain BR (1992) Modelling photosynthesis of cotton grown in elevated CO2. Plant, Cell and Environment 15:271-282

99
Haxeltine A, Prentice IC (1996) BIOME 3: An equilibrium terrestrial biosphere model based on ecophysiological constraints, resource availability and competition among plant functional types. Global Biogeochemical Cycles 10:693-709
Hobbie SE (1992) Effects of Plant Species on Nutrient Cycling. Trends in Ecology and Evolution 7:336-339
Hobbie SE (1996) Temperature and plant species control over litter decomposition in Alaskan tundra. Ecological Monographs 66:503-522
Holbrook NM, Whitbeck JL, Mooney HA (1995) Drought responses of neotropical dry forest trees. In: Bullock HA, Mooney HA, Medina E (eds) Seasonally Dry Tropical Forests. Cambridge University Press, Cambridge, pp 243-276
Kikuzawa K (1991) A cost-benefit-analysis of leaf habit and leaf longevity of trees and their geographic pattern. American Naturalist 138:1250-1263
Körner C (1993) Scaling from species to vegetation: The usefullness of functional groups. In: Schulze E-D, Mooney HA (eds) Biodiversity and Ecosystem Function. Springer-Verlag, Berlin, pp 117-140
Koyama H (1981) Photosynthetic rates in lowland rain forest trees of peninsular Malaysia. Japanese Journal of Ecology 31:361-369
Kramer PJ, Kozlowski TT (1979) Physiology of Woody Plants. Academic Press, New York
Küppers M (1984) Carbon relations and competition between woody species in a central European hedgerow II. Stomatal responses, water use, and hydraulic conductivity in the root/leaf pathway. Oecologia 64:344-354
Kursar TA, Wright SJ, Radulovich R (1995) The effects of the rainy season and irrigation on soil water and oxygen in a seasonal forest in Panama. Journal of Tropical Ecology 11:479-516
Lambers H, Chapin FS, III, Pons TL (1998) Plant Physiological Ecology. Springer-Verlag, New York
Lechowicz MJ (1984) The effects of individual variation in physiological and morphological traits on the reproductive capacity of the common cocklebur, Xanthium strumarium L. Evolution 38:833-844
LIDET (1995) Long-term Intersite Decomposition Experiment Team (LIDET) Meeting the Challenges of Long-Term, Broad Scale Ecological Experiments. LTER, Seattle, WA, p 23

100
Mansfield TA, Hetherington AM, Atkinson CJ (1990) Some current aspects of stomatal physiology. Annual Review of Plant Physiology and Plant Molecular Biology 41:55-75
Medina E, Francisco M (1994) Photosynthesis and water relations of savanna tree species differing in leaf phenology. Tree Physiology 14:1367-1381
Meentemeyer V (1978) Microclimate and lignin control of litter decomposition rates. Ecology 59:465-472
Meinzer FC (2003) Functional convergence in plant responses to the environment. Oecologia 134:1-11
Meinzer FC, Andrade JL, Goldstein G, Holbrook NM, Cavelier J, Jackson P (1997) Control of transpiration from the upper canopy of a tropical forest: the role of stomatal, boundary layer and hydraulic architecture components. Plant, Cell and Environment 20:1242-1253
Meinzer FC, Goldstein G (1996) Scaling up from leaves to whole plants and canopies for photosynthetic gas exchange. In: Mulkey SS, Chazdon RL, Smith AP (eds) Tropical Forest Plant Ecophysiology. Chapman & Hall, New York, pp 114-138
Meinzer FC, Grantz DA (1990) Stomatal and hydraulic conductance in growing sugarcane: stomatal adjustment to water transport capacity. Plant, Cell and Environment 13:383-388
Meinzer FC, Grantz DA (1991) Coordination of stomatal, hydraulic, and canopy boundary layer properties: Do stomata balance conductances by measuring transpiration? Physiologia Plantarum 83:324-329
Melillo JM, Aber JD, Muratore JF (1982) Nitrogen and lignin control of hardwood leaf litter decomposition dynamics. Ecology 63:621-626
Miller AJ, Schuur EAG, Chadwick OA (2001) Redox control of phosphorus pools in Hawaiian montane forest soils. Geoderma 102:219-237
Monk CD (1966) An ecological significance of evergreenness. Ecology 47:504-505
Mooney HA, Ferrar PJ, Slatyer RO (1978) Photosynthetic capacity and carbon allocation patterns in diverse growth forms of Eucalyptus. Oecologia 36:103-111
Mulkey SS, Kitajima K, Wright SJ (1995) Photosynthetic capacity and leaf longevity in the canopy of a dry tropical forest. Selbyana 16:169-173
Mulkey SS, Kitajima K, Wright SJ (1996) Plant physiological ecology of tropical forest canopies. Trends in Ecology and Evolution 11:408-412
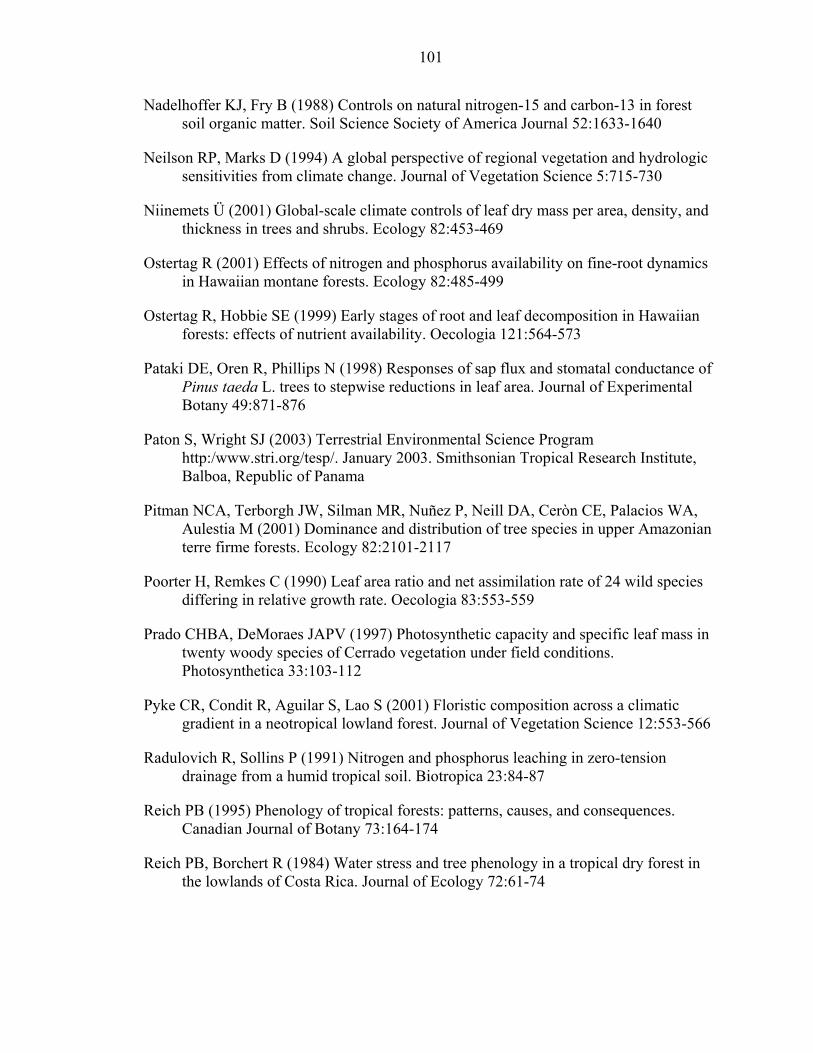
101
Nadelhoffer KJ, Fry B (1988) Controls on natural nitrogen-15 and carbon-13 in forest soil organic matter. Soil Science Society of America Journal 52:1633-1640
Neilson RP, Marks D (1994) A global perspective of regional vegetation and hydrologic sensitivities from climate change. Journal of Vegetation Science 5:715-730
Niinemets Ü (2001) Global-scale climate controls of leaf dry mass per area, density, and thickness in trees and shrubs. Ecology 82:453-469
Ostertag R (2001) Effects of nitrogen and phosphorus availability on fine-root dynamics in Hawaiian montane forests. Ecology 82:485-499
Ostertag R, Hobbie SE (1999) Early stages of root and leaf decomposition in Hawaiian forests: effects of nutrient availability. Oecologia 121:564-573
Pataki DE, Oren R, Phillips N (1998) Responses of sap flux and stomatal conductance of Pinus taeda L. trees to stepwise reductions in leaf area. Journal of Experimental Botany 49:871-876
Paton S, Wright SJ (2003) Terrestrial Environmental Science Program http:/www.stri.org/tesp/. January 2003. Smithsonian Tropical Research Institute, Balboa, Republic of Panama
Pitman NCA, Terborgh JW, Silman MR, Nuñez P, Neill DA, Ceròn CE, Palacios WA, Aulestia M (2001) Dominance and distribution of tree species in upper Amazonian terre firme forests. Ecology 82:2101-2117
Poorter H, Remkes C (1990) Leaf area ratio and net assimilation rate of 24 wild species differing in relative growth rate. Oecologia 83:553-559
Prado CHBA, DeMoraes JAPV (1997) Photosynthetic capacity and specific leaf mass in twenty woody species of Cerrado vegetation under field conditions. Photosynthetica 33:103-112
Pyke CR, Condit R, Aguilar S, Lao S (2001) Floristic composition across a climatic gradient in a neotropical lowland forest. Journal of Vegetation Science 12:553-566
Radulovich R, Sollins P (1991) Nitrogen and phosphorus leaching in zero-tension drainage from a humid tropical soil. Biotropica 23:84-87
Reich PB (1995) Phenology of tropical forests: patterns, causes, and consequences. Canadian Journal of Botany 73:164-174
Reich PB, Borchert R (1984) Water stress and tree phenology in a tropical dry forest in the lowlands of Costa Rica. Journal of Ecology 72:61-74

102
Reich PB, Ellsworth DS, Uhl C (1995) Leaf carbon and nutrient assimilation and conservation in species of differing successional status in an oligiotrophic Amazonian forest. Functional Ecology 9:65-76
Reich PB, Ellsworth DS, Walters MB, Vose JM, Gresham C, Volin JC, Bowman WD (1999) Generality of leaf trait relationships: a test across six biomes. Ecology 80:1955-1969
Reich PB, Walters MB, Ellsworth DS (1997) From tropics to tundra: Global convergence in plant functioning. Proceedings of the National Academy of Science 94:13730-13734
Reich PB, Walters MB, Ellsworth DS, Vose JM, Volin JL, Greshan CA, Bowman WD (1998) Relationships of leaf dark respiration to leaf nitrogen, specific leaf area and leaf life-span: a test across biomes and functional groups. Oecologia 114:471-482
Reich PB, Walters MB, Ellsworth ES (1992) Leaf life-span in relation to leaf, plant, and stand characteristics among diverse ecosystems. Ecological Monographs 62:365-392
Riley RH, Vitousek PM (1995) Nutrient dynamics and nitrogen trace gas flux during ecosystem development in montane rain-forest. Ecology 76:292-304
Running SW, Coughlan JC (1988) A general model for forest ecosystem processes for regional application. I. Hydrologic balance, canopy gas exchange, and primary production processes. Ecological Modeling 42:125-154
Ryan MG, Melillo JM, Ricca A (1989) A comparison of methods for determining proximate carbon fractions of forest litter. Canadian Journal of Forest Research 20:166-171
Samuelson LJ (1998) Influence of intensive culture on leaf net photosynthesis and growth of sweetgum and loblolly pine seedlings. Forest Science 44:308-316
SAS (1985) SAS user's guide. SAS Institute, Cary, North Carolina, USA
Schimper AFW (1898) Plant Geography upon a Physiological Basis. Weinheim, J. Cramer, New York
Schuur EAG, Chadwick OA, Matson PA (2001) Carbon cycling and soil carbon storage in mesic to wet Hawaiian montane forests. Ecology 82:3182-3196
Schuur EAG, Matson PA (2001) Net primary productivity and nutrient cycling across a mesic to wet precipitation gradient in Hawaiian montane forest. Oecologia 128:431-442
Scott NA, Binkley D (1997) Foliage litter quality and annual net N mineralization: comparison across North American forest sites. Oecologia 111:151-159

103
Sharkey TD (1985) Photosynthesis in intact leaves of C3 plants: physics, physiology and rate limitation. The Botanical Review 51:53-105
Shearer G, Kohl DH (1986) N2-fixation in field settings: estimations based on natural 15N abundance. Australian Journal of Plant Physiology 13:699-756
Sims DA, Pearcy RW (1991) Photosynthesis and respiration in Alocasia macrorrhiza following transfers to high and low light. Oecologia 86:447-453
Sobrado MA (1986) Aspects of tissue water relations and seasonal changes of leaf water potential components of evergreen and deciduous species coexisting in tropical dry forests. Oecologia 68:413-416
Sperry JS, Alder NN, Eastlack SE (1993) The effect of reduced hydraulic conductance on stomatal conductance and xylem cavitation. Journal of Experimental Botany 44:1075-1082
Sperry JS, Donnelly JR, Tyree MT (1988) A method for measuring hydraulic conductivity and embolism in xylem. Plant, Cell and Environment 11:35-40
Sperry JS, Pockman WT (1993) Limitation of transpiration by hydraulic conductance and xylem cavitation in Betula occidentalis. Plant, Cell and Environment 16:279-287
Stahlberg R, Cosgrove DJ (1995) Comparison of electric and growth responses to excision in cucumber and pea seedlings. II. Long-distance effects are caused by the release of xylem pressure. Plant, Cell and Environment 18:33-41
Tardieu F, Davies WJ (1993) Integration of hydraulic and chemical signalling in the control of stomatal conductance and water status of droughted plants: opinion. Plant, Cell & Environment 16:341-349
Tilman D (1988) Plant Strategies and the Dynamics and Structure of Plant Communities. Princeton University Press, Princeton, New Jersey
Tilman D, Knops J, Wedin D, Reich P, Ritchie M, Siemann E (1997) The influence of functional diversity and composition on ecosystem processes. Science 277:1300-1302
Torn M, Trumbore SE, Chadwick OA, Vitousek PM, Hendricks DM (1997) Mineral control of soil organic carbon storage and turnover. Nature 389:170-173
Vázquez JA, Givnish T (1998) Altitudinal gradients in tropical forest composition, structure, and diversity in the Sierra de Manantlán. Journal of Ecology 86:999-1020
Veenendaal EM, Swaine MD, Blay D, Yelifari NB, Mullins CE (1996) Seasonal and long-term soil water regime in West African tropical forest. Journal of Vegetation Science 7:473-482

104
Vitousek PM (1995) The Hawaiian Islands as a model system for ecosystem studies. Pacific Science 49:2-16
Vitousek PM, Sanford RL (1986) Nutrient cycling in moist tropical forest. Annual Review of Ecology and Systematics 17:137-167
Vitousek PM, Turner DR, Parton WJ, Sanford RL (1994) Litter decomposition on the Mauna Loa environmental matrix, Hawaii: patterns, mechanisms, and models. Ecology 75:418-429
von Caemmerer S, Farquhar GD (1981) Some relationships between the biochemistry of photosynthesis and the gas exchange of leaves. Planta 153:376-387
von Ende CN (1993) Repeated-measures analysis: growth and other time-dependent measures. In: Guretitch J, Scheiner, SM (eds) Design and Analysis of Ecological Experiments. Chapman & Hall, New York, pp 113-137
Wardle DA, Barker GM, Bonner KI, Nicholson KS (1998) Can comparative approaches based on plant ecophysiological traits predict the nature of biotic interactions and individual plant species effects in ecosystems. Journal of Ecology 86:405-420
Wardle DA, Bonner KI, Barker GM (2002) Linkages between plant litter decomposition, litter quality, and vegetation responses to herbivores. Functional Ecology 16:585-595
Werger MJA, Morris JW (1991) Climatic control of vegetation structure and leaf characteristics along an aridity gradient. Annali di Botanica IL:203-215
West GB, Brown JH, Enquist BJ (1999) A general model for the structure and allometry of plant vascular systems. Nature 400:664-667
Westoby M (1998) A leaf-height-seed (LHS) plant ecology strategy scheme. Plant and Soil 199:213-227
Williams M, Rastetter EB, Fernandes DN, Goulden ML, Wofsy SC, Shaver GR, Melillo JM, Munger JW, Fan S-M, Nadelhoffer KJ (1996) Modelling the soil-plant atmosphere continuum in a Quercus-Acer at Harvard Forest: the regulation of stomatal conductance by light, nitrogen and soil/plant hydraulic properties. Plant, Cell and Environment 19:911-927
Williamson VG, Milburn JA (1995) Cavitation events in cut stems kept in water: implications for cut flower senescence. Scientia Horticulturae 64:219-232
Woodring W, Steward R, Steward J (1980) Geological map of the Panama Canal. U.S. Geological Survey, Reston, VA
Woodward FI, Smith TM, Emanuel WR (1995) A global primary productivity and phytogeography model. Global Biogeochemical Cycles 9:471-490

105
Wright IJ, Westoby M (1999) Differences in seedling growth behaviour among species: trait correlations across species, and trait shifts along nutrient compared to rainfall gradients. Journal of Ecology 87:85-97
Wright SJ (1992) Seasonal drought, soil fertility and the species density of tropical forest plant communities. Trends in Ecology and Evolution 7:260-263
Wullschleger SD (1993) Biochemical limitations to carbon assimilation in C3 plants—A retrospective analysis of the A/Ci curves from 109 species. Journal of Experimental Botany 44:907-920
Yavitt JB (2000) Nutrient dynamics of soil derived from different parent material on Barro Colorado Island, Panama. Biotropica 32:198-207
Yavitt JB, Wieder RK, Wright SJ (1993) Soil nutrient dynamics in response to irrigation of a Panamanian tropical moist forest. Biogeochemistry 19:1-25
Zhang J, Davies WJ (1990) Changes in the concentration of ABA in xylem sap as a function of changing soil water status can account for changes in leaf conductance and growth. Plant, Cell and Environment 13:227-285

BIOGRAPHICAL SKETCH
Louis Stephen Santiago was born on February 13, 1970 in Aiea, Oahu, Hawaii.
After several years, he moved with his family to San Francisco Bay, where he was raised.
During his youth, Louis spent time playing in the dunes of Half Moon Bay, and walking
in the East Bay hills and Sierra Nevada foothills with his father. These activities
stimulated an interest in the natural world. For undergraduate studies, Louis attended the
University of California at Berkeley. Although he began in Chemistry, he soon switched
to Integrative Biology. He had the opportunity to work on several independent projects in
the East Bay hills, in the Mojave Desert, and on the island of Moorea, Tahiti, in the South
Pacific. These experiences inspired a strong interest in tropical biology. After graduating
from the University of California in 1993, Louis began a masters program at the
University of Hawaii, under the direction of Dr. Guillermo Goldstein. Louis pursued a
masters project in the cloud forests of Waikamoi, Maui. Before graduating from the
University of Hawaii, however, he spent five months at Dr. Goldstein’s lab in Panama;
and began developing the doctoral project presented in this dissertation. Louis then
returned to Hawaii, graduated in 1998, and immediately began a doctoral program at the
University of Florida with Dr. Stephen Mulkey. After completing his doctoral studies,
Louis will return to the University of California at Berkeley for a postdoctoral position in
stable isotope ecology.
106