Leading the Transformation. - volkswagen-newsroom.com
19
Leading the Transformation. Media Conference Call 9M 2021 Volkswagen AG 28 October 2021
Transcript of Leading the Transformation. - volkswagen-newsroom.com
Leading the Transformation.
Media Conference Call 9M 2021Volkswagen AG28 October 2021
Disclaimer
2
The following presentations as well as remarks/comments and explanations in this context contain forward-looking statements on the business
development of the Volkswagen Group. These statements are based on assumptions relating to the development of the economic, political and
legal environment in individual countries, economic regions and markets, and in particular for the automotive industry, which we have made on the
basis of the information available to us and which we consider to be realistic at the time of going to press. The estimates given entail a degree of
risk, and actual developments may differ from those forecast.
Any changes in significant parameters relating to our key sales markets, or any significant shifts in exchange rates or commodities or the supply
with parts relevant to the Volkswagen Group or deviations in the actual effects of the Covid-19 pandemic from the scenario presented will have a
corresponding effect on the development of our business. In addition, there may be departures from our expected business development if the
assessments of the factors influencing sustainable value enhancement and of risks and opportunities presented develop in a way other than we are
currently expecting, or if additional risks and opportunities or other factors emerge that affect the development of our business.
We do not update forward-looking statements retrospectively. Such statements are valid on the date of publication and can be superseded.
This information does not constitute an offer to exchange or sell or an offer to exchange or buy any securities.
Media Conference Call 9M 2021
3
Arno Antlitz
Chief Financial OfficerVolkswagen AG
Nicole Mommsen
Head ofGlobal Group Communications
Volkswagen AG
Herbert Diess
Chairman of theBoard of Management
Volkswagen AG
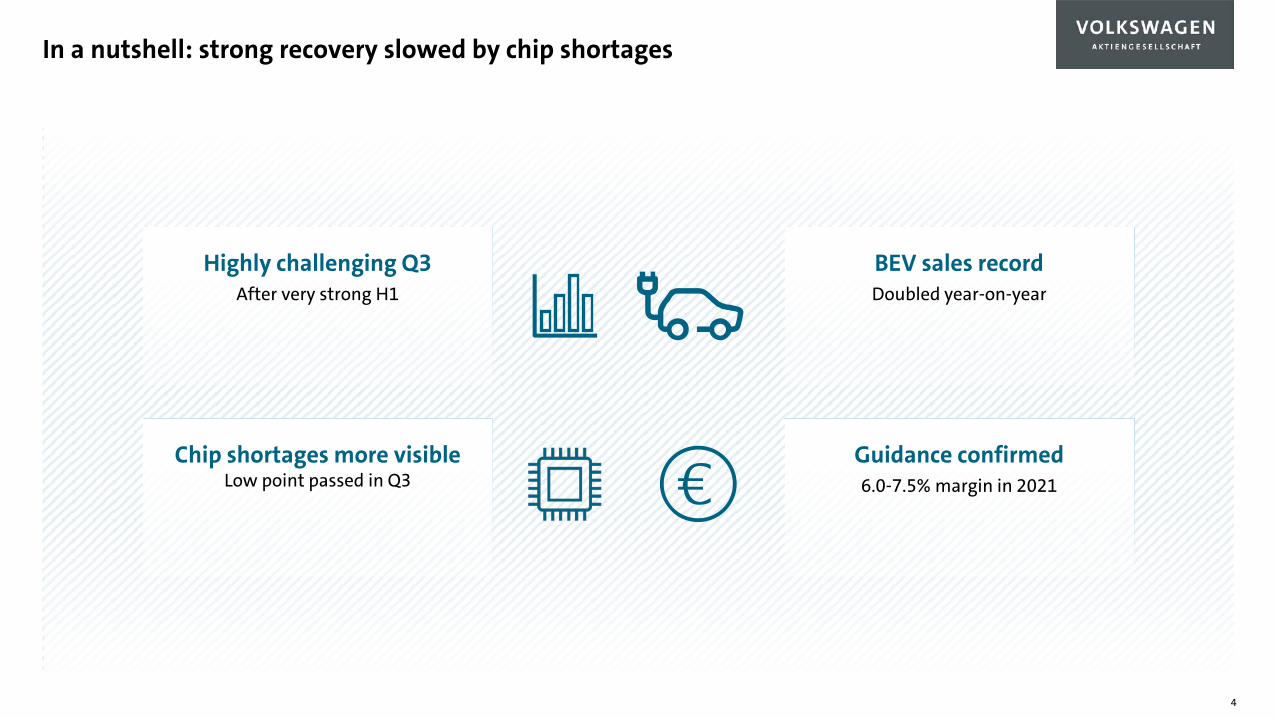
In a nutshell: strong recovery slowed by chip shortages
4
Chip shortages more visibleLow point passed in Q3
BEV sales recordDoubled year-on-year
Guidance confirmed6.0-7.5% margin in 2021
Highly challenging Q3After very strong H1
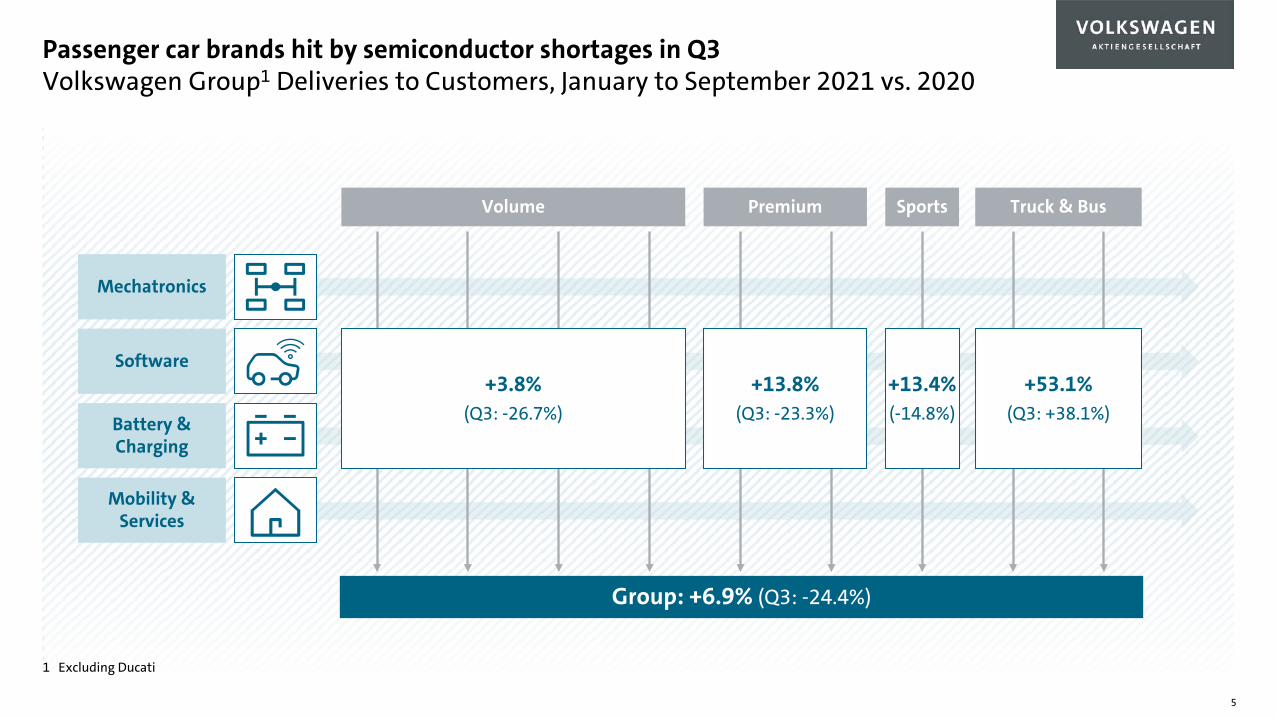
Passenger car brands hit by semiconductor shortages in Q3Volkswagen Group1 Deliveries to Customers, January to September 2021 vs. 2020
5
1 Excluding Ducati
Volume Premium Sports
Mobility & Services
Software
Mechatronics
Battery & Charging
Truck & Bus
Group: +6.9% (Q3: -24.4%)
+3.8%(Q3: -26.7%)
+13.8%(Q3: -23.3%)
+13.4%(-14.8%)
+53.1%(Q3: +38.1%)
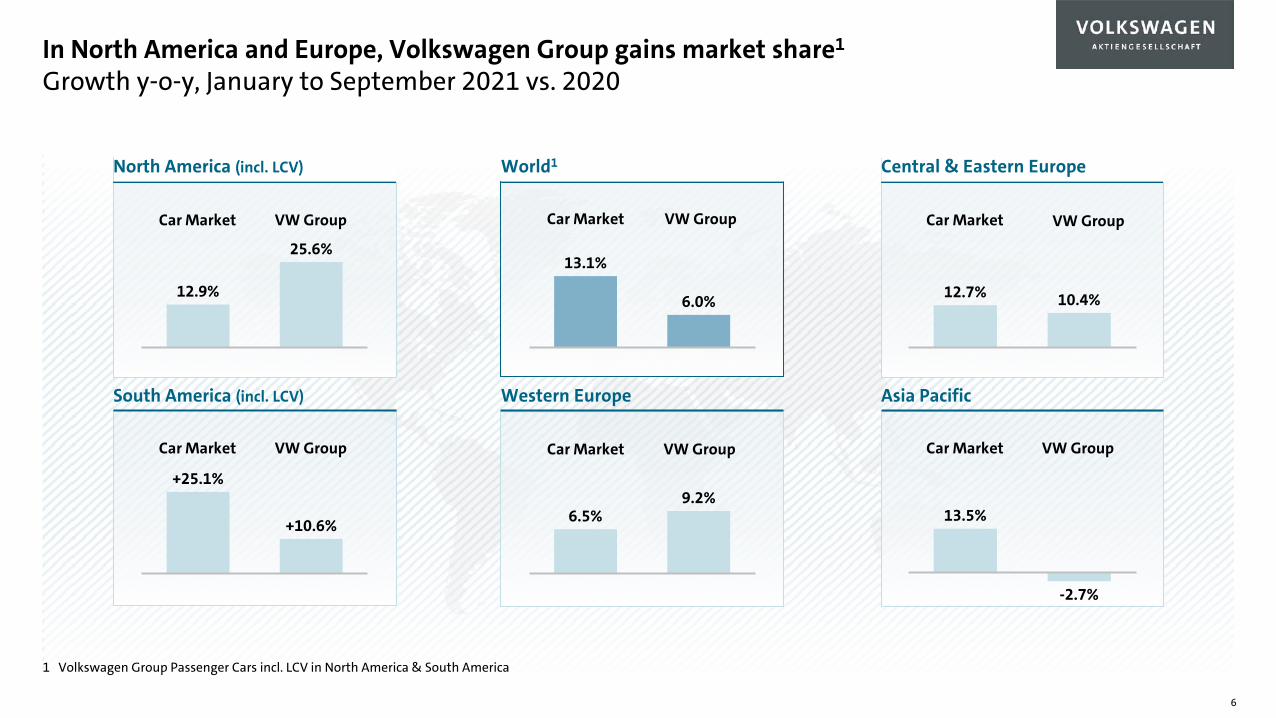
In North America and Europe, Volkswagen Group gains market share1
Growth y-o-y, January to September 2021 vs. 2020
6
Car Market VW Group
Car Market VW Group
Car Market VW Group
Car Market VW GroupCar Market VW Group
Car Market VW Group
25.6%
12.9% 12.7% 10.4%
13.5%
-2.7%
+25.1%
+10.6%
13.1%
6.0%
6.5%9.2%
North America (incl. LCV) World1 Central & Eastern Europe
South America (incl. LCV) Western Europe Asia Pacific
1 Volkswagen Group Passenger Cars incl. LCV in North America & South America
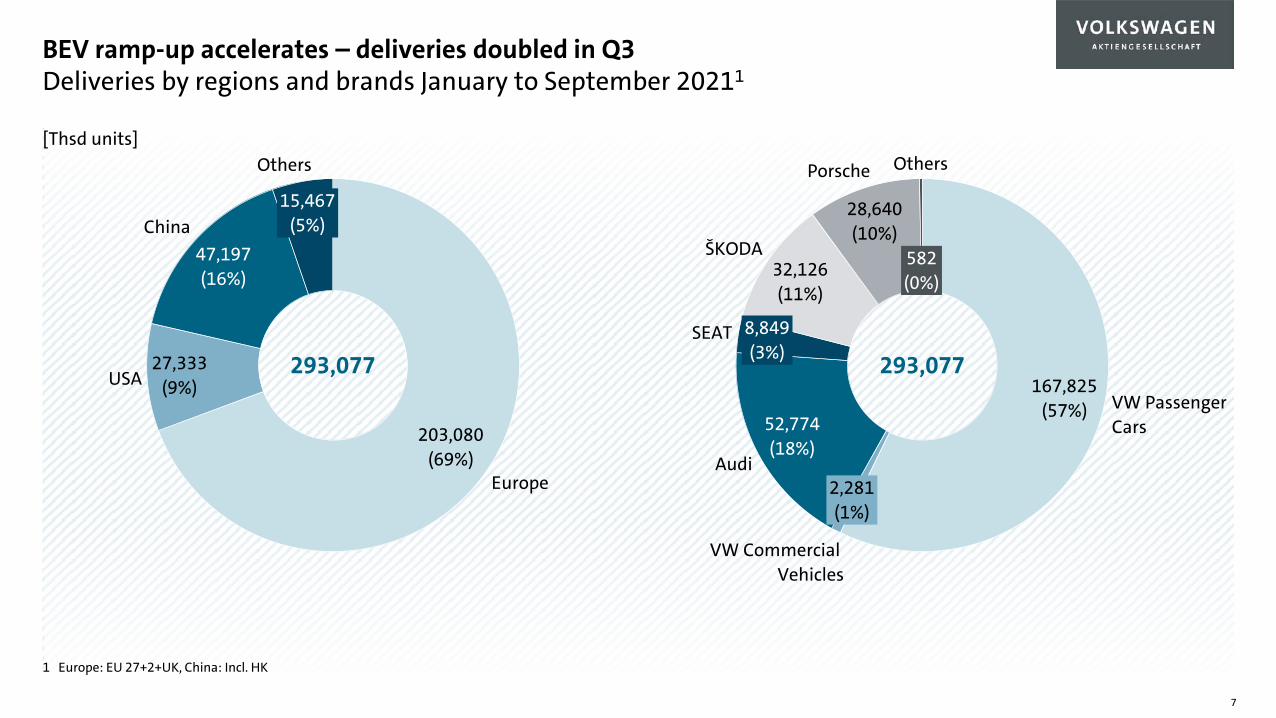
BEV ramp-up accelerates – deliveries doubled in Q3Deliveries by regions and brands January to September 20211
7
[Thsd units]
Europe
203,080(69%)
27,333(9%)
47,197(16%)
USA
China15,467
(5%)
Others
293,077167,825
(57%)52,774(18%)
SEAT
VW Passenger Cars
2,281(1%)
Audi
VW Commercial Vehicles
32,126(11%)
8,849(3%)
ŠKODA
28,640(10%)
Porsche
582(0%)
Others
293,077
1 Europe: EU 27+2+UK, China: Incl. HK
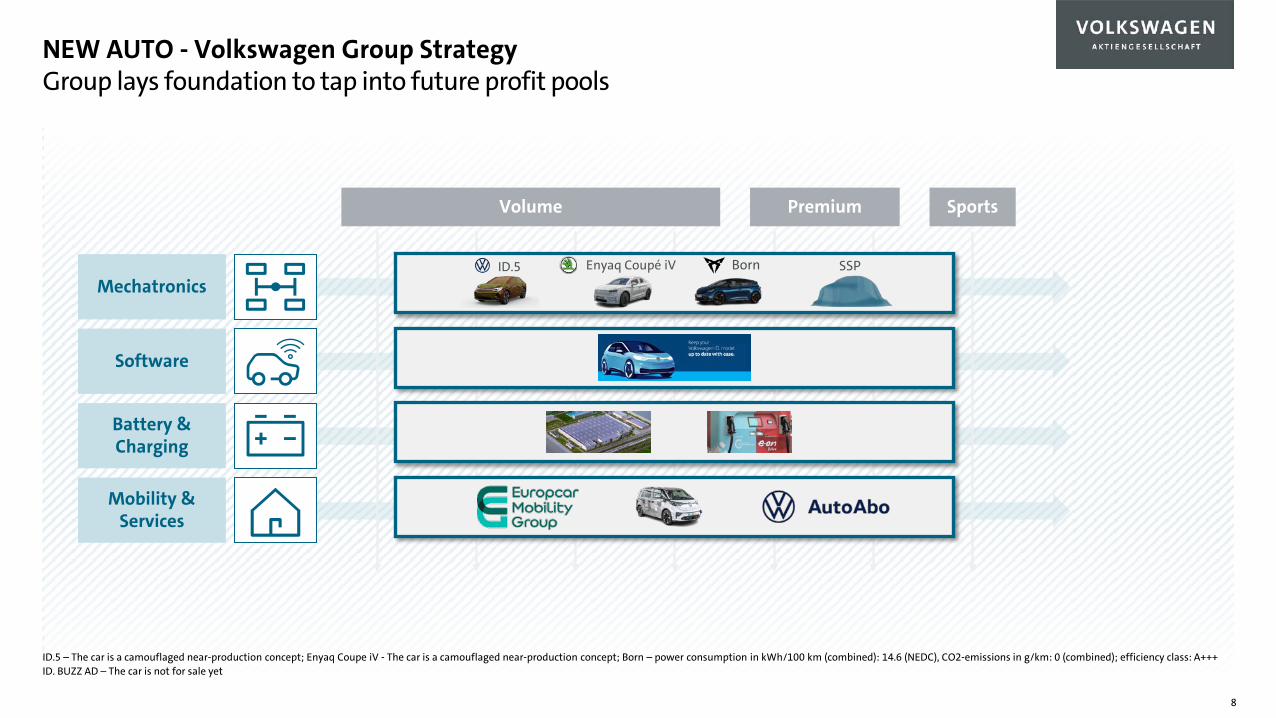
NEW AUTO - Volkswagen Group StrategyGroup lays foundation to tap into future profit pools
8
Volume Premium Sports
Mobility & Services
Software
Mechatronics
Battery & Charging
Enyaq Coupé iVID.5 Born SSP
ID.5 – The car is a camouflaged near-production concept; Enyaq Coupe iV - The car is a camouflaged near-production concept; Born – power consumption in kWh/100 km (combined): 14.6 (NEDC), CO2-emissions in g/km: 0 (combined); efficiency class: A+++ID. BUZZ AD – The car is not for sale yet
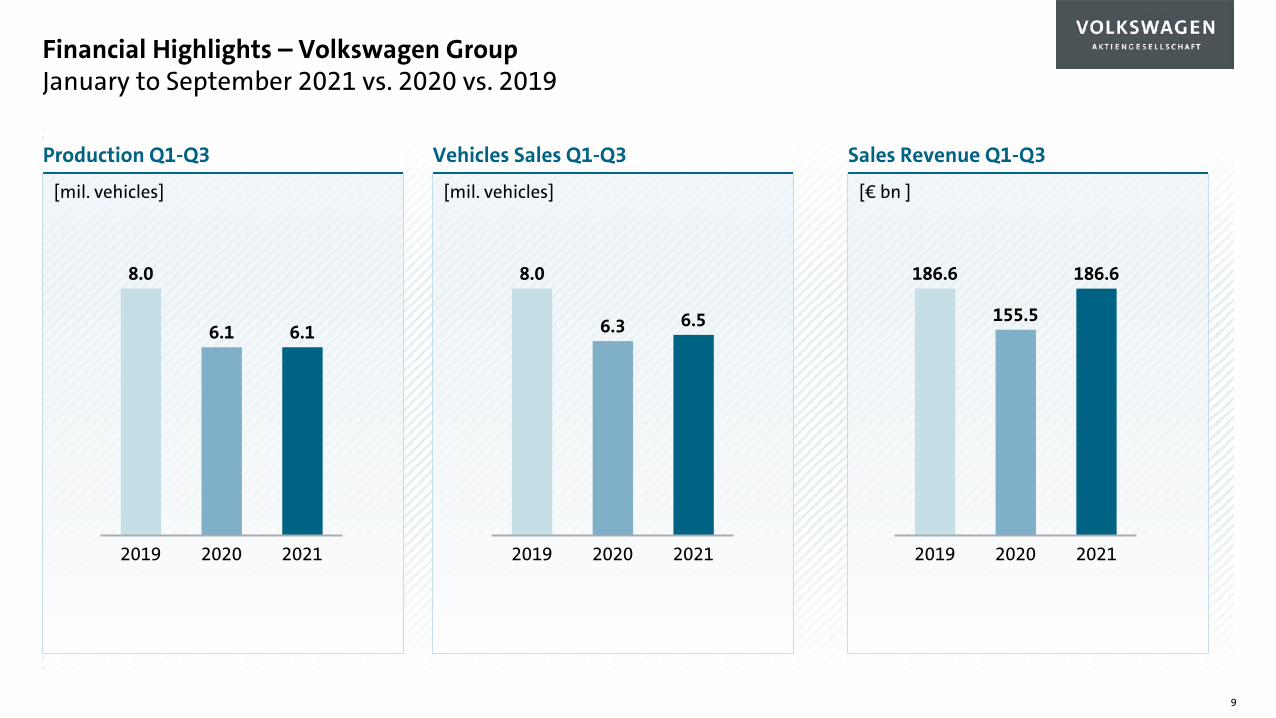
Financial Highlights – Volkswagen GroupJanuary to September 2021 vs. 2020 vs. 2019
9
[mil. vehicles]
Vehicles Sales Q1-Q3
[€ bn ]
Sales Revenue Q1-Q3
186.6
2019 2020 2021
155.5
186.6
6.3 6.5
2019
8.0
2020 2021
[mil. vehicles]
Production Q1-Q3
6.1
2019 2020 2021
8.0
6.1
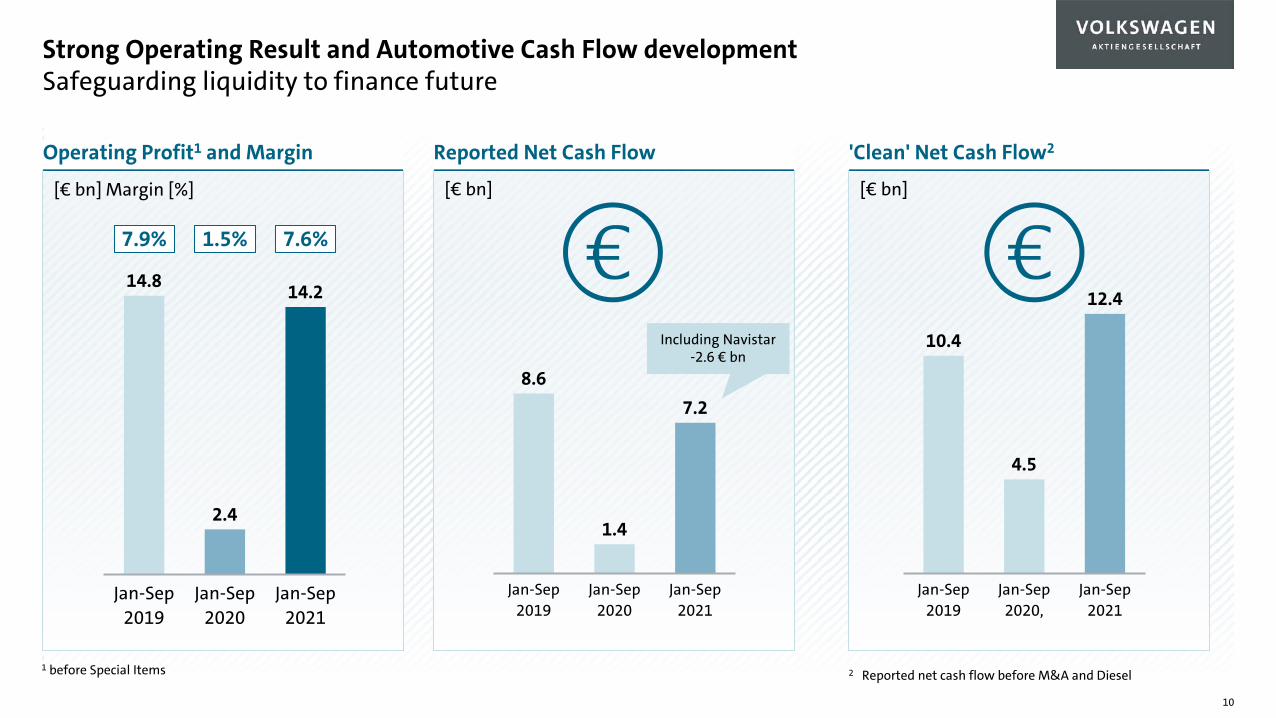
[€ bn]
Reported Net Cash Flow
[€ bn]
'Clean' Net Cash Flow2
Strong Operating Result and Automotive Cash Flow development Safeguarding liquidity to finance future
Jan-Sep 2019
Jan-Sep 2020
Jan-Sep 2021
7.28.6
1.4
12.4
Jan-Sep 2019
Jan-Sep 2020,
Jan-Sep 2021
4.5
10.4
[€ bn] Margin [%]
Operating Profit1 and Margin
2.4
Jan-Sep 2019
Jan-Sep 2020
Jan-Sep 2021
14.214.8
1.5% 7.6%7.9%
2 Reported net cash flow before M&A and Diesel1 before Special Items
10
Including Navistar-2.6 € bn
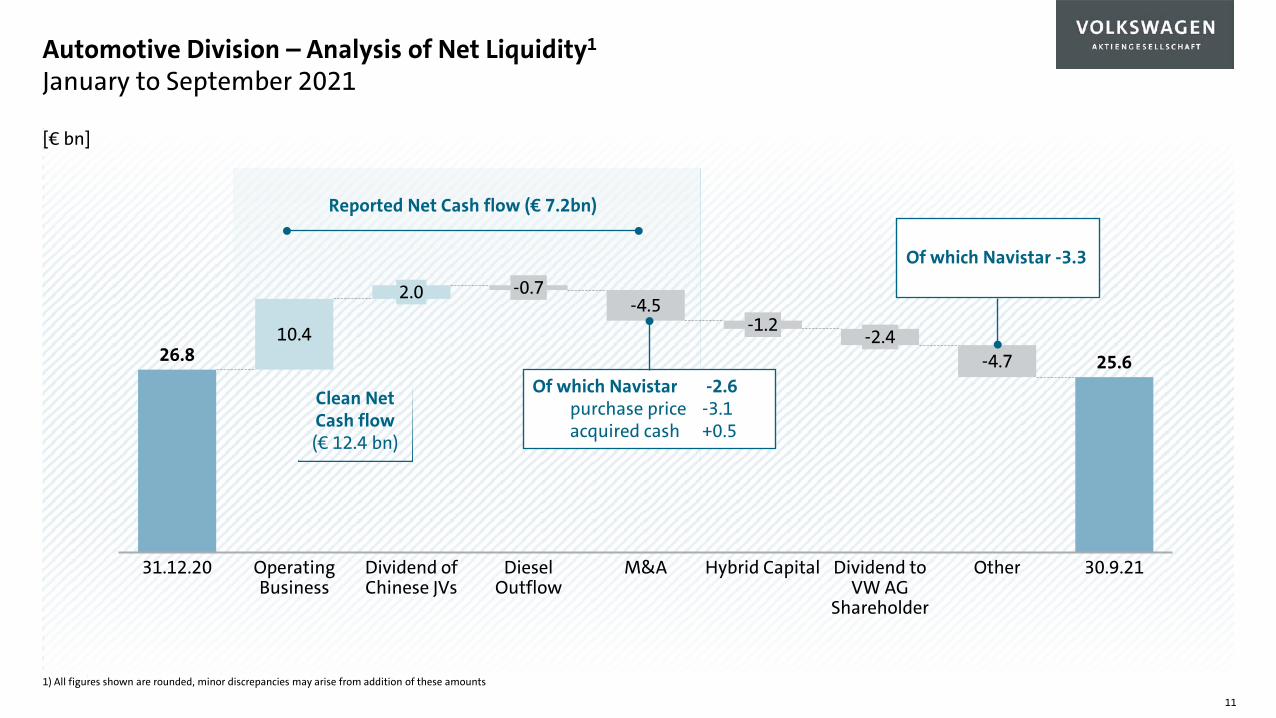
Automotive Division – Analysis of Net Liquidity1
January to September 2021
11
1 All figures shown are rounded, minor discrepancies may arise from addition of these amounts
Dividend of Chinese JVs
2.0
31.12.20
10.4
DieselOutflow
OperatingBusiness
Dividend toVW AG
Shareholder
-0.7-4.5
M&A
-1.2
Hybrid Capital
-2.4-4.7
Other 30.9.21
26.8 25.6
[€ bn]
Reported Net Cash flow (€ 7.2bn)
Of which Navistar -3.3
Of which Navistar -2.6purchase price -3.1acquired cash +0.5
Clean Net Cash flow(€ 12.4 bn)
1) All figures shown are rounded, minor discrepancies may arise from addition of these amounts
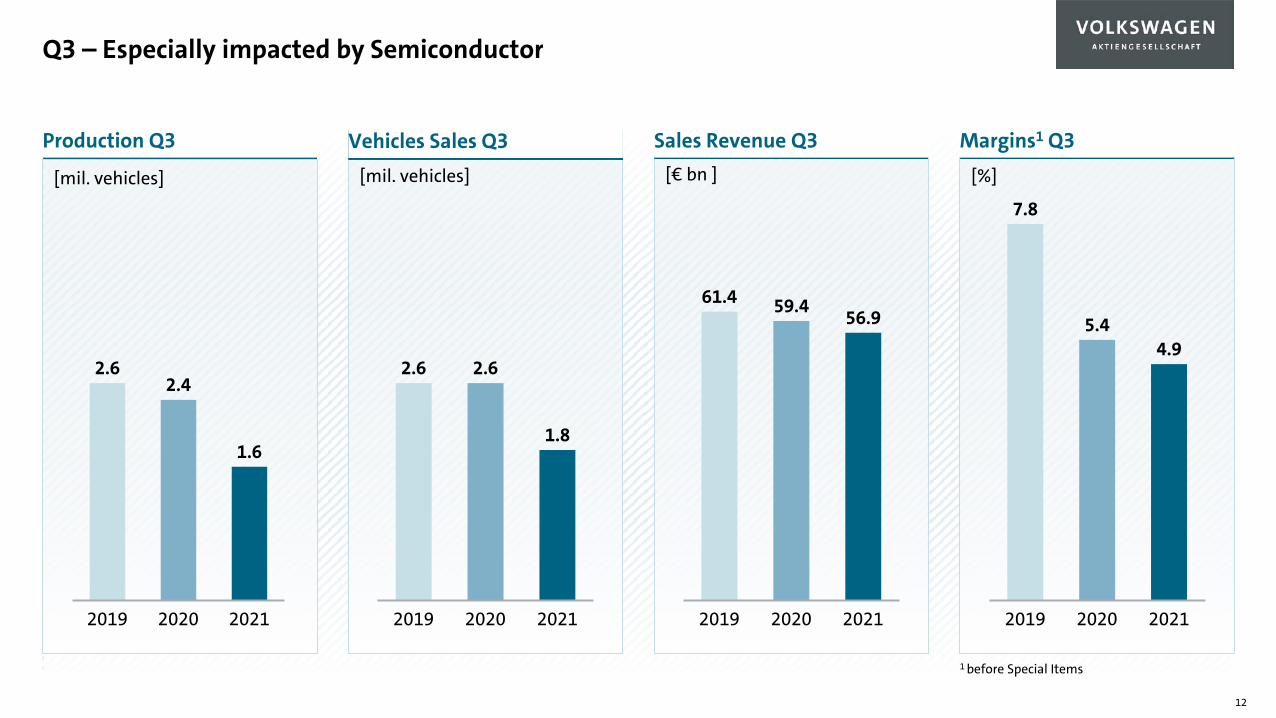
Q3 – Especially impacted by Semiconductor
12
[mil. vehicles] [mil. vehicles]
Vehicles Sales Q3[€ bn ]
Sales Revenue Q3
20212020
56.9
2019
61.4 59.4
2020 20212019
2.6 2.6
1.8
Production Q3
2021
2.6
2019 2020
2.4
1.6
[%]
4.9
2021
5.4
20202019
7.8
Margins1 Q3
1 before Special Items
1 before Special Items
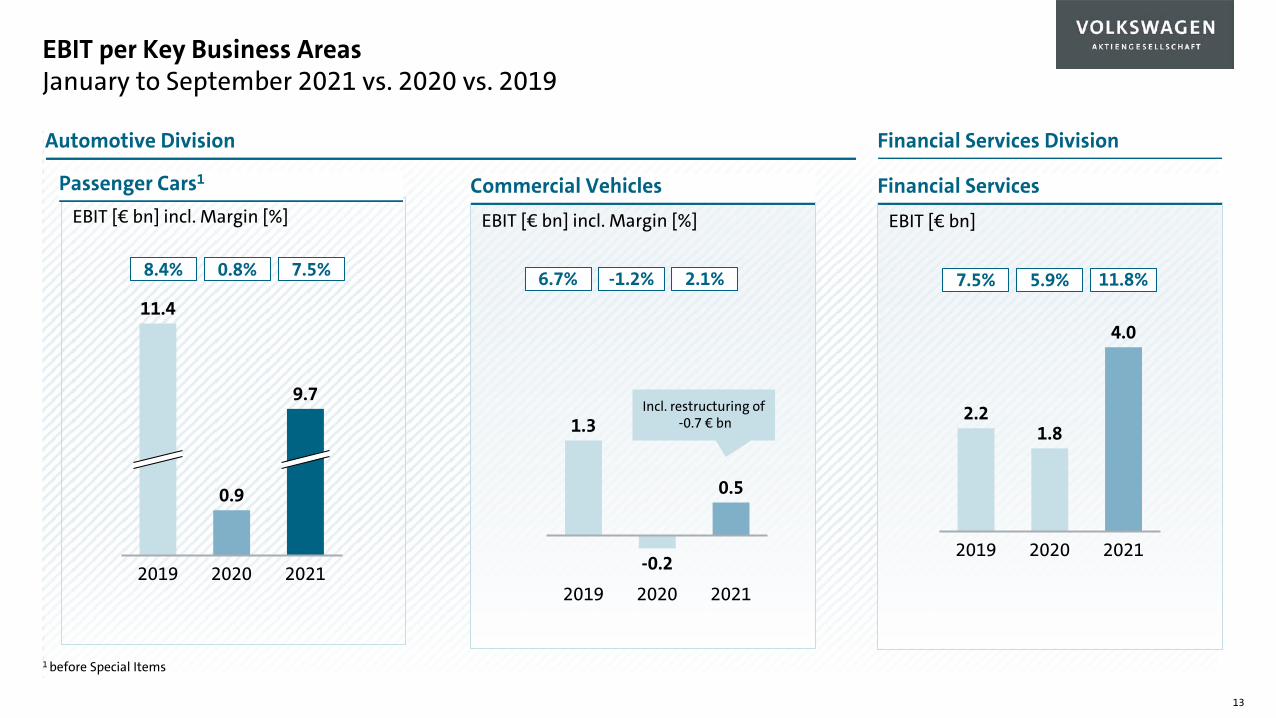
EBIT [€ bn] incl. Margin [%]
EBIT per Key Business AreasJanuary to September 2021 vs. 2020 vs. 2019
13
EBIT [€ bn] incl. Margin [%]
Automotive Division
EBIT [€ bn]
Financial Services Division
Passenger Cars1 Commercial Vehicles Financial Services
2020
0.9
2019 2021
11.4
9.7
2019 2020
1.3
2021
0.5
-0.2
4.0
2019
1.8
2020 2021
2.2
0.8% 7.5% -1.2% 2.1%8.4% 6.7%
Incl. restructuring of-0.7 € bn
11.8%5.9%7.5%
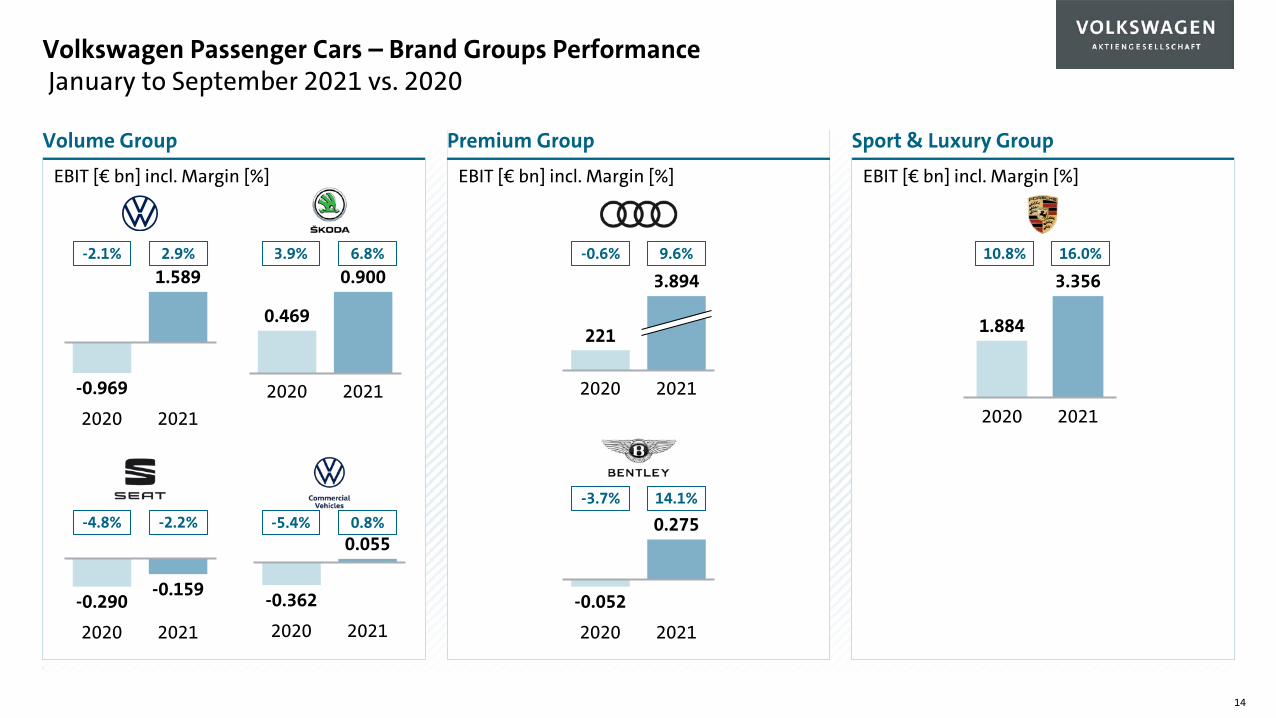
EBIT [€ bn] incl. Margin [%] EBIT [€ bn] incl. Margin [%]
Volume Group
EBIT [€ bn] incl. Margin [%]
Premium Group Sport & Luxury Group
Volkswagen Passenger Cars – Brand Groups Performance January to September 2021 vs. 2020
14
2020 2021
-0.969
1.589
2020 2021
0.469
0.900
2020 2021
-0.290-0.159
2020
-0.362
2021
0.055
221
3.894
20212020
2020
-0.052
2021
0.275
1.884
2020 2021
3.356-2.1% 2.9% 3.9% 6.8% -0.6% 9.6% 10.8% 16.0%
-5.4% 0.8%-3.7% 14.1%
-4.8% -2.2%
Z884JCRF
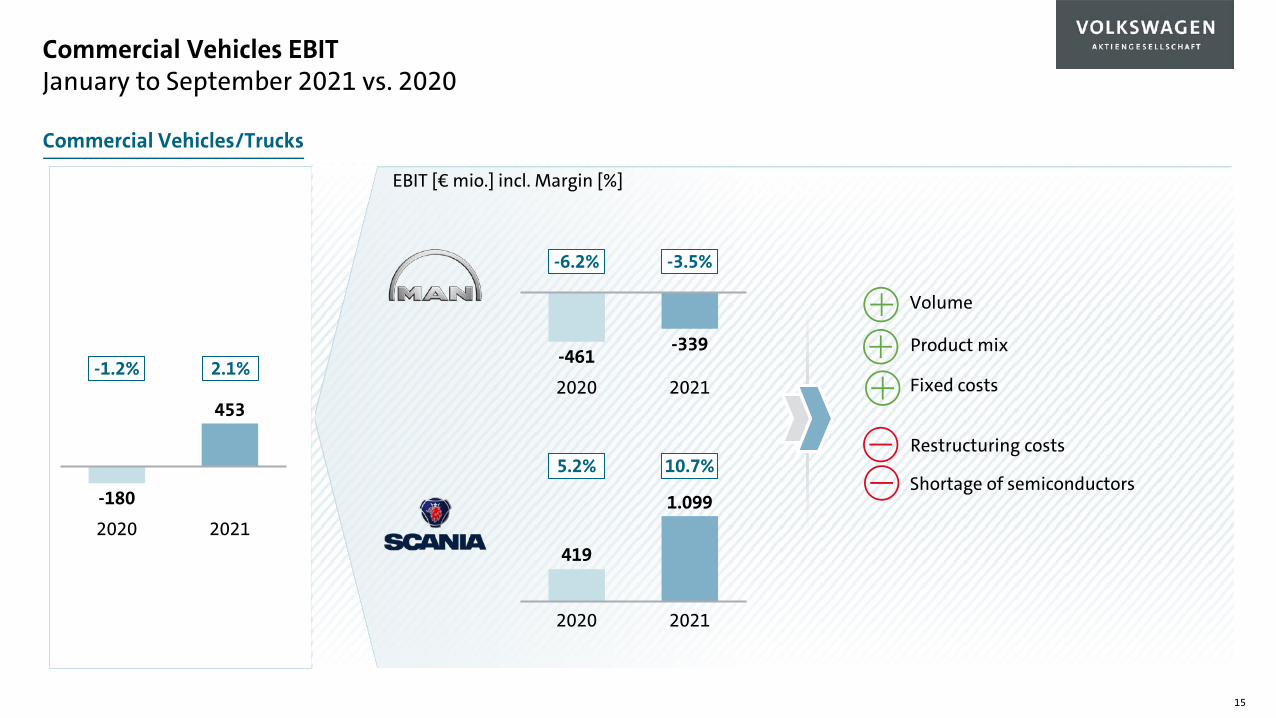
Commercial Vehicles EBITJanuary to September 2021 vs. 2020
Commercial Vehicles/Trucks
EBIT [€ mio.] incl. Margin [%]
419
1.099
2020 2021
-461-339
2020 2021
5.2% 10.7%
-6.2% -3.5%
Volume
Restructuring costs
Product mix
Fixed costs
Shortage of semiconductors
2.1%
-180
453
2020 2021
-1.2%
15
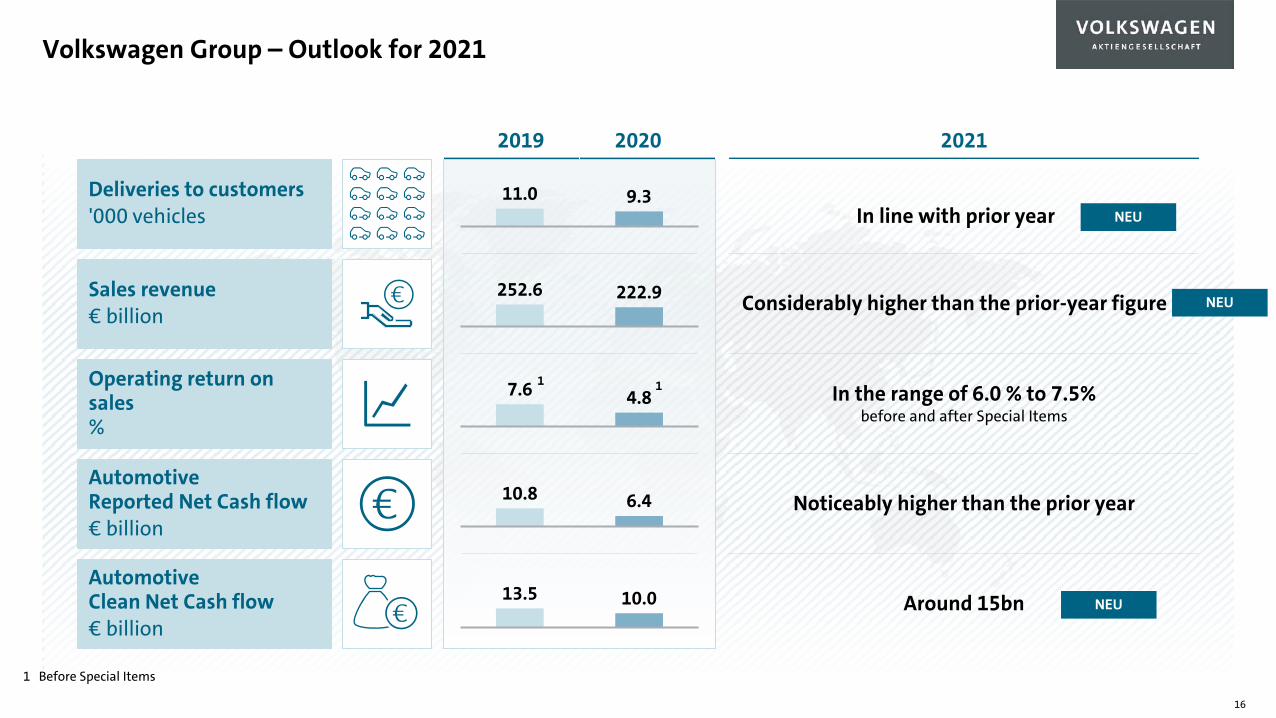
Volkswagen Group – Outlook for 2021
16
Around 15bn
1 Before Special Items
2019
11.0 9.3
222.9252.6Considerably higher than the prior-year figure
7.6 4.8 In the range of 6.0 % to 7.5%before and after Special Items
1
6.410.8 Noticeably higher than the prior year
13.5 10.0
1
Deliveries to customers'000 vehicles
Sales revenue € billion
Operating return on sales %
AutomotiveReported Net Cash flow€ billion
AutomotiveClean Net Cash flow€ billion
2020 2021
NEUIn line with prior year
NEU
NEU
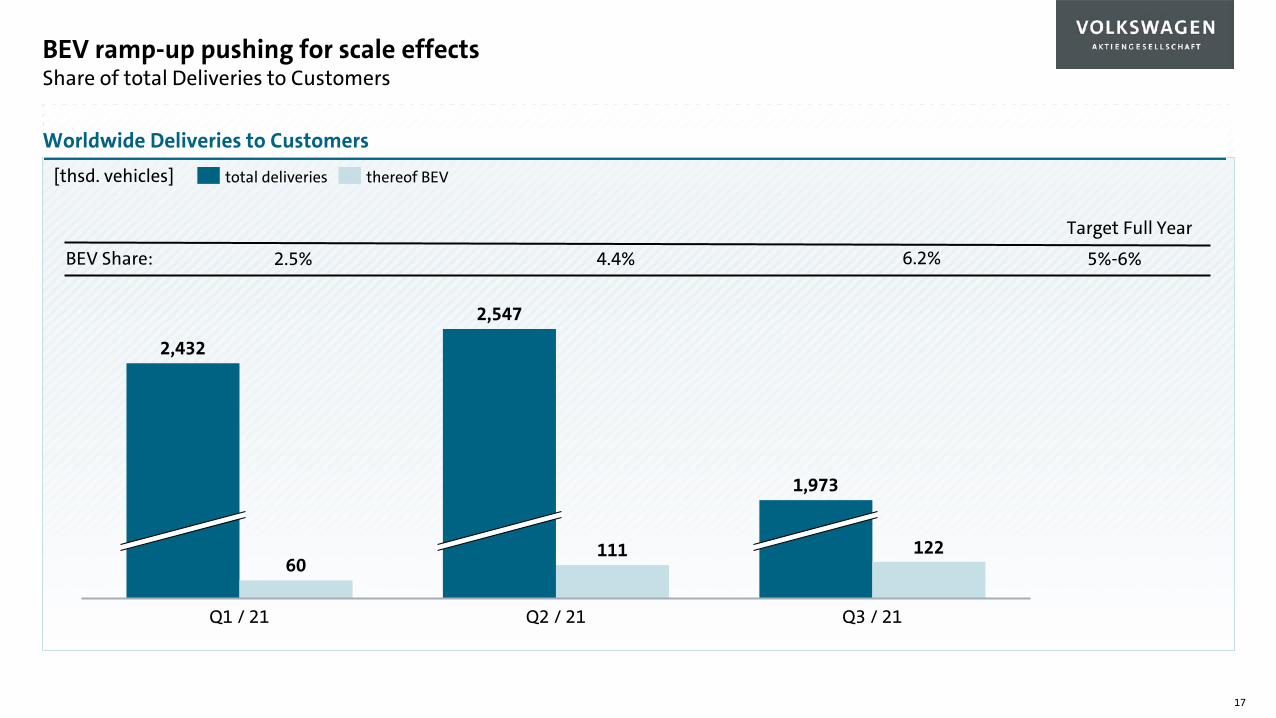
BEV ramp-up pushing for scale effectsShare of total Deliveries to Customers
17
[thsd. vehicles]
60111 122
2,432
Q1 / 21 Q2 / 21 Q3 / 21
2,547
1,973
thereof BEVtotal deliveries
Worldwide Deliveries to Customers
BEV Share: 2.5% 4.4% 6.2%
Target Full Year
5%-6%
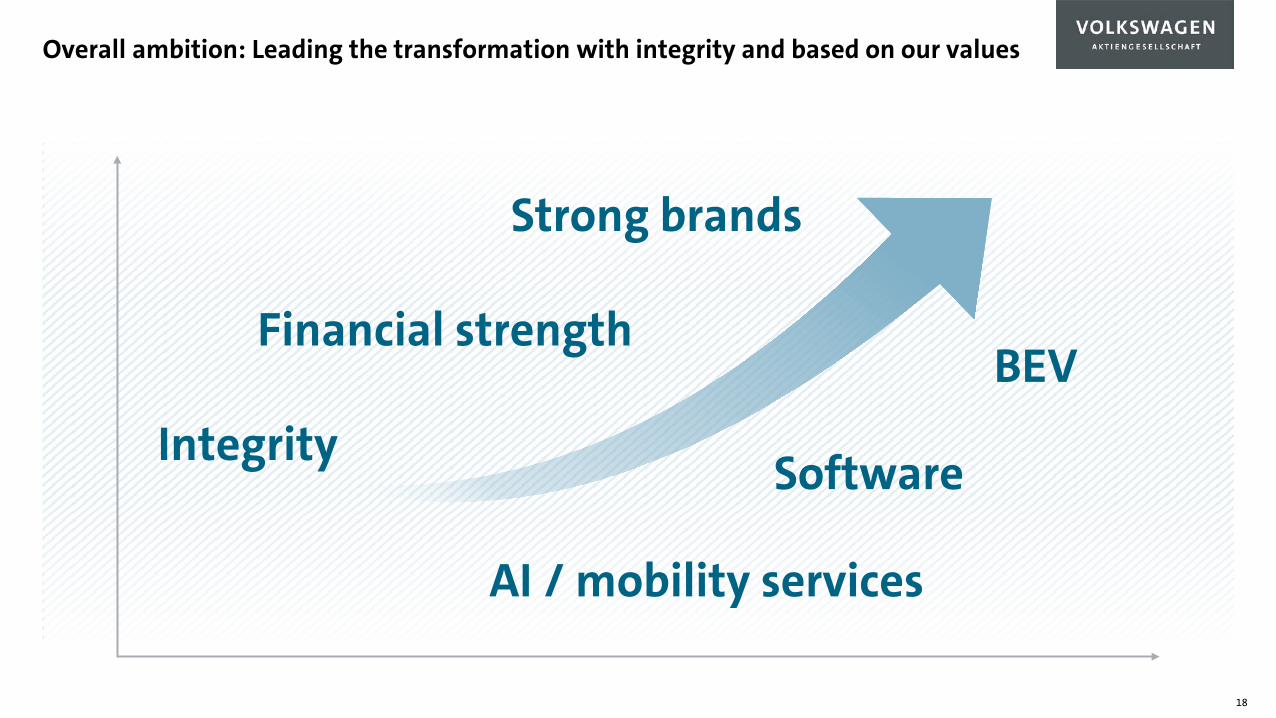
Overall ambition: Leading the transformation with integrity and based on our values
18
BEV
Software
AI / mobility services
Strong brands
Financial strength
Integrity
Leading the Transformation.
Appendix