Leading the Public Service to Higher Productivity Status quo with regard to the representation of...
21
Leading the Public Service to Higher Produ persons with disabilities in the Public Service and women at Senior Management Services 23 February 2015
-
Upload
nancy-dawson -
Category
Documents
-
view
216 -
download
2
Transcript of Leading the Public Service to Higher Productivity Status quo with regard to the representation of...

Leading the Public Service to Higher Productivity
Status quo with regard to the representation of persons with disabilities in the Public Service and women at Senior Management Services
23 February 2015

Leading the Public Service to Higher Productivity
Outline of presentation
•Introduction•Trends•Representation of people with disabilities
across all levels and representation of women at SMS per province per departments.
•Conclusion

Leading the Public Service to Higher Productivity
Introduction • Cabinet’s decisions to achieve 50% of women at SMS and 2% of people
with disabilities across all levels has not been met.• Against this background, the CD: TPP has doubled efforts to tightly
monitor departments and provide technical assistance on employment equity. Following the development and implementation of the Gender Equality Strategic Framework and the JobAccess, the CD embarked on several interventions such as paying visits to departments to provide individual attention.
• The CD developed templates to guide the implementation planning and reporting on the frameworks. These reporting requirements have been incorporated in the MPAT process of the Department for Monitoring and Evaluation.
• The CD has also introduced a system to closely monitor; particularly those departments that remain below 30% for women at SMS and 1% for People with Disabilities. Such departments were requested to draw remedial plans that outline how they were going to remedy their situation.

Leading the Public Service to Higher Productivity
Compliance with equity targets: Representation of women at senior management in the Public Service in the past 20 years
1995 1997 1999 2001 2003 2005 2007 2009 2011 20130%
10%
20%
30%
40%
50%
60%
70%
80%
90%
100%
8%
13%17%
20%24%
29%33% 35%
37%40%
92%
87%83%
80%76%
71%67% 65%
63%60%
WomenMale

Leading the Public Service to Higher Productivity
Compliance with equity targets: Representation of persons with disabilities in the Public Service in the past 20 years
1994 1995 1996 1997 1998 1999 2000 2001 2002 2003 2004 2005 2006 2007 2008 2009 2010 2011 2012 2013 20140
0.001
0.002
0.003
0.004
0.005
0.006

Leading the Public Service to Higher Productivity
Trends • 23 departments have met the 50% equity target as at 31 December 2014.• 29 departments have met the 2% disability target.• Gauteng has the highest percentage of representation of women at SMS at 44.4%
as well as the representation of people with disabilities at 1.28%.
• Statistics per department from March 2014 to December 2014 follow in the next slides.
KEY: Red-below 30% and 1%; Blue -30-39; Yellow- 40-49 and between 1-1.9%; Green-met the 50% and 2% targets

Leading the Public Service to Higher Productivity
Eastern Cape
March 2014 June 2014 September 2014 Dec 2014
50% 2% 50% 2% 50% 2% 50% 2%
Office of the Premier 47.4 0.81 50 1.09 50 1.34 53.1 1.26
Department of Rural Development and Agrarian Reform
33.3 1.35 35 0.75 34.4 0.70 33.3 0.64
Department of Economic Development , Environmental Affairs & Tourism
34.2 0.83 34 0.83 35.9 0.83 36.8 0.85
Department of Education 29.3 0.33 28 0.33 28 0.33 26.3 0.33
Department of Health 44.3 0.3 45 0.30 50 0.29 49.1 0.29
Department of Human Settlement 48.0 1.26 48 1.45 48 1.42 48 1.32
Department Local Government and Traditional Affairs 35.0 2.63 35 2.5 34.4 2.6 35 2.50
Department of Roads and Public Works 27.5 1.35 33 1.39 33.3 1.31 31.5 1.27
Department of Transport 24.2 0 24 0.56 23.3 0.50 22.5 0.43
Department of Social Development 41.8 1.2 41 1.15 42.5 1.15 42.1 1.18
Department of Sport, Recreation, Arts and Culture 26.9 0 28 0.98 32 1.15 34.6 1.06
Department of Safety and Liaison 54.5 0.78 55 0.76 53.8 0.74 50 0.75
Provincial Planning and Treasury 41.7 1.3 39 1.12 38.3 0.95 37.3 0.01
Total 38.4 0.44 39.3 0.43 39.3 0.43

Leading the Public Service to Higher Productivity
Free State
March 2014 June 2014 September 2014 Dec 2014
50% 2% 50% 2% 50% 2% 50% 2%
Office of the Premier 25 1.29 28 1.30 24.1 1.32 31.2 1.30Department of Agriculture & Rural Development 42.3 0 41 0 40.7 0 40.7 0
Department of Economic Development, Tourism and Environmental Affairs
25 0.43 25 0.43 37 0.42 40.7 0.42
Department of Education 26.8 0.14 26 0.14 26.1 0.14 24.3 0.15
Department of Health 32.5 0.12 33 0.12 32.6 0.12 35.4 0.12
Departments of Cooperative Governance and Traditional Affairs
29.1 0 29 0 41.3 0 36.6 0
Department of Police, Roads and Transport 15.3 0.43 17 0.48 16.6 0.46 17.1 0.45
Department of Public Works 31.8 1.39 36 1.22 34.7 1.38 34.7 1.99
Department of Social Development 48.1 0 48 0 51.7 0 50 0
Department of Sports, Arts, Culture and Recreation 36.8 2.06 37 2.07 36.8 1.85 36.8 1.86
Department of Treasury 20.8 0.54 23 0.55 25 0.82 25.9 0.75Department of Human Settlements 45 0 45 0 45 0 42.1
Total 32 0.23 33.2 0.24 33.8 0.25

Leading the Public Service to Higher Productivity
Gauteng
March 2014 June 2014 September 2014 Dec 2014
Gauteng 50% 2% 50% 2% 50% 2% 50% 2%
Office of the Premier 38 3.49 41 3.33 39.5 3.11 41.1 3.05
Department of Agriculture and Rural Development 43.5 0.7 46 0.58 46.1 0.58 39.4 0.90
Department of Community Safety 50 1.49 46 1.42 44 1.63 42.3 1.64
Local Government 42.8 1.57 40 1.46 33.3 1.47 37 1.47
Department of Economic Development 40.4 0.56 40 0.53 43.7 2.04 47.9 3.04
Department of Education 40.7 1.42 41 1.98 41.6 1.93 42.2 1.91
Department of Finance 37.7 3.49 39 3.46 42.3 3.49 43.6 3.47
Department of Health 40.1 0.33 41 0.32 41 0.33 41.3 0.30
Department of Housing 39.0 0.24 40 1.02 42.2 1.12 43.4 1.24
Department of Infrastructure Development 50 0.46 47 0.41 48.9 1.45 50 1.50
Department of Sport, Recreation, Arts and Culture 44.1 0.65 52 0.62 47.6 1.49 48.8 1.68
Department of Social Development 64.7 1.95 62 1.93 61.7 1.98 60.5 1.93
Department of Roads and Transport 51.6 0.58 50 0.58 49.1 0.57 49.1 0.63
Provincial Treasury 45.6 0.82 45 1.37 45 1.95 44 2.11
Total 44.1 1.28 44.2 1.28 44.7 1.28

Leading the Public Service to Higher Productivity
KwaZulu Natal
March 2014 June 2014 September 2014 Dec 2014
50% 2% 50% 2% 50% 2% 50% 2%
Office of the Premier 38.18 1.34 38 1.30 41.5 1.50 39.6 1.52
Department of Agriculture, Environmental Affairs & Rural Development
31.82 0.69 33 0.68 34.1 0.70 36.8 0.83
Department of Arts, Culture 38.46 1.71 38 1.65 40 1.62 40 1.77
Department of Community Safety and Liaison 30 0 25 1.85 30.7 1.88 33.3 1.83
Department of Economic Development and Tourism 32.43 0.93 31 0.90 45.8 1.00 29.7 0.61
Department of Education 30.88 0.02 34 0.02 33.3 0.02 34.9 0.04
Department of Health 44.74 0.42 42 0.45 41.8 0.46 39.2 0.47
Department of Human Settlements 51.72 1.14 50 1.16 48.2 1.27 46.8 1.30
Department of Cooperative Governance & Traditional Affairs 49.12 1.27 47 1.19 50 1.26 50 1.15
Department of Public Works 30.77 0.83 33 0.90 37 0.86 39.2 0.88
Department of Social Development 50 0.41 49 0.49 50 0.46 51.1 0.49
Department of Sport and Recreation 33.33 1.29 33 1.30 33.3 1.33 22.2 1.35
Department of Transport 51.43 0.62 50 0.65 52.7 0.67 52.7 0.67
Provincial Treasury 40 1.02 37 1.16 36.8 1.36 38.7 1.13
Total 39.7 0.25 40.8 0.26 40.7 0.26

Leading the Public Service to Higher Productivity
Limpopo
March 2014 June 2014 September 2014
Dec 2014
50% 2% 50% 2% 50% 2% 50% 2%Office of Premier 40.3 2.19 38 2.48 33.8 2.55 32.2 2.54
Department of Agriculture 35.1 1.53 35 1.54 34.2 1.54 35.1 1.38
Department of Education 35 0.28 36 0.27 37.1 0.27 37.7 0.27
Department of Economic Development, Environment and Tourism
43.2 0.5 39 0.48 39.1 0.49 37.7 0.49
Department of Health 43.3 0.1 42 0.12 40.4 0.12 41.1 0.17
Department of Cooperative Governance, Human Settlement & Traditional Affairs
42.8 0.68 43 0.49 40.4 0.50 40.4 0.50
Provincial Treasury 42.5 1.04 44 1.05 44.6 1.08 44.6 1.09
Department of Public Works 50 2.03 52 1.98 54.1 2.09 43.3 2.15
Department of Roads and Transport 21.9 1.12 20 1.13 20.4 1.48 20 0.72
Department Safety, Security and Liaison 41.6 1.04 42 1.02 41.6 1.05 36.3 1.10
Department of Social Development 47.6 0.88 48 0.80 47.6 0.80 52.1 1.19
Department of Sport, Arts and Culture 43.7 2.02 47 1.96 53.3 1.98 53.3 2.02
Total 39.1 0.37 38.6 0.38 38.5 0.39

Leading the Public Service to Higher Productivity
Mpumalanga
March 2014 June 2014 September 2014
Dec 2014
50% 2% 50% 2% 50% 2% 50% 2%
Office of the Premier 29.6 2.57 33 3.65 27 3.64 27 2.29
Department of Agriculture, Rural Dev & Land Admin 29.6 1.25 31 1.96 32 1.32 32 1.31
Department of Safety, Security and Liaison 37.5 1.46 35 1.54 37.5 1.80 37.5 1.96
Department of Culture, Sport and Recreation 18.1 1.87 18 1.76 23 1.57 23 1.57
Department of Corporative Governance & Traditional Affairs
31.2 1.53 33 1.30 39.3 1.48 40.6 1.49
Department of Economic Development, Environment and Tourism
20.6 1.53 23 1.54 23 1.61 20 1.65
Department of Education 35.9 0.17 38 0.17 40.5 0.19 40.5 0.19
Department of Finance 42.8 2.34 43 2.32 42.8 2.33 45 2.44
Department of Health 55.2 0.25 52 0.27 55.5 0.29 52.7 0.32
Department of Human Settlements 18.7 1.86 21 1.82 14.2 1.81 16.6 1.83
Department of Public Works, Roads and Transport 36.1 2.24 38 2.17 37.2 2.19 36.7 2.13
Department of Social Development 66.6 1.31 63 1.81 58.8 1.71 58.8 1.85
Total 37 0.45 37.1 0.48 36.9 0.48

Leading the Public Service to Higher Productivity
National DepartmentsMarch 2014 June 2014 September 2014 Dec 2014
50% 2% 50% 2% 50% 2% 50% 2%
Agriculture, Forestry & Fisheries 41.73 1 41 0.98 43 0.95 43.1 0.94
Arts & Culture 44.83 1.65 44 1.72 52 2.18 53 2.41
Basic Education 41.03 1.47 38 1.47 36.2 1.46 37.7 1.47
Civilian Secretariat of Police Not reflected on PERSALCommunications 35.16 0.3 38 0.60 37.3 0.63 40.3 2.08
Cooperative Governance & Traditional Affairs 44.71 0.18 46 0.36 44.9 0.36 45.4 0.37
Correctional Services 33.92 0.55 35 0.59 36.2 0.60 38.1 0.62
Defence Not reflected on PERSAL
Economic Development 52.78 1.59 54 1.59 52.9 1.79 52.9 1.68
Energy 39.74 1.65 40 1.62 39.2 1.70 37 2.21
Environmental Affairs 40.72 2.1 42 2.54 41.9 2.30 42.7 2.31
Health 48.36 0.69 46 0.58 45.2 0.53 44.3 0.52
Higher Education & Training 43.75 0.73 45 0.78 44.2 0.83 45.6 0.80
Home Affairs 44.89 1.29 45 1.33 44.6 1.34 44.6 1.37
Human Settlements 42.5 0.14 43 0.14 41.7 0.13 41.1 0.15

Leading the Public Service to Higher Productivity
Independent Police Investigative Directorate 38.89 0.97 35 0.99 38.8 0.99 44 1.61
International Relations & Cooperation 40 0.55 40 0.56 39.9 0.60 39 0.56
Justice & Constitutional Development 40.69 1.46 41 1.46 41.4 1.43 41 1.46
Labour 37.5 2.48 39 2.42 40.1 2.43 40 2.41
Military Veterans 47.37 0.74 36 0 34.7 0 40 0.52
Mineral Resources 36.36 0.86 36 0.87 33.7 0.88 32.4 0.90
National Prosecuting Authority 44.83 0.25 46 0.24 47.1 0.22 47 0.22
National Treasury 42.68 0.65 43 0.65 43.3 0.69 42.1 0.68
Planning Monitoring & Evaluation 46.67 0.97 49 0.97 49 0.89 50.7 0.78
National School of Government 52.38 2.44 52 2.94 52.5 3.02 51.2 3.02
Public Enterprises 44.03 2. 79 48 2.83 46.6 2.34 44.9 2.16
Public Service & Administration 40.19 1.65 41 1.68 39.1 1.75 41.2 1.51
Public Service Commission 45.28 1.47 46 1.37 48.2 1.68 50.9 1.66
Public Works 41.62 1.14 41 1.13 38.8 1.18 39 1.22
Rural Development & Land Reform 37.55 1.68 38 1.64 38.1 1.70 38.1 1.75
Science & Technology 46.08 2.1 47 2.04 47.7 1.80 48.6 2.73
Social Development 50.98 1.62 49 1.63 49.5 1.82 48.6 1.86
SA Police Service (SAPS) 34.16 0.81 35 0.84 35.1 0.87 34.9 0.89

Leading the Public Service to Higher Productivity
SA Revenue Service (SARS) Not reflected on PERSAL
Sport & Recreation SA 30.77 1.22 36 1.24 33.3 1.21 33.3 1.13
State Security Agency Not reflected on PERSAL
Statistics SA 41.01 1.17 42 1.16 42.6 1.01 42.7 1.15
Telecom & Postal Services 1.68
The Presidency 50 0.88 51 1.15 52.6 1.01 51.3 0.91
Tourism 48.44 4.36 49 5.07 47.4 5.19 45.9 5.16
Trade & Industry 43.22 2.68 44 2.61 43.3 2.72 44.5 2.76
Transport 36.8 0.64 38 0.63 38.5 0.79 37.6 0.76
Water & Sanitation 40.69 0.98 43 1.02 46.8 1.02 46.2 1.07
Women 60.98 5.11 60 5.19 57.7 4.51 59.3 3.60
Total 41.4 0.77 41.6 0.79 41.5 0.81

Leading the Public Service to Higher Productivity
North West
March 2014 June 2014 September 2014 Dec 2014
50% 2% 50% 2% 50% 2% 50% 2%
Office of the Premier 33.3 1.01 32 1.65 31.5 1.18 30.7 1.50
Department of Agriculture & Rural Development 30 1.23 33 1.53 30 1.80 36 1.68
Department of Education 26.4 0.24 27 0.22 27 0.22 27 0.21
Department of Economic Development, Environment and Tourism
52.3 2.94 56 2.90 47.6 2.34 53.8 4.52
Department of Finance 34.2 2.3 50 1.84 33.3 1.84 35.1 2.38
Department of Health 39.5 0.38 36 0.39 35.5 0.39 37.7 0.40
Department of Human Settlements 33.3 2.5% 35 2.67 38.1 2.67 37.5 1.77
Department Local Government and Traditional Affairs 30 0.24 27 0.99 27.2 1.00 42.8 1.72
Department of Public Works, Roads and Transport 30 0.65 28 0.63 27.5 0.64 28 0.70
Department of Public Safety and Liaison 38.4 1.7 33 1.62 33.3 1.77 33.3 1.54
Department of Sports, Arts and Culture 40 2.14 43 2.41 40 2.43 36.3 2.41
Department of Social Development, Women, Children and People with Disabilities.
42.8 0.38 46 0.41 42.8 0.50 48.1 0.82
Total 34.6 0.45 33.9 0.47 34.9 0.48

Leading the Public Service to Higher Productivity
Northern Cape
March 2014 June 2014 September 2014 Dec 2014
50% 2% 50% 2% 50% 2% 50% 2%
Office of the Premier 40 1.21 39 1.21 40.6 1.19 42.8 1.18
Department of Agriculture Land Reform and Rural Development
20 0.18 20 0.17 27.2 0.16 27.2 0.33
Department of Education 41.6 0.05 37 0.05 37.5 0.05 37.5 0.05
Department of Environmental Affairs and Nature Conservation
33.3 0.89 30 0.83 27.2 0.82 30 0.82
Department of Economic Development and Tourism 34.7 1.12 38 1.14 38.4 1.63 40 1.70
Department of Health 38.2 0.15 38 0.15 37.5 0.16 36.3 0.16
Department of Cooperative Governance, Human Settlement and Traditional Affairs
24.1 2.57 24 2.58 25.9 2.58 23 2.61
Department of Roads and Public Works 33.3 0 33 0 42.8 0 27.2 0
Department of Transport, Safety and Liaison 12.5 0 14 0 12.5 0.29 22.2 0.29
Department of Sport, Arts & Culture 22.2 1 20 0.97 22.2 0.74 20 0.74
Department of Social Development 43.4 1.94 45 1.95 50 1.94 50 1.94
Provincial Treasury 36.3 1.08 39 1.07 43.4 1.06 43.4 1
Total 34.3 0.27 35.7 0.28 35.9 0.29

Leading the Public Service to Higher Productivity
Western CapeWestern Cape March 2014 June 2014 September
2014Dec 2014
50% 2% 50% 2% 50% 2% 50% 2%
Office of the Premier 34.2 1.93 31 1.89 31.8 1.81 31.9 2.03
Department of Agriculture 30 1.56 29 1.54 35 1.54 35 1.70
Department of Community Safety 25 0.63 25 1.14 22.2 1.42 20 1.71
Department of Cultural Affairs and Sports 36.3 1.54 36 1.87 36.3 1.86 41.6 1.85
Department of Education 37.7 0.07 38 0.07 39.6 0.07 39.6 0.08
Department of Economic Development & Tourism 37.5 1.19 41 1.49 41.1 1.15 41.1 0.78
Department of Environmental Affairs & Development Planning
20 1.54 20 1.52 16.6 1.52 16.6 2.06
Department of Health 50 0.47 51 0.48 53 0.47 52.3 0.49
Department of Human Settlements 31.5 0.62 32 0.64 35 0.66 35 0.64
Department of Local Government 35.2 3.46 35 3.30 35.2 3.32 37.5 3.29
Department of Social Development 61.9 1.13 62 1.61 59 1.15 56.5 1.31
Department of Transport and Public Works 23.6 0.78 23 0.72 21.4 0.79 20 0.79
Provincial Treasury 33.3 0.93 36 0.63 33.3 0.96 30 0.97
Total 36.4 0.37 37.1 0.37 36.7 0.39
Leading the Public Service to Higher Productivity
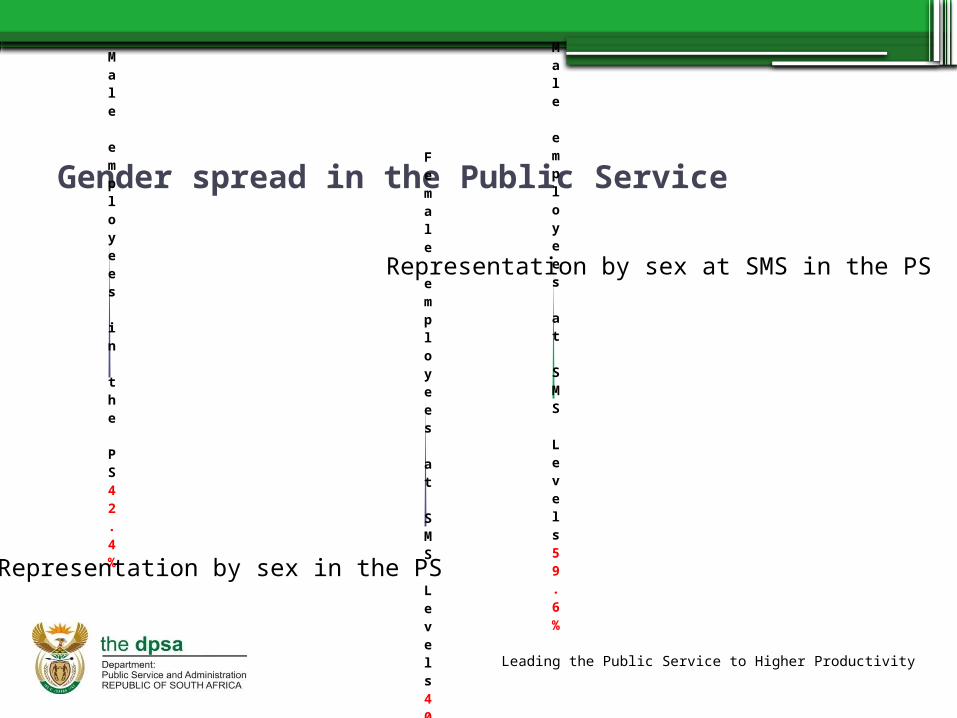
Gender spread in the Public Service
Male employees in the PS42.4%
Male employees at SMS Levels59.6%
Female employees at SMS Levels40.4%
Representation by sex in the PS
Representation by sex at SMS in the PS

Leading the Public Service to Higher Productivity
Conclusion • From the figures in the previous slide, it is evident that there are
more women in the Public Service than men.• There are departments that have achieved and or exceeded the
mark meaning that this can be done by all other departments.• The DPSA will continue to implement strategies to assist
departments to meet targets.• There is a need for the Committee and or Cabinet to call to
account all HODs whose departments have not shown any progress and are still below 30% of the required 50% women at SMS, and 1% of the required 2% for people with disabilities.

Leading the Public Service to Higher Productivity
•Thank You!!