Fostering innovation-led clusters: A review of leading global practices
U.S. LIFE SCIENCES CBRE RESEARCH
LEADING LIFE SCIENCE CLUSTERSTHE BIO-BOOM INTENSIFIES

2 © 2020 CBRE, Inc.
EXECUTIVE SUMMARY
• Boston-Cambridge,theSanFranciscoBay
AreaandSanDiegoremainthenation’s
topthreelifesciencesclusters,while
PittsburghandHoustonaretopnew
emergingones.
• Whilelifescienceemploymentwasdown
byjust1.3%inJulyfromitspeakinMarch,
itwas1%higherthanayearagocompared
withthe7.6%declineintotalnonfarm
employment.BiotechR&Demployment
hasbeenparticularlystrong,upby4.9%
fromayearagoandoutpacingtech
employmentgrowth.
• Totalventurecapitalfundingforthelife
sciencesindustryfortheyearendingQ2
2020wasarecord$17.8billion.TheSan
FranciscoBayAreaandBoston-Cambridge
accountedformorethanhalfofthetotal.
• NationalInstitutesofHealthfundingto
majoruniversitiesandinstitutionsfor
health-careresearchisforecasttogrowby
6%thisyearto$42billion.
• Totalcommerciallaboratoryspacehas
grownby12%thisyearto95millionsq.ft.
Another11millionsq.ft.iscurrentlyunder
construction.Despitetheincreasedsupply,
labrentsarerisingastenantdemand
remainsverystrong.
• Reflectingabroadpullbackincommercial
realestateinvestment,lab/R&Dproperty
salestotaling$9.6billionfortheyear
endingQ22020fellby18%fromthe
sameperiodayearago.However,pricing
remainsintenselycompetitive.Thebulk
ofsalestransactions(66%)wereinthe
topthreelifesciencesmarketsoftheSan
FranciscoBayArea,Boston-Cambridgeand
SanDiego.
• Acontinuedpositiveoutlookis
underscoredbynewgrowthdrivers,such
asgovernmentemphasisonthelifescience
industry’spivotalroleincombatingthe
COVID-19pandemic,onshoringtrendsand
rapidexpansionofbiomanufacturing.
U.S. LIFE SCIENCES | CBRE RESEARCH 3

4 © 2020 CBRE, Inc.
OPPORTUNITIES IN A NATIONAL CRISIS
Thelifesciencesindustryhasbeenthrust
intothespotlightastheUnitedStatesfaces
itsgreatestpublichealthcrisisinacentury.
Investorshaveaheightenedinterestinthe
lifesciencesindustryasitworkstodevelopa
vaccineandeffectivetreatmentsforCOVID-19,
alongwithothermedicalbreakthroughs.
Thisinturniscreatingnewopportunitiesfor
commercialrealestate.
Theindustryhasdisplayedremarkable
resiliencetotheeconomicdownturn,with
newsourcesofdemandandafloodofventure
capitaltosupportvariousinitiatives.Across
thevariousU.S.lifescienceslabclusters,our
datashowsamarketundeterredbydisruption
and,ifanything,rechargedforanintensified
expansion.
Afterabriefpullbackindemandearlyin
thecrisis,demandforlabspacehasgrown
throughmid-2020assupplystrugglestomeet
demand.Consequently,vacanciesinmost
labmarketsremainatornearrecordlows
andrentsarerisingrapidly.BiotechR&D
employmentreachedarecordinJuneasmore
venturecapitalwasinvestedinlifesciences
opportunitiesinQ22020thaneverbefore.
Variousmegatrendssupporttheindustry’s
growthaswell.Anagingglobalpopulation
thatislivinglongerthaneverrequiresmore
andmorelifesciencesinnovations.While
near-termaggregatedemandfortheindustry’s
goodsandserviceshasbeenimpactedbythe
recession,thelong-termoutlookisfavorable.
Heightenedawarenessandappreciationforthe
solutionsofferedbythelifesciencesindustry
mayunleashmoregovernmentresourcesto
supportit.
ThecrisishasalsoexposedU.S.reliance
onglobalsupplychainsandoverseas
manufacturing,particularlybythelifesciences
sector.Asaresult,theindustryismovingto
onshoresomemanufacturingandoperational
facilitiestotheU.S.,whichshouldtranslate
intomoredemandfordomesticspace.
U.S. LIFE SCIENCES | CBRE RESEARCH 5
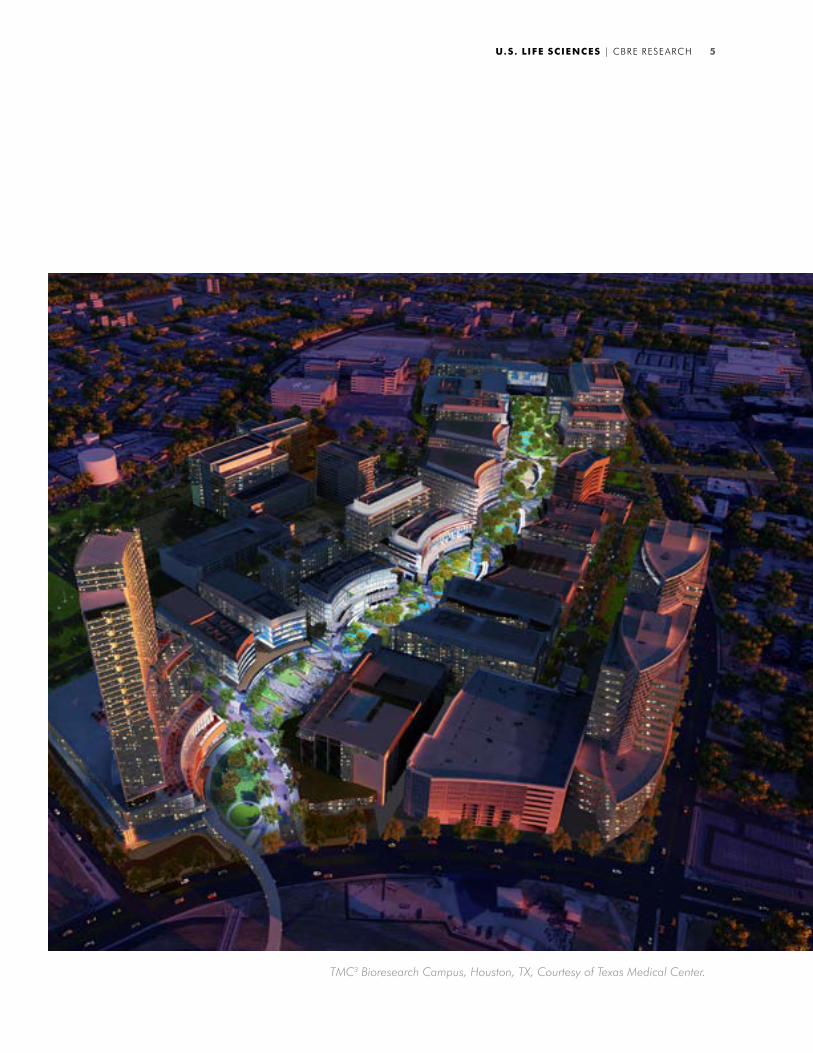
TMC3 Bioresearch Campus, Houston, TX, Courtesy of Texas Medical Center.
6 © 2020 CBRE, Inc.
2020 U.S. LEADING & EMERGING LIFE SCIENCE CLUSTERS
Thirteenleadingmarketsarefuelingthebulk
ofgrowthintheU.S.lifesciencesindustry.
Thesemarketsofferthenation’slargestand
mostconcentratedlifesciencesandR&D
employmentbases,thelargestinventoriesof
leasablelaboratoryspace,andcapturemost
ofthefundingfromtheNationalInstitutesof
Healthandventurecapitalists.
Boston-CambridgeandtheSanFranciscoBay
AreaarethetoptwoU.S.lifesciencesmarkets,
withunparalleledtalentbases,inventoriesof
laboratoryspace,researchuniversitiesand
funding.SanDiegoranksthird,withsome
ofthenation’smostprestigioushealth-care
institutionsandfastest-growingrentsforlab
space.
Thenexttierofpreeminentmarketsincludes
theWashington,D.C.-Baltimoreregion,
Raleigh-Durham(includingResearchTriangle
Park)andNewJersey.Thesemarketshave
playedasignificanthistoricalroleinthelife
sciencesindustry,andtheyarealsorapidly
adaptingtoanincreasedfocusonbiologics
andbiomanufacturing.
Anothertierofmarketsconsistsofthreeofthe
largest,mostprestigiouscentersofhealth-care
researchinthenation:Philadelphia,NewYork
CityandSeattle.InPhiladelphia,thestrong
legacyofalargepharmaceuticalpresence
inthesuburbshaspivotedtoaburgeoning
hubofactivityinthedowntown,wheremany
oftheregion’sleadingresearchinstitutions
arelocated.ForNewYorkCityandSeattle,
aggressiveexpansionwithintheurbancore
continuestopropeltheirstatureaskeylife
sciencesmarkets.
Otherrapidlyevolvinglifesciencesmarkets
includeLosAngeles,Chicago,OrangeCounty,
CAandDenver-Boulder.ChicagoandDenver,
forexample,areexperiencingparticularly
stronggrowth,asnewspeculativelab
developmentsaccommodatesurgingtenant
demand.

U.S. LIFE SCIENCES | CBRE RESEARCH 7
Source: CBRE Research, Q3 2020.
Note: Ranked by size, growth and concentration of life sciences employment, concentration of R&D life sciences employment, size of laboratory inventory, and amount of NIH and life sciences venture capital funding.
Source: CBRE Research, Q3 2020.
Note: Ranked by size and growth of life sciences employment, concentration of R&D life sciences employment, amount and growth of life sciences venture capital funding and NIH funding.
FIGURE 1: U.S. TOP LIFE SCIENCE CLUSTERS
1. Boston-Cambridge
2. San Francisco Bay Area
3. San Diego
4. Washington, D.C. - Baltimore
5. Raleigh-Durham
6. New Jersey
7. Philadelphia
8. New York City
9. Seattle
10. Los Angeles
11. Chicago
12. Orange County, CA
13. Denver-Boulder
FIGURE 2: U.S. TOP 10 EMERGING CLUSTERS
1. Pittsburgh
2. Houston
3. Austin
4. Detroit
5. Phoenix
6. Dallas/Ft. Worth
7. St. Louis
8. Atlanta
9. Portland
10. Minneapolis
8 © 2020 CBRE, Inc.
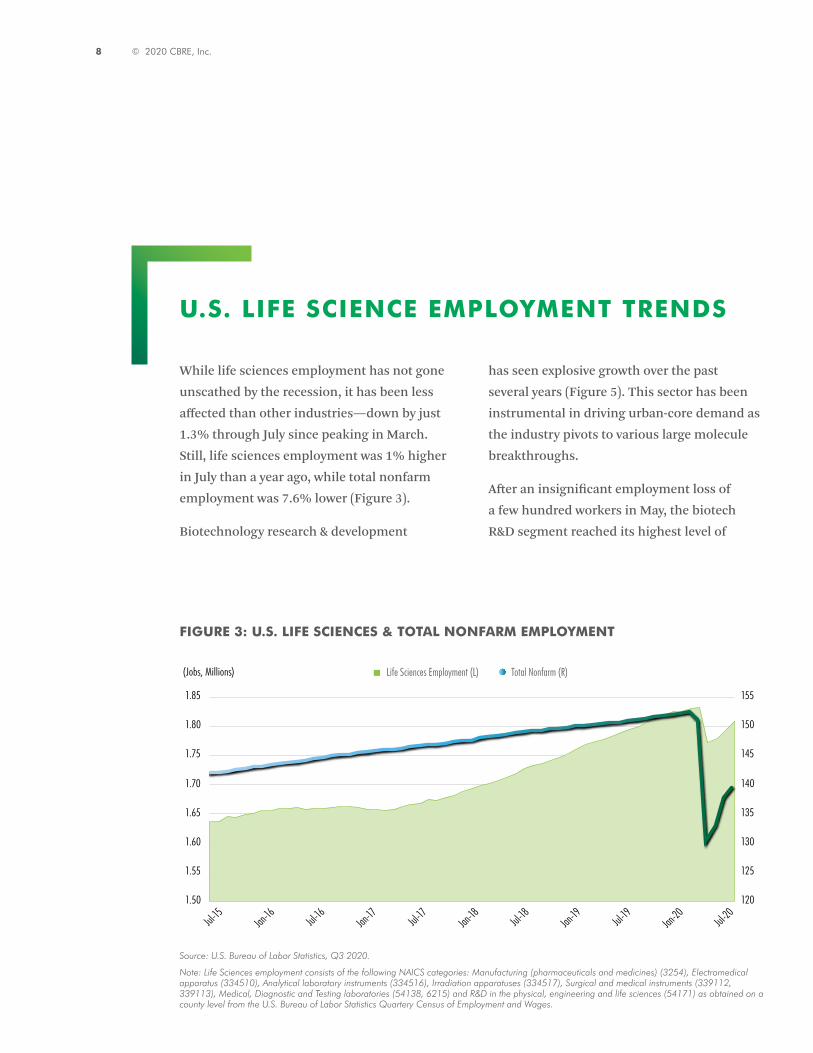
U.S. LIFE SCIENCE EMPLOYMENT TRENDS
Source: U.S. Bureau of Labor Statistics, Q3 2020.
Note: Life Sciences employment consists of the following NAICS categories: Manufacturing (pharmaceuticals and medicines) (3254), Electromedical apparatus (334510), Analytical laboratory instruments (334516), Irradiation apparatuses (334517), Surgical and medical instruments (339112, 339113), Medical, Diagnostic and Testing laboratories (54138, 6215) and R&D in the physical, engineering and life sciences (54171) as obtained on a county level from the U.S. Bureau of Labor Statistics Quartery Census of Employment and Wages.
120
125
130
135
140
145
150
155
1.50
1.55
1.60
1.65
1.70
1.75
1.80
1.85
Jul-15
Jan-16 Jul-
16Jan
-17 Jul-17
Jan-18 Jul-
18Jan
-19 Jul-19
Jan-20 Jul-
20
(Jobs, Millions) Life Sciences Employment (L) Total Nonfarm (R)
FIGURE 3: U.S. LIFE SCIENCES & TOTAL NONFARM EMPLOYMENT
Whilelifesciencesemploymenthasnotgone
unscathedbytherecession,ithasbeenless
affectedthanotherindustries—downbyjust
1.3%throughJulysincepeakinginMarch.
Still,lifesciencesemploymentwas1%higher
inJulythanayearago,whiletotalnonfarm
employmentwas7.6%lower(Figure3).
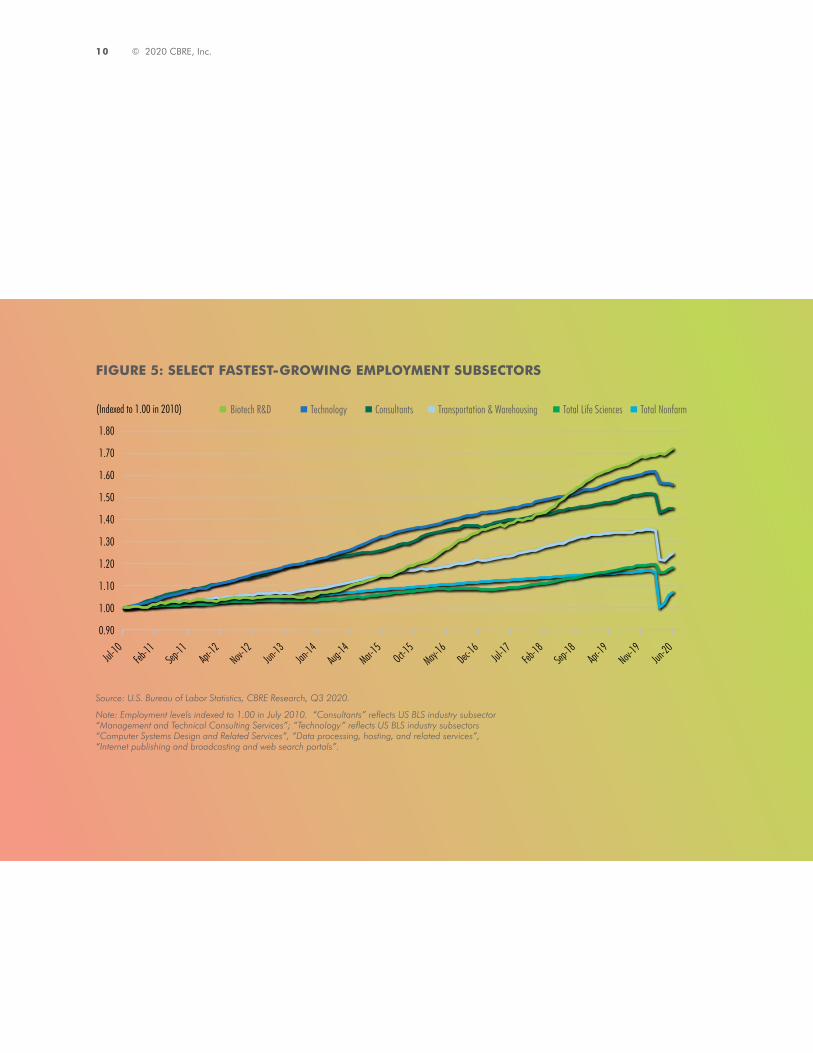
Biotechnologyresearch&development
hasseenexplosivegrowthoverthepast
severalyears(Figure5).Thissectorhasbeen
instrumentalindrivingurban-coredemandas
theindustrypivotstovariouslargemolecule
breakthroughs.
Afteraninsignificantemploymentlossof
afewhundredworkersinMay,thebiotech
R&Dsegmentreacheditshighestlevelof
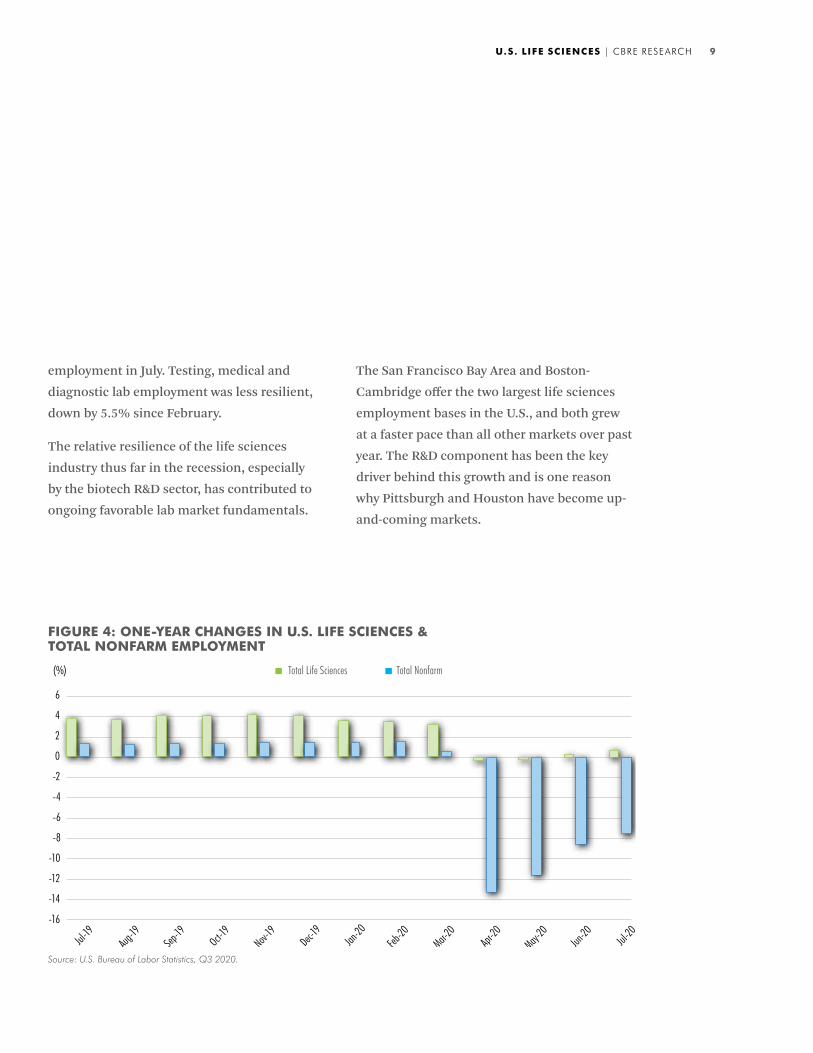
U.S. LIFE SCIENCES | CBRE RESEARCH 9
employmentinJuly.Testing,medicaland
diagnosticlabemploymentwaslessresilient,
downby5.5%sinceFebruary.
Therelativeresilienceofthelifesciences
industrythusfarintherecession,especially
bythebiotechR&Dsector,hascontributedto
ongoingfavorablelabmarketfundamentals.
TheSanFranciscoBayAreaandBoston-
Cambridgeofferthetwolargestlifesciences
employmentbasesintheU.S.,andbothgrew
atafasterpacethanallothermarketsoverpast
year.TheR&Dcomponenthasbeenthekey
driverbehindthisgrowthandisonereason
whyPittsburghandHoustonhavebecomeup-
and-comingmarkets.
-16
-14
-12
-10
-8
-6
-4
-2
0
2
4
6
Jul-19
Aug-19
Sep-19
Oct-19
Nov-19
Dec-19
Jan-20
Feb-20
Mar-20
Apr-20
May-20
Jun-20 Jul-20
(%) Total Life Sciences Total Nonfarm
Source: U.S. Bureau of Labor Statistics, Q3 2020.
FIGURE 4: ONE-YEAR CHANGES IN U.S. LIFE SCIENCES & TOTAL NONFARM EMPLOYMENT
10 © 2020 CBRE, Inc.
Source: U.S. Bureau of Labor Statistics, CBRE Research, Q3 2020.
Note: Employment levels indexed to 1.00 in July 2010. “Consultants” reflects US BLS industry subsector “Management and Technical Consulting Services”; “Technology” reflects US BLS industry subsectors “Computer Systems Design and Related Services”, “Data processing, hosting, and related services”, “Internet publishing and broadcasting and web search portals”.
Biotech R&D Technology Consultants Transportation & Warehousing Total Life Sciences Total Nonfarm
0.90
1.00
1.10
1.20
1.30
1.40
1.50
1.60
1.70
1.80
(Indexed to 1.00 in 2010)
Jul-10
Feb-11
Sep-11
Apr-12
Nov-12
Jun-13
Jan-14
Aug-14
Mar-15
Oct-15
May-16
Dec-16
Jul-17
Feb-18
Sep-18
Apr-19
Nov-19
Jun-20
FIGURE 5: SELECT FASTEST-GROWING EMPLOYMENT SUBSECTORS

U.S. LIFE SCIENCES | CBRE RESEARCH 11
Source: U.S. Bureau of Labor Statistics, Q3 2020.
40
60
80
100
120
140
160
180
200
220
240
-6
-4
-2
0
2
4
6
8
10
12
14
Jul-92
Jul-94
Jul-96
Jul-98
Jul-00
Jul-02
Jul-04
Jul-06
Jul-08
Jul-10
Jul-12
Jul-14
Jul-16
Jul-18
Jul-20
(000s)(%) Employment Growth (L) Employment (R)
FIGURE 6: U.S. BIOTECHNOLOGY R&D EMPLOYMENT

12 © 2020 CBRE, Inc.
Source: U.S. Bureau of Labor Statistics, CBRE Research, Q3 2020.
0
11
22
33
44
55
66
77
0
20,000
40,000
60,000
80,000
100,000
120,000
140,000
(%)(Employees) 2019 Life Sciences Employment (L) R&D Share of Total Employment (R)
San Fra
ncisco B
ay Are
aBos
ton-Ca
mbridge
New Jer
sey
Washing
ton, D.
C. - Ba
ltimore
San Die
goChi
cago
New Yor
k City
Philad
elphia
Los An
geles
Minneap
olis Miami
Orange
Count
yDet
roitRal
eigh-D
urham
Houston
Denver-
Boulde
rSea
ttleDal
las-Ft.
WorthInd
ianapo
lis
Phoeni
x
FIGURE 7: LARGEST U.S. LIFE SCIENCES CLUSTERS BY EMPLOYMENT
U.S. LIFE SCIENCES | CBRE RESEARCH 13
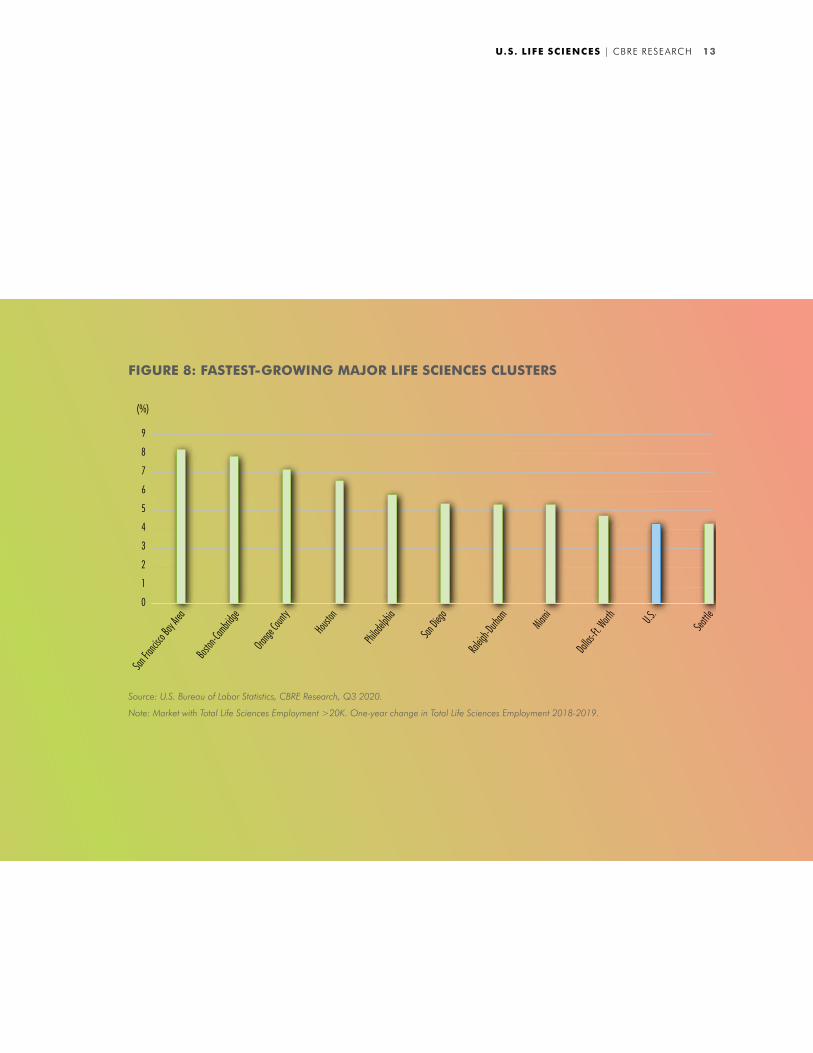
Source: U.S. Bureau of Labor Statistics, CBRE Research, Q3 2020.
Note: Market with Total Life Sciences Employment >20K. One-year change in Total Life Sciences Employment 2018-2019.
(%)
0
1
2
3
4
5
6
7
8
9
Boston
-Cambrid
ge
Orange
Count
y
Houston
Philad
elphia
San Die
go
Raleig
h-Durh
am
Miami
Dallas-
Ft. Worth U.S
.
Seattle
San Fra
ncisco B
ay Are
a
FIGURE 8: FASTEST-GROWING MAJOR LIFE SCIENCES CLUSTERS

14 © 2020 CBRE, Inc.
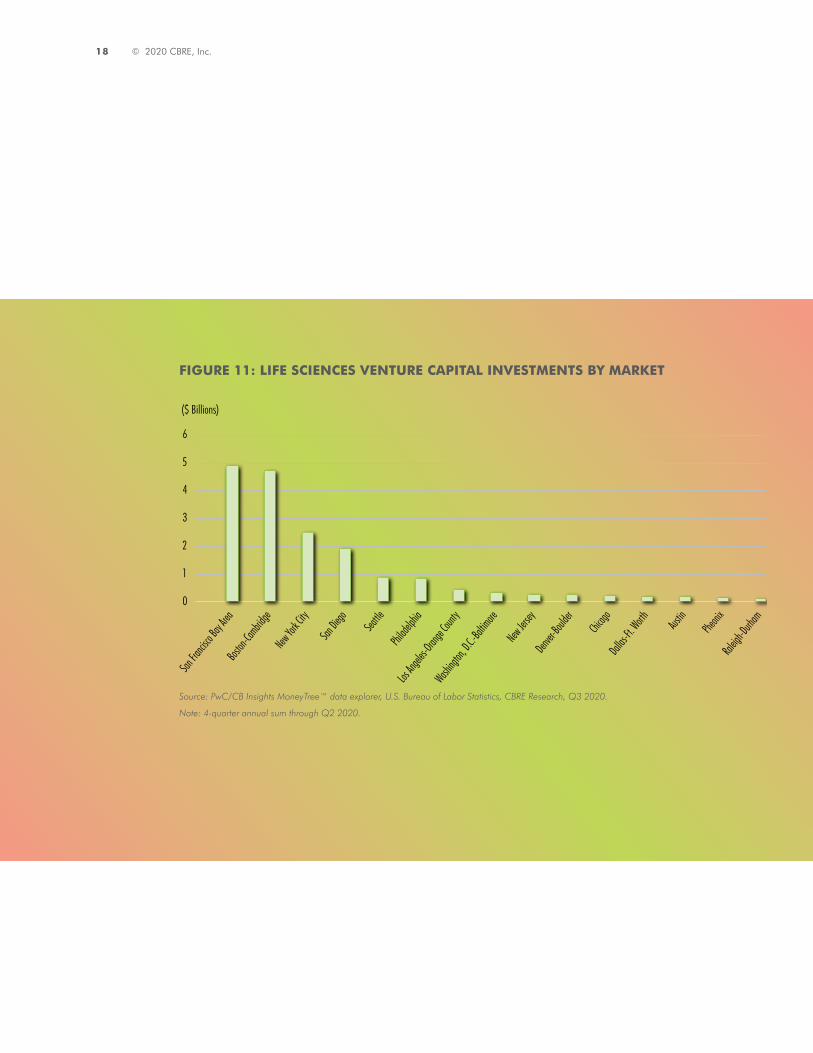
LIFE SCIENCE VENTURE CAPITAL FUNDING TRENDS
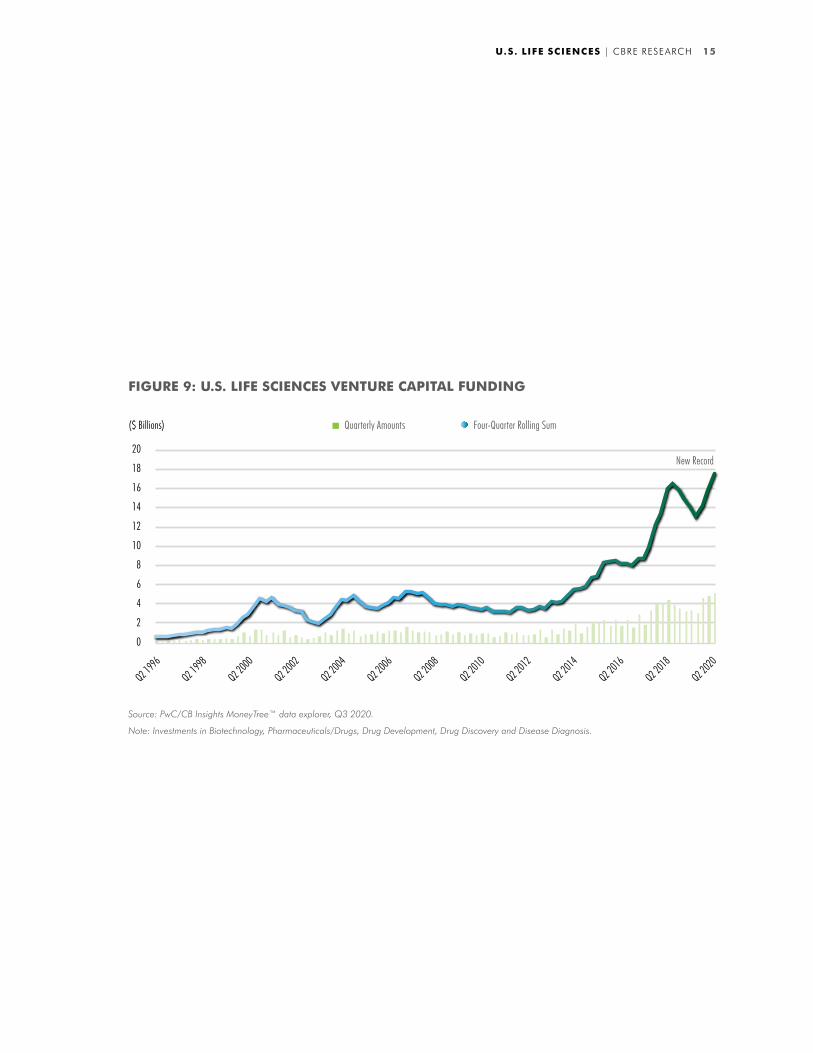
TheU.S.lifesciencesindustryhaditslargest
quarterlytotalofventurecapitalinvestment
inQ22020,continuingarunofconsecutive
quarterlyrecordssinceQ42019.Therolling
annualtotaloflifesciencesventurecapital
investmentendingQ22020reachedarecord
$17.8billion.Thesurgeisindirectcontrastto
U.S.venturecapitalinvestmentsinallother
industries,whichhavebeendeclining(ona
rollingannualbasis)sinceQ32019.
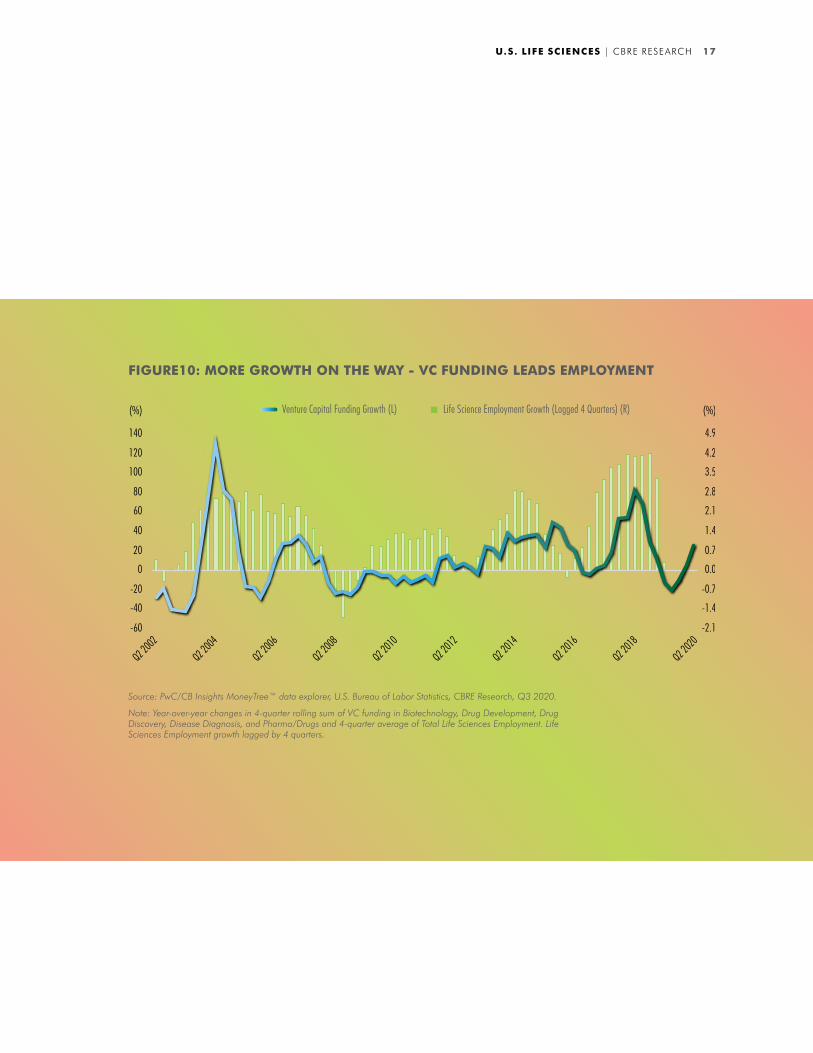
Therecord-breakingamountofventure
capitalfundingtotheindustryportends
futureemploymentgrowth.Lifesciences
venturecapitalfundinggrowthhashistorically
precededemploymentgainsbyaboutoneyear
(Figure9),sototallifesciencesemployment
shouldincreasein2021.
TheSanFranciscoBayAreaandBoston-
Cambridgecombinedaccountedfor54%of
alllifesciencesventurecapitalinvestment
intheU.S.fortheyearendingQ2.Mostof
themajormarketscontinuetoattractabove-
averageventurecapital,butNewYorkCityand
LosAngeles/OrangeCountyhaveexperienced
notablyrapidgrowthinlocalventurecapital
investmentsoverthepastfewyears.
Seaport Labs, Boston, MA.
U.S. LIFE SCIENCES | CBRE RESEARCH 15
Source: PwC/CB Insights MoneyTree™ data explorer, Q3 2020.
Note: Investments in Biotechnology, Pharmaceuticals/Drugs, Drug Development, Drug Discovery and Disease Diagnosis.
Quarterly Amounts Four-Quarter Rolling Sum
0
2
4
6
8
10
12
14
16
18
20
Q2 1996
Q2 1998
Q2 2000
Q2 2002
Q2 2004
Q2 2006
Q2 2008
Q2 2010
Q2 2012
Q2 2014
Q2 2016
Q2 2018
Q2 2020
($ Billions)
New Record
FIGURE 9: U.S. LIFE SCIENCES VENTURE CAPITAL FUNDING

16 © 2020 CBRE, Inc.
Pittsburgh, PA.
U.S. LIFE SCIENCES | CBRE RESEARCH 17
Source: PwC/CB Insights MoneyTree™ data explorer, U.S. Bureau of Labor Statistics, CBRE Research, Q3 2020.
Note: Year-over-year changes in 4-quarter rolling sum of VC funding in Biotechnology, Drug Development, Drug Discovery, Disease Diagnosis, and Pharma/Drugs and 4-quarter average of Total Life Sciences Employment. Life Sciences Employment growth lagged by 4 quarters.
FIGURE10: MORE GROWTH ON THE WAY - VC FUNDING LEADS EMPLOYMENT
Venture Capital Funding Growth (L) Life Science Employment Growth (Lagged 4 Quarters) (R)
-2.1
-1.4
-0.7
0.0
0.7
1.4
2.1
2.8
3.5
4.2
4.9
-60
-40
-20
0
20
40
60
80
100
120
140
Q2 2002
Q2 2004
Q2 2006
Q2 2008
Q2 2010
Q2 2012
Q2 2014
Q2 2016
Q2 2018
Q2 2020
(%)(%)
18 © 2020 CBRE, Inc.
Source: PwC/CB Insights MoneyTree™ data explorer, U.S. Bureau of Labor Statistics, CBRE Research, Q3 2020.
Note: 4-quarter annual sum through Q2 2020.
FIGURE 11: LIFE SCIENCES VENTURE CAPITAL INVESTMENTS BY MARKET
Boston
-Cambrid
ge
Los An
geles-
Orange
Count
y
Washing
ton, D.
C.-Balti
more
New Yor
k City
New Jer
sey
Philad
elphia
Denver-
Boulde
r
San Die
go
Raleig
h-Durh
am
Dallas-
Ft. Worth
San Fra
ncisco B
ay Are
a
Chicag
o
Austin
Pheoni
x
Seattle
0
1
2
3
4
5
6
($ Billions)

U.S. LIFE SCIENCES | CBRE RESEARCH 19
San Francisco, CA.

20 © 2020 CBRE, Inc.
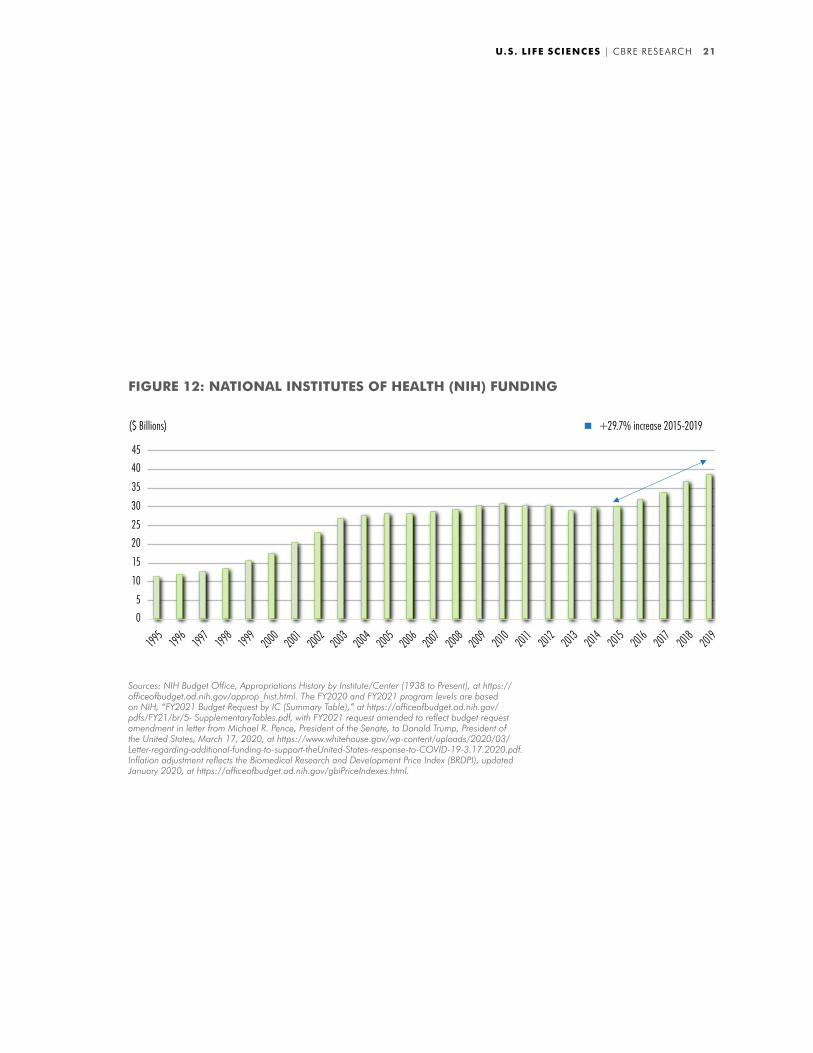
NIH FUNDING TRENDS
Anothermajordriverbehindthesurgein
lifesciencesdemandhasbeenthebillions
ofdollarsfunneledtomajoruniversitiesand
researchinstitutionsforhealth-careresearch
fromtheNationalInstitutesofHealth(NIH).
Astheindustrytransformsitself,thisfunding
hasbeeninstrumentalincreatingnew
innovationsthathavespawnednumerous
privateenterprises.
NIHfundinggrewby29.7%between2015and
2019,oranannualaverageof6.7%.Projections
forfiscalyear2020showanother6.0%growth.
Incontrast,NIHfundinghadbeenstagnant
between2003and2015whenfundinggrewat
anaverageannualrateofjust0.9%.
Roughly47%ofallNIHfundinggoestolife
sciencesmarketsintheNortheastCorridor—
fromBoston-CambridgetoWashington,D.C.-
Baltimore—andinCalifornia.
Fulton Labs, Chicago, IL.
U.S. LIFE SCIENCES | CBRE RESEARCH 21
Sources: NIH Budget Office, Appropriations History by Institute/Center (1938 to Present), at https://officeofbudget.od.nih.gov/approp_hist.html. The FY2020 and FY2021 program levels are based on NIH, “FY2021 Budget Request by IC (Summary Table),” at https://officeofbudget.od.nih.gov/pdfs/FY21/br/5- SupplementaryTables.pdf, with FY2021 request amended to reflect budget request amendment in letter from Michael R. Pence, President of the Senate, to Donald Trump, President of the United States, March 17, 2020, at https://www.whitehouse.gov/wp-content/uploads/2020/03/Letter-regarding-additional-funding-to-support-theUnited-States-response-to-COVID-19-3.17.2020.pdf. Inflation adjustment reflects the Biomedical Research and Development Price Index (BRDPI), updated January 2020, at https://officeofbudget.od.nih.gov/gbiPriceIndexes.html.
($ Billions)
0
5
10
15
20
25
30
35
40
45
1995
1996
1997
1998
1999
2000
2001
2002
2003
2004
2005
2006
2007
2008
2009
2010
2011
2012
2013
2014
2015
2016
2017
2018
2019
+29.7% increase 2015-2019
FIGURE 12: NATIONAL INSTITUTES OF HEALTH (NIH) FUNDING
22 © 2020 CBRE, Inc.
Source: NIH, CBRE Research, Q3 2020.
Note: Amounts above $20 million.
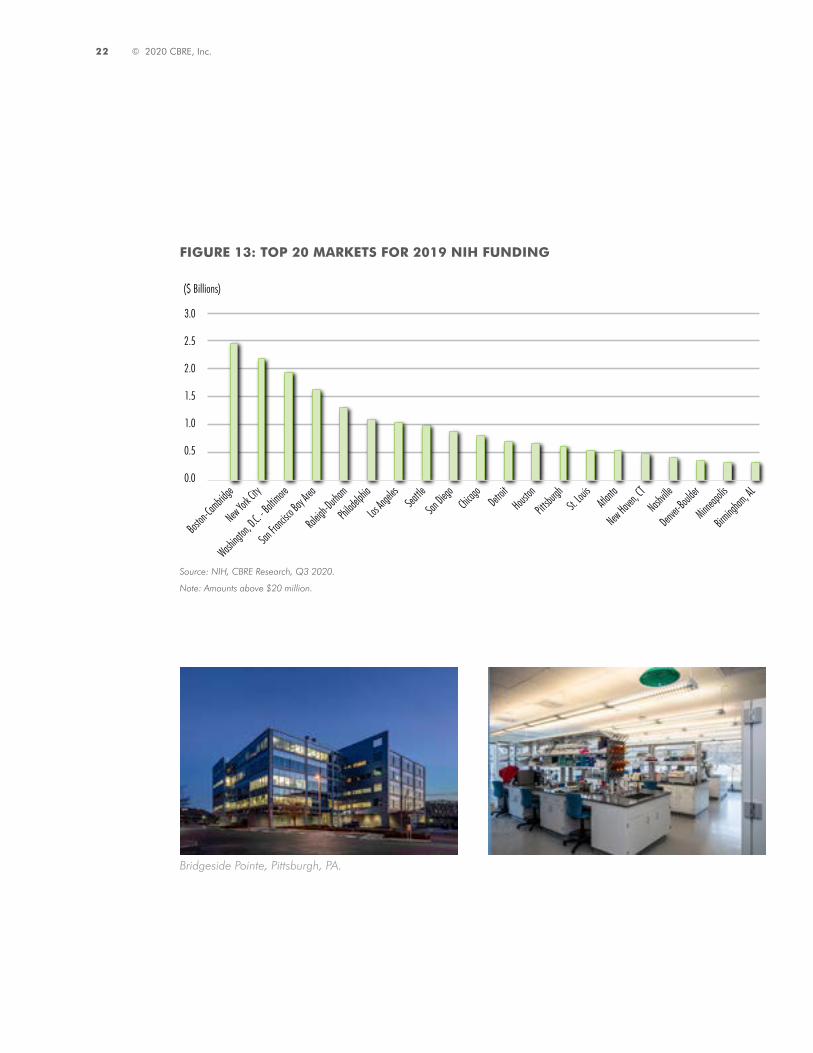
FIGURE 13: TOP 20 MARKETS FOR 2019 NIH FUNDING
0.0
0.5
1.0
1.5
2.0
2.5
3.0
Boston
-Cambrid
ge
New York Ci
ty
Washingt
on, D.C.
- Balti
more
San Fra
ncisco B
ay Area
Raleigh-
Durham
Philade
lphia
Los Ang
eles Seattle
San Diego
Chicago Detro
itHous
ton
Pittsbu
rghSt.
Louis
Atlanta
New Haven, C
TNash
ville
Denver-B
oulder
Minneapo
lis
Birmingh
am, AL
($ Billions)
Bridgeside Pointe, Pittsburgh, PA.

U.S. LIFE SCIENCES | CBRE RESEARCH 23
Institution Funding (Millions) City State
Johns Hopkins University $764 Baltimore MD
University of California, San Francisco $685 San Francisco CA
University of Michigan at Ann Arbor $591 Ann Arbor MI
University of Pennsylvania $582 Philadelphia PA
Duke University $571 Durham NC
University of Pittsburgh $546 Pittsburgh PA
University of Washington $527 Seattle WA
Stanford University $526 Stanford CA
Washwington University $524 Saint Louis MO
University of North Carolina $510 Chapel Hill NC
Massachusetts General Hospital $500 Boston MA
Yale University $489 New Haven CT
University of California, San Diego $488 La Jolla CA
Columbia University Health Services $479 New York NY
University of California, Los Angeles $452 Los Angeles CA
Leidos Biomedical Research, Inc. $419 Frederick MD
Icahn School of Medicine at Mount Sinai $394 New York NY
Emory University $382 Atalanta GA
Brigham and Women’s Hospital $338 Boston MA
Northwestern University $333 Chicago IL
University of Alabama at Birmingham $328 Birmingham AL
New York University School of Medicine $314 New York NY
University of Wisconsin-Madison $314 Madison WI
Fred Hutchinson Cancer Research Center $305 Seattle WA
University of Minnesota $303 Minneapolis MN
FIGURE 14: TOP 2019 RECIPIENTS OF NIH FUNDING
Source: NIH, CBRE Research, Q3 2020.

24 © 2020 CBRE, Inc.
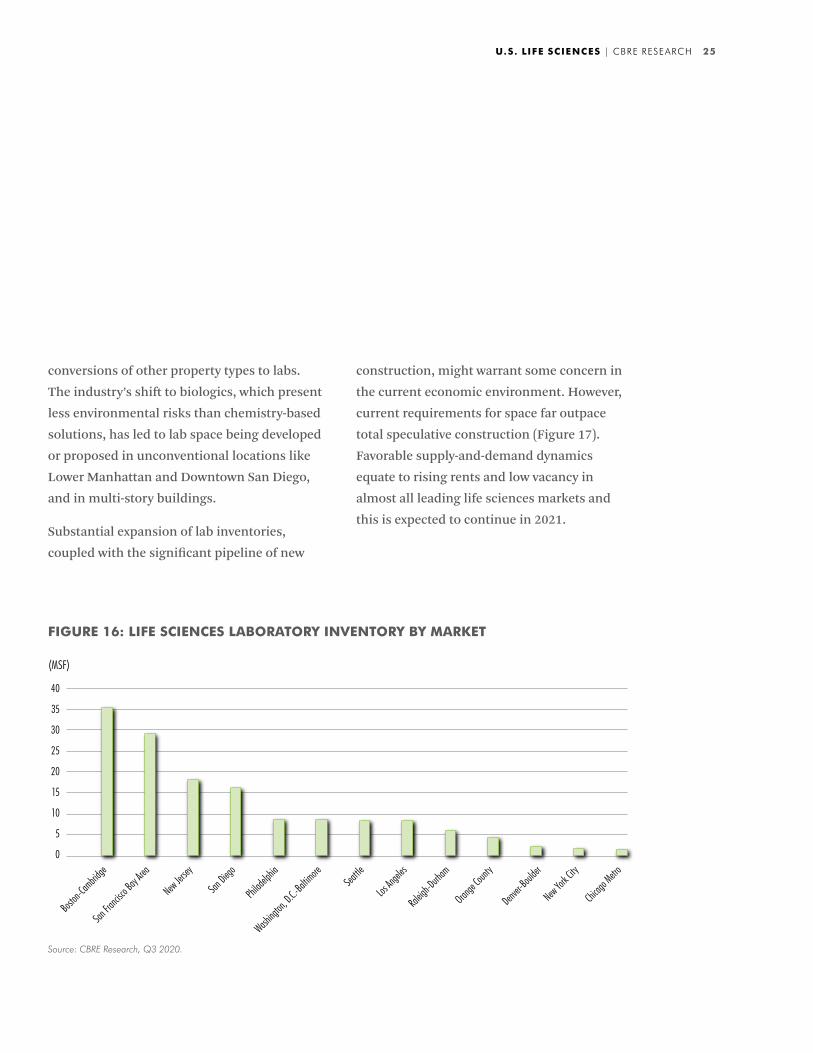
2020 U.S. LIFE SCIENCE LAB MARKET TRENDS
Theinventoryofcommerciallaboratoryspace
israpidlygrowingtomeetincreaseddemand.
Sinceearly2019,theamountoflabspacein
thenation’stopfivelifesciencesmarketsgrew
by11.9%to95.0millionsq.ft.(Figure14).In
contrast,theinventoryofconventionaloffice
spaceintheU.Sgrewbyroughly2.0%overthat
period.Asofmid-2020,another11millionsq.
ft.oflabspaceisunderconstructioninthese
markets.
Boston-CambridgeandtheSanFrancisco
BayAreamaintainthelargestinventoriesof
leasablelabspaceintheU.S.andhavethe
largestpipelinesofnewsupply(Figure15and
16).However,NewYorkCity,Chicagoand
Denver-Boulderhavethehighestlevelsofnew
constructionasashareofexistinginventory,
reflectingsignificantdemandgrowthin
thoserapidlydevelopingsmallermarkets.
Therealsohasbeenanotableincreasein
(MSF)
50556065707580859095
100
2018 2019 2020
+11.9% growth
+17.8% growth
FIGURE 15: LIFE SCIENCES LABORATORY INVENTORY (TOP 5 U.S. CLUSTERS)
Source: CBRE Research, Q3 2020. Note: Top 5 clusters include Boston-Cambridge, San Francisco Bay Area, San Diego, Washington, D.C.-Baltimore and Raleigh-Durham.
U.S. LIFE SCIENCES | CBRE RESEARCH 25
conversionsofotherpropertytypestolabs.
Theindustry’sshifttobiologics,whichpresent
lessenvironmentalrisksthanchemistry-based
solutions,hasledtolabspacebeingdeveloped
orproposedinunconventionallocationslike
LowerManhattanandDowntownSanDiego,
andinmulti-storybuildings.
Substantialexpansionoflabinventories,
coupledwiththesignificantpipelineofnew
construction,mightwarrantsomeconcernin
thecurrenteconomicenvironment.However,
currentrequirementsforspacefaroutpace
totalspeculativeconstruction(Figure17).
Favorablesupply-and-demanddynamics
equatetorisingrentsandlowvacancyin
almostallleadinglifesciencesmarketsand
thisisexpectedtocontinuein2021.
FIGURE 16: LIFE SCIENCES LABORATORY INVENTORY BY MARKET
Source: CBRE Research, Q3 2020.
(MSF)
0
5
10
15
20
25
30
35
40
Boston
-Cambrid
ge
San Fra
ncisco B
ay Are
a
New Jersey
San Dieg
o
Philad
elphia
Washing
ton, D.
C.-Balti
moreSea
ttle
Los An
geles
Raleig
h-Durh
am
Orange
County
Denver-B
oulder
New York C
ity
Chicag
o Metro
26 © 2020 CBRE, Inc.
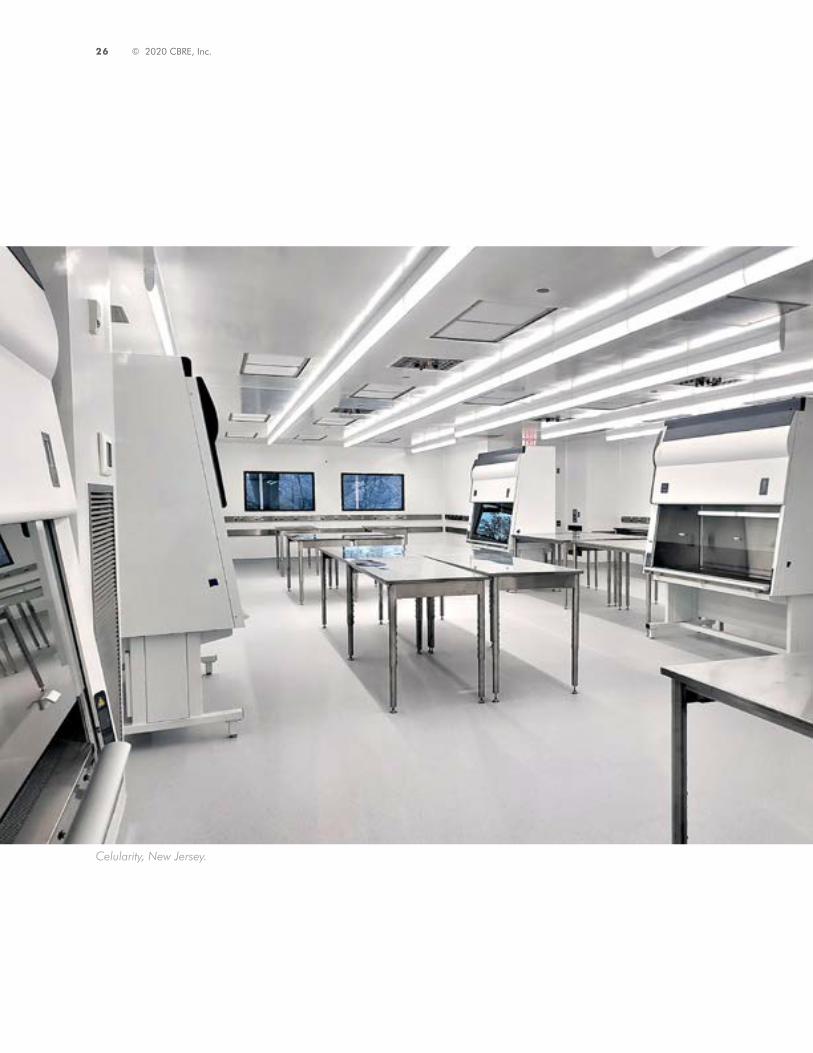
Celularity, New Jersey.

THE BIOMANUFACTURING BOOM
U.S. LIFE SCIENCES | CBRE RESEARCH 27
The successes in large molecule research associated with the shift toward more personalized medicine have spawned overwhelming demand for biomanufacturing space. This may usher in a period of rapid growth like that of high-quality laboratory space over the past several years. Demand for biomanufacturing space is particularly strong in Boston-Cambridge, San Diego, Washington, D.C.-Baltimore, Raleigh-Durham and New Jersey, where tenants are seeking about 3.5 million sq. ft. of space.
FIGURE 17: ESTIMATED BIOMANUFACTURING INVENTORY IN BOSTON-CAMBRIDGE MARKET
Source: CBRE Research, Q3 2020.
0.0
0.5
1.0
1.5
2.0
2.5
3.0
3.5
2002
2003
2004
2005
2006
2007
2008
2009
2010
2011
2012
2013
2014
2015
2016
2017
2018
2019
2020
2021
2022
(MSF) Forecast
28 © 2020 CBRE, Inc.
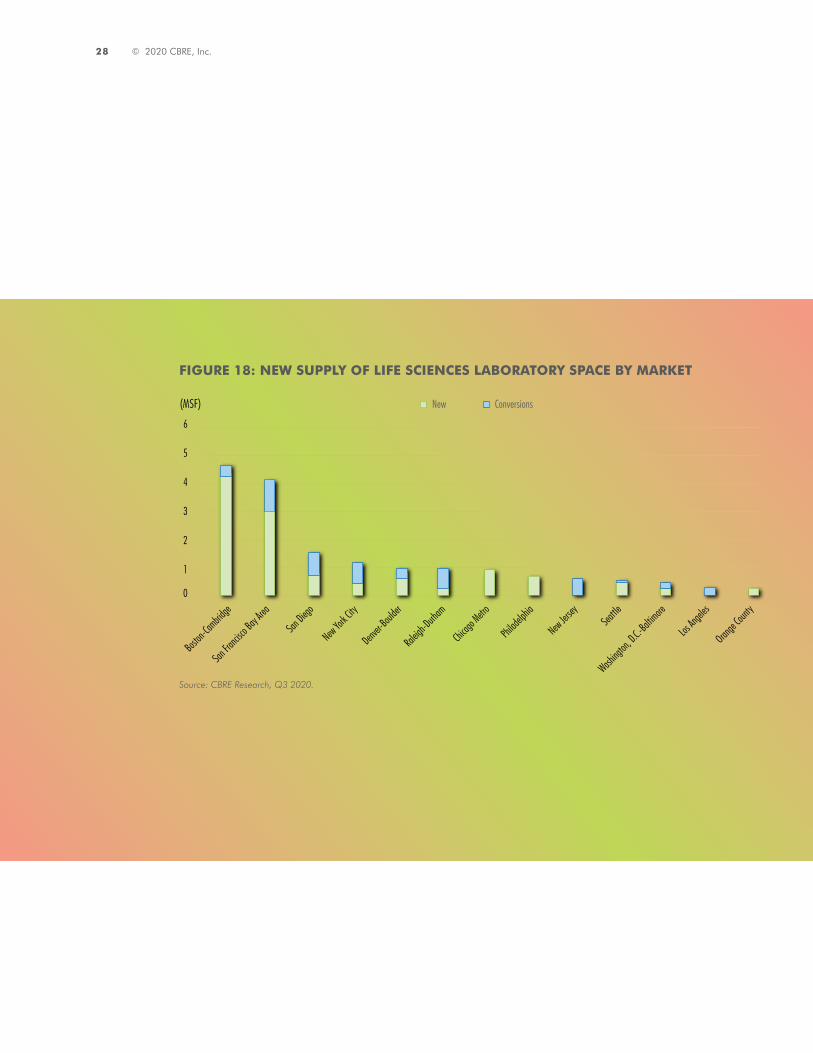
FIGURE 18: NEW SUPPLY OF LIFE SCIENCES LABORATORY SPACE BY MARKET
Source: CBRE Research, Q3 2020.
(MSF)
0
1
2
3
4
5
6
Boston
-Cambrid
ge
San Fra
ncisco B
ay Are
a
New York C
ity
Denver-B
oulder
Raleig
h-Durh
am
Chicag
o Metro
San Dieg
o
Philad
elphia
New Jersey
Seattle
Washing
ton, D.
C.-Balti
more
Los An
geles
Orange
County
New Conversions

U.S. LIFE SCIENCES | CBRE RESEARCH 29
San Diego, CA.
30 © 2020 CBRE, Inc.
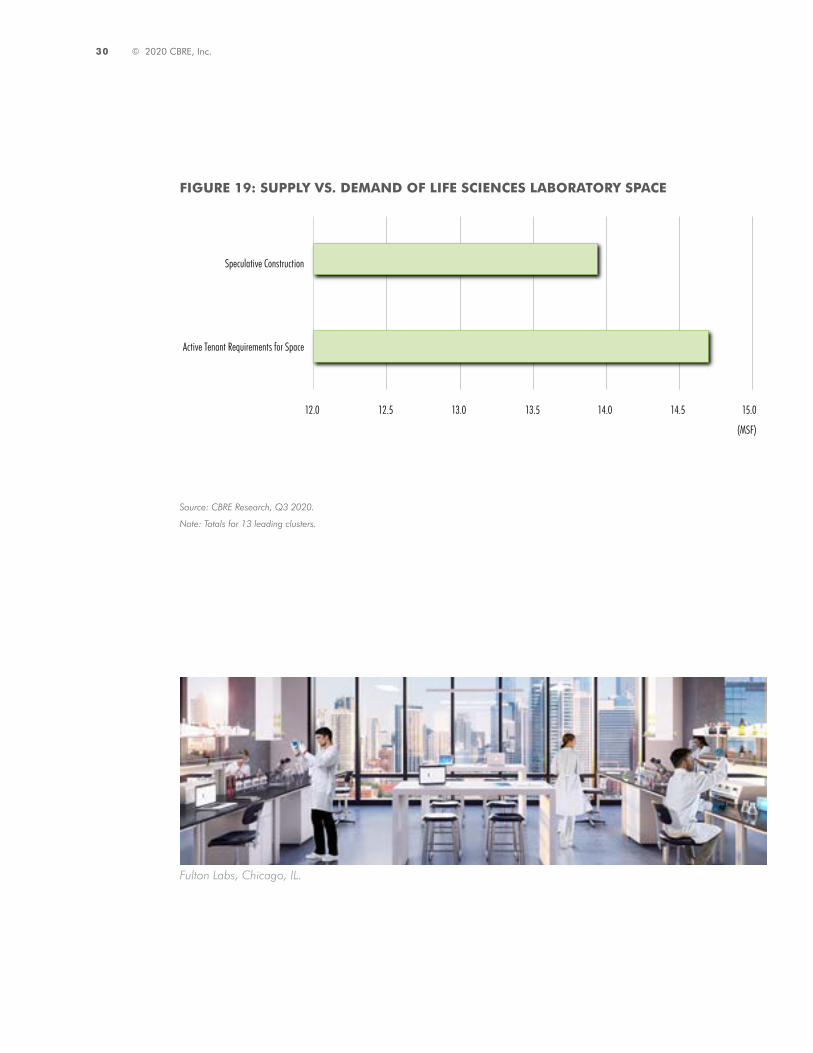
FIGURE 19: SUPPLY VS. DEMAND OF LIFE SCIENCES LABORATORY SPACE
12.0 12.5 13.0 13.5 14.0 14.5 15.0
Active Tenant Requirements for Space
Speculative Construction
(MSF)
Fulton Labs, Chicago, IL.
Source: CBRE Research, Q3 2020.
Note: Totals for 13 leading clusters.

U.S. LIFE SCIENCES | CBRE RESEARCH 31
Source: CBRE Research, Q3 2020.
FIGURE 20: METRO LIFE SCIENCES LABORATORY VACANCY RATES
(%)
02468
101214161820
San Fra
ncisco B
ay Are
aSea
ttle
New York C
ity
Boston
-Cambrid
ge
Orange
County
Washing
ton, D.
C.-Balti
more
Chicag
o Metro
Los An
geles
Denver-B
oulder
San Dieg
o
Philad
elphia
New Jersey
Raleig
h-Durh
am
Alexandria GradLabsTM, San Diego, CA. The Cove-Oyster Point, San Francisco, CA.

32 © 2020 CBRE, Inc.
Source: CBRE Research, Q3 2020.
Note: No 18-month change available for L.A., Chicago, Philadelphia, Raleigh-Durham, Denver-Boulder and Orange County.
FIGURE 21: METRO LIFE SCIENCES LABORATORY AVERAGE ASKING RENTS (NNN)
(%)($/PSF) Average Asking Rent (L) 18 Month Rate Change (R)
0
3
6
9
12
15
18
21
24
27
30
0
10
20
30
40
50
60
70
80
90
100
New York Ci
ty
Boston
-Cambrid
ge
San Fra
ncisco B
ay Area
San Diego
Los Ang
eles
Washingt
on, D.C.
-Baltim
ore
Chicago
MetroSea
ttle
Philade
lphia
Raleigh-
Durham
New Jersey
Denver-B
oulder
Orange C
ounty

U.S. LIFE SCIENCES | CBRE RESEARCH 33
New York, NY.

Cambridge, MA.
34 © 2020 CBRE, Inc.

U.S. LIFE SCIENCES | CBRE RESEARCH 35
Source: CBRE Research, Q3 2020.
Note: No 18-month change available for University City, Philadelphia.
FIGURE 22: SELECT LAB SUBMARKET AVERAGE ASKING RENTS (NNN)
Average Asking Rent (L) 18 Month Rate Change (R) (%)
0
3
6
9
12
15
18
0
20
40
60
80
100
120
($/PSF)
Cambrid
ge (Bos
ton-Ca
mbridge)
North Pen
insula
(San Fr
ancisco
Bay Ar
ea)
Torrey P
ines (Sa
n Diego
)
South L
ake Union
(Seattl
e)
Universit
y City (
Philade
lphia)
36 © 2020 CBRE, Inc.
2020 U.S. LIFE SCIENCE INVESTMENT SALES
Commercialrealestateinvestorshavebeen
increasinglyattractedtothelifesciences
sectorsoverthepast20years.Fortheyear
endingQ22020,salesoflab/R&Dproperties
totaled$9.6billion—aninefoldincreasefrom
theyearendingQ22001.Overthesametwo
comparisonperiods,salesofconventional
officeproperties(excludinglab/R&D)grewby
afactorof5.3(Figure21).Whilesalesofboth
lab/R&Dandconventionalofficesmoderated
overthepastseveralyearsafterasignificant
increaseintransactionactivityfollowingthe
GlobalFinancialCrisis(GFC),salesvolumeof
lab/R&Dpropertieswasstillhigherasrecently
asQ32019thanthepre-GFCpeakin2007.In
contrast,salesofconventionalofficeproperties
haveremainedsignificantlybelowtheirpre-
GFCpeakin2007.
Pricingforlab/R&Dpropertiesremains
aggressive.Lab/R&Dcaprateshavebeenlower
thanconventionalofficecapratessince2015,
atrendneverexhibitedbeforeonaconsistent
basisanddemonstratingstronginvestor
demandforlifesciencesproperties.
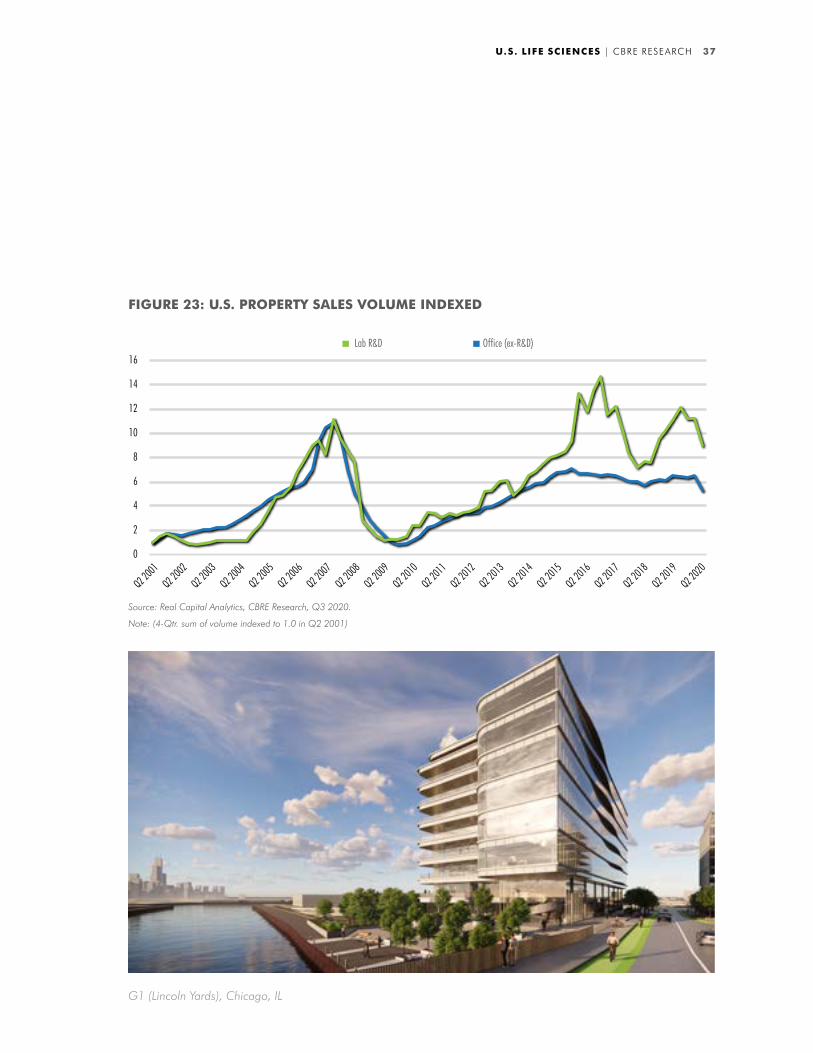
Thebulkofsalestransactions(66%)continue
tooccurinthetopthreelifesciencesmarkets
oftheSanFranciscoBayArea,Boston-
CambridgeandSanDiego(Figure23).The
shareoftotallab/R&Dsalestransactionsby
thesemarketshasfluctuatedbetween50%
and80%overthepast18yearsforanaverage
of65%.
4 Martin Luther King, Jr. Boulevard, Baltimore, MD.
U.S. LIFE SCIENCES | CBRE RESEARCH 37
G1 (Lincoln Yards), Chicago, IL
Source: Real Capital Analytics, CBRE Research, Q3 2020.
Note: (4-Qtr. sum of volume indexed to 1.0 in Q2 2001)
Lab R&D Office (ex-R&D)
0
2
4
6
8
10
12
14
16
Q2 2001
Q2 2002
Q2 2003
Q2 2004
Q2 2005
Q2 2006
Q2 2007
Q2 2008
Q2 2009
Q2 2010
Q2 2011
Q2 2012
Q2 2013
Q2 2014
Q2 2015
Q2 2016
Q2 2017
Q2 2018
Q2 2019
Q2 2020
FIGURE 23: U.S. PROPERTY SALES VOLUME INDEXED

38 © 2020 CBRE, Inc.
FIGURE 24: U.S. CAP RATES BY PROPERTY TYPE
5.5
6.0
6.5
7.0
7.5
8.0
8.5
9.0
9.5
10.0
Q2 2001
Q2 2002
Q2 2003
Q2 2004
Q2 2005
Q2 2006
Q2 2007
Q2 2008
Q2 2009
Q2 2010
Q2 2011
Q2 2012
Q2 2013
Q2 2014
Q2 2015
Q2 2016
Q2 2017
Q2 2018
Q2 2019
Q2 2020
(%) Lab R&D Office (ex-R&D)
Keystone Science Center, Raleigh Durham, NC.
Source: Real Capital Analytics, CBRE Research, Q3 2020.

U.S. LIFE SCIENCES | CBRE RESEARCH 39
Source: Real Capital Analytics, CBRE Research, Q3 2020.
FIGURE 25: LAB/R&D PROPERTY SALES BY MARKET (4-QTR ROLLING SUM)
($ Billions)
0
2
4
6
8
10
12
14
16
18
Q2 2002
Q3 2003
Q4 2004
Q1 200
6
Q2 2007
Q3 2008
Q4 2009
Q1 201
1Q2 2
012Q3 2
013Q4 2
014Q1
2016
Q2 2017
Q3 2018
Q2 2020
- Cambridge/ SanSan Francisco Bay Area/ Boston Diego
Rest of U.S.
The Cove-Oyster Point, San Francisco, CA.

BOSTON-CAMBRIDGE
Development Name Submarket Developer Sq. Ft. Notes200 West Street Route 128 West Boston Properties 260,000 Spec 2020 delivery51 Sleeper Street Seaport Nan Fung Intl. Properties 149,121 Spec 2020 delivery1 Winthrop Square CBD Nan Fung Intl. Properties 114,343 Spec 2020 delivery20 Maguire Road Route 128 West Griffith Properties 101,000 Spec 2020 delivery1560 Trapelo Road Route 128 West Phase3 65,000 Spec 2021 delivery
Source: CBRE Research, Q2 2020.
Source: Real Capital Analytics, Q2 2020. Note: Annual sales figures of R&D properties.
LAB/R&D PROPERTY SALES VOLUME
0.00.51.01.52.02.5
3.53.0
Q2 2015 Q2 2017 Q2 2019 Q2 2020
($ Billions)
Submarket Inventory SF Vacancy Rate Avg Asking Rent (NNN) 18-mos ChangeCambridge 14,826,480 2.6% $97.21 12.4%Boston 8,676,282 3.4% $82.36 1.3%Route 128 - Core 8,603,091 7.9% $56.68 25.0%Route 495 - Core 3,092,416 11.8% $28.70 12.9%Total (Core Submarkets) 35,198,269 4.9% $73.88 6.9%
Lab Market Stats, Q2 2020
Conversions to Lab
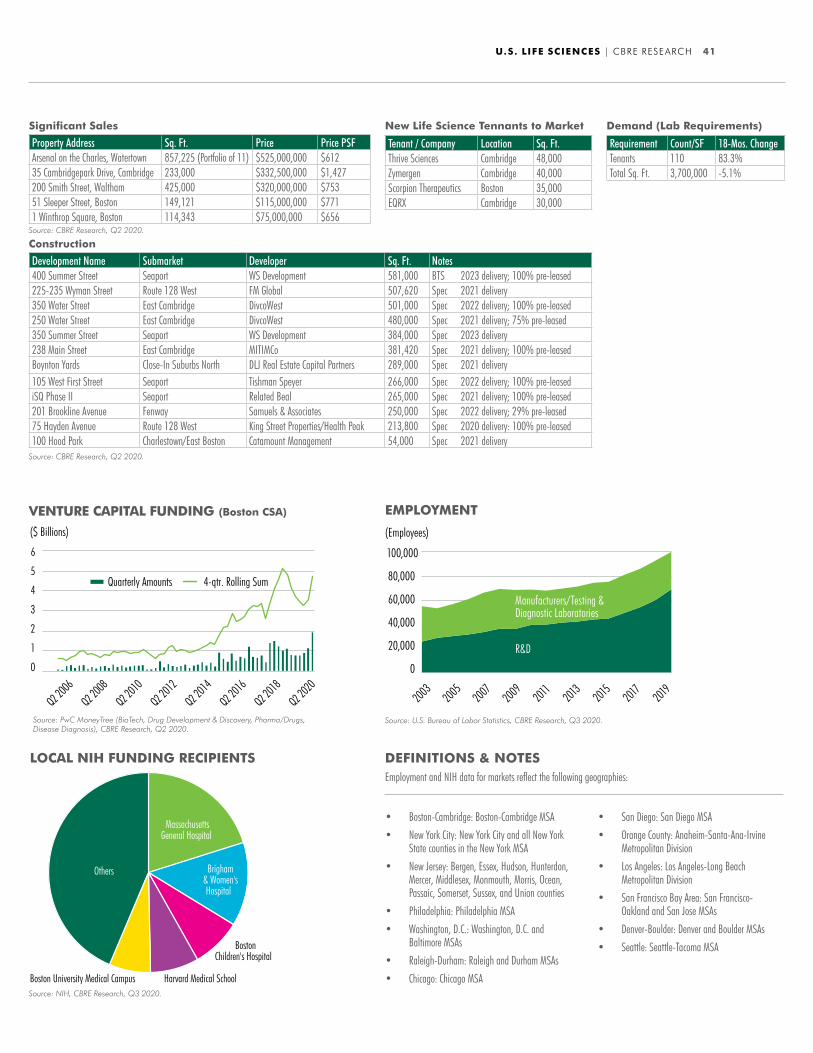
Boston-Cambridge remains the nation’s premier life sciences market, owing to its leading research universities attracting the largest amount of NIH funding, the largest inventory of cutting-edge laboratory space and the seemingly insatiable demand by companies to participate in the local ecosystem.
As of Q2, nearly 110 tenants were seeking a total of 3.7 million sq. ft. of lab space, up slightly from the beginning of the year. Compared with a year ago, the number of tenants seeking space has grown by 83%, while total space required is down marginally.
More than 50 companies in the Boston-Cambridge market can apply their science and technology to COVID-related products, which has created a marginal boost to demand.
Boston-Cambridge life sciences companies secured $1.9 billion in venture capital funding in Q2 2020, the largest amount since 1995
The Boston-Cambridge lab market remains tight, with a vacancy rate of just 4.9% in Q2 2020. In the Cambridge submarket alone, a 2.6% vacancy rate helped push average asking rents up by 12.4% since early 2019. Further rent growth and extremely tight vacancy are expected.
New lab projects totaling 4.3 million sq. ft. were under construction in Q2 2020, including a 581,000-sq.-ft. build-to-suit in the Seaport. More than one-third of all current construction is in the Seaport, helping solidify its growing status among life sciences tenants. The metro’s supply pipeline has more than doubled since early 2019.
Total life sciences employment in Boston-Cambridge grew by 7.7% between 2018 and 2019, fueled by a 15.0% jump in R&D employment—the largest increase since at least 2002.
Boston-Cambridge continues to attract the largest amount of NIH funding of any U.S. life sciences market, with $2.5 billion in fiscal year 2019.
NIH FUNDING RECIPIENTS BY LIFE SCIENCES CLUSTER#1 in nation: $2.5 billion (2019)
Tenants continue to spread across the metro to suburban submarkets like Somerville, South Boston, Watertown, Lexington and Waltham. The intersection of artificial intelligence and life sciences continues to emerge, allowing for the advancement of research in new products, diagnostics and drug candidates.
Significant Lease Deals
Tenant Submarket Sq. Ft. TypeFoundation Medicine Seaport 581,000 Relocation/expansionBristol Myers Squibb East Cambridge 360,000 Relocation/expansionCRISPR Therapeutcs Seaport 260,000 Relocation/expansionVertex Seaport 168,000 ExpansionBlue Rock East Cambridge 73,000 Relocation/expansionKintai Therapeutics West Cambridge 72,000 Relocation/expansionArrakis Therapeutics Route 128 West 68,000 Relocation/expansionCRISPR Therapeutcs Framingham/Natick 51,000 Expansion (GMP)
Source: CBRE Research, Q2 2020.
0.00.51.01.52.02.53.0
Boston
-Cambrid
ge
New York C
ity
Washing
ton, D.
C. - Ba
ltimore
San Fra
ncisco B
ay Are
a
Raleig
h-Durh
am
Philad
elphia
Los An
geles
Seattle
San Die
goChi
cago
Detroit
Houston
Pittsbu
rghSt.
Louis
Atlanta
New Haven, C
T
Nashville
Denver-B
oulder
Minneap
olis
Birming
ham, AL
($ Billions)
Source: NIH, CBRE Research, Q3 2020.
OVERVIEW
RENTS & VACANCY
SUPPLY
DEMAND
COVID-19 EFFECT
EMPLOYMENT
VENTURE CAPITAL FUNDING
NIH FUNDING
OTHER
QUICK STATS
U.S. LIFE SCIENCES | CBRE RESEARCH 41
VENTURE CAPITAL FUNDING (Boston CSA)
0
1
2
3
4
5
6
Q2 2008
Q2 2006
Q2 2010
Q2 2012
Q2 2014
Q2 2016
Q2 2018
Q2 2020
($ Billions)
Quarterly Amounts 4-qtr. Rolling Sum
Source: PwC MoneyTree (BioTech, Drug Development & Discovery, Pharma/Drugs, Disease Diagnosis), CBRE Research, Q2 2020.
EMPLOYMENT
0
20,000
40,000
60,000
80,000
100,000
(Employees)
2003
2005
2007
2009
2011
2013
2015
2017
2019
R&D
Manufacturers/Testing & Diagnostic Laboratories
Source: U.S. Bureau of Labor Statistics, CBRE Research, Q3 2020.
Significant Sales
Property Address Sq. Ft. Price Price PSFArsenal on the Charles, Watertown 857,225 (Portfolio of 11) $525,000,000 $61235 Cambridgepark Drive, Cambridge 233,000 $332,500,000 $1,427200 Smith Street, Waltham 425,000 $320,000,000 $75351 Sleeper Street, Boston 149,121 $115,000,000 $7711 Winthrop Square, Boston 114,343 $75,000,000 $656
Source: CBRE Research, Q2 2020.
Tenant / Company Location Sq. Ft.Thrive Sciences Cambridge 48,000Zymergen Cambridge 40,000Scorpion Therapeutics Boston 35,000EQRX Cambridge 30,000
Requirement Count/SF 18-Mos. ChangeTenants 110 83.3%Total Sq. Ft. 3,700,000 -5.1%
New Life Science Tennants to Market Demand (Lab Requirements)
Development Name Submarket Developer Sq. Ft. Notes400 Summer Street Seaport WS Development 581,000 BTS 2023 delivery; 100% pre-leased225-235 Wyman Street Route 128 West FM Global 507,620 Spec 2021 delivery350 Water Street East Cambridge DivcoWest 501,000 Spec 2022 delivery; 100% pre-leased250 Water Street East Cambridge DivcoWest 480,000 Spec 2021 delivery; 75% pre-leased350 Summer Street Seaport WS Development 384,000 Spec 2023 delivery238 Main Street East Cambridge MITIMCo 381,420 Spec 2021 delivery; 100% pre-leasedBoynton Yards Close-In Suburbs North DLJ Real Estate Capital Partners 289,000 Spec 2021 delivery105 West First Street Seaport Tishman Speyer 266,000 Spec 2022 delivery; 100% pre-leasediSQ Phase II Seaport Related Beal 265,000 Spec 2021 delivery; 100% pre-leased201 Brookline Avenue Fenway Samuels & Associates 250,000 Spec 2022 delivery; 29% pre-leased75 Hayden Avenue Route 128 West King Street Properties/Health Peak 213,800 Spec 2020 delivery: 100% pre-leased100 Hood Park Charlestown/East Boston Catamount Management 54,000 Spec 2021 delivery
Construction
LOCAL NIH FUNDING RECIPIENTS
MassachusettsGeneral Hospital
Brigham& Women'sHospital
Harvard Medical SchoolBoston University Medical Campus
Others
BostonChildren's Hospital
Source: NIH, CBRE Research, Q3 2020.
Source: CBRE Research, Q2 2020.
• Boston-Cambridge: Boston-Cambridge MSA
• New York City: New York City and all New York State counties in the New York MSA
• New Jersey: Bergen, Essex, Hudson, Hunterdon, Mercer, Middlesex, Monmouth, Morris, Ocean, Passaic, Somerset, Sussex, and Union counties
• Philadelphia: Philadelphia MSA
• Washington, D.C.: Washington, D.C. and Baltimore MSAs
• Raleigh-Durham: Raleigh and Durham MSAs
• Chicago: Chicago MSA
• San Diego: San Diego MSA
• Orange County: Anaheim-Santa-Ana-Irvine Metropolitan Division
• Los Angeles: Los Angeles-Long Beach Metropolitan Division
• San Francisco Bay Area: San Francisco- Oakland and San Jose MSAs
• Denver-Boulder: Denver and Boulder MSAs
• Seattle: Seattle-Tacoma MSA
DEFINITIONS & NOTESEmployment and NIH data for markets reflect the following geographies:
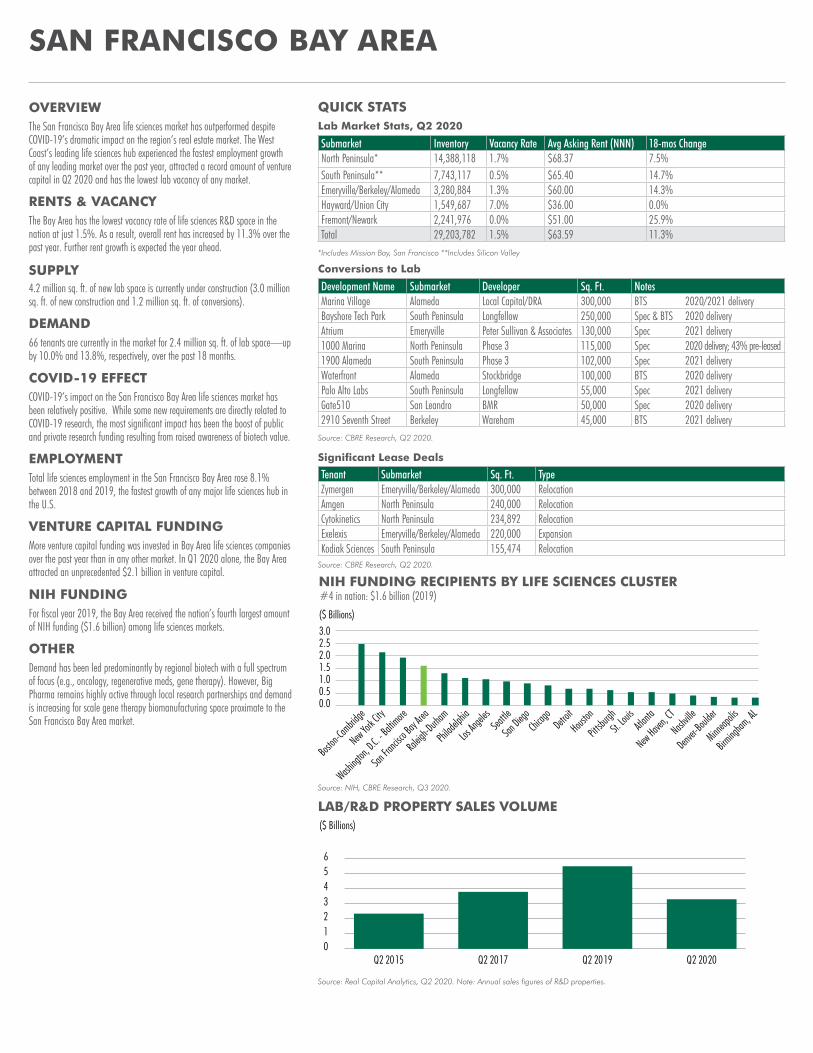
The San Francisco Bay Area life sciences market has outperformed despite COVID-19’s dramatic impact on the region’s real estate market. The West Coast’s leading life sciences hub experienced the fastest employment growth of any leading market over the past year, attracted a record amount of venture capital in Q2 2020 and has the lowest lab vacancy of any market.
66 tenants are currently in the market for 2.4 million sq. ft. of lab space—up by 10.0% and 13.8%, respectively, over the past 18 months.
COVID-19’s impact on the San Francisco Bay Area life sciences market has been relatively positive. While some new requirements are directly related to COVID-19 research, the most significant impact has been the boost of public and private research funding resulting from raised awareness of biotech value.
More venture capital funding was invested in Bay Area life sciences companies over the past year than in any other market. In Q1 2020 alone, the Bay Area attracted an unprecedented $2.1 billion in venture capital.
The Bay Area has the lowest vacancy rate of life sciences R&D space in the nation at just 1.5%. As a result, overall rent has increased by 11.3% over the past year. Further rent growth is expected the year ahead.
4.2 million sq. ft. of new lab space is currently under construction (3.0 million sq. ft. of new construction and 1.2 million sq. ft. of conversions).
Total life sciences employment in the San Francisco Bay Area rose 8.1% between 2018 and 2019, the fastest growth of any major life sciences hub in the U.S.
For fiscal year 2019, the Bay Area received the nation’s fourth largest amount of NIH funding ($1.6 billion) among life sciences markets.
Demand has been led predominantly by regional biotech with a full spectrum of focus (e.g., oncology, regenerative meds, gene therapy). However, Big Pharma remains highly active through local research partnerships and demand is increasing for scale gene therapy biomanufacturing space proximate to the San Francisco Bay Area market.
SAN FRANCISCO BAY AREA
Source: Real Capital Analytics, Q2 2020. Note: Annual sales figures of R&D properties.
LAB/R&D PROPERTY SALES VOLUME
0123456
Q2 2015 Q2 2017 Q2 2019 Q2 2020
($ Billions)
QUICK STATS
Submarket Inventory Vacancy Rate Avg Asking Rent (NNN) 18-mos ChangeNorth Peninsula* 14,388,118 1.7% $68.37 7.5%South Peninsula** 7,743,117 0.5% $65.40 14.7%Emeryville/Berkeley/Alameda 3,280,884 1.3% $60.00 14.3%Hayward/Union City 1,549,687 7.0% $36.00 0.0%Fremont/Newark 2,241,976 0.0% $51.00 25.9%Total 29,203,782 1.5% $63.59 11.3%
Lab Market Stats, Q2 2020
Tenant Submarket Sq. Ft. TypeZymergen Emeryville/Berkeley/Alameda 300,000 RelocationAmgen North Peninsula 240,000 RelocationCytokinetics North Peninsula 234,892 RelocationExelexis Emeryville/Berkeley/Alameda 220,000 Expansion Kodiak Sciences South Peninsula 155,474 Relocation
Source: CBRE Research, Q2 2020.
Significant Lease Deals
OVERVIEW
RENTS & VACANCY
SUPPLY
DEMAND
COVID-19 EFFECT
EMPLOYMENT
VENTURE CAPITAL FUNDING
NIH FUNDING
OTHER
*Includes Mission Bay, San Francisco **Includes Silicon Valley
Development Name Submarket Developer Sq. Ft. NotesMarina Village Alameda Local Capital/DRA 300,000 BTS 2020/2021 deliveryBayshore Tech Park South Peninsula Longfellow 250,000 Spec & BTS 2020 deliveryAtrium Emeryville Peter Sullivan & Associates 130,000 Spec 2021 delivery1000 Marina North Peninsula Phase 3 115,000 Spec 2020 delivery; 43% pre-leased1900 Alameda South Peninsula Phase 3 102,000 Spec 2021 deliveryWaterfront Alameda Stockbridge 100,000 BTS 2020 deliveryPalo Alto Labs South Peninsula Longfellow 55,000 Spec 2021 deliveryGate510 San Leandro BMR 50,000 Spec 2020 delivery2910 Seventh Street Berkeley Wareham 45,000 BTS 2021 delivery
Source: CBRE Research, Q2 2020.
Conversions to Lab
Source: NIH, CBRE Research, Q3 2020.
0.00.51.01.52.02.53.0($ Billions)
Boston
-Cambrid
ge
New York C
ity
Washing
ton, D.
C. - Ba
ltimore
San Fra
ncisco B
ay Are
a
Raleig
h-Durh
am
Philad
elphia
Los An
geles
Seattle
San Die
goChi
cago
Detroit
Houston
Pittsbu
rghSt.
Louis
Atlanta
New Haven, C
T
Nashville
Denver-B
oulder
Minneap
olis
Birming
ham, AL
NIH FUNDING RECIPIENTS BY LIFE SCIENCES CLUSTER#4 in nation: $1.6 billion (2019)
U.S. LIFE SCIENCES | CBRE RESEARCH 43
Tenant / Company Location Sq. Ft.Lyell North Peninsula 100,000SmartLabs North Peninsula 80,000MAZE North Peninsula 65,000Eli Lilly North Peninsula 60,000Perfect Day Foods Berkeley/Emeryville 45,000
LOCAL NIH FUNDING RECIPIENTS
U.C. San Francisco
StanfordUniversity
U.C. Berkeley
Others
VENTURE CAPITAL FUNDING (San Jose-San Francisco-Oakland, CA CSA)
0
1
2
3
4
5
6
Q2 2008
Q2 2006
Q2 2005
Q2 2010
Q2 2012
Q2 2014
Q2 2016
Q2 2018
Q2 2020
($ Billions)
Quarterly Amounts 4-qtr. Rolling Sum
Source: PwC MoneyTree (BioTech, Drug Development & Discovery, Pharma/Drugs, Disease Diagnosis), CBRE Research, Q2 2020.
EMPLOYMENT
020,00040,00060,00080,000
100,000120,000140,000
2003
2005
2007
2009
2011
2013
2015
2017
2019
R&D
Manufacturers/Testing & Diagnostic Laboratories
(Employees)
Source: U.S. Bureau of Labor Statistics, CBRE Research, Q3 2020.
Property Address Sq. Ft. Price Price PSFBayshore Technology Park 994,101 $648,000,000 $6521804 Embarcadero Road 259,822 $205,000,000 $789150 Industrial Road 229,640 $99,000,000 $431500 Forbes Boulevard 155,685 $139,500,000 $8963412 Hillview Avenue 106,316 $105,000,000 $988
Source: CBRE Research, Q2 2020.
Significant Sales New Life Science Tenants to Market
Development Name Submarket Developer Sq. Ft. NotesOyster Point Phase I North Peninsula Kilroy 596,584 Spec 2020 delivery; 100% pre-leasedThe District South Peninsula ARE 526,000 Spec 2020 delivery; 56% pre-leasedGateway of Pacific Phase II North Peninsula BMR 430,000 Spec 2021 delivery; 55% pre-leasedSierra Pt Phase II/III North Peninsula Healthpeak 406,678 Spec 2020/2021 delivery; 64% pre-leasedGateway of Pacific Phase III North Peninsula BMR 350,000 Spec 2021 delivery201 Haskins North Peninsula ARE 315,000 Spec 2020 delivery; 31% pre-leasedSouth Loop Center Emeryville/Berkeley/Alameda SRMERNST 313,000 Spec 2021 delivery; 41% pre-leased6455 Christie Emeryville Harvest 82,000 Spec 2021 delivery
Construction
Source: NIH, CBRE Research, Q3 2020.
Requirement Count/SF 18-Mos. ChangeTenants 66 10.0%Total Sq. Ft. 2,390,000 13.8%
Demand (Lab Requirements)
Source: CBRE Research, Q2 2020.
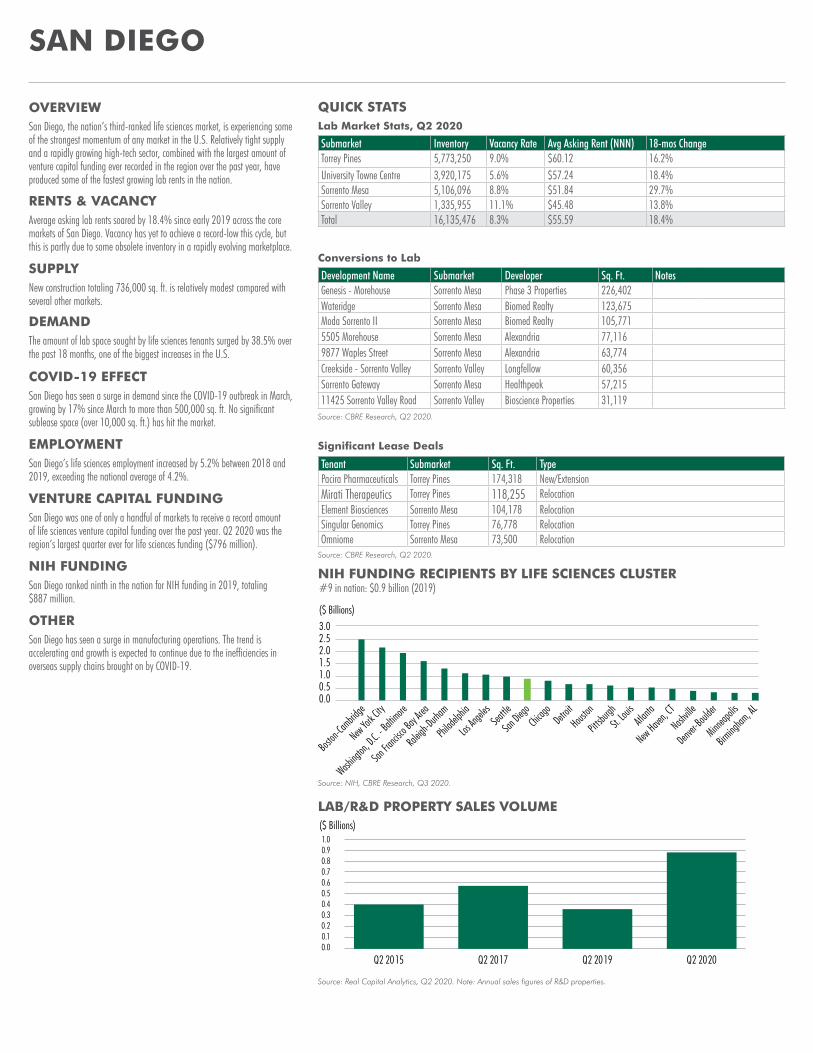
San Diego, the nation’s third-ranked life sciences market, is experiencing some of the strongest momentum of any market in the U.S. Relatively tight supply and a rapidly growing high-tech sector, combined with the largest amount of venture capital funding ever recorded in the region over the past year, have produced some of the fastest growing lab rents in the nation.
Average asking lab rents soared by 18.4% since early 2019 across the core markets of San Diego. Vacancy has yet to achieve a record-low this cycle, but this is partly due to some obsolete inventory in a rapidly evolving marketplace.
New construction totaling 736,000 sq. ft. is relatively modest compared with several other markets.
SAN DIEGO
Source: NIH, CBRE Research, Q3 2020.
0.00.51.01.52.02.53.0($ Billions)
Boston
-Cambrid
ge
New York C
ity
Washing
ton, D.
C. - Ba
ltimore
San Fra
ncisco B
ay Are
a
Raleig
h-Durh
am
Philad
elphia
Los An
geles
Seattle
San Die
goChi
cago
Detroit
Houston
Pittsbu
rghSt.
Louis
Atlanta
New Haven, C
T
Nashville
Denver-B
oulder
Minneap
olis
Birming
ham, AL
Source: Real Capital Analytics, Q2 2020. Note: Annual sales figures of R&D properties.
LAB/R&D PROPERTY SALES VOLUME
Q2 2015 Q2 2017 Q2 2019 Q2 2020
($ Billions)
0.00.10.20.30.40.50.60.70.80.91.0
Submarket Inventory Vacancy Rate Avg Asking Rent (NNN) 18-mos ChangeTorrey Pines 5,773,250 9.0% $60.12 16.2%University Towne Centre 3,920,175 5.6% $57.24 18.4%Sorrento Mesa 5,106,096 8.8% $51.84 29.7%Sorrento Valley 1,335,955 11.1% $45.48 13.8%Total 16,135,476 8.3% $55.59 18.4%
Lab Market Stats, Q2 2020
Tenant Submarket Sq. Ft. TypePacira Pharmaceuticals Torrey Pines 174,318 New/ExtensionMirati Therapeutics Torrey Pines 118,255 RelocationElement Biosciences Sorrento Mesa 104,178 RelocationSingular Genomics Torrey Pines 76,778 RelocationOmniome Sorrento Mesa 73,500 Relocation
Source: CBRE Research, Q2 2020.
Source: CBRE Research, Q2 2020.
Significant Lease Deals
OVERVIEW
RENTS & VACANCY
SUPPLY
The amount of lab space sought by life sciences tenants surged by 38.5% over the past 18 months, one of the biggest increases in the U.S.
San Diego has seen a surge in demand since the COVID-19 outbreak in March, growing by 17% since March to more than 500,000 sq. ft. No significant sublease space (over 10,000 sq. ft.) has hit the market.
San Diego was one of only a handful of markets to receive a record amount of life sciences venture capital funding over the past year. Q2 2020 was the region’s largest quarter ever for life sciences funding ($796 million).
San Diego’s life sciences employment increased by 5.2% between 2018 and 2019, exceeding the national average of 4.2%.
San Diego ranked ninth in the nation for NIH funding in 2019, totaling $887 million.
San Diego has seen a surge in manufacturing operations. The trend is accelerating and growth is expected to continue due to the inefficiencies in overseas supply chains brought on by COVID-19.
DEMAND
COVID-19 EFFECT
EMPLOYMENT
VENTURE CAPITAL FUNDING
NIH FUNDING
OTHER
QUICK STATS
NIH FUNDING RECIPIENTS BY LIFE SCIENCES CLUSTER#9 in nation: $0.9 billion (2019)
Development Name Submarket Developer Sq. Ft. NotesGenesis - Morehouse Sorrento Mesa Phase 3 Properties 226,402Wateridge Sorrento Mesa Biomed Realty 123,675Moda Sorrento II Sorrento Mesa Biomed Realty 105,7715505 Morehouse Sorrento Mesa Alexandria 77,1169877 Waples Street Sorrento Mesa Alexandria 63,774Creekside - Sorrento Valley Sorrento Valley Longfellow 60,356Sorrento Gateway Sorrento Mesa Healthpeak 57,21511425 Sorrento Valley Road Sorrento Valley Bioscience Properties 31,119
Conversions to Lab
U.S. LIFE SCIENCES | CBRE RESEARCH 45
Tenant / Company Location Sq. Ft.Guardant Health Torrey Pines 36,000
LOCAL NIH FUNDING RECIPIENTS
U.C. San Diego
Salk Institute forBiological Studies
Scripps ResearchInstitute
OthersSandford Burnham PrebysMedical Discovery Institute
VENTURE CAPITAL FUNDING (San Diego MSA)
0.00.20.40.60.81.01.21.41.61.82.0
Q2 2008
Q2 2006
Q2 2005
Q2 2010
Q2 2012
Q2 2014
Q2 2016
Q2 2018
Q2 2020
($ Billions)
Quarterly Amounts 4-qtr. Rolling Sum
Source: PwC MoneyTree (BioTech, Drug Development & Discovery, Pharma/Drugs, Disease Diagnosis), CBRE Research, Q2 2020.
EMPLOYMENT
010,00020,00030,00040,00050,00060,00070,000
2003
2005
2007
2009
2011
2013
2015
2017
2019
R&D
Manufacturers/Testing & Diagnostic Laboratories
(Employees)
Source: U.S. Bureau of Labor Statistics, CBRE Research, Q3 2020.
Property Address Sq. Ft. Price Price PSFGenesis/Campus Point Court & Drive 314,135 $255,000,000 $81210770 Wateridge Circle & 6325 Lusk Boulevard 233,570 $158,500,000 $679
Source: CBRE Research, Q2 2020.
Significant Sales New Life Science Tenants to Market
Development Name Submarket Developer Sq. Ft. NotesAperture DMH/56-Corridor Gemdale/Lincoln 229,000 Spec 2021 deliveryThe Boardwalk Torrey Pines Healthpeak 196,000 Spec 2021 delivery; 39% pre-leasedARE Tech Sorrento Mesa Alexandria 176,000 Partial BTS 2022 delivery; 59% pre-leasedSpectrum III Torrey Pines Alexandria 146,000 Spec 2021 delivery
Construction
Source: NIH, CBRE Research, Q3 2020.
Requirement Count/SF 18-Mos. ChangeTenants 43 30.3%Total Sq. Ft. 1,800,000 38.5%
Demand (Lab Requirements)
Source: CBRE Research, Q2 2020.
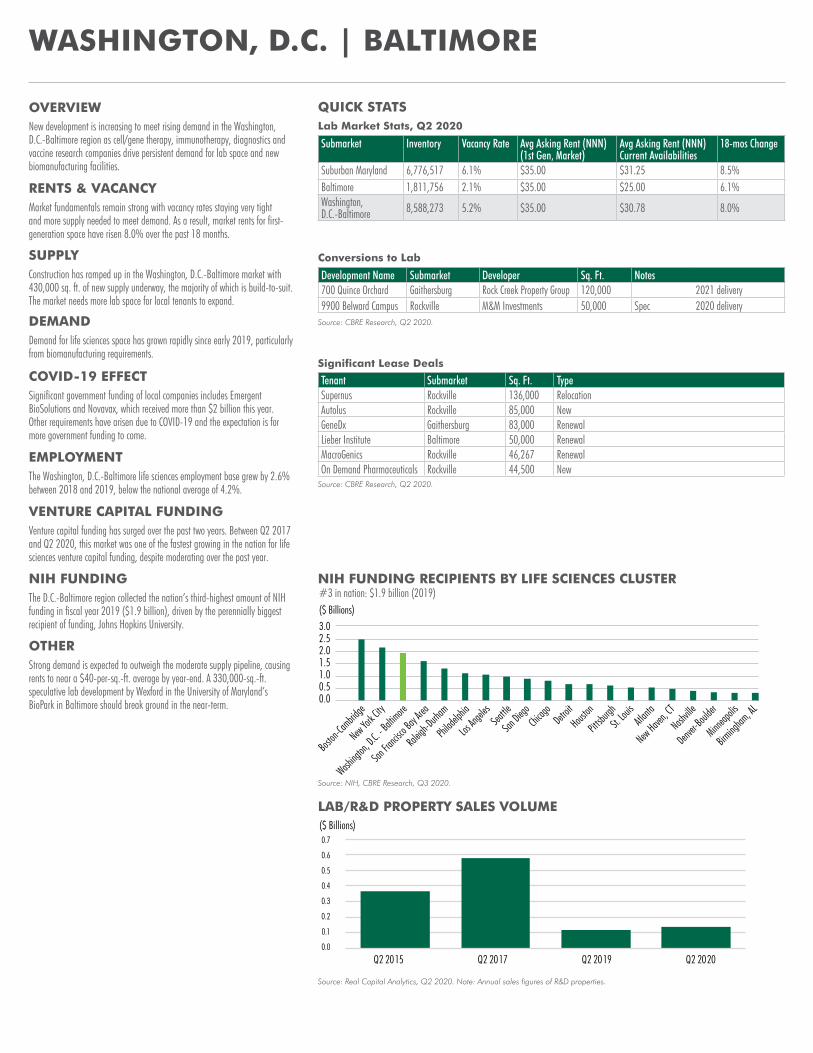
New development is increasing to meet rising demand in the Washington, D.C.-Baltimore region as cell/gene therapy, immunotherapy, diagnostics and vaccine research companies drive persistent demand for lab space and new biomanufacturing facilities.
Market fundamentals remain strong with vacancy rates staying very tight and more supply needed to meet demand. As a result, market rents for first-generation space have risen 8.0% over the past 18 months.
Construction has ramped up in the Washington, D.C.-Baltimore market with 430,000 sq. ft. of new supply underway, the majority of which is build-to-suit. The market needs more lab space for local tenants to expand.
WASHINGTON, D.C. | BALTIMORE
Source: NIH, CBRE Research, Q3 2020.
0.00.51.01.52.02.53.0($ Billions)
Boston
-Cambrid
ge
New York C
ity
Washing
ton, D.
C. - Ba
ltimore
San Fra
ncisco B
ay Are
a
Raleig
h-Durh
am
Philad
elphia
Los An
geles
Seattle
San Die
goChi
cago
Detroit
Houston
Pittsbu
rghSt.
Louis
Atlanta
New Haven, C
T
Nashville
Denver-B
oulder
Minneap
olis
Birming
ham, AL
Source: Real Capital Analytics, Q2 2020. Note: Annual sales figures of R&D properties.
LAB/R&D PROPERTY SALES VOLUME
0.0
0.1
0.2
0.3
0.4
0.5
0.6
0.7
Q2 2015 Q2 2017 Q2 2019 Q2 2020
($ Billions)
Lab Market Stats, Q2 2020
Tenant Submarket Sq. Ft. TypeSupernus Rockville 136,000 RelocationAutolus Rockville 85,000 NewGeneDx Gaithersburg 83,000 RenewalLieber Institute Baltimore 50,000 RenewalMacroGenics Rockville 46,267 RenewalOn Demand Pharmaceuticals Rockville 44,500 New
Source: CBRE Research, Q2 2020.
Significant Lease Deals
OVERVIEW
RENTS & VACANCY
SUPPLY
Demand for life sciences space has grown rapidly since early 2019, particularly from biomanufacturing requirements.
Significant government funding of local companies includes Emergent BioSolutions and Novavax, which received more than $2 billion this year. Other requirements have arisen due to COVID-19 and the expectation is for more government funding to come.
DEMAND
COVID-19 EFFECT
Source: CBRE Research, Q2 2020.
Venture capital funding has surged over the past two years. Between Q2 2017 and Q2 2020, this market was one of the fastest growing in the nation for life sciences venture capital funding, despite moderating over the past year.
The Washington, D.C.-Baltimore life sciences employment base grew by 2.6% between 2018 and 2019, below the national average of 4.2%.
EMPLOYMENT
VENTURE CAPITAL FUNDING
The D.C.-Baltimore region collected the nation’s third-highest amount of NIH funding in fiscal year 2019 ($1.9 billion), driven by the perennially biggest recipient of funding, Johns Hopkins University.
NIH FUNDING
Strong demand is expected to outweigh the moderate supply pipeline, causing rents to near a $40-per-sq.-ft. average by year-end. A 330,000-sq.-ft. speculative lab development by Wexford in the University of Maryland’s BioPark in Baltimore should break ground in the near-term.
OTHER
Development Name Submarket Developer Sq. Ft. Notes700 Quince Orchard Gaithersburg Rock Creek Property Group 120,000 2021 delivery9900 Belward Campus Rockville M&M Investments 50,000 Spec 2020 delivery
Conversions to Lab
Submarket Inventory Vacancy Rate Avg Asking Rent (NNN) (1st Gen, Market)
Avg Asking Rent (NNN) Current Availabilities
18-mos Change
Suburban Maryland 6,776,517 6.1% $35.00 $31.25 8.5%Baltimore 1,811,756 2.1% $35.00 $25.00 6.1%Washington, D.C.-Baltimore 8,588,273 5.2% $35.00 $30.78 8.0%
QUICK STATS
NIH FUNDING RECIPIENTS BY LIFE SCIENCES CLUSTER#3 in nation: $1.9 billion (2019)

U.S. LIFE SCIENCES | CBRE RESEARCH 47
Tenant / Company Location Sq. Ft.Autolus Rockville 85,000Illumina Baltimore 13,000
LOCAL NIH FUNDING RECIPIENTS
VENTURE CAPITAL FUNDING (Washington, D.C.-Baltimore CSA)
Source: PwC MoneyTree (BioTech, Drug Development & Discovery, Pharma/Drugs, Disease Diagnosis), CBRE Research, Q2 2020.
EMPLOYMENT
010,00020,00030,00040,00050,00060,00070,000
2003
2005
2007
2009
2011
2013
2015
2017
2019
R&D
Manufacturers/Testing & Diagnostic Laboratories
(Employees)
Source: U.S. Bureau of Labor Statistics, CBRE Research, Q3 2020.
Property Address Sq. Ft. Price Price PSF25, 35, 45 West Watkins Mill Road 139,000 $53,250,000 $3839605 Medical Center Drive 115,691 $28,922,750 $250
Source: CBRE Research, Q2 2020.
Significant Sales New Life Science Tenants to Market
Development Name Submarket Developer Sq. Ft. Notes9800 Medical Center Rockville ARE 175,000 BTS 2021 delivery9950 Medical Center Rockville ARE 85,000 BTS 2021 delivery
Construction
Johns Hopkins University
George Washington University
University of Maryland Baltimore Leidos Biomedical
Research, Inc.
Others
Q2 2008
Q2 2006
Q2 2005
Q2 2010
Q2 2012
Q2 2014
Q2 2016
Q2 2018
Q2 2020
($ Billions)
Quarterly Amounts 4-qtr. Rolling Sum
0.00.10.20.30.40.50.60.70.80.9
Source: NIH, CBRE Research, Q3 2020.
Requirement Count/SF 18-Mos. ChangeTenants 18 28.6%Total Sq. Ft. 1,400,000 133.3%
Demand (Lab Requirements)
Source: CBRE Research, Q2 2020.

Raleigh-Durham’s life sciences market is experiencing considerable growth and transformation. Few markets can match its recent employment growth, and developers are responding with various transformative redevelopments and conversions to fuel future growth.
Despite continued growth of the local lab inventory, average asking rents remained stable over the past 18 months and vacancy declined by 3.1 percentage points to 19.0%.
RALEIGH-DURHAM
Source: NIH, CBRE Research, Q3 2020.
0.00.51.01.52.02.53.0($ Billions)
Boston
-Cambrid
ge
New York C
ity
Washing
ton, D.
C. - Ba
ltimore
San Fra
ncisco B
ay Are
a
Raleig
h-Durh
am
Philad
elphia
Los An
geles
Seattle
San Die
goChi
cago
Detroit
Houston
Pittsbu
rghSt.
Louis
Atlanta
New Haven, C
T
Nashville
Denver-B
oulder
Minneap
olis
Birming
ham, AL
Source: Real Capital Analytics, Q2 2020. Note: Annual sales figures of R&D properties.
LAB/R&D PROPERTY SALES VOLUME
0.0
0.1
0.2
0.3
0.4
0.5
0.6
Q2 2015 Q2 2017 Q2 2019 Q2 2020
($ Billions)
Lab Market Stats, Q2 2020
Tenant Submarket Sq. Ft. TypeEli Lilly RTP 720,000 New location/ExpansionDuke University RTP 275,000 New location/ExpansionGrail RTP 200,000 New location/ExpansionKBI RTP 185,000 New location/ExpansionAdentes Sanford 100,000 New location/Expansion
Source: CBRE Research, Q2 2020.
Significant Lease Deals
OVERVIEW
RENTS & VACANCY
Supply continues to grow in Raleigh-Durham with 980,000 sq. ft. in the pipeline, 8% higher than 18 months ago.
SUPPLY
Demand for lab space has surged since early 2019. Tenants are currently seeking 760,000 sq. ft. of biomanufacturing space and 840,000 sq. ft. of wet lab space.
DEMAND
New requirements directly tied to COVID-19 research have not been identified, but some COVID-related research requirements likely are among the surge in local lab demand.
COVID-19 EFFECT
The exceptionally fast-growing Raleigh-Durham area has experienced above-average growth in its local life sciences employment base. Between 2018 and 2019, total life sciences employment in this market jumped 5.2% versus 4.2% in the U.S.
EMPLOYMENT
Raleigh-Durham continues to lag in attracting higher amounts of life sciences venture capital as some of its peers. For the year ending Q2 2020, Raleigh-Durham attracted only $60 million, though 2018 and 2019 were much better when the region had record venture capital funding of more than $500 million.
VENTURE CAPITAL FUNDING
Raleigh-Durham’s real strength in funding research comes from the NIH, which delivered $1.3 billion to local institutions in 2019, the fifth-highest market allocation nationally.
NIH FUNDING
Major research institutions, cell/gene therapy and agriculture-sciences companies continue to drive rapidly growing demand in this market.
OTHER
Submarket Inventory Vacancy Rate Avg Asking Rent (NNN) 18-mos ChangeRaleigh-Durham 5,858,196 19.0% $24.83 0.3%
Development Name Submarket Developer Sq. Ft. NotesPark Point RTP Trinity 700,000 Spec 2021 delivery; 20% pre-leasedNewcastle North RTP Longfellow 130,000 Spec 2021 delivery
Conversions to Lab
Source: CBRE Research, Q2 2020.
QUICK STATS
NIH FUNDING RECIPIENTS BY LIFE SCIENCES CLUSTER#5 in nation: $1.3 billion (2019)
U.S. LIFE SCIENCES | CBRE RESEARCH 49
Duke University
Reseaerch Triangle Institute
Univ of North Carolina Chapel Hill
Others
Tenant / Company Location Sq. Ft.Lab Corp Parmer RTP 335,000Ask Bio BioPoint 90,000Arysta 5 Davis Drive 90,000
LOCAL NIH FUNDING RECIPIENTS
EMPLOYMENT
0
10,0005,000
15,00020,00025,00030,00035,00040,000
2003
2005
2007
2009
2011
2013
2015
2017
2019
R&D
Manufacturers/Testing & Diagnostic Laboratories
(Employees)
Source: U.S. Bureau of Labor Statistics, CBRE Research, Q3 2020.
Property Address Sq. Ft. Price Price PSFParmer RTP 2.3 M $590,000,000 $257Multi-property purchase by TPG 447,406 $60,100,500 $134Multi-property purchase by Longfellow 397,876 $64,701,500 $163Multi-property purchase by Ventas 175,434 $80,000,000 $456
Source: CBRE Research, Q2 2020.
Significant Sales New Life Science Tenants to Market
VENTURE CAPITAL FUNDING (Raleigh-Durham MSA)
Source: PwC MoneyTree (BioTech, Drug Development & Discovery, Pharma/Drugs, Disease Diagnosis), CBRE Research, Q2 2020.
Q2 2008
Q2 2006
Q2 2005
Q2 2010
Q2 2012
Q2 2014
Q2 2016
Q2 2018
Q2 2020
($ Billions)
Quarterly Amounts 4-qtr. Rolling Sum
0.0
0.1
0.2
0.3
0.4
0.5
0.6
Source: NIH, CBRE Research, Q3 2020.
Development Name Submarket Developer Sq. Ft. Notes5 Davis Drive RTP ARE 150,000 Spec 2021 delivery
Construction
Requirement Count/SF 18-Mos. ChangeTenants 15 -6.3%Total Sq. Ft. 840,000 28.2%
Demand (Lab Requirements)
Source: CBRE Research, Q2 2020.

NEW JERSEY
Submarket Inventory Vacancy Rate Avg Asking Rent (NNN) 18-mos ChangeNew Jersey 18,200,000 9.9% $23.50 11.9%
Lab Market Stats, Q2 2020
Significant Lease Deals
Tenant Submarket Sq. Ft. TypeCMIC-CMO Exit 8A - Cranbury 223,936 ExpansionPTC Therapeutics Princeton 176,000 RelocationCelularity Morris County 147,645 RelocationGenmab Princeton 88,000 RelocationCroda Princeton 61,696 RelocationCSPC Princeton 30,000 Expansion
Source: CBRE Research, Q2 2020.
20,00040,00060,00080,000
100,000120,000140,000
Boston-
Cambrid
ge
New Jer
sey
New York C
ity
Washing
ton, D.
C. - Ba
ltimore
San Fra
ncisco B
ay Are
a
Philad
elphia
Los An
geles
San Dieg
oChi
cago
Minneap
olis
(Employees)
0
Source: U.S. Bureau of Labor Statistics, CBRE Research, Q3 2020.
New Jersey continues to play a leading role in the life sciences industry’s ascent with the nation’s third-largest inventory of laboratory space. Local lab market fundamentals remain solid, as gene/cell therapy and other small-scale biomanufacturing operations are taking a foothold here.
OVERVIEW
The average asking rent for New Jersey lab space jumped 11.9% over the past 18 months, consistent with growth across the country. Vacancy remained generally stable and is expected to remain so over the next year with a relative lack of new construction.
RENTS & VACANCY
Conversions are underpinning supply of new lab and biomanufacturing space in New Jersey. With growing demand for gene/cell therapy and small-scale biomanufacturing, flex/industrial properties in the 60,000- to 120,000-sq.-ft. range are expected to be candidates for conversion over the next few years.
SUPPLY
Lab demand is active, especially in the 10,000- to 30,000-sq.-ft. range. The number of tenants seeking lab space increased since early 2019, but their total square footage requirements declined.
DEMAND
There are several new requirements, primarily from start-up and mid-size companies supported by government funding. Several Big Pharma requirements to accommodate rapid growth due to COVID-19 have also occurred, especially in testing and diagnostic areas.
COVID-19 EFFECT
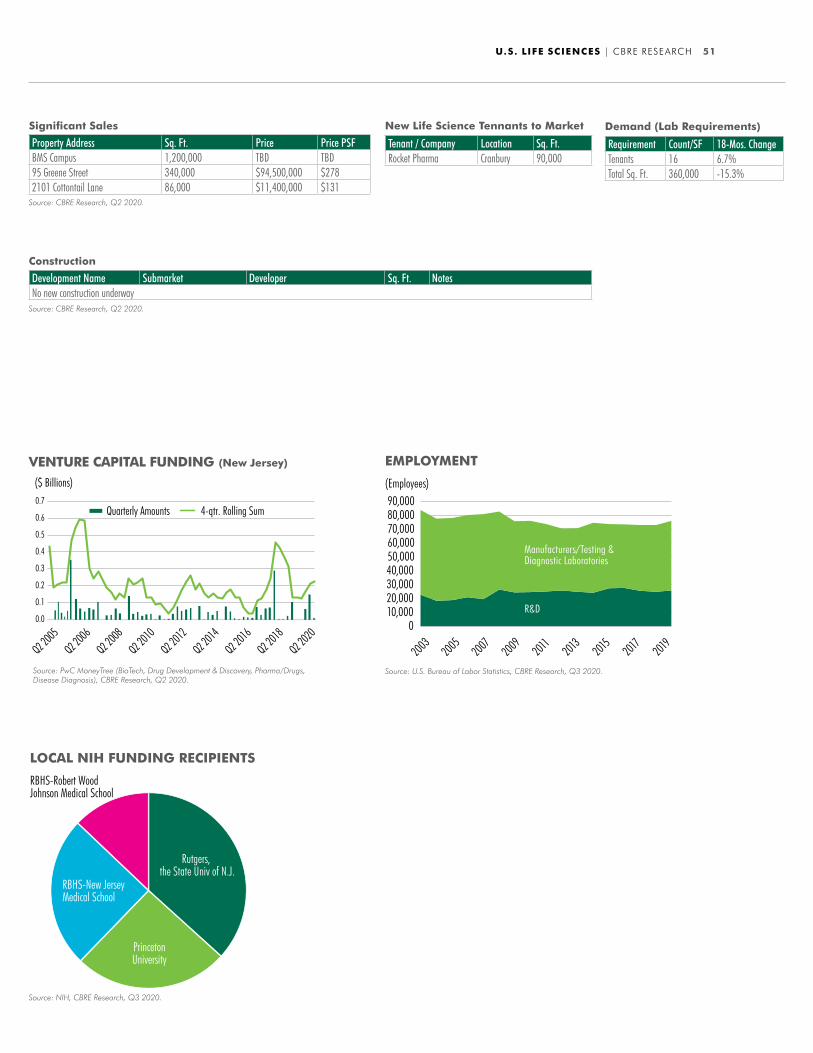
Life sciences employment climbed 4.0% between 2018 and 2019, near the 4.2% national average.
EMPLOYMENT
With fewer early-stage companies in New Jersey, life sciences venture capital funding in the state has been relatively low but stable, totaling some $224 million for the year ending Q2 2020.
VENTURE CAPITAL FUNDING
New Jersey ranked 32nd for NIH funding in fiscal year 2019, totaling $193 million.
NIH FUNDING
International companies remain active in New Jersey, particularly from China. Gene/cell therapy and oncology remain primary drivers of demand. Biotech is also active.
OTHER
Development Name Submarket Developer Sq. Ft. Notes95 Greene Street Hudson Waterfront Thor Equities 340,000 BTS170 Park Avenue, Florham Park Morris County Lone Star Funds 147,000 Biomanufacturing 2020 delivery2101 Cottontail Lane, Somerset Somerset County Owner - User - Legend Biotech 86,000 Biomanufacturing 2021 delivery
Source: CBRE Research, Q2 2020.
Conversions to Lab
QUICK STATS
TOTAL LIFE SCIENCES EMPLOYEES BY MARKET
U.S. LIFE SCIENCES | CBRE RESEARCH 51
Significant Sales
Property Address Sq. Ft. Price Price PSFBMS Campus 1,200,000 TBD TBD95 Greene Street 340,000 $94,500,000 $2782101 Cottontail Lane 86,000 $11,400,000 $131
Source: CBRE Research, Q2 2020.
Tenant / Company Location Sq. Ft.Rocket Pharma Cranbury 90,000
New Life Science Tennants to Market
Development Name Submarket Developer Sq. Ft. NotesNo new construction underway
Construction
LOCAL NIH FUNDING RECIPIENTS
Rutgers, the State Univ of N.J.
RBHS-New JerseyMedical School
RBHS-Robert Wood Johnson Medical School
PrincetonUniversity
Source: NIH, CBRE Research, Q3 2020.
0.0
0.1
0.2
0.3
0.4
0.5
0.6
0.7
Q2 2008
Q2 2006
Q2 2005
Q2 2010
Q2 2012
Q2 2014
Q2 2016
Q2 2018
Q2 2020
($ Billions)
Quarterly Amounts 4-qtr. Rolling Sum
Source: PwC MoneyTree (BioTech, Drug Development & Discovery, Pharma/Drugs, Disease Diagnosis), CBRE Research, Q2 2020.
EMPLOYMENT
010,00020,00030,00040,00050,00060,000
90,00080,00070,000
2003
2005
2007
2009
2011
2013
2015
2017
2019
R&D
Manufacturers/Testing & Diagnostic Laboratories
(Employees)
Source: U.S. Bureau of Labor Statistics, CBRE Research, Q3 2020.
Requirement Count/SF 18-Mos. ChangeTenants 16 6.7%Total Sq. Ft. 360,000 -15.3%
Demand (Lab Requirements)
Source: CBRE Research, Q2 2020.
VENTURE CAPITAL FUNDING (New Jersey)
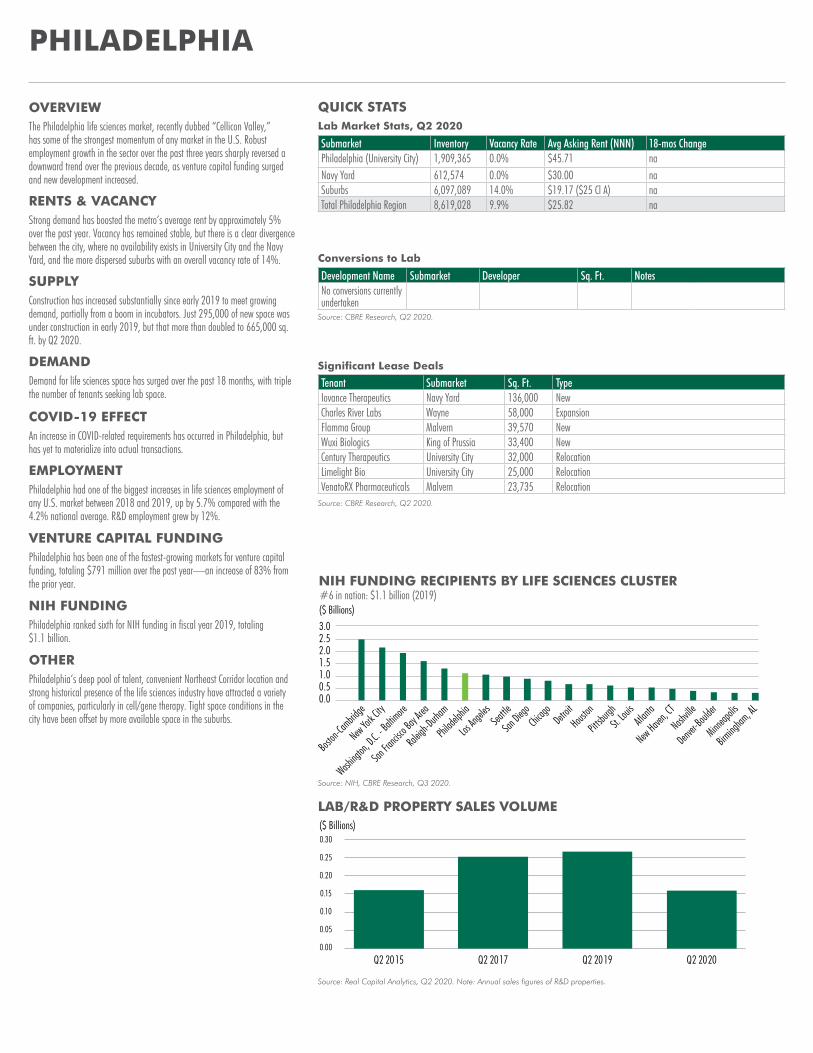
The Philadelphia life sciences market, recently dubbed “Cellicon Valley,” has some of the strongest momentum of any market in the U.S. Robust employment growth in the sector over the past three years sharply reversed a downward trend over the previous decade, as venture capital funding surged and new development increased.
Strong demand has boosted the metro’s average rent by approximately 5% over the past year. Vacancy has remained stable, but there is a clear divergence between the city, where no availability exists in University City and the Navy Yard, and the more dispersed suburbs with an overall vacancy rate of 14%.
PHILADELPHIA
Development Name Submarket Developer Sq. Ft. NotesNo conversions currently undertaken
Source: NIH, CBRE Research, Q3 2020.
0.00.51.01.52.02.53.0($ Billions)
Boston
-Cambrid
ge
New York C
ity
Washing
ton, D.
C. - Ba
ltimore
San Fra
ncisco B
ay Are
a
Raleig
h-Durh
am
Philad
elphia
Los An
geles
Seattle
San Die
goChi
cago
Detroit
Houston
Pittsbu
rghSt.
Louis
Atlanta
New Haven, C
T
Nashville
Denver-B
oulder
Minneap
olis
Birming
ham, AL
Source: Real Capital Analytics, Q2 2020. Note: Annual sales figures of R&D properties.
LAB/R&D PROPERTY SALES VOLUME
Q2 2015 Q2 2017 Q2 2019 Q2 2020
($ Billions)
0.00
0.05
0.10
0.15
0.20
0.25
0.30
Submarket Inventory Vacancy Rate Avg Asking Rent (NNN) 18-mos ChangePhiladelphia (University City) 1,909,365 0.0% $45.71 naNavy Yard 612,574 0.0% $30.00 naSuburbs 6,097,089 14.0% $19.17 ($25 Cl A) naTotal Philadelphia Region 8,619,028 9.9% $25.82 na
Lab Market Stats, Q2 2020
Conversions to Lab
Tenant Submarket Sq. Ft. TypeIovance Therapeutics Navy Yard 136,000 NewCharles River Labs Wayne 58,000 ExpansionFlamma Group Malvern 39,570 NewWuxi Biologics King of Prussia 33,400 NewCentury Therapeutics University City 32,000 RelocationLimelight Bio University City 25,000 RelocationVenatoRX Pharmaceuticals Malvern 23,735 Relocation
Source: CBRE Research, Q2 2020.
Significant Lease Deals
OVERVIEW
RENTS & VACANCY
Source: CBRE Research, Q2 2020.
Construction has increased substantially since early 2019 to meet growing demand, partially from a boom in incubators. Just 295,000 of new space was under construction in early 2019, but that more than doubled to 665,000 sq. ft. by Q2 2020.
SUPPLY
Demand for life sciences space has surged over the past 18 months, with triple the number of tenants seeking lab space.
An increase in COVID-related requirements has occurred in Philadelphia, but has yet to materialize into actual transactions.
DEMAND
COVID-19 EFFECT
Philadelphia had one of the biggest increases in life sciences employment of any U.S. market between 2018 and 2019, up by 5.7% compared with the 4.2% national average. R&D employment grew by 12%.
EMPLOYMENT
Philadelphia has been one of the fastest-growing markets for venture capital funding, totaling $791 million over the past year—an increase of 83% from the prior year.
Philadelphia ranked sixth for NIH funding in fiscal year 2019, totaling $1.1 billion.
Philadelphia’s deep pool of talent, convenient Northeast Corridor location and strong historical presence of the life sciences industry have attracted a variety of companies, particularly in cell/gene therapy. Tight space conditions in the city have been offset by more available space in the suburbs.
VENTURE CAPITAL FUNDING
NIH FUNDING
OTHER
QUICK STATS
NIH FUNDING RECIPIENTS BY LIFE SCIENCES CLUSTER#6 in nation: $1.1 billion (2019)

U.S. LIFE SCIENCES | CBRE RESEARCH 53
Tenant / Company Location Sq. Ft.Iovance Therapeutics Navy Yard 136,000Amicus University City 75,000Flamma Group Malvern 39,570Biohaven Pharmaceuticals Bucks County 21,000
LOCAL NIH FUNDING RECIPIENTS
VENTURE CAPITAL FUNDING (Philadelphia)
0.00.10.20.30.40.50.6
1.00.90.80.7
Q2 2008
Q2 2006
Q2 2005
Q2 2010
Q2 2012
Q2 2014
Q2 2016
Q2 2018
Q2 2020
($ Billions)
Quarterly Amounts 4-qtr. Rolling Sum
Source: PwC MoneyTree (BioTech, Drug Development & Discovery, Pharma/Drugs, Disease Diagnosis), CBRE Research, Q2 2020.
EMPLOYMENT
0
10,000
20,000
30,000
40,000
50,000
60,000
2003
2005
2007
2009
2011
2013
2015
2017
2019
R&D
Manufacturers/Testing & Diagnostic Laboratories
(Employees)
Source: U.S. Bureau of Labor Statistics, CBRE Research, Q3 2020.
Property Address Sq. Ft. Price Price PSF1050 Constitution Avenue 175,000 $61,200,000 $350300 Kimberton Road 67,274 $3,450,000 $51
Source: CBRE Research, Q2 2020.
Significant Sales New Life Science Tenants to Market
Development Name Submarket Developer Sq. Ft. NotesOne uCity Square Philadelphia (University City) Wexford 389,000 Spec 2022 deliveryIovance Biotherapeutics Navy Yard Gattuso Development Partners 136,000 BTS 2021 deliverySpring House Innovation Park Spring House MRA Group 75,000 Spec 2020 deliveryPennovation Center Expansion Philadelphia (University City) MRA Group & University of Penn 65,000 Spec 2020 deliveryPA Biotech Center Expansion Doylestown The Pennsylvania Biotechnology Center (PABC) 37,000 Spec 2021 delivery
Construction
Source: NIH, CBRE Research, Q3 2020.
University of Pennsylvania
Thomas Jefferson University
Temple Univ of the Commonwealth
Children's Hospof Philadelphia
OthersDrexel University
Requirement Count/SF 18-Mos. ChangeTenants 22 214.3%Total Sq. Ft. 603,000 169.2%
Demand (Lab Requirements)
Source: CBRE Research, Q2 2020.
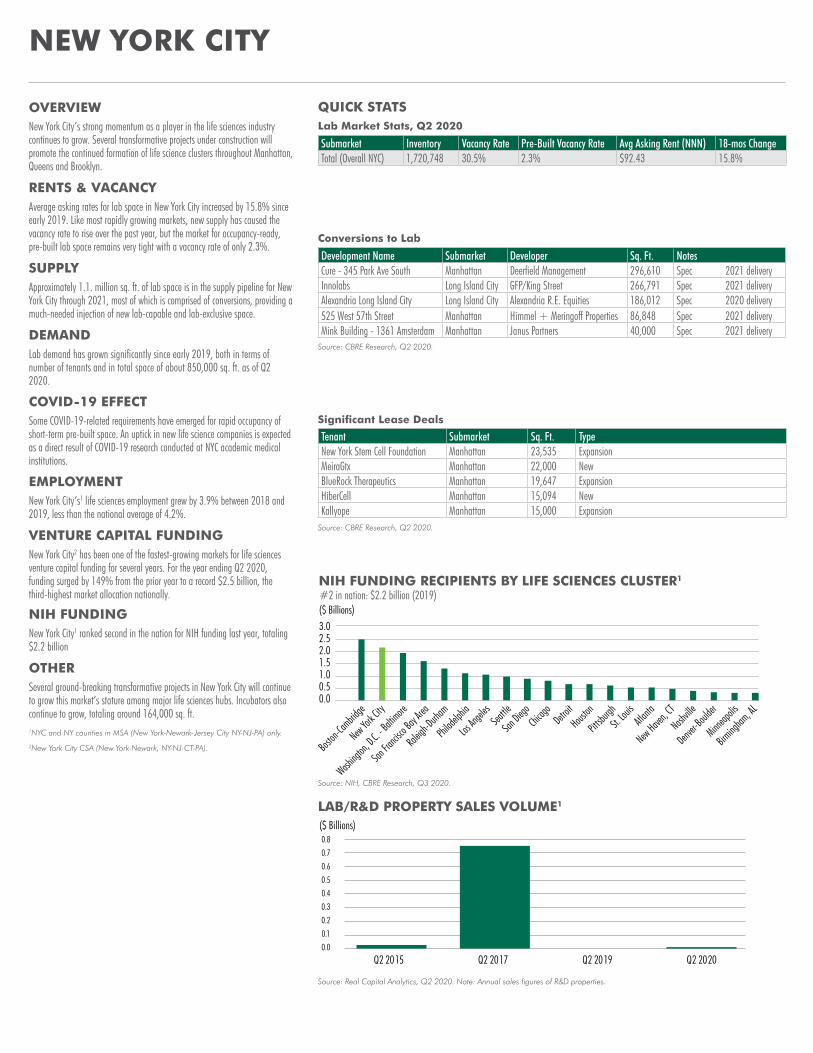
New York City’s strong momentum as a player in the life sciences industry continues to grow. Several transformative projects under construction will promote the continued formation of life science clusters throughout Manhattan, Queens and Brooklyn.
NEW YORK CITY
Development Name Submarket Developer Sq. Ft. NotesCure - 345 Park Ave South Manhattan Deerfield Management 296,610 Spec 2021 deliveryInnolabs Long Island City GFP/King Street 266,791 Spec 2021 deliveryAlexandria Long Island City Long Island City Alexandria R.E. Equities 186,012 Spec 2020 delivery525 West 57th Street Manhattan Himmel + Meringoff Properties 86,848 Spec 2021 deliveryMink Building - 1361 Amsterdam Manhattan Janus Partners 40,000 Spec 2021 delivery
Source: NIH, CBRE Research, Q3 2020.
0.00.51.01.52.02.53.0($ Billions)
Boston
-Cambrid
ge
New York C
ity
Washing
ton, D.
C. - Ba
ltimore
San Fra
ncisco B
ay Are
a
Raleig
h-Durh
am
Philad
elphia
Los An
geles
Seattle
San Die
goChi
cago
Detroit
Houston
Pittsbu
rghSt.
Louis
Atlanta
New Haven, C
T
Nashville
Denver-B
oulder
Minneap
olis
Birming
ham, AL
Source: Real Capital Analytics, Q2 2020. Note: Annual sales figures of R&D properties.
LAB/R&D PROPERTY SALES VOLUME1
Q2 2015 Q2 2017 Q2 2019 Q2 2020
($ Billions)
0.0
0.1
0.2
0.3
0.4
0.6
0.5
0.8
0.7
Submarket Inventory Vacancy Rate Pre-Built Vacancy Rate Avg Asking Rent (NNN) 18-mos ChangeTotal (Overall NYC) 1,720,748 30.5% 2.3% $92.43 15.8%
Lab Market Stats, Q2 2020
Conversions to Lab
Tenant Submarket Sq. Ft. TypeNew York Stem Cell Foundation Manhattan 23,535 ExpansionMeiraGtx Manhattan 22,000 New BlueRock Therapeutics Manhattan 19,647 ExpansionHiberCell Manhattan 15,094 New Kallyope Manhattan 15,000 Expansion
Source: CBRE Research, Q2 2020.
Significant Lease Deals
OVERVIEW
Average asking rates for lab space in New York City increased by 15.8% since early 2019. Like most rapidly growing markets, new supply has caused the vacancy rate to rise over the past year, but the market for occupancy-ready, pre-built lab space remains very tight with a vacancy rate of only 2.3%.
RENTS & VACANCY
Source: CBRE Research, Q2 2020.
Approximately 1.1. million sq. ft. of lab space is in the supply pipeline for New York City through 2021, most of which is comprised of conversions, providing a much-needed injection of new lab-capable and lab-exclusive space.
SUPPLY
Lab demand has grown significantly since early 2019, both in terms of number of tenants and in total space of about 850,000 sq. ft. as of Q2 2020.
DEMAND
Some COVID-19-related requirements have emerged for rapid occupancy of short-term pre-built space. An uptick in new life science companies is expected as a direct result of COVID-19 research conducted at NYC academic medical institutions.
COVID-19 EFFECT
New York City’s1 life sciences employment grew by 3.9% between 2018 and 2019, less than the national average of 4.2%.
EMPLOYMENT
New York City2 has been one of the fastest-growing markets for life sciences venture capital funding for several years. For the year ending Q2 2020, funding surged by 149% from the prior year to a record $2.5 billion, the third-highest market allocation nationally.
VENTURE CAPITAL FUNDING
New York City1 ranked second in the nation for NIH funding last year, totaling $2.2 billion
NIH FUNDING
Several ground-breaking transformative projects in New York City will continue to grow this market’s stature among major life sciences hubs. Incubators also continue to grow, totaling around 164,000 sq. ft.
OTHER
1NYC and NY counties in MSA (New York-Newark-Jersey City NY-NJ-PA) only.
2New York City CSA (New York-Newark, NY-NJ-CT-PA).
QUICK STATS
NIH FUNDING RECIPIENTS BY LIFE SCIENCES CLUSTER1
#2 in nation: $2.2 billion (2019)
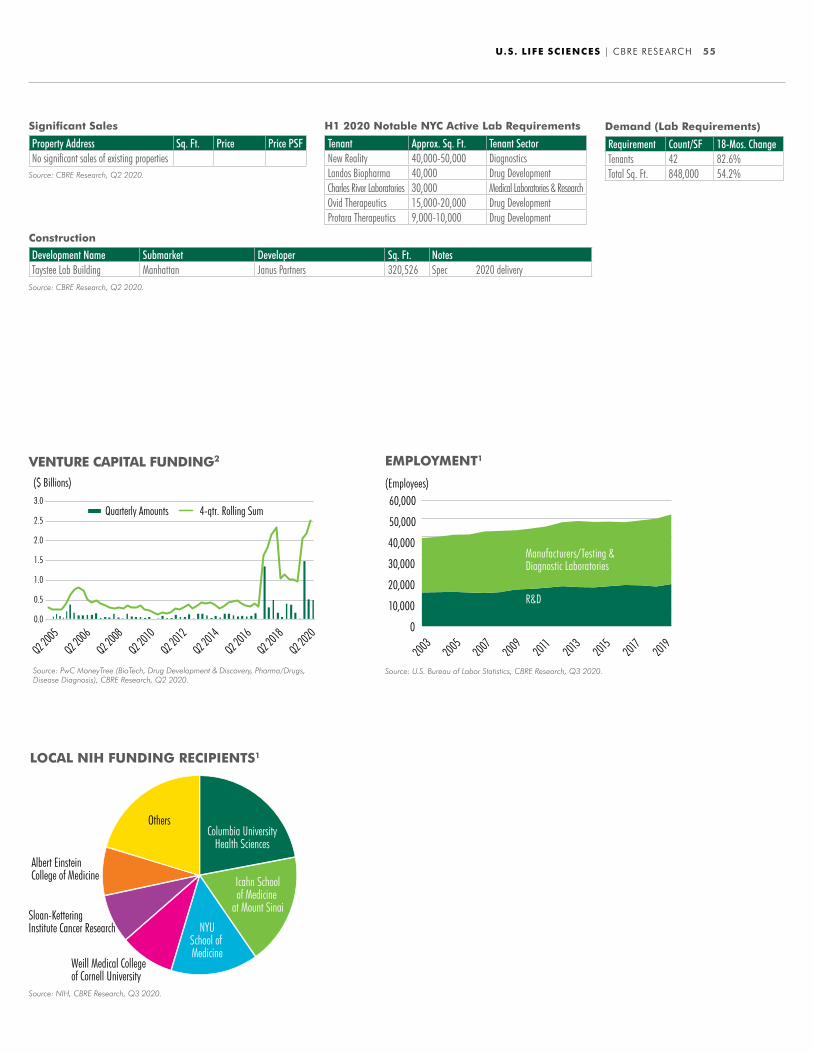
U.S. LIFE SCIENCES | CBRE RESEARCH 55
Tenant Approx. Sq. Ft. Tenant SectorNew Reality 40,000-50,000 DiagnosticsLandos Biopharma 40,000 Drug DevelopmentCharles River Laboratories 30,000 Medical Laboratories & ResearchOvid Therapeutics 15,000-20,000 Drug DevelopmentProtara Therapeutics 9,000-10,000 Drug Development
LOCAL NIH FUNDING RECIPIENTS1
VENTURE CAPITAL FUNDING2
0.0
0.5
1.0
3.0
2.5
2.0
1.5
Q2 2008
Q2 2006
Q2 2005
Q2 2010
Q2 2012
Q2 2014
Q2 2016
Q2 2018
Q2 2020
($ Billions)
Quarterly Amounts 4-qtr. Rolling Sum
Source: PwC MoneyTree (BioTech, Drug Development & Discovery, Pharma/Drugs, Disease Diagnosis), CBRE Research, Q2 2020.
EMPLOYMENT1
0
10,000
20,000
30,000
40,000
50,000
60,000
2003
2005
2007
2009
2011
2013
2015
2017
2019
R&D
Manufacturers/Testing & Diagnostic Laboratories
(Employees)
Source: U.S. Bureau of Labor Statistics, CBRE Research, Q3 2020.
Property Address Sq. Ft. Price Price PSFNo significant sales of existing properties
Significant Sales H1 2020 Notable NYC Active Lab Requirements
Development Name Submarket Developer Sq. Ft. NotesTaystee Lab Building Manhattan Janus Partners 320,526 Spec 2020 delivery
Construction
Source: NIH, CBRE Research, Q3 2020.
Columbia University Health Sciences
Icahn Schoolof Medicine
at Mount Sinai
Albert Einstein College of Medicine
Sloan-Kettering Institute Cancer Research NYU
School of Medicine
Weill Medical College of Cornell University
Others
Source: CBRE Research, Q2 2020.
Requirement Count/SF 18-Mos. ChangeTenants 42 82.6%Total Sq. Ft. 848,000 54.2%
Demand (Lab Requirements)
Source: CBRE Research, Q2 2020.

Amid a challenging first half of the year, the Puget Sound life science real estate market demonstrated resiliency with continued transaction activity, lower vacancy and increased investor interest.
SEATTLE
Development Name Submarket Developer Sq. Ft. Notes1st & Eagle Waterfront Elliott Bay 86,000 Spec 2020 delivery; 75% pre-leased
Source: NIH, CBRE Research, Q3 2020.
0.00.51.01.52.02.53.0($ Billions)
Boston
-Cambrid
ge
New York C
ity
Washing
ton, D.
C. - Ba
ltimore
San Fra
ncisco B
ay Are
a
Raleig
h-Durh
am
Philad
elphia
Los An
geles
Seattle
San Die
goChi
cago
Detroit
Houston
Pittsbu
rghSt.
Louis
Atlanta
New Haven, C
T
Nashville
Denver-B
oulder
Minneap
olis
Birming
ham, AL
Source: Real Capital Analytics, Q2 2020. Note: Annual sales figures of R&D properties.
LAB/R&D PROPERTY SALES VOLUME
Q2 2015 Q2 2017 Q2 2019 Q2 2020
($ Billions)
0.000.050.100.150.20
0.300.25
0.45
0.350.40
Lab Market Stats, Q2 2020
Conversions to Lab
Tenant Submarket Sq. Ft. TypeAdaptive Biotechnologies South Lake Union 100,000 ExpansionLyell Immunopharma Bothell 72,518 ExpansionJuno Therapeutics-Celegene South Lake Union 34,104 ExpansionNeoleukin Therapeutics South Lake Union 33,300 RelocationAlpine Immune Sciences South Lake Union 27,164 Relocation
Source: CBRE Research, Q2 2020.
Significant Lease Deals
OVERVIEW
Rents have surged in Seattle over the past 18 months as the region has one of the tightest markets for lab space in the country with a regional vacancy rate of 2.2%. With persistent demand, the lab market is expected to even tighten further in 2020, which should push rents higher.
RENTS & VACANCY
Source: CBRE Research, Q2 2020.
Several key projects are under construction to meet strong demand and roughly 2.4 million sq. ft. of lab capable development is in the pipeline for delivery over the next four years, which will elevate Seattle’s stature as a life sciences hub.
SUPPLY
Tenant requirements for lab space totaled approximately 350,000 sq. ft. as of Q2 2020. The 194,000-sq.-ft. Atrium development and the 100,000-sq.-ft. eleven65 project, both built speculatively by Alexandria Real Estate, were fully preleased, bringing the current Seattle Class A vacancy rate to less than 1%.
DEMAND
While various new requirements for lab space related to COVID-19 have emerged both from inside and outside the market, some of this has been offset by hesitancy on the part of other early-stage existing tenants to expand during the current economic downturn.
COVID-19 EFFECT
Seattle has been one of the fastest-growing markets for life sciences employment over the past five years, but above-average growth slightly moderated in 2019 to match the national average of 4.2%.
EMPLOYMENT
Seattle received its largest quarterly amount of life sciences venture capital funding in Q2 ($613.5 million), raising its rolling four-quarter total to a record $826 million.
VENTURE CAPITAL FUNDING
As a major research hub, Seattle ranked eighth in the nation for NIH funding in 2019.
NIH FUNDING
Seattle has become a hub of life sciences innovation, with a unique convergence of world-class scientific research and premier technology talent. This synergy offers the opportunity to capture top talent at the forefront of the life science and technology industries in one place. The nexus of this rich ecosystem lies in the heart of Seattle’s South Lake Union submarket.
OTHER
Submarket Inventory Vacancy Rate Avg Asking Rent (NNN) 18-mos ChangeSouth Lake Union/Seattle 5,649,646 0.6% $60.00 9.0%Bothell 2,447,695 6.2% $23.39 naTotal 8,539,050 2.2% $26.13 26.9%
QUICK STATS
NIH FUNDING RECIPIENTS BY LIFE SCIENCES CLUSTER#8 in nation: $1.0 billion (2019)

U.S. LIFE SCIENCES | CBRE RESEARCH 57
Tenant / Company Location Sq. Ft. BMS Multiple 250,000+ Roche 2211 Elliott Ave 12,000
LOCAL NIH FUNDING RECIPIENTS
VENTURE CAPITAL FUNDING (Seattle CSA)
0.00.10.2
0.9
0.70.8
0.6
0.40.5
0.3
Q2 2008
Q2 2006
Q2 2005
Q2 2010
Q2 2012
Q2 2014
Q2 2016
Q2 2018
Q2 2020
($ Billions)
Quarterly Amounts 4-qtr. Rolling Sum
Source: PwC MoneyTree (BioTech, Drug Development & Discovery, Pharma/Drugs, Disease Diagnosis), CBRE Research, Q2 2020.
EMPLOYMENT
0
5,000
10,000
15,000
25,000
20,000
2003
2005
2007
2009
2011
2013
2015
2017
2019
R&D
Manufacturers/Testing & Diagnostic Laboratories
(Employees)
Source: U.S. Bureau of Labor Statistics, CBRE Research, Q3 2020.
Property Address Sq. Ft. Price Price PSFCanyon Park East Portfolio 270,000 $54.6 million $2031st & Eagle 86,000 $50.7 million $590
Source: CBRE Research, Q2 2020.
Significant Sales New Life Science Tenants to Market
Development Name Submarket Developer Sq. Ft. Notes400 Westlake South Lake Union Martin Selig Real Estate 200,000 Planned 2021 deliveryDexter Yard South Lake Union BioMed Realty 130,000 (500,000 SF total) Spec 2021 deliveryeleven65 South Lake Union Alexandria 100,000 Spec 2020 delivery; 100% pre-leased
Construction
Source: NIH, CBRE Research, Q3 2020.
University of Washington
Fred Hutchinson Cancer Research
Center
Seattle Children's Hospital Others
Requirement Count/SF 18-Mos. ChangeTenants 18 NATotal Sq. Ft. 350,000 NA
Demand (Lab Requirements)
Source: CBRE Research, Q2 2020.

The L.A. life sciences market saw a surge in venture capital investment over the past year, along with the opening of new incubators and growing supply and demand for laboratory space.
LOS ANGELES
Source: NIH, CBRE Research, Q3 2020.
0.00.51.01.52.02.53.0($ Billions)
Boston
-Cambrid
ge
New York C
ity
Washing
ton, D.
C. - Ba
ltimore
San Fra
ncisco B
ay Are
a
Raleig
h-Durh
am
Philad
elphia
Los An
geles
Seattle
San Die
goChi
cago
Detroit
Houston
Pittsbu
rghSt.
Louis
Atlanta
New Haven, C
T
Nashville
Denver-B
oulder
Minneap
olis
Birming
ham, AL
Source: Real Capital Analytics, Q2 20120. Note: Annual sales figures of R&D properties.
LAB/R&D PROPERTY SALES VOLUME
Q2 2015 Q2 2017 Q2 2019 Q2 2020
($ Billions)
0.000.050.100.150.20
0.300.25
0.500.45
0.350.40
Lab Market Stats, Q2 2020
Tenant Submarket Sq. Ft. TypeKite Pharma Santa Monica 88,000 ExpansionArmata Pharmaceuticals Marina Del Rey 35,453 RenewalKite Pharma El Segundo 25,861 ExpansionCoherus Biosciences Camarillo 25,000 New leaseArrowhead Pharmaceuticals Pasadena 24,448 Expansion
Source: CBRE Research, Q2 2020.
Significant Lease Deals
OVERVIEW
A relatively low vacancy of 6.7%, coupled with the expansion of several large life sciences occupiers, should keep the market for L.A. lab space tight and lead to increased rents over the next year.
RENTS & VACANCY
Development Name Submarket Developer Sq. Ft. NotesHATCHspaces Thousand Oaks HATCHspaces 120,000 Spec 2021 delivery6100-6160 Bristol Parkway Culver City Alexandria Real Estate Equities 75,941 Spec 2020 deliveryHATCHspaces Thousand Oaks HATCHspaces 50,000 Spec 2021 delivery1280 Rancho Conejo Boulevard Thousand Oaks Alexandria Real Estate Equities 33,652 Spec 2020 delivery1535 Rancho Conejo Boulevard Thousand Oaks HATCHspaces 29,197 Spec 2020 deliveryHATCHspaces Westwood HATCHspaces 11,000 Spec 2020 delivery
Conversions to Lab
Source: CBRE Research, Q2 2020.
L.A. has a relative dearth new construction: Of all major lab markets, L.A. has the least amount of lab supply as a percentage of total inventory. Alexandria Real Estate Equities and HATCHspaces plan to deliver approximately 200,000 sq. ft. of lab space to the market over the next 12 months. Additionally, many landlords are considering converting office space to lab space or acquiring new buildings for conversion to life science uses.
SUPPLY
The amount of space sought by lab tenants has increased considerably over the past year. There currently are more than 400,000 sq. ft. of life science tenant requirements in the market.
DEMAND
While leasing across most industries has significantly slowed due to COVID-19, life science tenant demand in Los Angeles has not been negatively impacted. In some instances, life science tenant requirements have grown. For example, a cancer therapy company solely focused on the L.A. market due to its talent base started 2020 with a need for 20,000 sq. ft. of lab and office space. Since then, its space needs have grown to 150,000 sq. ft.
COVID-19 EFFECT
L.A. life sciences employment growth was sluggish in 2019 declining by 1.3% from 2018.
EMPLOYMENT
Venture capital funding to the Los Angeles and Orange County markets reached a new record of $379 million for the year ending Q2 2020.
VENTURE CAPITAL FUNDING
L.A.’s world-class hospitals and research institutions continue to attract one the nation’s largest totals of NIH funding. L.A. ranked seventh in the nation for NIH funding in 2019, with $1.1 billion.
NIH FUNDING
Cell/gene therapy and oncology are the main sources of life sciences demand growth in L.A. Several incubators opened over the past year contributing to increased demand from growing occupiers. Venture capital continues to increase locally and landlords are eager to find life science investment opportunities.
OTHER
Submarket Inventory Vacancy Rate Avg Asking Rent (NNN) 18-mos ChangeLos Angeles 8,335,629 6.7% $40.00 na
QUICK STATS
NIH FUNDING RECIPIENTS BY LIFE SCIENCES CLUSTER#7 in nation: $1.1 billion (2019)
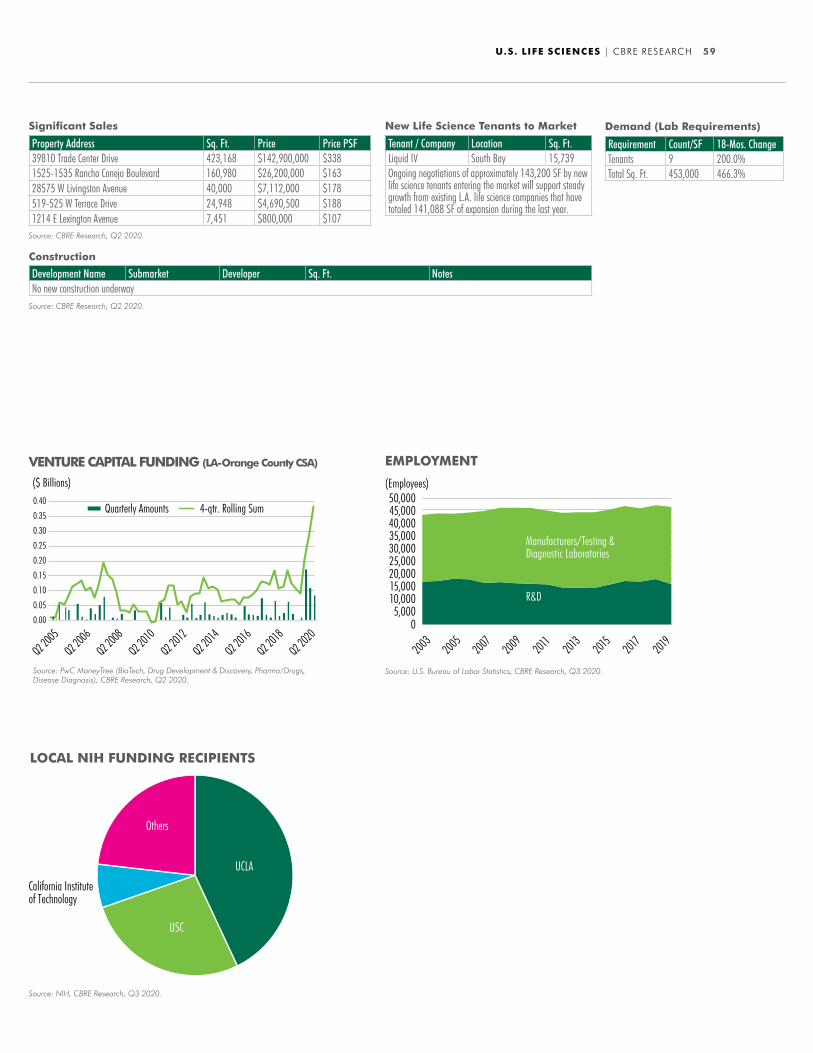
U.S. LIFE SCIENCES | CBRE RESEARCH 59
Tenant / Company Location Sq. Ft.Liquid IV South Bay 15,739Ongoing negotiations of approximately 143,200 SF by new life science tenants entering the market will support steady growth from existing L.A. life science companies that have totaled 141,088 SF of expansion during the last year.
LOCAL NIH FUNDING RECIPIENTS
VENTURE CAPITAL FUNDING (LA-Orange County CSA)
0.00
0.05
0.40
0.30
0.35
0.25
0.15
0.20
0.10
Q2 2008
Q2 2006
Q2 2005
Q2 2010
Q2 2012
Q2 2014
Q2 2016
Q2 2018
Q2 2020
($ Billions)
Quarterly Amounts 4-qtr. Rolling Sum
Source: PwC MoneyTree (BioTech, Drug Development & Discovery, Pharma/Drugs, Disease Diagnosis), CBRE Research, Q2 2020.
EMPLOYMENT
05,000
10,00015,000
50,00045,00040,00035,00030,00025,00020,000
2003
2005
2007
2009
2011
2013
2015
2017
2019
R&D
Manufacturers/Testing & Diagnostic Laboratories
(Employees)
Source: U.S. Bureau of Labor Statistics, CBRE Research, Q3 2020.
Property Address Sq. Ft. Price Price PSF39810 Trade Center Drive 423,168 $142,900,000 $3381525-1535 Rancho Conejo Boulevard 160,980 $26,200,000 $16328575 W Livingston Avenue 40,000 $7,112,000 $178519-525 W Terrace Drive 24,948 $4,690,500 $1881214 E Lexington Avenue 7,451 $800,000 $107
Source: CBRE Research, Q2 2020.
Significant Sales New Life Science Tenants to Market
Development Name Submarket Developer Sq. Ft. NotesNo new construction underway
Construction
Source: NIH, CBRE Research, Q3 2020.
UCLA
USC
California Institute of Technology
Others
Requirement Count/SF 18-Mos. ChangeTenants 9 200.0%Total Sq. Ft. 453,000 466.3%
Demand (Lab Requirements)
Source: CBRE Research, Q2 2020.
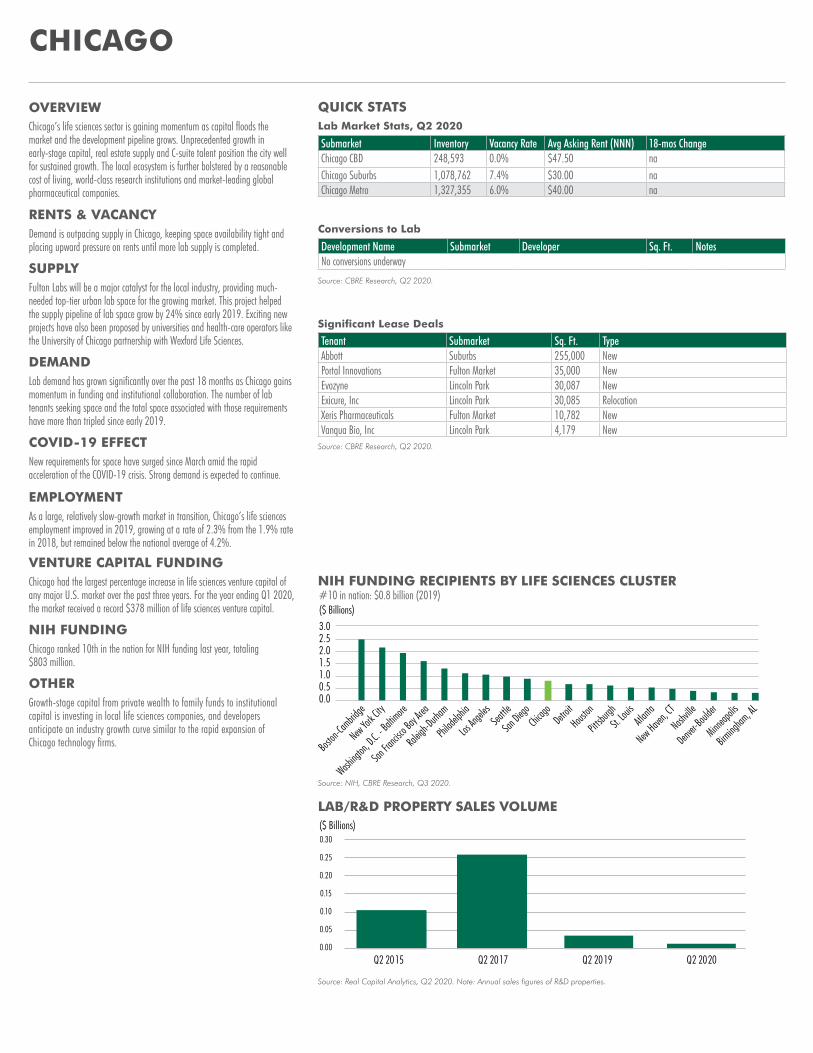
Chicago’s life sciences sector is gaining momentum as capital floods the market and the development pipeline grows. Unprecedented growth in early-stage capital, real estate supply and C-suite talent position the city well for sustained growth. The local ecosystem is further bolstered by a reasonable cost of living, world-class research institutions and market-leading global pharmaceutical companies.
CHICAGO
Source: NIH, CBRE Research, Q3 2020.
0.00.51.01.52.02.53.0($ Billions)
Boston
-Cambrid
ge
New York C
ity
Washing
ton, D.
C. - Ba
ltimore
San Fra
ncisco B
ay Are
a
Raleig
h-Durh
am
Philad
elphia
Los An
geles
Seattle
San Die
goChi
cago
Detroit
Houston
Pittsbu
rghSt.
Louis
Atlanta
New Haven, C
T
Nashville
Denver-B
oulder
Minneap
olis
Birming
ham, AL
Source: Real Capital Analytics, Q2 2020. Note: Annual sales figures of R&D properties.
LAB/R&D PROPERTY SALES VOLUME
Q2 2015 Q2 2017 Q2 2019 Q2 2020
($ Billions)
0.00
0.05
0.10
0.15
0.20
0.25
0.30
Lab Market Stats, Q2 2020
Tenant Submarket Sq. Ft. TypeAbbott Suburbs 255,000 NewPortal Innovations Fulton Market 35,000 NewEvozyne Lincoln Park 30,087 NewExicure, Inc Lincoln Park 30,085 RelocationXeris Pharmaceuticals Fulton Market 10,782 NewVanqua Bio, Inc Lincoln Park 4,179 New
Source: CBRE Research, Q2 2020.
Significant Lease Deals
OVERVIEW
Development Name Submarket Developer Sq. Ft. NotesNo conversions underway
Conversions to Lab
Source: CBRE Research, Q2 2020.
Demand is outpacing supply in Chicago, keeping space availability tight and placing upward pressure on rents until more lab supply is completed.
RENTS & VACANCY
Fulton Labs will be a major catalyst for the local industry, providing much-needed top-tier urban lab space for the growing market. This project helped the supply pipeline of lab space grow by 24% since early 2019. Exciting new projects have also been proposed by universities and health-care operators like the University of Chicago partnership with Wexford Life Sciences.
SUPPLY
Lab demand has grown significantly over the past 18 months as Chicago gains momentum in funding and institutional collaboration. The number of lab tenants seeking space and the total space associated with those requirements have more than tripled since early 2019.
DEMAND
New requirements for space have surged since March amid the rapid acceleration of the COVID-19 crisis. Strong demand is expected to continue.
COVID-19 EFFECT
As a large, relatively slow-growth market in transition, Chicago’s life sciences employment improved in 2019, growing at a rate of 2.3% from the 1.9% rate in 2018, but remained below the national average of 4.2%.
EMPLOYMENT
Chicago had the largest percentage increase in life sciences venture capital of any major U.S. market over the past three years. For the year ending Q1 2020, the market received a record $378 million of life sciences venture capital.
VENTURE CAPITAL FUNDING
Chicago ranked 10th in the nation for NIH funding last year, totaling $803 million.
NIH FUNDING
Growth-stage capital from private wealth to family funds to institutional capital is investing in local life sciences companies, and developers anticipate an industry growth curve similar to the rapid expansion of Chicago technology firms.
OTHER
Submarket Inventory Vacancy Rate Avg Asking Rent (NNN) 18-mos ChangeChicago CBD 248,593 0.0% $47.50 naChicago Suburbs 1,078,762 7.4% $30.00 naChicago Metro 1,327,355 6.0% $40.00 na
QUICK STATS
NIH FUNDING RECIPIENTS BY LIFE SCIENCES CLUSTER#10 in nation: $0.8 billion (2019)

U.S. LIFE SCIENCES | CBRE RESEARCH 61
Tenant / Company Location Sq. Ft.Cour Pharma Skokie 5,804
VENTURE CAPITAL FUNDING (Chicago MSA)
0.00
0.05
0.40
0.30
0.35
0.25
0.15
0.20
0.10
Q2 2008
Q2 2006
Q2 2005
Q2 2010
Q2 2012
Q2 2014
Q2 2016
Q2 2018
Q2 2020
($ Billions)
Quarterly Amounts 4-qtr. Rolling Sum
Source: PwC MoneyTree (BioTech, Drug Development & Discovery, Pharma/Drugs, Disease Diagnosis), CBRE Research, Q2 2020.
EMPLOYMENT
010,000
70,00060,00050,00040,00030,00020,000
2003
2005
2007
2009
2011
2013
2015
2017
2019
R&D
Manufacturers/Testing & Diagnostic Laboratories
(Employees)
Source: U.S. Bureau of Labor Statistics, CBRE Research, Q3 2020.
Property Address Sq. Ft. Price Price PSF1 Horizon Parkway 660,000 $115,000,000 $174
Source: CBRE Research, Q2 2020.
Source: CBRE Research, Q2 2020.
Significant Sales New Life Science Tenants to Market
Source: NIH, CBRE Research, Q3 2020.
Development Name Submarket Developer Sq. Ft. NotesFulton Labs City Trammell Crow 423,454 Spec; 2021 DeliveryG1 (Lincoln Yards) City Sterling Bay 320,000 Spec; 2023 DeliveryWest End on Fulton City Trammell Crow 300,224 Spec; 2020 Delivery8030 Lamon Avenue Suburbs American Landmark 130,000 Spec; 2020 DeliveryRosalind Franklin Innovation & Research Park Suburbs Rosalind Franklin University 100,000 BTS; 2020 Delivery
Construction
LOCAL NIH FUNDING RECIPIENTS
Northwestern University at Chicago
University of Chicago
University of Illinois at Chicago
Others
Requirement Count/SF 18-Mos. ChangeTenants 18 260.0%Total Sq. Ft. 658,000 276.0%
Demand (Lab Requirements)
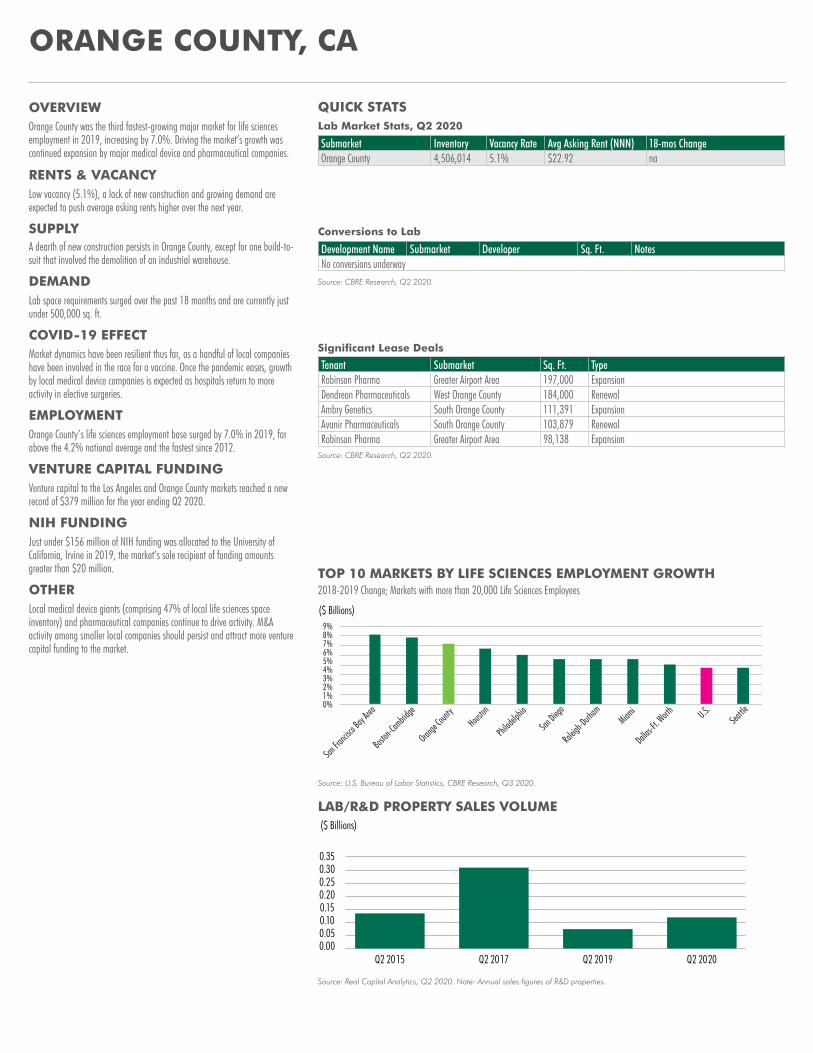
Just under $156 million of NIH funding was allocated to the University of California, Irvine in 2019, the market’s sole recipient of funding amounts greater than $20 million.
Local medical device giants (comprising 47% of local life sciences space inventory) and pharmaceutical companies continue to drive activity. M&A activity among smaller local companies should persist and attract more venture capital funding to the market.
ORANGE COUNTY, CA
Source: Real Capital Analytics, Q2 2020. Note: Annual sales figures of R&D properties.
LAB/R&D PROPERTY SALES VOLUME
0.00
0.100.05
0.150.200.250.300.35
Q2 2015 Q2 2017 Q2 2019 Q2 2020
($ Billions)
Submarket Inventory Vacancy Rate Avg Asking Rent (NNN) 18-mos ChangeOrange County 4,506,014 5.1% $22.92 na
Lab Market Stats, Q2 2020
Tenant Submarket Sq. Ft. TypeRobinson Pharma Greater Airport Area 197,000 ExpansionDendreon Pharmaceuticals West Orange County 184,000 RenewalAmbry Genetics South Orange County 111,391 ExpansionAvanir Pharmaceuticals South Orange County 103,879 RenewalRobinson Pharma Greater Airport Area 98,138 Expansion
Source: CBRE Research, Q2 2020.
Significant Lease Deals
Orange County was the third fastest-growing major market for life sciences employment in 2019, increasing by 7.0%. Driving the market’s growth was continued expansion by major medical device and pharmaceutical companies.
OVERVIEW
Low vacancy (5.1%), a lack of new construction and growing demand are expected to push average asking rents higher over the next year.
RENTS & VACANCY
A dearth of new construction persists in Orange County, except for one build-to-suit that involved the demolition of an industrial warehouse.
SUPPLY
Lab space requirements surged over the past 18 months and are currently just under 500,000 sq. ft.
DEMAND
Market dynamics have been resilient thus far, as a handful of local companies have been involved in the race for a vaccine. Once the pandemic eases, growth by local medical device companies is expected as hospitals return to more activity in elective surgeries.
COVID-19 EFFECT
Orange County’s life sciences employment base surged by 7.0% in 2019, far above the 4.2% national average and the fastest since 2012.
EMPLOYMENT
Venture capital to the Los Angeles and Orange County markets reached a new record of $379 million for the year ending Q2 2020.
VENTURE CAPITAL FUNDING
NIH FUNDING
OTHER 2018-2019 Change; Markets with more than 20,000 Life Sciences EmployeesTOP 10 MARKETS BY LIFE SCIENCES EMPLOYMENT GROWTH
1%2%3%4%5%6%
9%
7%8%
($ Billions)
0%
Boston-
Cambrid
ge
Orange
County
Raleig
h-Durh
am
San Fra
ncisco B
ay Are
aMiam
iSea
ttle U.S.
Dallas-F
t. Worth
Philad
elphia
Houston
San Dieg
o
Source: U.S. Bureau of Labor Statistics, CBRE Research, Q3 2020.
Development Name Submarket Developer Sq. Ft. NotesNo conversions underway
Source: CBRE Research, Q2 2020.
Conversions to Lab
QUICK STATS

U.S. LIFE SCIENCES | CBRE RESEARCH 63
Tenant / Company Location Sq. Ft.J&J South Orange County 100,000Inari Medical South Orange County 90,000Neogenomics South Orange County 50,000Event Medical South Orange County 50,000
LOCAL NIH FUNDING RECIPIENTS
U.C. Irvine
EMPLOYMENT
0
10,0005,000
15,00020,00025,00030,00035,00040,000
2003
2005
2007
2009
2011
2013
2015
2017
2019
R&D
Manufacturers/Testing & Diagnostic Laboratories
(Employees)
Source: U.S. Bureau of Labor Statistics, CBRE Research, Q3 2020.
Property Address Sq. Ft. Price Price PSF20200 Windrow Drive 125,442 29,000,000 $2312206 Alton Parkway 30,600 7,904,000 $258
Source: CBRE Research, Q2 2020.
Significant Sales New Life Science Tenants to Market
Development Name Submarket Developer Sq. Ft. NotesEdward's Lifesciences Airport Area Edward's Lifesciences 239,000 BTS 2020 delivery; 100% pre-leased
Construction
Source: NIH, CBRE Research, Q3 2020.
VENTURE CAPITAL FUNDING (LA-Orange County CSA)
0.00
0.05
0.40
0.30
0.35
0.25
0.15
0.20
0.10
Q2 2008
Q2 2006
Q2 2005
Q2 2010
Q2 2012
Q2 2014
Q2 2016
Q2 2018
Q2 2020
($ Billions)
Quarterly Amounts 4-qtr. Rolling Sum
Source: PwC MoneyTree (BioTech, Drug Development & Discovery, Pharma/Drugs, Disease Diagnosis), CBRE Research, Q2 2020.
Requirement Count/SF 18-Mos. ChangeTenants 17 112.5%Total Sq. Ft. 485,000 26.6%
Demand (Lab Requirements)
Source: CBRE Research, Q2 2020.
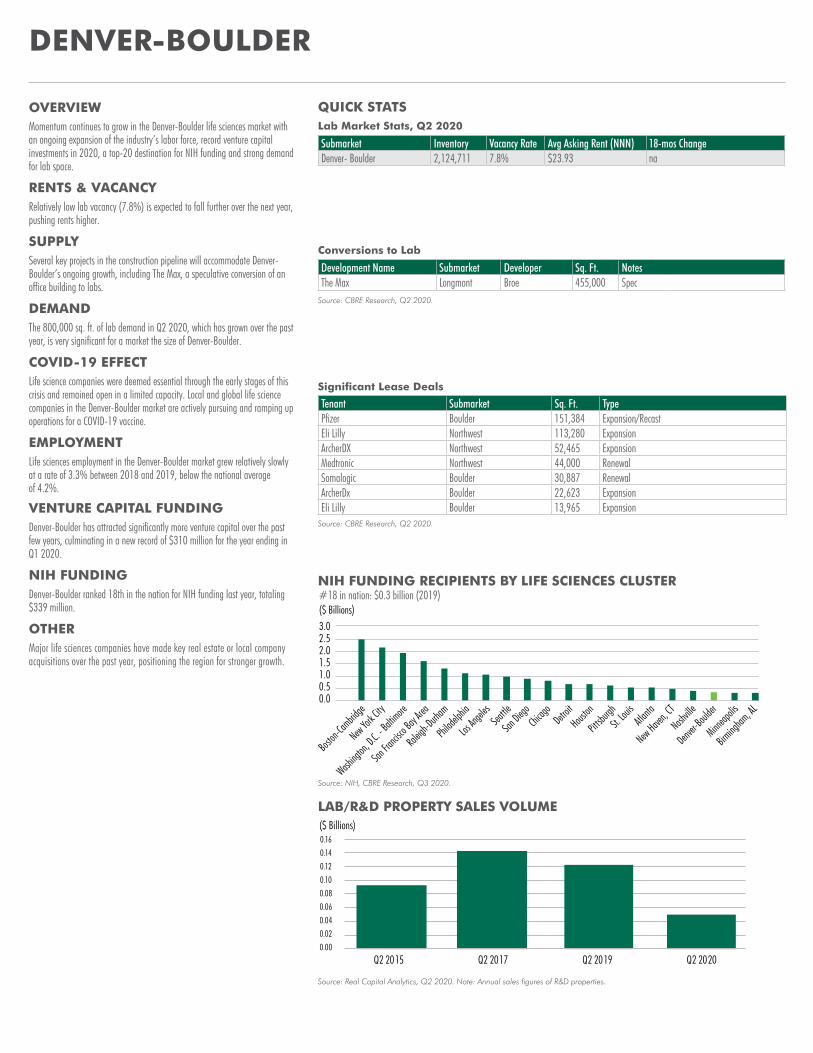
Momentum continues to grow in the Denver-Boulder life sciences market with an ongoing expansion of the industry’s labor force, record venture capital investments in 2020, a top-20 destination for NIH funding and strong demand for lab space.
DENVER-BOULDER
Source: NIH, CBRE Research, Q3 2020.
0.00.51.01.52.02.53.0($ Billions)
Boston
-Cambrid
ge
New York C
ity
Washing
ton, D.
C. - Ba
ltimore
San Fra
ncisco B
ay Are
a
Raleig
h-Durh
am
Philad
elphia
Los An
geles
Seattle
San Die
goChi
cago
Detroit
Houston
Pittsbu
rghSt.
Louis
Atlanta
New Haven, C
T
Nashville
Denver-B
oulder
Minneap
olis
Birming
ham, AL
Source: Real Capital Analytics, Q2 2020. Note: Annual sales figures of R&D properties.
LAB/R&D PROPERTY SALES VOLUME
Q2 2015 Q2 2017 Q2 2019 Q2 2020
($ Billions)
0.00
0.02
0.04
0.06
0.08
0.12
0.14
0.10
0.16
Lab Market Stats, Q2 2020
Tenant Submarket Sq. Ft. TypePfizer Boulder 151,384 Expansion/RecastEli Lilly Northwest 113,280 ExpansionArcherDX Northwest 52,465 ExpansionMedtronic Northwest 44,000 RenewalSomalogic Boulder 30,887 RenewalArcherDx Boulder 22,623 ExpansionEli Lilly Boulder 13,965 Expansion
Source: CBRE Research, Q2 2020.
Source: CBRE Research, Q2 2020.
Significant Lease Deals
OVERVIEW
Relatively low lab vacancy (7.8%) is expected to fall further over the next year, pushing rents higher.
RENTS & VACANCY
Several key projects in the construction pipeline will accommodate Denver-Boulder’s ongoing growth, including The Max, a speculative conversion of an office building to labs.
SUPPLY
The 800,000 sq. ft. of lab demand in Q2 2020, which has grown over the past year, is very significant for a market the size of Denver-Boulder.
DEMAND
Life science companies were deemed essential through the early stages of this crisis and remained open in a limited capacity. Local and global life science companies in the Denver-Boulder market are actively pursuing and ramping up operations for a COVID-19 vaccine.
COVID-19 EFFECT
Life sciences employment in the Denver-Boulder market grew relatively slowly at a rate of 3.3% between 2018 and 2019, below the national average of 4.2%.
EMPLOYMENT
Denver-Boulder has attracted significantly more venture capital over the past few years, culminating in a new record of $310 million for the year ending in Q1 2020.
VENTURE CAPITAL FUNDING
Denver-Boulder ranked 18th in the nation for NIH funding last year, totaling $339 million.
NIH FUNDING
Major life sciences companies have made key real estate or local company acquisitions over the past year, positioning the region for stronger growth.
OTHER
Submarket Inventory Vacancy Rate Avg Asking Rent (NNN) 18-mos ChangeDenver- Boulder 2,124,711 7.8% $23.93 na
Development Name Submarket Developer Sq. Ft. NotesThe Max Longmont Broe 455,000 Spec
Conversions to Lab
QUICK STATS
NIH FUNDING RECIPIENTS BY LIFE SCIENCES CLUSTER#18 in nation: $0.3 billion (2019)

U.S. LIFE SCIENCES | CBRE RESEARCH 65
Source: NIH, CBRE Research, Q3 2020.
Tenant / Company Location Sq. Ft.AveXis Longmont 800,000AGC Biologics Boulder 178,713
Source: PwC MoneyTree (BioTech, Drug Development & Discovery, Pharma/Drugs, Disease Diagnosis), CBRE Research, Q2 2020.
EMPLOYMENT
0
30,000
25,000
20,000
15,000
10,000
5,000
2003
2005
2007
2009
2011
2013
2015
2017
2019
R&D
Manufacturers/Testing & Diagnostic Laboratories
Employees
Source: U.S. Bureau of Labor Statistics, CBRE Research, Q3 2020.
Property Address Sq. Ft. Price Price PSF"Former AstraZeneca facility in Longmont / 4000 Nelson Road, Longmont, CO" 800,000 $30,000,000 $38
Former Maxtor property / The "Max" 455,000 $8,600,000 $19Former AstraZeneca facility in Boulder / 5550 Airport Boulevard, Boulder 178,713 $80,000,000 $448
Source: CBRE Research, Q2 2020.
Significant Sales New Life Science Tenants to Market
LOCAL NIH FUNDING RECIPIENTS
VENTURE CAPITAL FUNDING (Denver Boulder CSA)
0
0.100.150.200.250.300.35
Q2 2008
Q2 2006
Q2 2005
Q2 2010
Q2 2012
Q2 2014
Q2 2016
Q2 2018
Q2 2020
($ Billions)
Quarterly Amounts 4-qtr. Rolling Sum
0.05
Development Name Submarket Developer Sq. Ft. NotesMedtronic Northwest TBD 500,000 BTS 2021 deliveryEli Lilly Northwest TBD 113,280 BTS 2021 delivery
Construction
University ofColorado Denver
National Jewish Health
University of Colorado
Requirement Count/SF 18-Mos. ChangeTenants 9 125.0%Total Sq. Ft. 830,000 207.4%
Demand (Lab Requirements)
Source: CBRE Research, Q2 2020.

CONTACTS
TolearnmoreaboutCBREResearch,ortoaccessadditionalresearchreports,pleasevisitwww.cbre.com/research-and-reports.AdditionalU.S.ResearchfromCBREcanbefoundhere.
IAN ANDERSON Senior Director of [email protected]:@IanAndersonCBRE
JULIE WHELAN Head of Global Occupier Thought [email protected]:@JulieWhelanCBRE
KEN MANKE Life Sciences President, [email protected]
TODD RICHARDSON Senior Managing Director Global Life Sciences [email protected]
Richard Barkham, Ph.D., MRICS GlobalChiefEconomist&HeadofAmericasResearch+16179125215richard.barkham@cbre.comFollowRichardonTwitter:@RichardJBarkham
Spencer G. Levy ChairmanofAmericasResearch&SeniorEconomicAdvisor+16179125236spencer.levy@cbre.comFollowSpenceronTwitter:@SpencerGLevy
FOR MORE INFORMATION PLEASE CONTACT:
FOR MORE INFORMATION REGARDING CBRE RESEARCH, PLEASE CONTACT:
Disclaimer: Information contained herein, including projections, has been obtained from sources believed to be reliable. While we do not doubt its accuracy, we have not verified it and make no guarantee, warranty or representation about it. It is your responsibility to confirm independently its accuracy and completeness. This information is presented exclusively for use by CBRE clients and professionals and all rights to the material are reserved and cannot be reproduced without prior written permission of CBRE.