
Leading Global Infrastructure Advisor Specializing in Maritime,Transportation, Coastal,Urban...
20
Past Past The The Worst Worst Point Point Northeast Trade and Transportation Conference 2011 March 23, 2011 Dr. Walter Kemmsies, Chief Economist Moffatt & Nichol
-
Upload
katthylucas2100 -
Category
Design
-
view
60 -
download
1
Transcript of Leading Global Infrastructure Advisor Specializing in Maritime,Transportation, Coastal,Urban...
PastPast TheThe WorstWorst PointPoint
Northeast Trade and Transportation Conference 2011
March 23, 2011
Dr. Walter Kemmsies, Chief EconomistMoffatt & Nichol
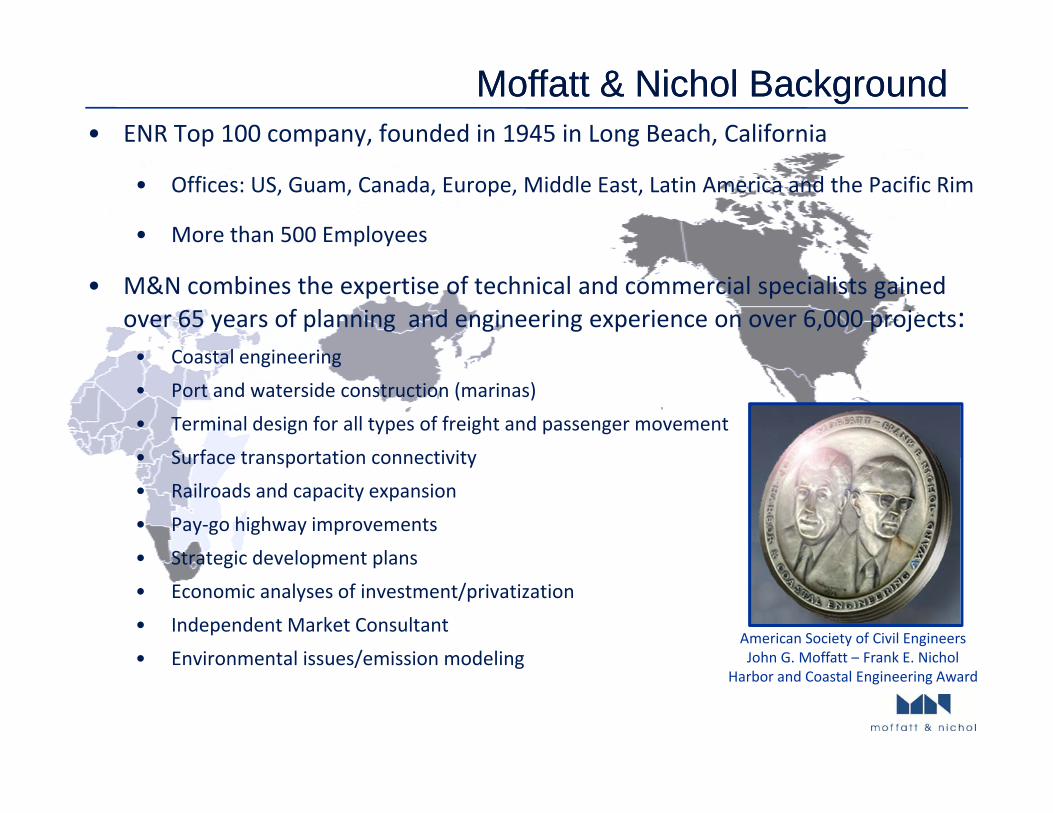
• ENR Top 100 company, founded in 1945 in Long Beach, California
Moffatt & Nichol BackgroundMoffatt & Nichol Background
• Offices: US, Guam, Canada, Europe, Middle East, Latin America and the Pacific Rim
• More than 500 Employees
• M&N combines the expertise of technical and commercial specialists gained over 65 years of planning and engineering experience on over 6,000 projects:• Coastal engineering• Coastal engineering
• Port and waterside construction (marinas)
• Terminal design for all types of freight and passenger movement
• Surface transportation connectivity• Surface transportation connectivity
• Railroads and capacity expansion
• Pay‐go highway improvements
• Strategic development plans• Strategic development plans
• Economic analyses of investment/privatization
• Independent Market Consultant
• Environmental issues/emission modelingAmerican Society of Civil EngineersJohn G. Moffatt – Frank E. NicholEnvironmental issues/emission modeling
Harbor and Coastal Engineering Award
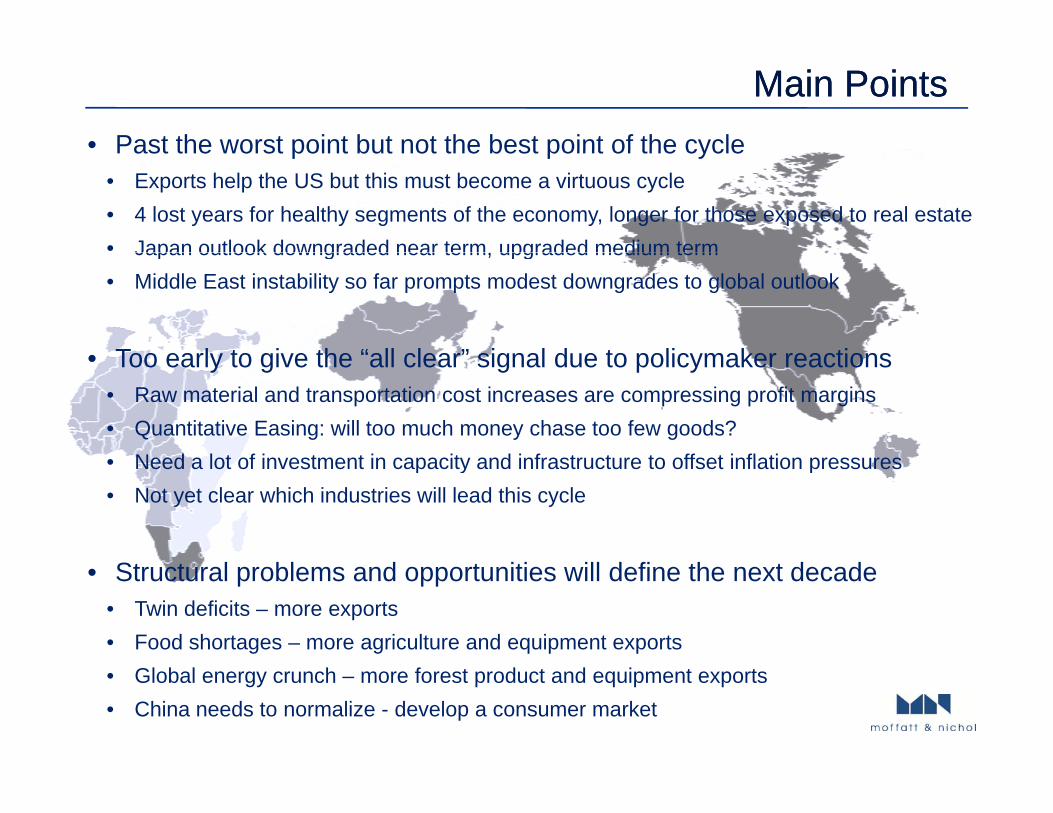
Main PointsMain Points• Past the worst point but not the best point of the cyclePast the worst point but not the best point of the cycle
• Exports help the US but this must become a virtuous cycle• 4 lost years for healthy segments of the economy, longer for those exposed to real estate• Japan outlook downgraded near term upgraded medium termJapan outlook downgraded near term, upgraded medium term• Middle East instability so far prompts modest downgrades to global outlook
• Too early to give the “all clear” signal due to policymaker reactions• Too early to give the all clear signal due to policymaker reactions• Raw material and transportation cost increases are compressing profit margins• Quantitative Easing: will too much money chase too few goods?
Need a lot of investment in capacity and infrastructure to offset inflation pressures• Need a lot of investment in capacity and infrastructure to offset inflation pressures• Not yet clear which industries will lead this cycle
• Structural problems and opportunities will define the next decade• Twin deficits – more exports• Food shortages – more agriculture and equipment exports• Global energy crunch – more forest product and equipment exports• China needs to normalize - develop a consumer market
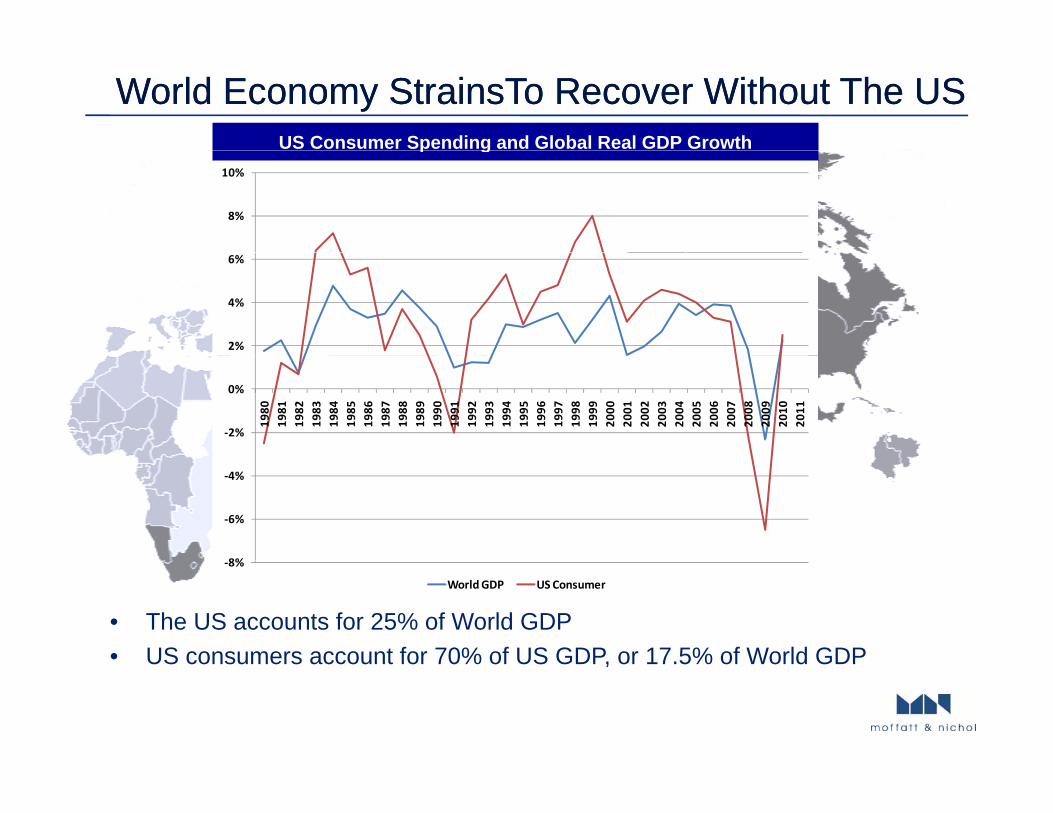
World Economy StrainsTo Recover Without The USWorld Economy StrainsTo Recover Without The USUS Consumer Spending and Global Real GDP Growth p g
8%
10%
2%
4%
6%
‐2%
0%
1980
1981
1982
1983
1984
1985
1986
1987
1988
1989
1990
1991
1992
1993
1994
1995
1996
1997
1998
1999
2000
2001
2002
2003
2004
2005
2006
2007
2008
2009
2010
2011
8%
‐6%
‐4%
• The US accounts for 25% of World GDP• US consumers account for 70% of US GDP, or 17.5% of World GDP
‐8%
World GDP US Consumer
US consumers account for 70% of US GDP, or 17.5% of World GDP
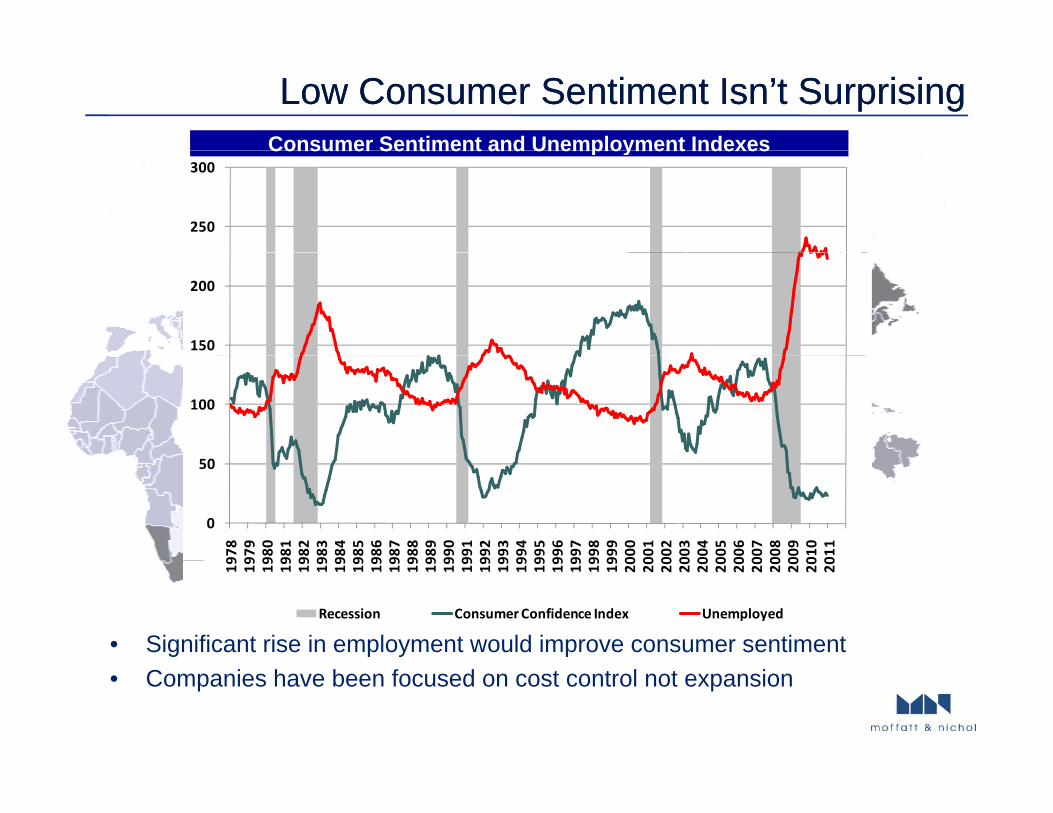
Low Consumer Sentiment Isn’t SurprisingLow Consumer Sentiment Isn’t SurprisingConsumer Sentiment and Unemployment Indexes
250
300Consumer Sentiment and Unemployment Indexes
150
200
100
0
50
978
979
980
981
982
983
984
985
986
987
988
989
990
991
992
993
994
995
996
997
998
999
000
001
002
003
004
005
006
007
008
009
010
011
19 19 19 19 19 19 19 19 19 19 19 19 19 19 19 19 19 19 19 19 19 19 20 20 20 20 20 20 20 20 20 20 20 20
Recession Consumer Confidence Index Unemployed
• Significant rise in employment would improve consumer sentiment• Companies have been focused on cost control not expansion
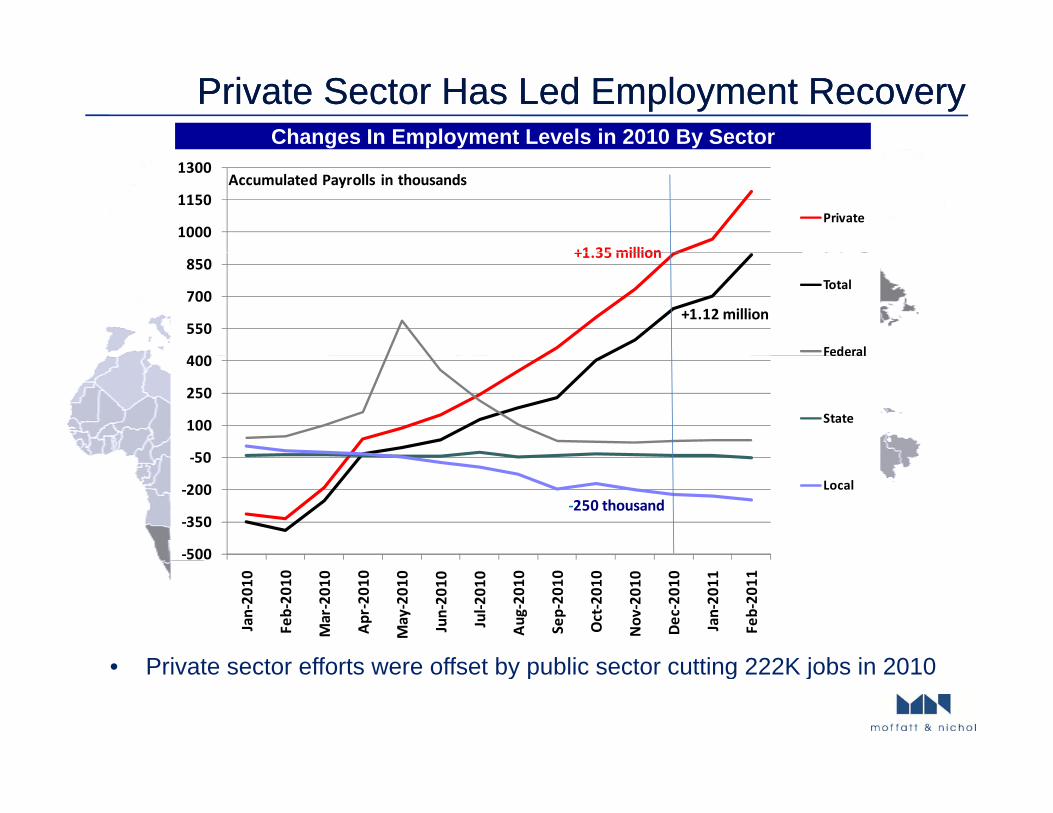
Private Sector Has Led Employment RecoveryPrivate Sector Has Led Employment RecoveryChanges In Employment Levels in 2010 By Sector
1000
1150
1300
Private
Accumulated Payrolls in thousands
+1 35 million
00
550
700
850Total
Federal
+1.35 million
+1.12 million
‐50
100
250
400 Federal
State
‐500
‐350
‐200
‐50
Local‐250 thousand
Jan‐20
10
Feb‐20
10
Mar‐201
0
Apr‐20
10
May‐201
0
Jun‐20
10
Jul‐2
010
Aug‐20
10
Sep‐20
10
Oct‐201
0
Nov
‐201
0
Dec‐20
10
Jan‐20
11
Feb‐20
11
• Private sector efforts were offset by public sector cutting 222K jobs in 2010• Private sector efforts were offset by public sector cutting 222K jobs in 2010
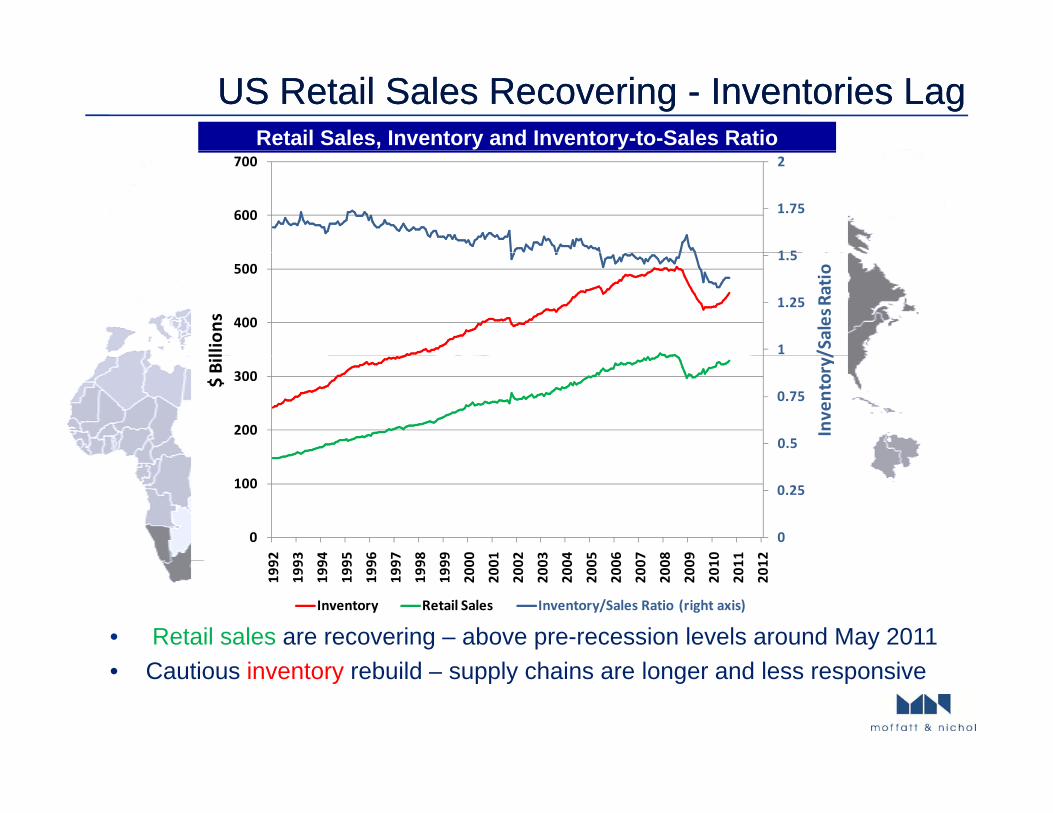
US US Retail Sales Recovering Retail Sales Recovering -- Inventories LagInventories LagRetail Sales, Inventory and Inventory-to-Sales Ratio
1 5
1.75
2
600
700
1
1.25
1.5
400
500
/Sales Ratio
llion
s
0.5
0.75
200
300
Inventory/
$ Bil
0
0.25
0
100
92 93 94 95 96 97 98 99 00 01 02 03 04 05 06 07 08 09 10 11 12
199
199
199
199
199
199
199
199
200
200
200
200
200
200
200
200
200
200
201
201
201
Inventory Retail Sales Inventory/Sales Ratio (right axis)
• Retail sales are recovering – above pre-recession levels around May 2011C ti i t b ild l h i l d l i• Cautious inventory rebuild – supply chains are longer and less responsive
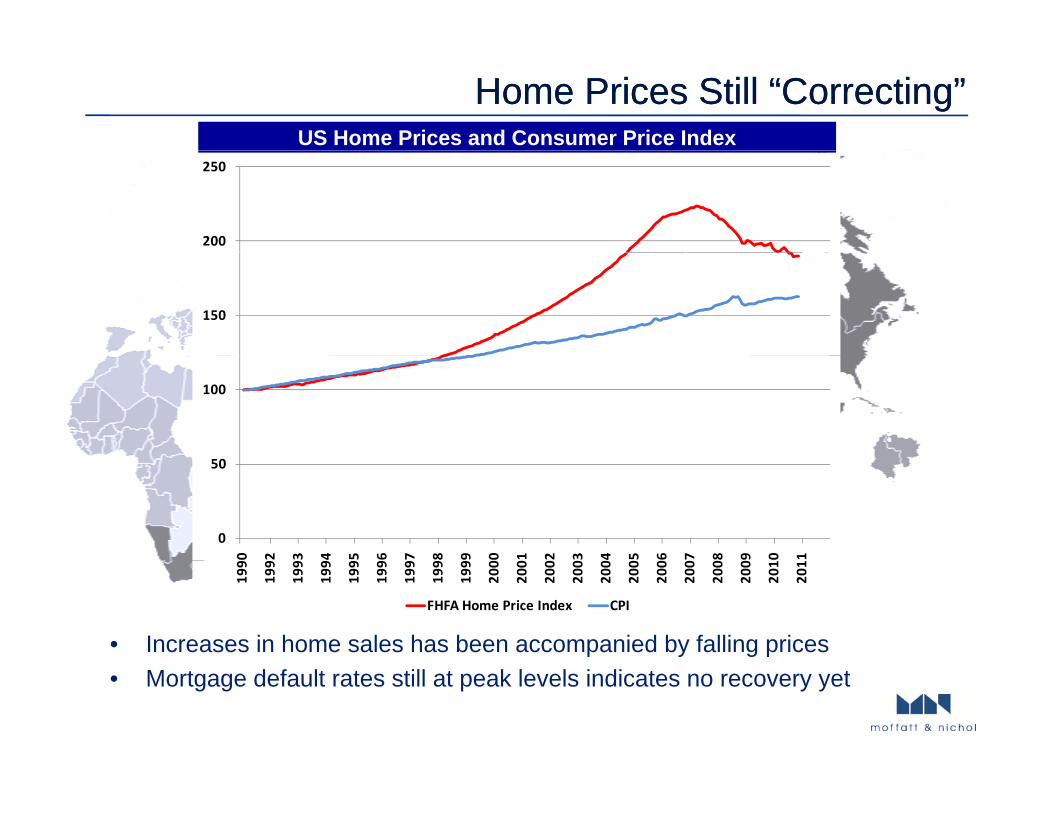
Home Home PricesPrices Still “Still “CorrectingCorrecting””US Home Prices and Consumer Price Index
200
250
150
100
0
50
0 2 3 4 5 6 7 8 9 0 1 2 3 4 5 6 7 8 9 0 1
199
199
199
199
199
199
199
199
199
200
200
200
200
200
200
200
200
200
200
201
201
FHFA Home Price Index CPI
• Increases in home sales has been accompanied by falling prices• Mortgage default rates still at peak levels indicates no recovery yet
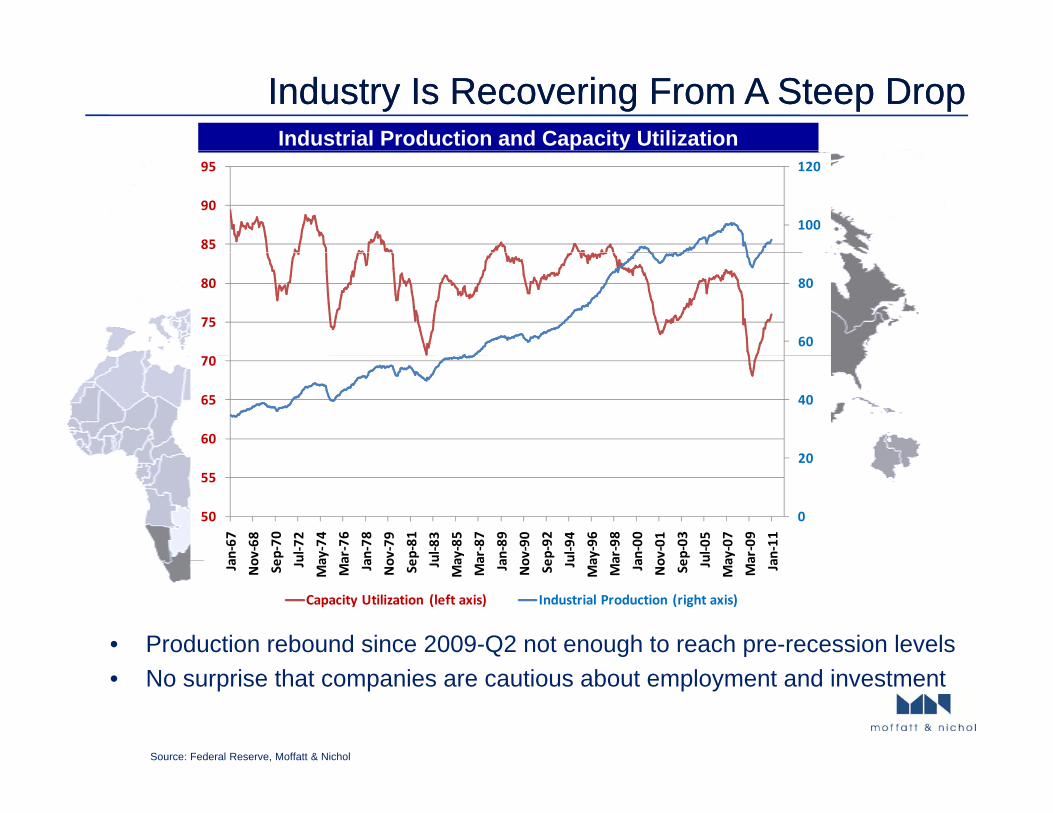
Industry Is Recovering From A Steep DropIndustry Is Recovering From A Steep DropIndustrial Production and Capacity Utilization
100
120
85
90
95
60
80
75
80
20
40
60
65
70
0
20
50
55
an‐67
ov‐68
ep‐70
ul‐72
ay‐74
ar‐76
an‐78
ov‐79
ep‐81
ul‐83
ay‐85
ar‐87
an‐89
ov‐90
ep‐92
ul‐94
ay‐96
ar‐98
an‐00
ov‐01
ep‐03
ul‐05
ay‐07
ar‐09
an‐11
• Production rebound since 2009-Q2 not enough to reach pre-recession levels
Ja No Se Ju
Ma
Ma Ja No Se Ju
Ma
Ma Ja No Se Ju
Ma
Ma Ja No Se Ju
Ma
Ma Ja
Capacity Utilization (left axis) Industrial Production (right axis)
• No surprise that companies are cautious about employment and investment
Source: Federal Reserve, Moffatt & Nichol
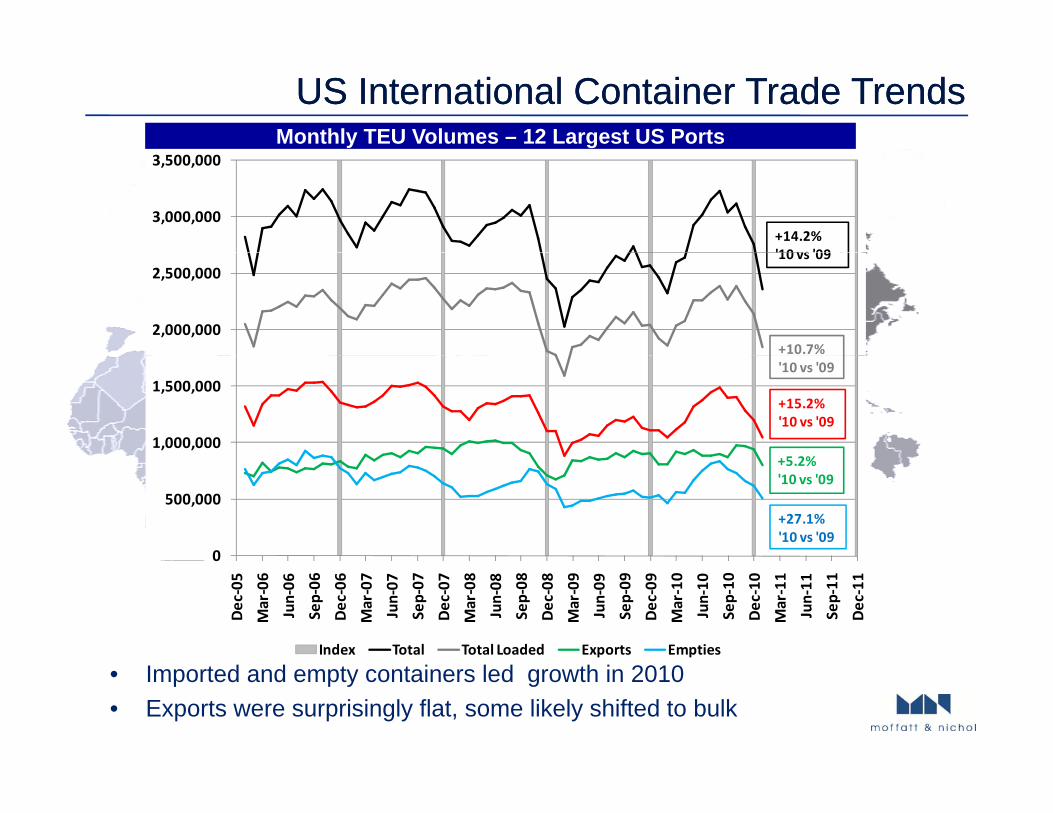
US US International Container Trade Trends International Container Trade Trends Monthly TEU Volumes – 12 Largest US Ports
3,000,000
3,500,000
+14.2% '10 vs '09
2,000,000
2,500,00010 vs 09
+10.7%
1,000,000
1,500,000'10 vs '09
+15.2% '10 vs '09
5 2%
0
500,000
+5.2% '10 vs '09
+27.1% '10 vs '09
0
Dec‐05
Mar‐06
Jun‐06
Sep‐06
Dec‐06
Mar‐07
Jun‐07
Sep‐07
Dec‐07
Mar‐08
Jun‐08
Sep‐08
Dec‐08
Mar‐09
Jun‐09
Sep‐09
Dec‐09
Mar‐10
Jun‐10
Sep‐10
Dec‐10
Mar‐11
Jun‐11
Sep‐11
Dec‐11
Index Total Total Loaded Exports Empties
• Imported and empty containers led growth in 2010• Exports were surprisingly flat, some likely shifted to bulk
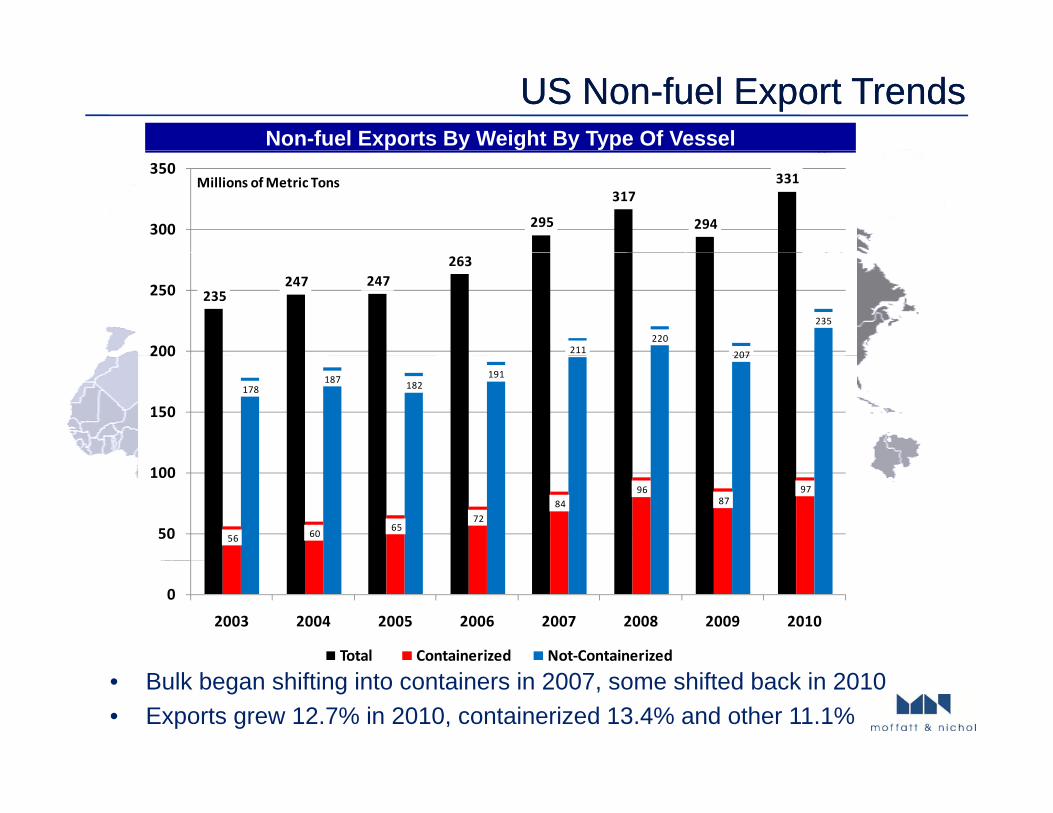
US US NonNon--fuelfuel Export Trends Export Trends Non-fuel Exports By Weight By Type Of Vessel
295
317
294
331
300
350Millions of Metric Tons
235 247 247
263
211 220
207
235
200
250
178 187 182
191
207
150
200
56 60 65 72
84 96
87 97
50
100
0
2003 2004 2005 2006 2007 2008 2009 2010
Total Containerized Not‐Containerized
• Bulk began shifting into containers in 2007, some shifted back in 2010• Exports grew 12.7% in 2010, containerized 13.4% and other 11.1%
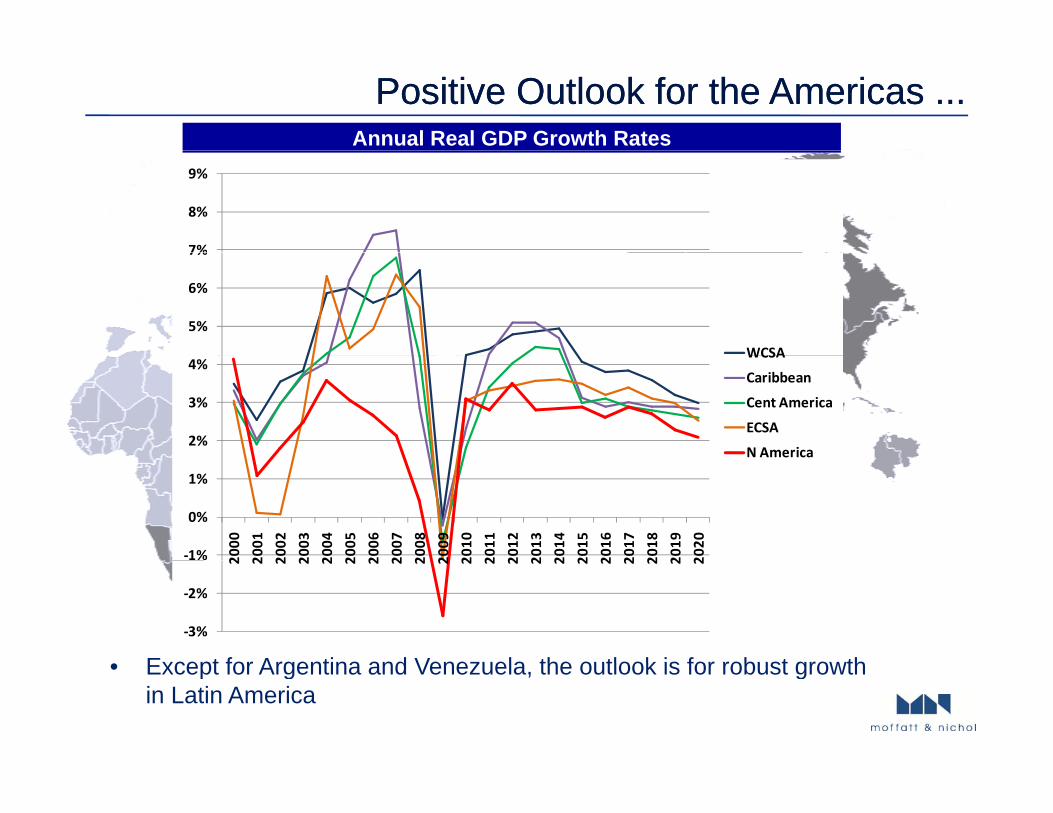
Positive Outlook for Positive Outlook for thethe AmericasAmericas ......Annual Real GDP Growth Rates
7%
8%
9%
5%
6%
7%
WCSA
2%
3%
4%WCSA
Caribbean
Cent America
ECSA
N America
‐1%
0%
1%
2000
2001
2002
2003
2004
2005
2006
2007
2008
2009
2010
2011
2012
2013
2014
2015
2016
2017
2018
2019
2020
‐3%
‐2%
2 2 2 2 2 2 2 2 2 2 2 2 2 2 2 2 2 2 2 2 2
• Except for Argentina and Venezuela the outlook is for robust growth• Except for Argentina and Venezuela, the outlook is for robust growth in Latin America
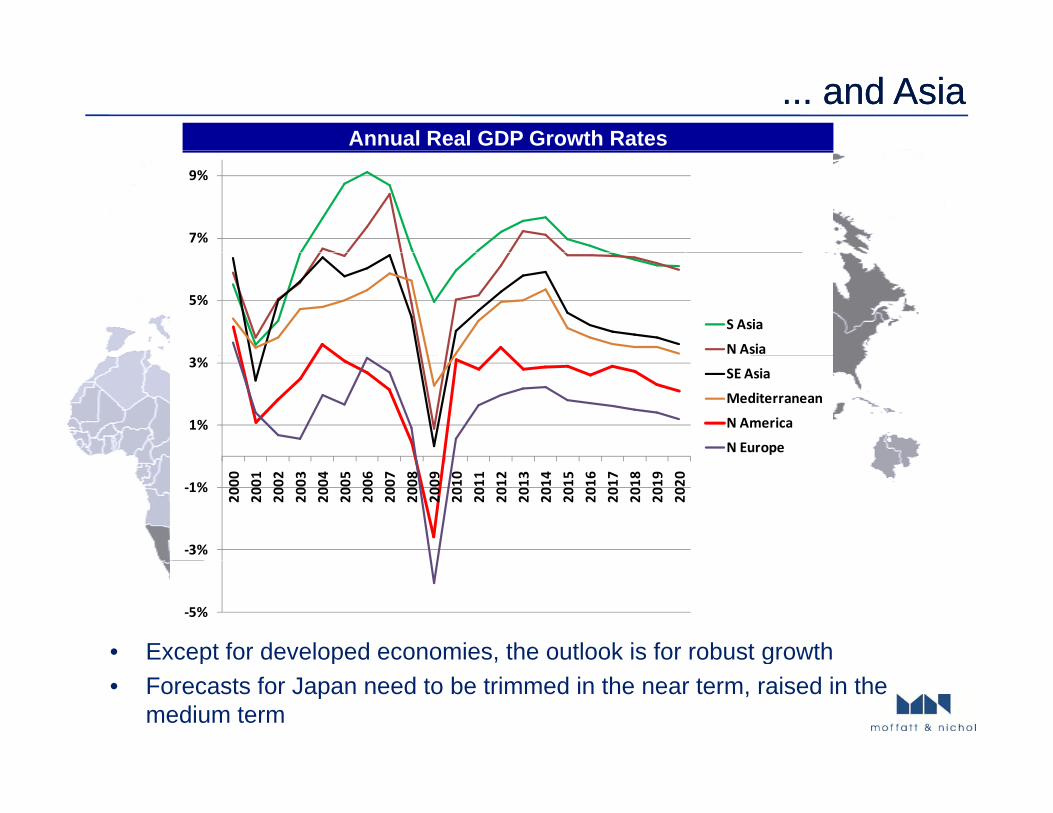
... and Asia... and AsiaAnnual Real GDP Growth Rates
7%
9%
5%
S Asia
N Asia
1%
3%SE Asia
Mediterranean
N America
N Europe
‐3%
‐1%
2000
2001
2002
2003
2004
2005
2006
2007
2008
2009
2010
2011
2012
2013
2014
2015
2016
2017
2018
2019
2020
‐5%
• Except for developed economies, the outlook is for robust growthp p g• Forecasts for Japan need to be trimmed in the near term, raised in the
medium term
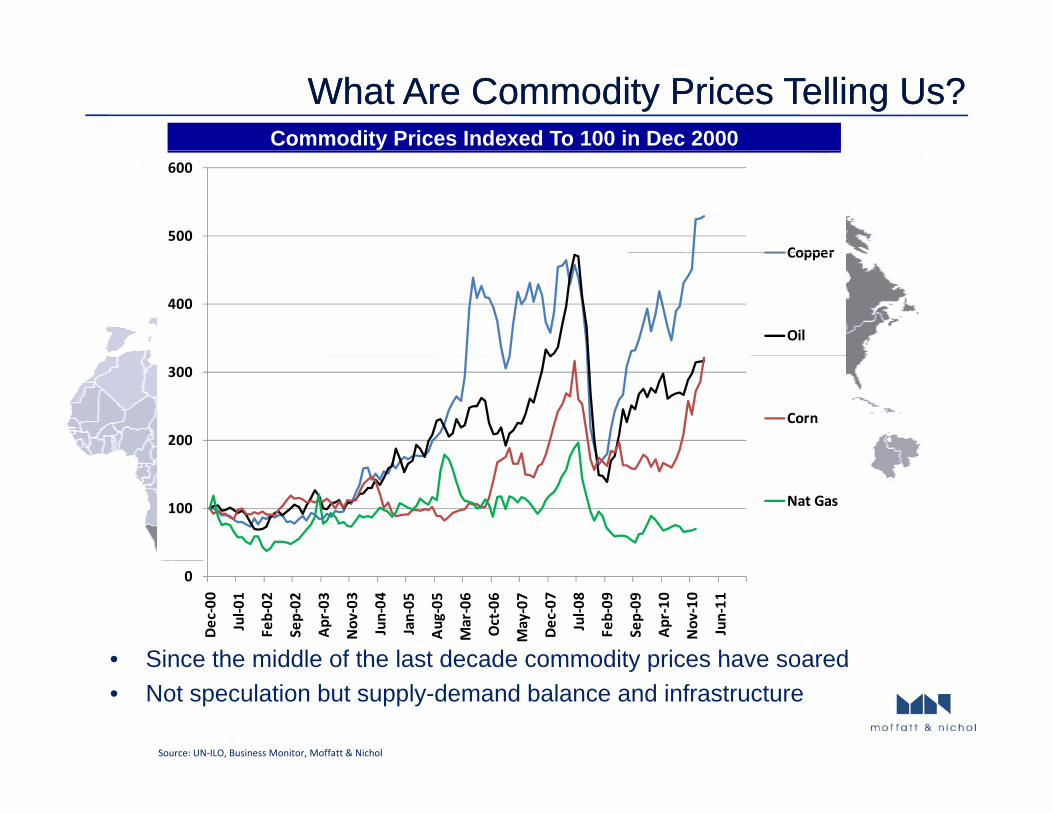
What Are Commodity Prices Telling Us? What Are Commodity Prices Telling Us? Commodity Prices Indexed To 100 in Dec 2000
500
600
Copper
400
Copper
Oil
200
300
Corn
100 Nat Gas
0
Dec‐00
Jul‐0
1
Feb‐02
Sep‐02
Apr‐03
Nov
‐03
Jun‐04
Jan‐05
Aug‐05
Mar‐06
Oct‐06
May‐07
Dec‐07
Jul‐0
8
Feb‐09
Sep‐09
Apr‐10
Nov
‐10
Jun‐11
• Since the middle of the last decade commodity prices have soaredSince the middle of the last decade commodity prices have soared• Not speculation but supply-demand balance and infrastructure
Source: UN‐ILO, Business Monitor, Moffatt & Nichol
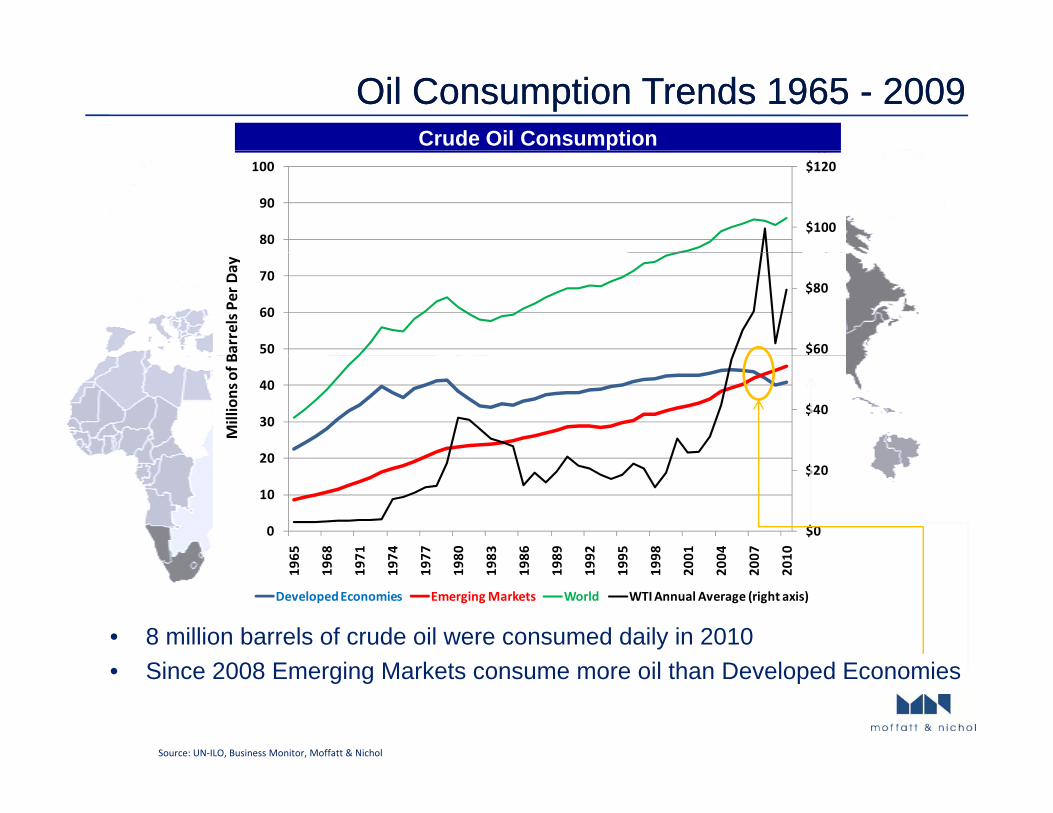
Oil Consumption Trends 1965 Oil Consumption Trends 1965 -- 2009 2009 Crude Oil Consumption
$100
$120
80
90
100
$60
$80
50
60
70
Barrels P
er Day
$40
20
30
40
Millions of B
$0
$20
0
10
20
65 68 71 74 77 80 83 86 89 92 95 98 01 04 07 10
• 8 million barrels of crude oil were consumed daily in 2010Si 2008 E i M k t il th D l d E i
19 19 19 19 19 19 19 19 19 19 19 19 20 20 20 20
Developed Economies Emerging Markets World WTI Annual Average (right axis)
• Since 2008 Emerging Markets consume more oil than Developed Economies
Source: UN‐ILO, Business Monitor, Moffatt & Nichol
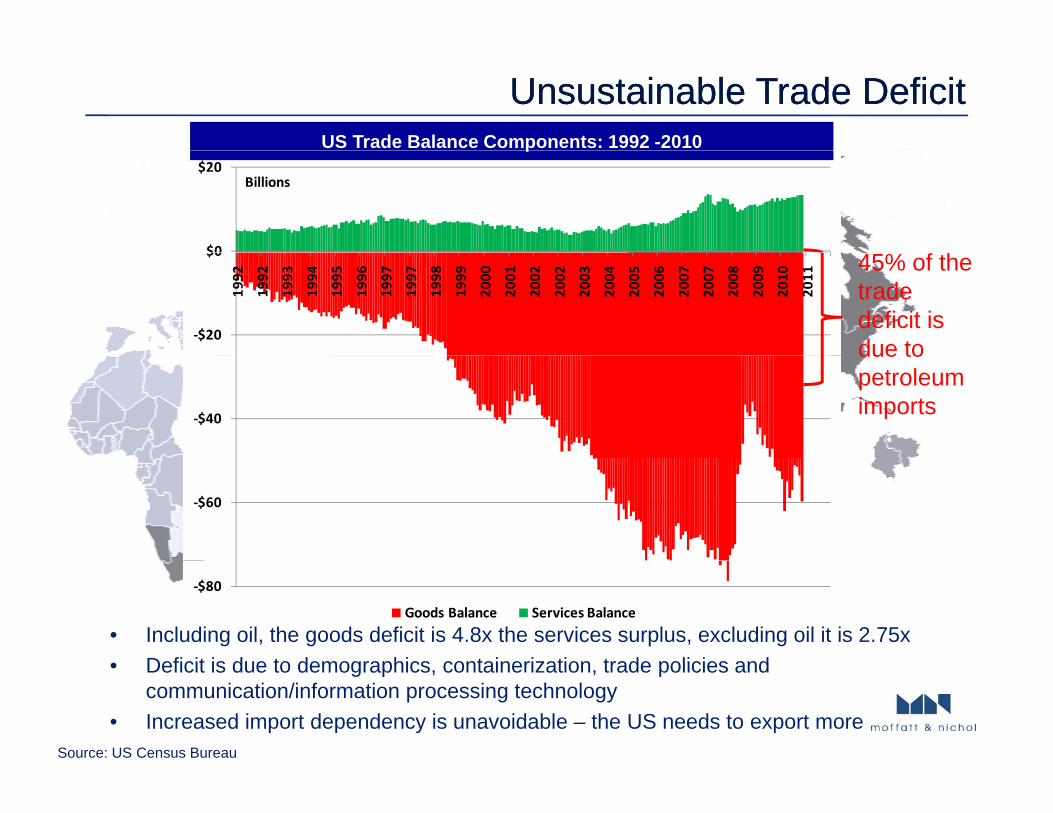
Unsustainable Trade Deficit Unsustainable Trade Deficit US Trade Balance Components: 1992 -2010
$0
$20Billions
p
‐$20
$019
92
1992
1993
1994
1995
1996
1997
1997
1998
1999
2000
2001
2002
2002
2003
2004
2005
2006
2007
2007
2008
2009
2010
2011
45% of the trade deficit is due to
‐$40
due to petroleum imports
‐$60
‐$80
Goods Balance Services Balance
• Including oil, the goods deficit is 4.8x the services surplus, excluding oil it is 2.75x• Deficit is due to demographics containerization trade policies and• Deficit is due to demographics, containerization, trade policies and
communication/information processing technology• Increased import dependency is unavoidable – the US needs to export more
Source: US Census Bureau
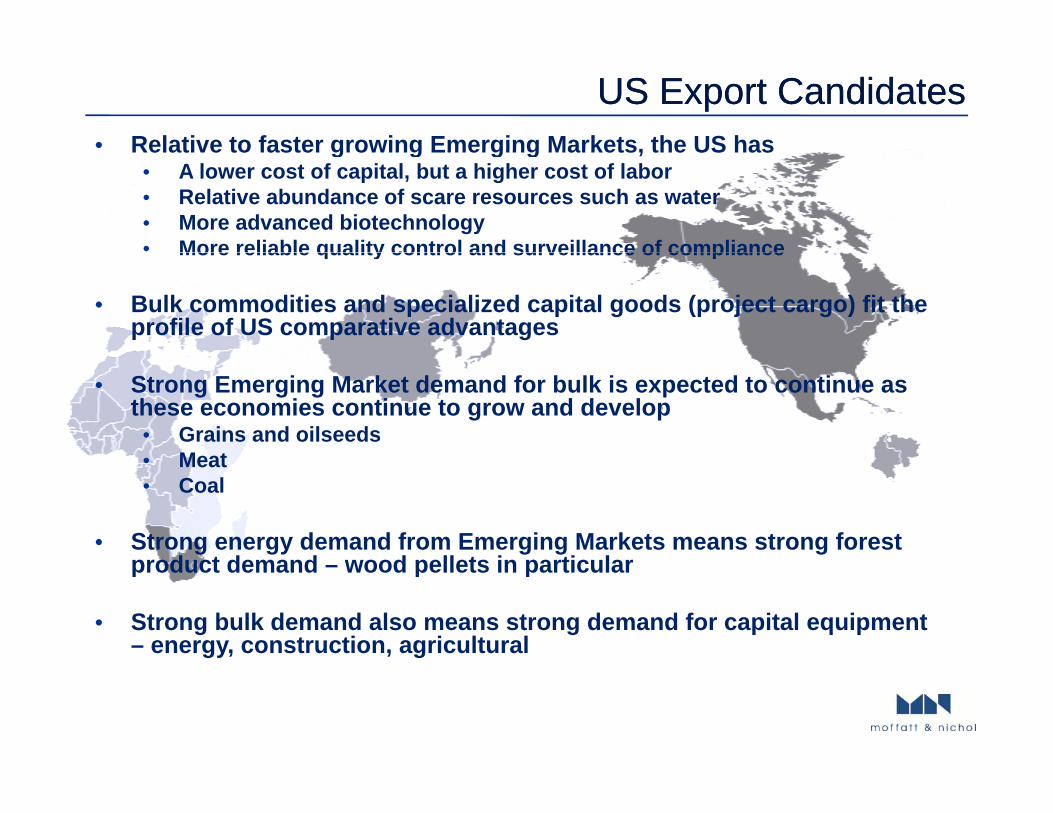
US US ExportExport Candidates Candidates • Relative to faster growing Emerging Markets, the US hasRelative to faster growing Emerging Markets, the US has
• A lower cost of capital, but a higher cost of labor• Relative abundance of scare resources such as water• More advanced biotechnology • More reliable quality control and surveillance of complianceMore reliable quality control and surveillance of compliance
• Bulk commodities and specialized capital goods (project cargo) fit the profile of US comparative advantages
• Strong Emerging Market demand for bulk is expected to continue as these economies continue to grow and develop
• Grains and oilseeds• Meat• Meat • Coal
• Strong energy demand from Emerging Markets means strong forest product demand wood pellets in particularproduct demand – wood pellets in particular
• Strong bulk demand also means strong demand for capital equipment – energy, construction, agricultural
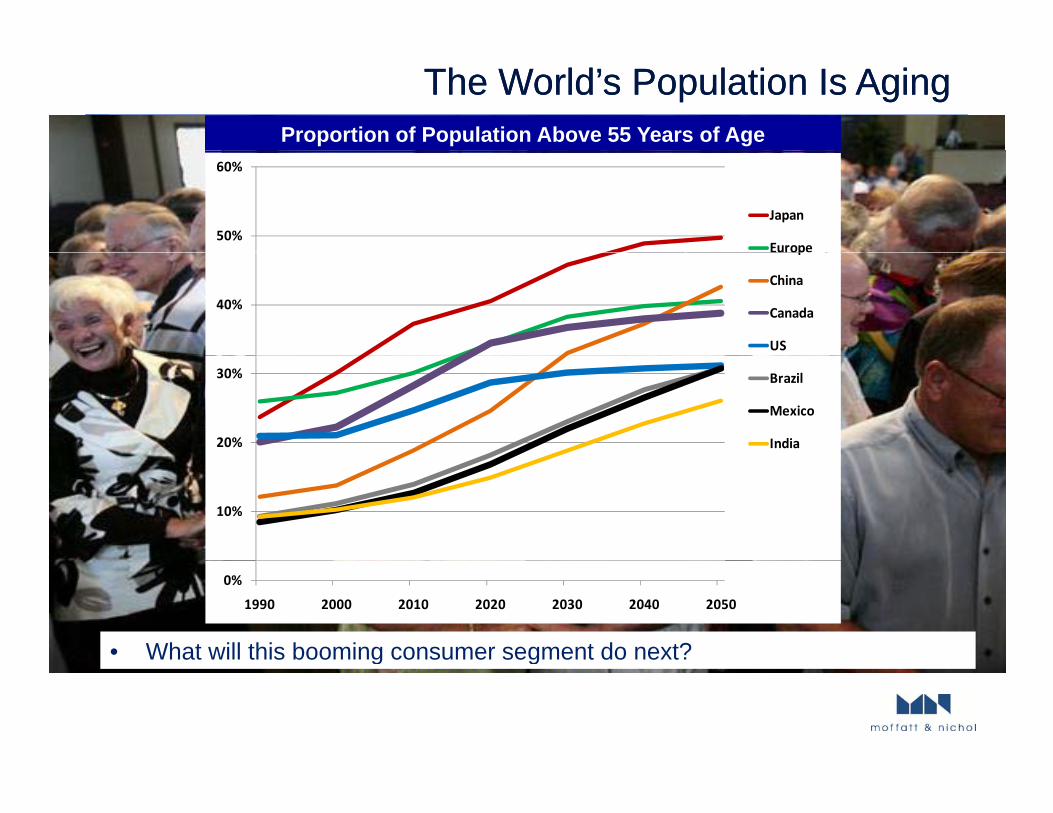
Proportion of Population Above 55 Years of Age
The World’s Population Is AgingThe World’s Population Is Aging
50%
60%
Japan
Europe
40%
p
China
Canada
US
20%
30% Brazil
Mexico
India
10%
0%
1990 2000 2010 2020 2030 2040 2050
• What will this booming consumer segment do next? g g

China’s Currency Policy Is A Global Economic RiskChina’s Currency Policy Is A Global Economic Risk
8
9
Exchange Rates Between US$, Chinese Yuan and Brazilian Real
6
7Yuan Per Dollar
4
5
Yuan Per Real
1
2
3
Real Per Dollar
0
1
2000
2001
2002
2003
2004
2005
2006
2007
2008
2009
2010
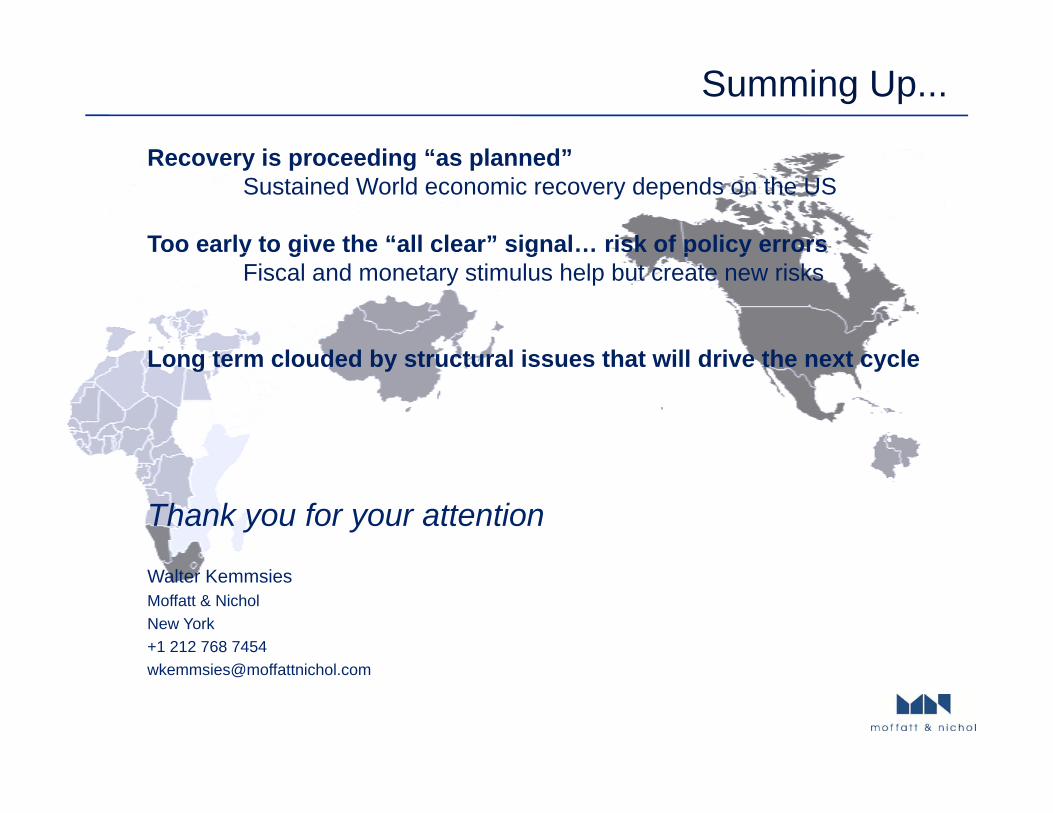
Summing Up...
R i di “ l d”Recovery is proceeding “as planned”Sustained World economic recovery depends on the US
Too early to give the “all clear” signal… risk of policy errorsy g g p yFiscal and monetary stimulus help but create new risks
Long term clouded by structural issues that will drive the next cycleLong term clouded by structural issues that will drive the next cycle
Thank you for your attention
Walter KemmsiesMoffatt & NicholNew York+1 212 768 [email protected]


![[OFFICIAL] South Boston Waterfront Sustainable Transportation Plan | Existing Conditions Report FINAL DRAFT (2014)](https://static.fdocuments.in/doc/165x107/55cf8e41550346703b90348f/official-south-boston-waterfront-sustainable-transportation-plan-existing.jpg)