Global Agenda Council's Leading Indicators of Innovation ...

Creating a Clean, Affordable and Resilient Energy Future for the Commonwealth
Leading by Example Council Agenda September 14, 2021
Welcome
LBE Updates
Clean Energy News
State of the Climate: IPCC Report
State of the LBE Portfolio
Heat Pumps 1011

Creating a Clean, Affordable and Resilient Energy Future for the Commonwealth
UMass Amherst Named One of Nation’s ‘Coolest Schools’Notable UMA accomplishments highlighted by Sierra Club include:
• Home to the state’s first fast-charging EV station, with plan to transition entire fleet to EVs
• Three solar canopies and five rooftop systems, with two more canopies on the way, that will total 10 MW
• Task force of students, faculty and staff who are creating a plan to move UMA toward zero carbon emissions
• Early adopter of the Carbon Literacy Project, hiring undergrads to facilitate a training on costs of carbon and solutions to the climate crisis
• Expansion of a regional bike-share program
• Awarded grant to study nexus of energy and equity in era of climate change
UMA ranked 18 out of 328 in Sierra Club’s review of North
America’s greenest colleges and universities
A view of the Campus Center from the green roof on the new Integrative Learning Center. | Photo by John Solem/University of Massachusetts AmherstSource: Sierra Club

Creating A Clean, Affordable, Equitable and Resilient Energy Future For the Commonwealth
LBE Updates & Clean Energy News

Creating a Clean, Affordable and Resilient Energy Future for the Commonwealth
July Council Meeting Action Items• State partner feedback captured from breakout discussion groups
regarding LBE Program tools, guidance, technical assistance, and other support
• Staff developed internal action plan based on suggestions
• Report-out at next LBE Council meeting

Creating a Clean, Affordable and Resilient Energy Future for the Commonwealth
2021 Leading by Example Awards
Awards are presented to:✓ Two state agencies
✓ Two public institutions of higher education
✓ Two municipalities
✓One staffer or volunteer from a state entity
✓One staffer or volunteer from a municipality
Nominations will be accepted in two phases:➢Phase 1: Express Interest Forms (for entities)➢Phase 2: Full Nomination Forms (for entities and individuals)
Entities are highly encouraged to complete Phase 1. DOER staff will review these forms and offer input before encouraging compelling applicants to submit a full nomination form.
Ne
w t
his
ye
ar!

Creating a Clean, Affordable and Resilient Energy Future for the Commonwealth
2021 LBE Awards
Find all of this information, including this handy flyer, at www.mass.gov/LBEAwards
The deadline for Full Nomination Forms is Friday, October 22nd
The deadline for Express Interest Forms is Friday, September 24th

Creating a Clean, Affordable and Resilient Energy Future for the Commonwealth
FY21 LBE Tracking Form Update (yes, it’s almost that time…)
• Release date: September 30th
• Submission deadline: December 31st
• New features include:
✓Enhanced fleet reporting
✓Section removal / consolidation
✓Increased automation
• If anyone wants to volunteer as tribute to review and provide user feedback, please reach out to Chelsea!
Creating a Clean, Affordable and Resilient Energy Future for the Commonwealth
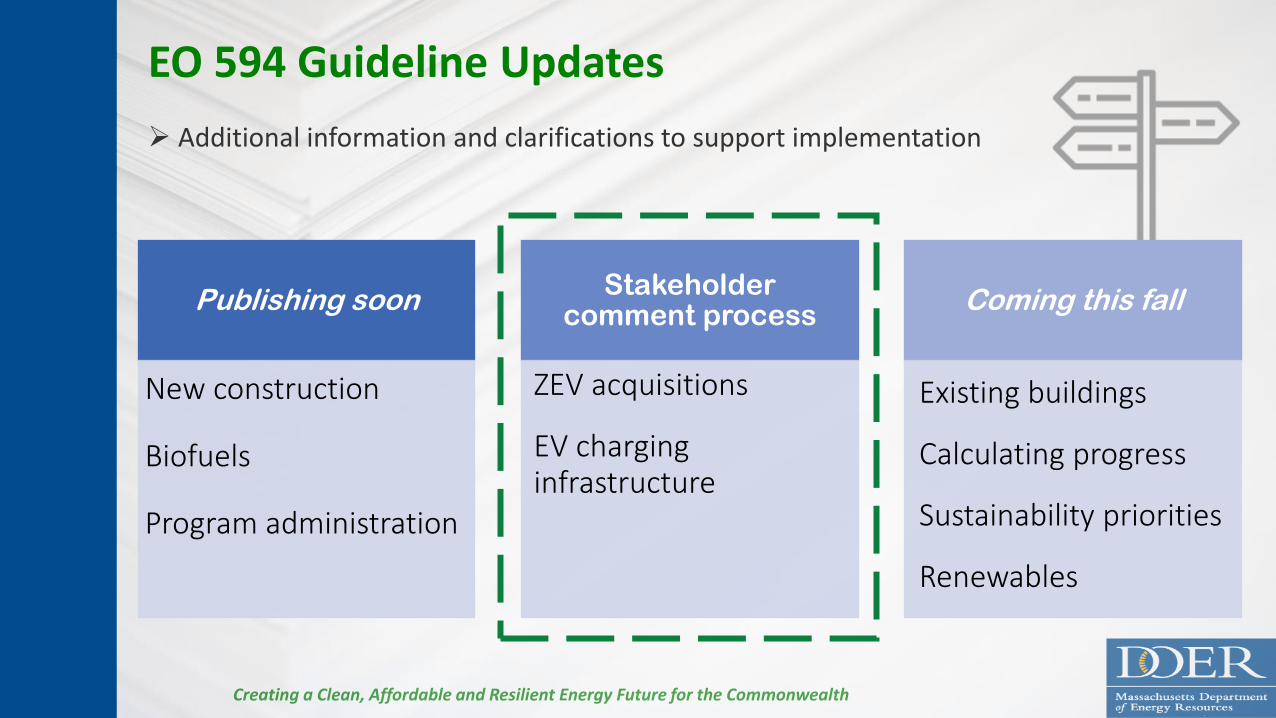
EO 594 Guideline Updates
➢ Additional information and clarifications to support implementation
Publishing soon
New construction
Biofuels
Program administration
Stakeholder comment process
ZEV acquisitions
EV charging infrastructure
Coming this fall
Existing buildings
Calculating progress
Sustainability priorities
Renewables

Creating a Clean, Affordable and Resilient Energy Future for the Commonwealth
LBE Solar Grant III Wrap-up
• 10.89 MW solar
• 3.3 MW storage
• 13 million kWh annually
6%
15%
79%
Innovative Rooftop Solar Solar Canopy
8 canopies 6 rooftops 1 innovative
Portion of capacity by type$4.9M awarded

Creating a Clean, Affordable and Resilient Energy Future for the Commonwealth
Sampling of New and Upcoming EV Models
Sedans, Crossovers, & SUVs
Pickup TrucksVans & Specialty
Vehicles• Nissan Ariya (2021)• Volvo C40 Recharge (2021)• Mazda MX-30 (2021)• Hyundai Ioniq 5 (2021)• Kia EV6 (2022)• Ford Explorer EV (2023)• Honda Prologue (2024)
• Ford F-150 Lightning (2021)• Rivian R1T and R1S (2021)• Chevy Silverado Electric (2023)• Ram 1500 EV (2024)
• Ford E-Transit (2021)• Canoo (2022)
Creating a Clean, Affordable and Resilient Energy Future for the Commonwealth
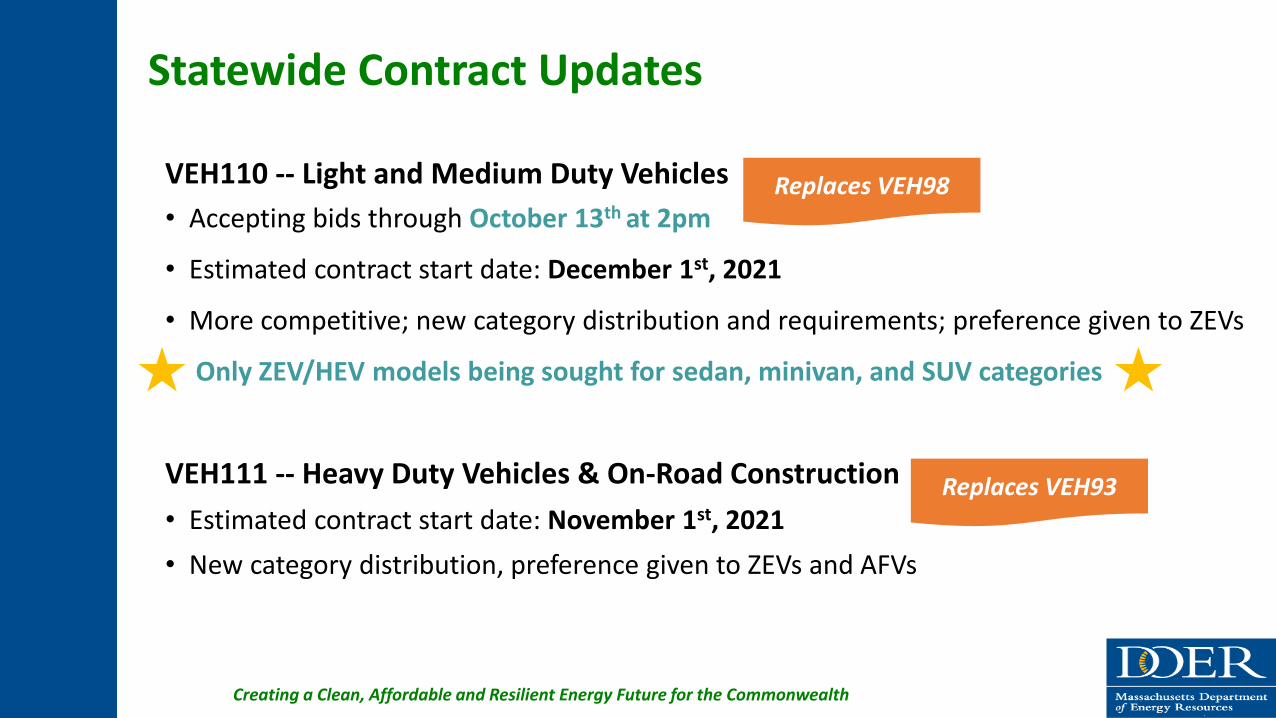
Statewide Contract Updates
VEH110 -- Light and Medium Duty Vehicles
• Accepting bids through October 13th at 2pm
• Estimated contract start date: December 1st, 2021
• More competitive; new category distribution and requirements; preference given to ZEVs
• Only ZEV/HEV models being sought for sedan, minivan, and SUV categories
VEH111 -- Heavy Duty Vehicles & On-Road Construction
• Estimated contract start date: November 1st, 2021
• New category distribution, preference given to ZEVs and AFVs
Replaces VEH98
Replaces VEH93

Creating a Clean, Affordable and Resilient Energy Future for the Commonwealth
2022 Ford E-Transit
Ford E-Transit Cargo Van
Engine Type All electric
Electric Range (mi.) 126
Seating Capacity 2
Cargo Space (cu. Ft.) 487
Drive Train RWD
Max. Horsepower 266
Max. Torque (lb.-ft.) 317
Max. Payload (lbs) 3,800
Battery Warranty Standard
Expected Starting MSRP $45,000
Now available on VEH98!
Highlighted Features…
▪ 3 roof heights and body lengths
▪ Chassis cab & cutaway models
▪ 2.4 kW of onboard power
▪ Rear-shelf delete option
Funding support available through MassEVIP Fleets & MOR-EV Trucks programs
Important Note: MassEVIP funding approval must be received before purchased orders are placed!

Creating a Clean, Affordable and Resilient Energy Future for the Commonwealth
An Analysis of Electrifying the Federal Fleet
USPS fleet electrification could yield as
much as $4.3B in lifetime savings
• Third party report assessed federal government fleet, which is the largest in the US
• Suggests that between 2025-2030 a growing percentage of federal vehicles could be replaced with EVs at a lower TCO, with the vast majority being cost competitive by 2030
• Non-USPS fleet EVs could yield lifetime savings of as much as $1.18B
• Report quantifies reinvestment of savings and public benefits of more rapid electrification
Pickup trucks25%
Passenger cars21%
Law enforcement
21%
Passenger vans15%
SUVs14%
School buses2%
Light trucks1%
Shuttle buses1%
Report

Creating a Clean, Affordable and Resilient Energy Future for the Commonwealth
New EV Charging Station Resources

Creating a Clean, Affordable and Resilient Energy Future for the Commonwealth
DOER Releases Draft Appliance Standards• An Act Creating a Next-Generation Roadmap for Massachusetts Climate Policy included new
energy and water efficiency standards for a variety of appliances
• In compliance, DOER released proposed updates to existing regulation 225 CMR 9
• The draft amendment includes the following parameters:
➢ Manufacturers may only ship products to MA that meet new minimum standards starting in 2022
➢ Retailers are prohibited from selling products that fail to meet the standards starting in 2023
Learn More and Submit Comments
• Review the proposed amendment and full list of impacted appliances on the DOER website.
➢ Comments may be submitted to [email protected], by 5pm, 9/29/21.
➢ Public hearing via Zoom will be held on September 29th, 2021, 12pm-2pm. Pre-register here.
• To get future alerts about updates to Appliance Standards, sign up for the DOER Email list named “DOER Appliance Standards.”

www.ma-eeac.org April Draft Plan Review Schedule Overview
2022-2024 Utility Three-Year Planning Update
16
Fall 2020/Winter 2021Planning Workshops and Public Comment Sessions
February/March 2021EEAC develops/votes on plan
priorities and recommendations
September/October 2021Final Statewide Plan
submitted to EEAC for review and vote
Late Spring/Summer 2021- Draft Plan review
- Additional Public Comment Sessions
- July EEAC Resolution
April 2021DRAFT Statewide Plan
submitted by Mass Save® Program Administrators
Oct. 31, 2021Final Statewide Plan filed with the Department of
Public Utilities (DPU)
Nov. 2021 – Jan. 2022DPU Review
Draft 2022-2024 Plan can be viewed on the EEAC website: https://ma-
eeac.org/plans-updates/
Each goal represents the emissions reductions that are projected to
occur in 2030 as a direct result of investments made by the 2022-
2024 plans.
Secretary Theoharides set an emissions reduction goal for utility
program administrators: 504,000 MTCO2e for electric
341,000 MTCO2e for gas

17
Energy Efficiency Advisory Council September-October Meeting Schedule
Date Meeting Meeting Topic
9/22/2021 Sept. EEAC Meeting • Updated Plan Data Review
10/13/2021 Oct. EEAC Meeting• Updated Plan Narrative Review• Continued Data Discussion• Draft Resolution
10/27/2021 Oct. Special Meeting Final Resolution Vote
Ahead of each meeting, materials can be found at https://ma-eeac.org/latest-council-meetings-materials/

Creating A Clean, Affordable, Equitable and Resilient Energy Future For the Commonwealth
The State of the Global Climate: IPCC Sixth Assessment and a happy 50th birthday to
The Lorax!

IPCC Sixth Assessment Report: The Physical Science Basis
19
• The IPCC will release three working group reports before the end of the year:➢ April August 2021 – The Physical Science Basis
➢ September 2021 – Mitigation of Climate Change
➢ October 2021 – Impacts, Adaptation and Vulnerability
• These reports will inform a Synthesis Report, to be finalized in the first half of 2022
• The Physical Science Basis summary for policy makers is made-up of four sections:
➢ Current State of the Climate
➢ Possible Climate Futures
➢ Climate Information for Risk Assessment and Regional Adaptation
➢ Limiting Future Climate Change
The full report, summary, and related documents can be found at: https://www.ipcc.ch/report/ar6/wg1/

IPCC: Current State of the Climate
• It is unequivocal that human influence has warmed the atmosphere, ocean and land
• CO2 in atmosphere has reached annual average of 410 ppm
20
Cu
rren
t St
ate
of
the
Clim
ate

IPCC: Each Decade Warmer than the Last
• Each of the last four decades has been successively warmer than any decade that preceded it since 1850
• Human influence likely increased global surface temperature by ~1.9°F (1.07°C) over the 1850-1900 average
21
2010s: 58.4°F
2000s: 58.12°F
1990s: 57.76°F
1980s: 57.52°F
Source: CurrentResults, APNews
Cu
rren
t St
ate
of
the
Clim
ate

IPCC: Observed Changes in Weather Extremes
• Hot extremes (including heatwaves) have become more frequent and more intense across most land regions since the 1950s.
• Some recent hot extremes observed over the past decade would have been extremely unlikely to occur without human influence on the climate system
• The frequency and intensity of heavy precipitation events have increased since the 1950s over most land areas (for which observational data are sufficient)
• Human-induced climate change has contributed to increases in agricultural and ecological droughts in some regions due to increased land evapotranspiration
22
Cu
rren
t St
ate
of
the
Clim
ate
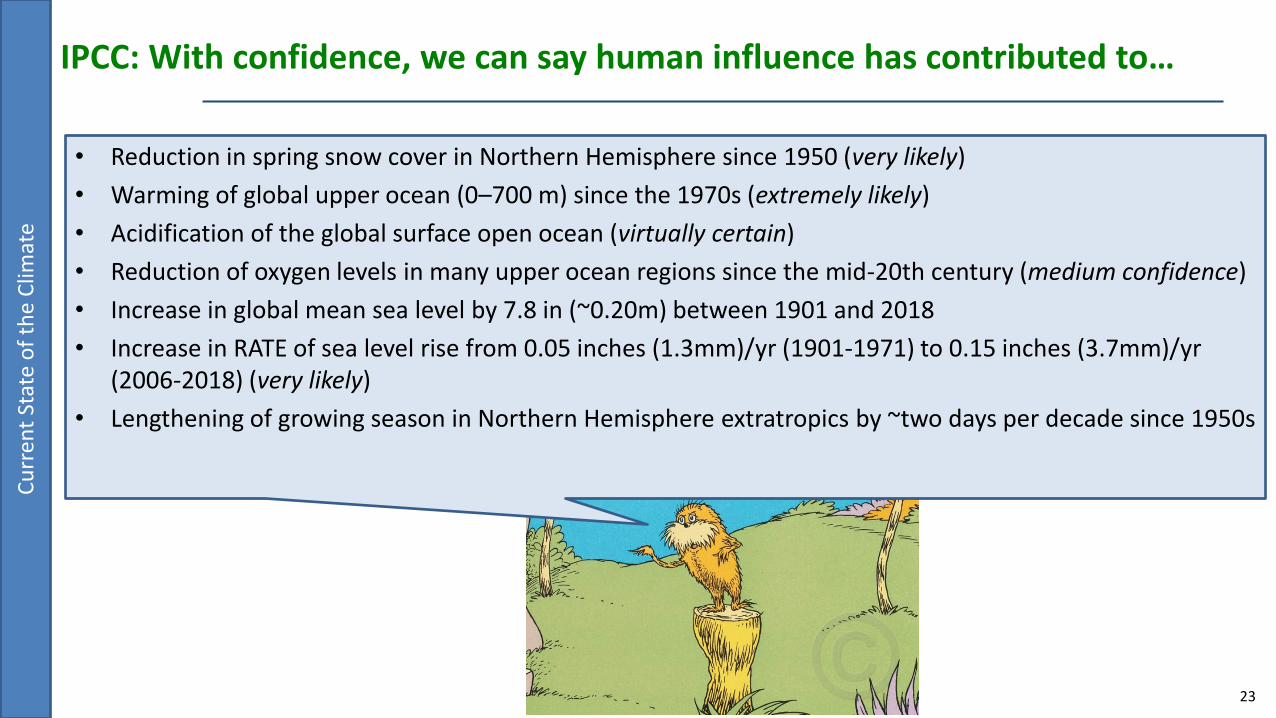
IPCC: With confidence, we can say human influence has contributed to…
• Reduction in spring snow cover in Northern Hemisphere since 1950 (very likely)
• Warming of global upper ocean (0–700 m) since the 1970s (extremely likely)
• Acidification of the global surface open ocean (virtually certain)
• Reduction of oxygen levels in many upper ocean regions since the mid-20th century (medium confidence)
• Increase in global mean sea level by 7.8 in (~0.20m) between 1901 and 2018
• Increase in RATE of sea level rise from 0.05 inches (1.3mm)/yr (1901-1971) to 0.15 inches (3.7mm)/yr(2006-2018) (very likely)
• Lengthening of growing season in Northern Hemisphere extratropics by ~two days per decade since 1950s
23
Cu
rren
t St
ate
of
the
Clim
ate

IPCC: The scale of changes are unprecedented over many thousands of years
24
Atmospheric CO2 higher than at any time in last 2 million years
Atmospheric CH4 and N2O higher than at any time in at least 800,000 years
Since 1750, increases in CO2 (47%) and CH4 (156%) concentrations far exceed the natural multi-millennial changes seen over at least the past 800,000 years
Global surface temperature has increased faster since 1970 than in any other 50-year period over at least the last 2000 years
Global mean sea level has risen faster since 1900 than over any preceding century in at least the last 3000 years
The global ocean has warmed faster over the past century than since the end of the last deglacial transition (around 11,000 years ago)
Cu
rren
t St
ate
of
the
Clim
ate

IPCC: Possible Climate Futures
25
IPCC assessed future climates based on five emissions scenarios:
• SSP1-1.9: “Taking the green road” –Rapid drawdown of fossil fuels, increasing energy efficiency, lower resource demands, net zero emissions by mid-century, population peaks at 7 billion
• SSP1-2.6: Slower progress, net-zero emissions after 2050, population peaks at 7 billion
• SSP2-4.5: “Middle of the road” – Aligns with current national pledges, no radical shifts in future global development trends, population peaks at 9.6 billion
• SSP3-7.0: Countries retreat from international cooperation, focus on their own economic goals, population peaks at 12.6 billion. “Not the world we’re heading toward right now.”
• SSP5-8.5: Global economic growth across the board fueled by burning coal, oil, natural gas, population peaks at 7 billion
Poss
ible
Clim
ate
Futu
res
Source: Vox
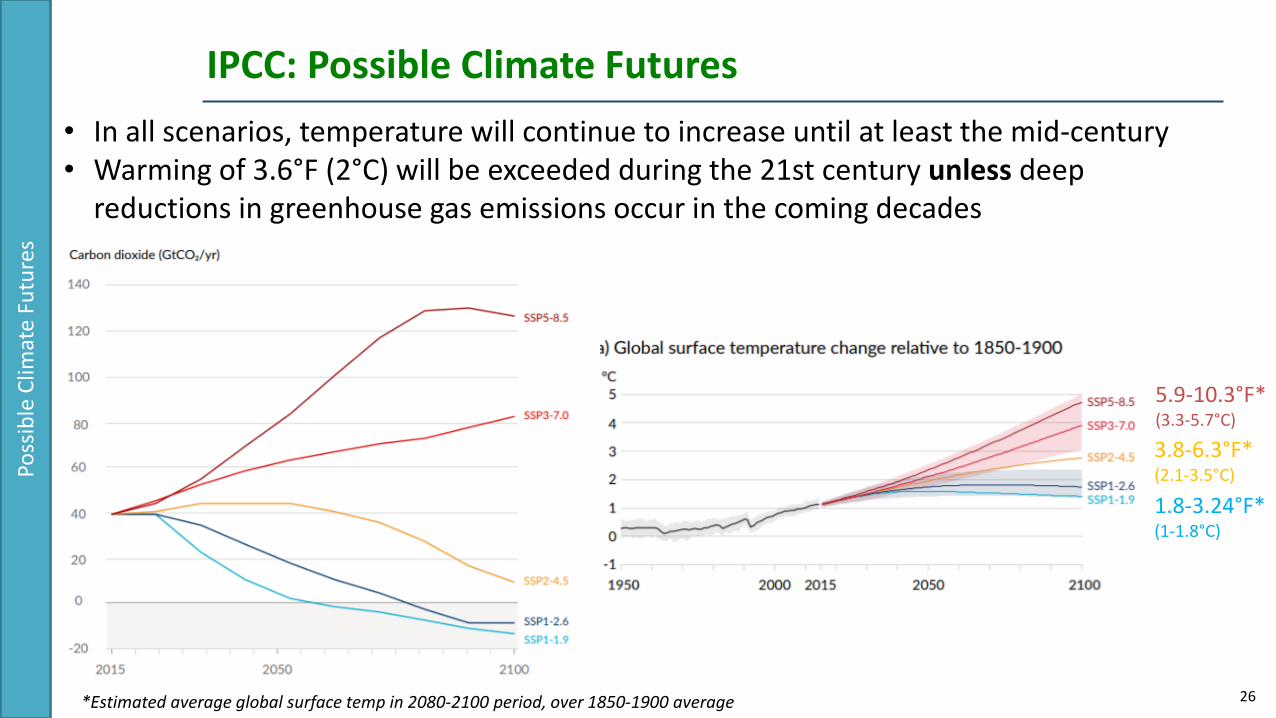
IPCC: Possible Climate Futures
26
1.8-3.24°F*(1-1.8°C)
3.8-6.3°F*(2.1-3.5°C)
5.9-10.3°F*(3.3-5.7°C)
• In all scenarios, temperature will continue to increase until at least the mid-century• Warming of 3.6°F (2°C) will be exceeded during the 21st century unless deep
reductions in greenhouse gas emissions occur in the coming decades
Poss
ible
Clim
ate
Futu
res
*Estimated average global surface temp in 2080-2100 period, over 1850-1900 average

IPCC: Extreme Weather Events: One in Ten-Year Heat Events
• A one-in-10-year extreme heat event now occurs 2.8 times in 10 years• These events will take place 4.1-9.4 times every 10 years, depending on future warming
27You are here
Poss
ible
Clim
ate
Futu
res
(2.2°F) (3.4°F) (4.7°F) (9.2°F)
(1.8°F) (2.7°F) (3.6°F) (7.2°F)

IPCC: Extreme Weather Events: One in 50-Year Heat Events
28
Poss
ible
Clim
ate
Futu
res
(1.8°F) (2.7°F) (3.6°F) (7.2°F)
(2.2°F) (3.6°F) (4.9°F) (9.5°F)

IPCC: Extreme Weather Events: One in 10-Year Heavy Rain Events*
29*One-day precipitation events
Poss
ible
Clim
ate
Futu
res
(1.8°F) (2.7°F) (3.6°F) (7.2°F)

IPCC: Extreme Weather Events: One in 10-Year Droughts*
*Agricultural and ecologicaldrought events in averageacross drying regions
30
Poss
ible
Clim
ate
Futu
res
(1.8°F) (2.7°F) (3.6°F) (7.2°F)

IPCC: WGI Interactive Atlas
31
Access the interactive atlas at: https://interactive-atlas.ipcc.ch/
Poss
ible
Clim
ate
Futu
res

IPCC: Carbon Sinks Lose Effectiveness Under High Emissions Scenarios
32
Poss
ible
Clim
ate
Futu
res

IPCC: Remaining Global Carbon Budget
33
43.1 billion tons of CO2 was emitted in 2019. If we maintain that level every year, we will pass the lowest estimated carbon budget (300 GtCO2) within 7 years.
Lim
itin
g Fu
ture
Clim
ate
Ch
ange

IPCC: Limiting Future Climate Change
• Each 1000 GtCO2 increase is likely to increase global surface temperature by 0.49°F (0.27°C) to 1.13°F (0.63°C)
• Achieving global net zero CO2
emissions is a requirement for stabilizing CO2-induced global surface temperature increases, with anthropogenic CO2 emissions balanced by anthropogenic removals of CO2
34
Lim
itin
g Fu
ture
Clim
ate
Ch
ange

IPCC: Unless…
• Limiting GHG emissions will lead to discernible effects on greenhouse gas and aerosol concentrations, and air quality, relative to high and very high GHG emissions scenarios
• Discernible differences in trends of global surface temperature would begin to emerge from natural variability within around 20 years
• By the end of the century, scenarios with very low and low GHG emissions would strongly limit the change of several climate impact drivers, and the number of regions where such exceedances occur
35
In short, 1.5C is better than 2C is better than 3C is better than 4C…
Lim
itin
g Fu
ture
Clim
ate
Ch
ange

Creating a Clean, Affordable and Resilient Energy Future for the Commonwealth
State of the LBE Portfolio

LBE Progress: Overall Emissions
37
• In FY20, overall portfolio emissions decreased by 524,000 metric tonnes of CO2e over the FY04 baseline, equivalent to a 40 percent reduction
• Roughly an 8% change over FY19, resulting from portfolio efforts & COVID-related closures
*FY20 data reflects impacts from COVID-related closures in March – June 2020.
1,323,467
872,454↓34%
799,034↓40%
0
200,000
400,000
600,000
800,000
1,000,000
1,200,000
1,400,000
FY04 FY05 FY06 FY07 FY08 FY09 FY10 FY11 FY12 FY13 FY14 FY15 FY16 FY17 FY18 FY19 FY20
MTC
O2
e
LBE Portfolio Overall Emissions Progress

LBE Progress: Emissions Changes Over Time
38
Fuel Oil10%
Grid Electricity
45%
Natural Gas35%
Other2%
Vehicles8%
Emissions by Fuel: FY12
Fuel Oil22%
Grid Electricity
50%
Natural Gas15%
Other1%
Vehicles6%
Emissions by Fuel: FY04
Fuel Oil5%
Grid Electricity
35%
Natural Gas50%
Other1%
Vehicles9%
Emissions by Fuel: FY20

LBE Progress: Change in Grid vs. Natural Gas Emissions
39
Since FY04, grid electricity emissions have beencut in half, shifting the relative contribution tooverall portfolio emissions from 50% to 35%.
Since FY04, the natural gas emissions have morethan doubled, shifting the relative contributionto overall portfolio emissions from 15% to 50%.
665,199
319,733
↓ -52%
-
100,000
200,000
300,000
400,000
500,000
600,000
700,000
FY04 Baseline FY19
MTC
O2e
Grid Electricity Emissions Changes over Baseline
200,621
428,788
↑ 114%
-
50,000
100,000
150,000
200,000
250,000
300,000
350,000
400,000
450,000
500,000
FY04 Baseline FY19
MTC
O2e
Natural Gas Emissions Changes over Baseline
↑ 101%
↓ 58%
FY20 FY20

LBE Progress: Onsite Fossil Fuel Emissions
40
• In FY20, portfolio onsite fossil fuel emissions decreased by 141,000 metric tonnes of CO2e over the FY04 baseline, equivalent to a 21 percent reduction
• Roughly a 6% change over FY19, resulting from portfolio efforts & COVID-related closures
*FY20 data reflects impacts from COVID-related closures in March – June 2020.

LBE Progress: Fossil Fuel Emissions Trends (% change)
41
FY19 FY20

0 20,000 40,000 60,000 80,000 100,000 120,000
Environ men tal Pol ice
Moun t Wachusett Comm. CollegeMassDEP - own ed
Cape Cod C omm. Co llege
Dept. of Fish and GameBerksh ire C omm. Co llege
Dept. of Fire Services
Mass . Bay Comm. CollegeRoxbury C omm. C ollege
Northern Essex C omm. Co llege
Holyoke Soldier's HomeBristol Comm. Col lege
Massasoit Comm. College
Quinsigamond Comm. CollegeNorth Sh ore Co mm. Col lege
Greenfield Community Col lege
Middlesex C omm. Co llegeHolyoke Co mm. Col legeChelsea Soldier's Home
Bun ker Hi ll Comm. Col legeSprin gfield Technical Comm. College
Dept. of Youth Services
Mass . College of Liberal ArtsMilitary Divis ion
Mass . College of Art & Des ignDiv. of Capi tal Asset Management
Mass . Maritime Acad emyWo rcester State Universi ty
Framingham State Univers ity
Salem State Univers ityMA Data Centers
Westfield State Universi ty
Fitchburg State Univer sityBridgewater State Univers ity
Bur eau of State Office Bu ildings
Dept. of Mental HealthDept. of Developmental Services
Dept. of Con servation and Recreation
Dept. of Publ ic HealthTrial Cou rt
UMass Boston
UMass Dar tmo uthUMass Lo well
Dept. of State Pol ice
MassDOT - Highway & Turnpike Divi sio nsMass . Water Resources Authori ty
Dept. of Cor rection
UMass MedicalMassPort Authori ty
UMass Amherst
FY20 Fossil Fuel Emissions by Entity
FY20: Fossil Fuel Emissions by Entity
42
Top 10 emitters comprise 71% of portfolio onsite fossil fuel emissions
UMass System and Executive Branch comprise 76% of portfolio emissions
Authority10%
Community College
3%
Courts
2%
State Agency
34%
State University
8%
UMass
43%
FY20 Fossil Fuel Emissions by Entity Type

LBE Progress: FY19 vs. FY20 Emissions Comparison
43
• COVID-related closures impacted roughly 3 ½ months of FY20 operations
• Grid electricity saw the most significant year-over-year decline (12%)
• Natural gas saw the most moderate decline (6%)
↓7%
↓12%
↓6%
↓17%
↓8%
0
50,000
100,000
150,000
200,000
250,000
300,000
350,000
400,000
450,000
500,000
Fuel Oil Grid Electricity Natural Gas Other Vehicles
MTC
O2
e
FY19 to FY20 Emission Changes by Fuel
FY19 FY20
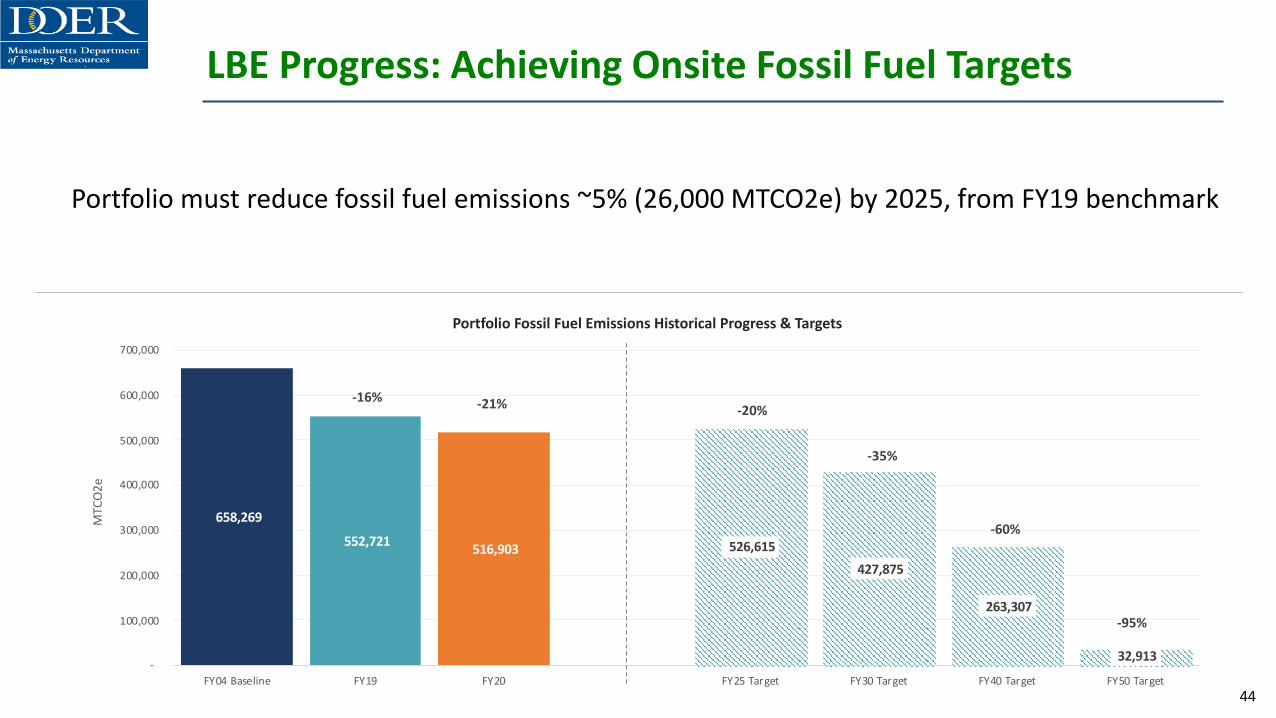
LBE Progress: Achieving Onsite Fossil Fuel Targets
44
Portfolio must reduce fossil fuel emissions ~5% (26,000 MTCO2e) by 2025, from FY19 benchmark
658,269
552,721 516,903 526,615
427,875
263,307
32,913
-16% -21% -20%
-35%
-60%
-95%
-
100,000
200,000
300,000
400,000
500,000
600,000
700,000
FY04 Baseline FY19 FY20 FY25 Target FY30 Target FY40 Target FY50 Target
MTC
O2
e
Portfolio Fossil Fuel Emissions Historical Progress & Targets

LBE Progress: Fuel Oil Reduction
45
• In FY20, fuel oil consumption decreased by 22M gallons over the FY04 baseline, an 86 percent reduction
• Have nearly eliminated fuel oils #4 and #6 from portfolio as of FY21
25.8M
4M↓84% 3.7M
↓86%
-
5
10
15
20
25
30
FY04 FY05 FY06 FY07 FY08 FY09 FY10 FY11 FY12 FY13 FY14 FY15 FY16 FY17 FY18 FY19 FY20
Mill
ion
s
Portfolio Fuel Oil Reduction Progress
#2 #4 #6 ULSD

LBE Progress: Achieving Fuel Oil Reduction Targets
46
Portfolio must reduce fuel oil by ~34% (1.4M gallons) by 2025, from FY19 benchmark
26,190,324
3,989,754 3,736,815
2,619,032 1,309,516
-85% -86%
-90% -95%
-
5,000,000
10,000,000
15,000,000
20,000,000
25,000,000
30,000,000
FY04 baseline FY19 FY20 FY25 Target FY30 Target
Portfolio Fuel Oil Consumption Historical Progress & Targets

LBE Progress: Energy Use Intensity
47
• In FY20, overall energy use intensity was roughly 164 kBtu/SF, a 22 percent reduction over FY04
• Roughly a 10% change over FY19, resulting from portfolio efforts & COVID-related closures
210 182↓14% 164
↓22%
0
25
50
75
100
125
150
175
200
225
FY04 FY05 FY06 FY07 FY08 FY09 FY10 FY11 FY12 FY13 FY14 FY15 FY16 FY17 FY18 FY19 FY20
kBtu
/SF
Portfolio Energy Use Intensity Progress

LBE Progress: Achieving Energy Use Intensity Targets
48
Portfolio must reduce overall EUI by ~7% (168 target EUI) by 2025, from FY19 benchmark
210 182
164 168 158
-14%
-22% -20% -25%
-
25
50
75
100
125
150
175
200
225
FY04 baseline FY19 FY20 FY25 Target FY30 Target
kBtu
/SF
Portfolio EUI Historical Progress & Targets

LBE Progress: Zero-Emission Vehicles
49
• Roughly 6,500 on-road vehicles in the state fleet
• Majority of fleet is lighter-duty (<14,000 GVWR), but truck and van heavy
• Currently ~2% are ZEVs (1% if excluding NEV/UEVs)
Conventional, 6348
NEV/UEV, 39
PHEV, 31
BEV, 43
ZEV, 113
Zero-Emission Vehicles in the State Fleet

LBE Progress: Achieving Zero-Emission Vehicle Targets
50
1%(97 ZEVs)
2%(113 ZEVs)
5%(~325 ZEVs)
20%(~1,300 ZEVs)
75%(4,875 ZEVs)
100% (~6,500 ZEVs)
0
1000
2000
3000
4000
5000
6000
7000
FY20 FY21 FY25 Target FY30 Target FY40 Target FY50 Target
State Fleet ZEV Progress & Targets
Portfolio must acquire an additional ~215 ZEVs by 2025, from FY20 baseline
35 43
2731
3539
FY20 FY21
FY ZEV Breakdown
BEV PHEV NEV/UEV

LBE Progress: EV Charging Stations
51
• 248 charging stations installed (possibly more once FY21 data are collected)
• 214 (86%) are level 2, with 22 DC fast chargers
• 2/3 are publicly accessible with no restrictions; ~35 are dedicated for fleet charging
Level 1 Chargers, 12, 5%
Level 2 Chargers, 214,
86%
Fast Chargers, 22,
9%

LBE Progress: Achieving EV Charging Station Targets
52
Portfolio must install an additional ~100 EV stations by 2025, from FY20 baseline
228
248(and counting…)
350
500
0
100
200
300
400
500
600
FY20 FY21 FY25 Target FY30 Target
Portfolio EV Charging Station Progress & Targets
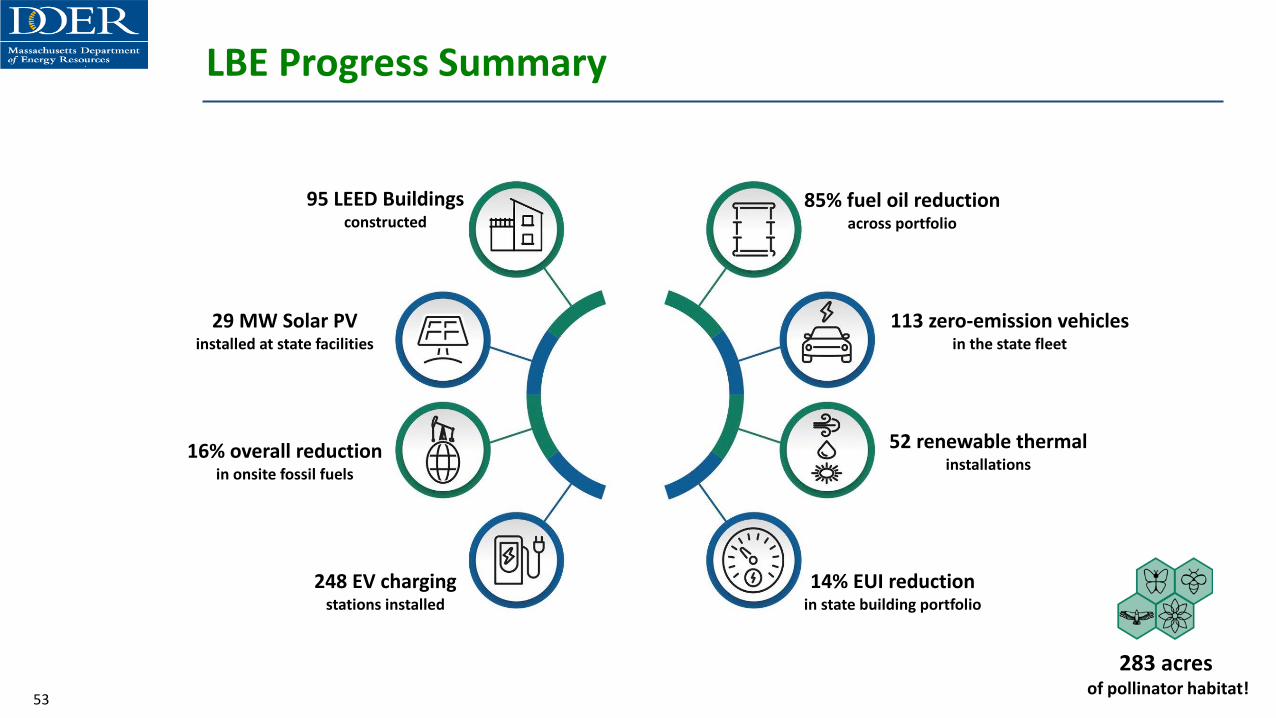
95 LEED Buildingsconstructed
29 MW Solar PV installed at state facilities
16% overall reduction in onsite fossil fuels
248 EV charging stations installed
85% fuel oil reduction across portfolio
113 zero-emission vehicles in the state fleet
52 renewable thermal installations
14% EUI reductionin state building portfolio
LBE Progress Summary
53
283 acres of pollinator habitat!

Creating A Clean, Affordable, Equitable and Resilient Energy Future For the Commonwealth
Heat Pumps 101

Efficient electrification with heat pumps

Outline
• Some basics
• Efficient Electrification
• Case Studies – New Construction
• Retrofitting considerations

Definitions
Electrification:
“i·lek·truh·fi·kay·shn”
The process of swapping from fuel-based space and water heating to electricity-based space and water
heating.
Efficient electrification:
Electrification using equipment with efficiencies in the order of 300%.

Source and distribution
Heat Pump
Source Distribution
Direction of energy

Source and distribution
Heat Pump
Source Distribution
Direction of energy
Let’s discuss “source” side first

Air source heat pump
Heat Pump
AirSource Distribution
building
ground
Outside air

Ground source heat pump
Heat Pump
Distribution
building
ground
GroundSource
Outside air
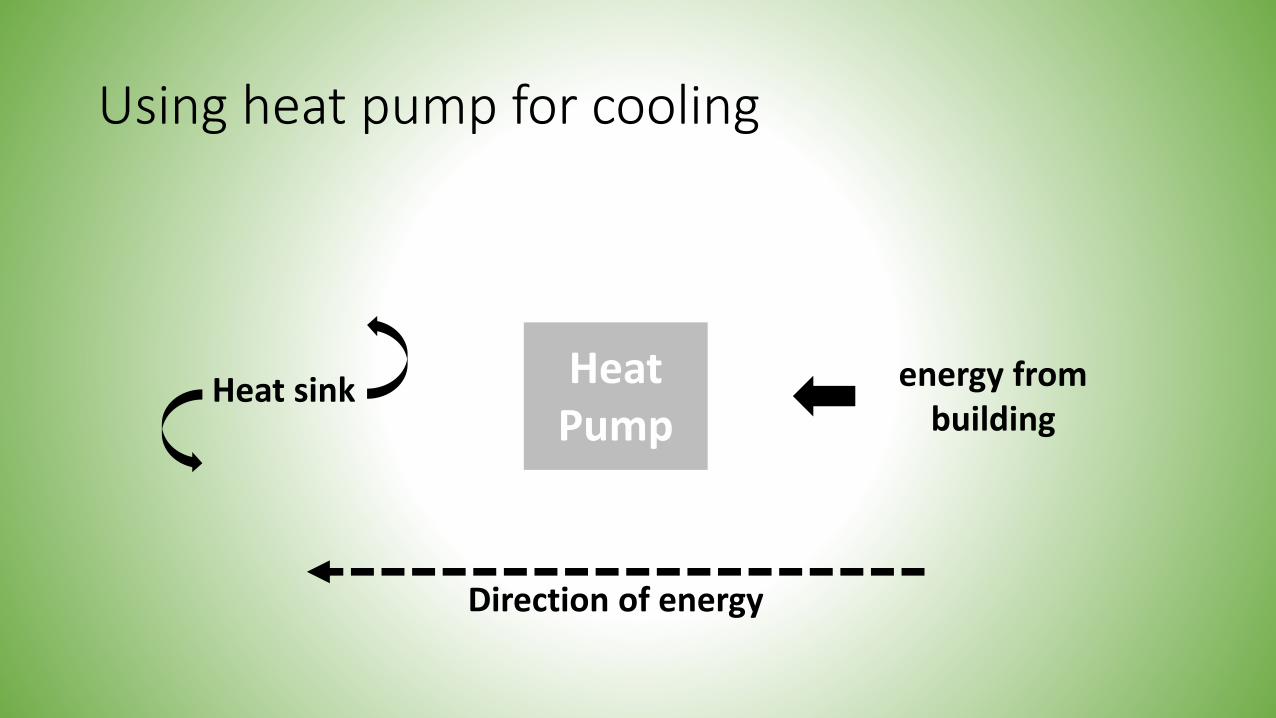
Using heat pump for cooling
Heat Pump
Heat sink energy from building
Direction of energy

Air source heat pump
Heat Pump
Heat sink to air
building
ground
Outside air
energy from building
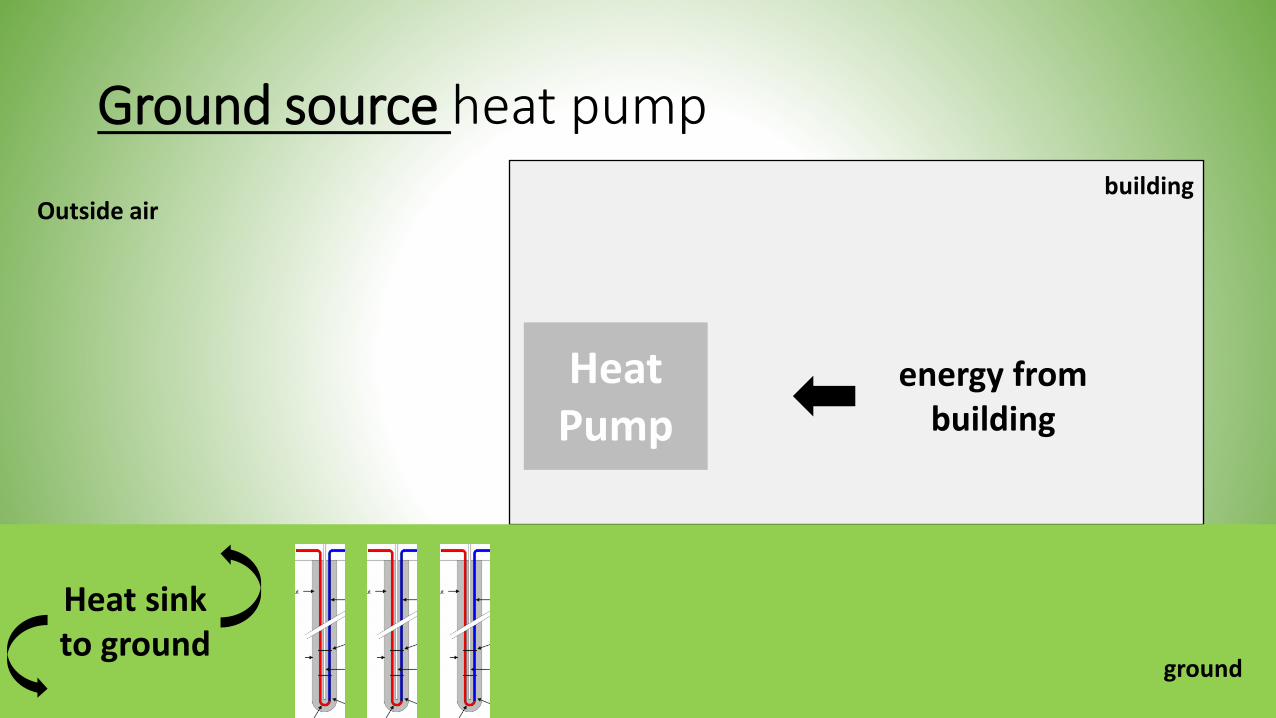
Ground source heat pump
Heat Pump
building
ground
Heat sink to ground
Outside air
energy from building

Water source heat pump (aka “fuel source”)building
building
ground
In this system, a boiler and anoutdoor evaporative unitmaintain a source of water atsteady temperature which issupplied to pumps in thebuilding.
In this case, the source of theBTUs is neither the groundnor the air – the source isfuel.
This approach is notelectrification!
BoilerEvap
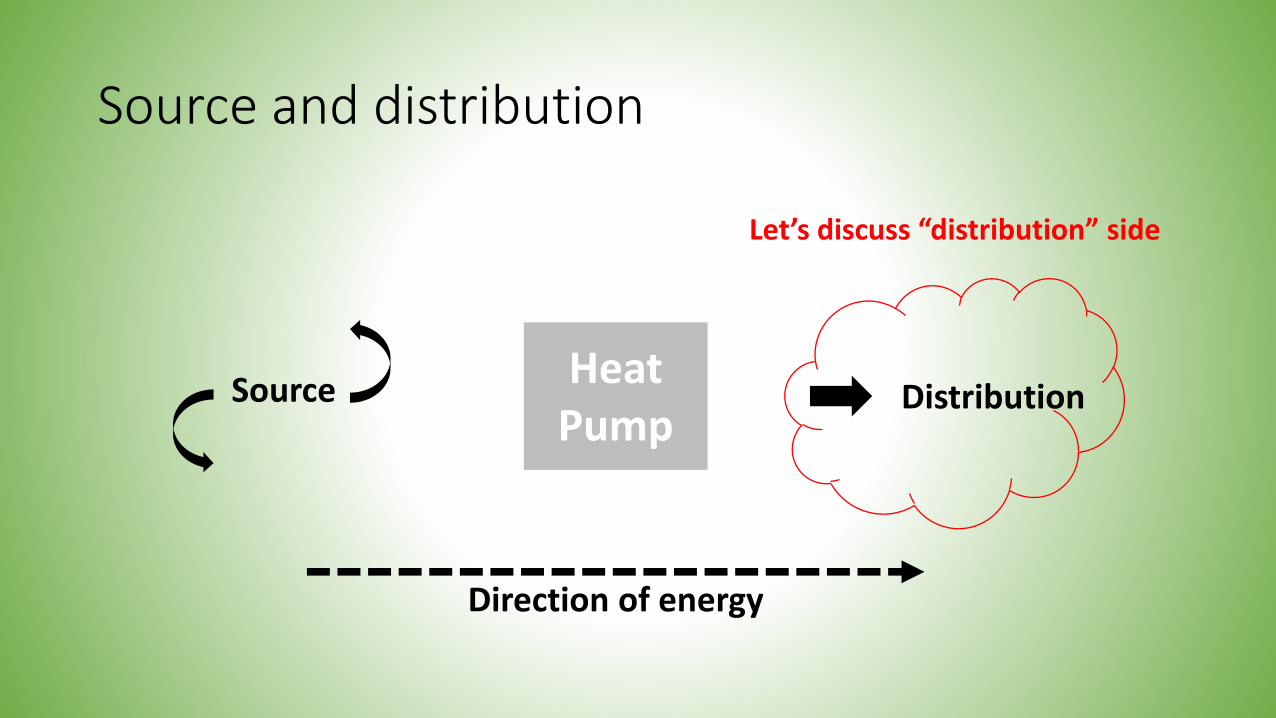
Source and distribution
Heat Pump
Source Distribution
Direction of energy
Let’s discuss “distribution” side
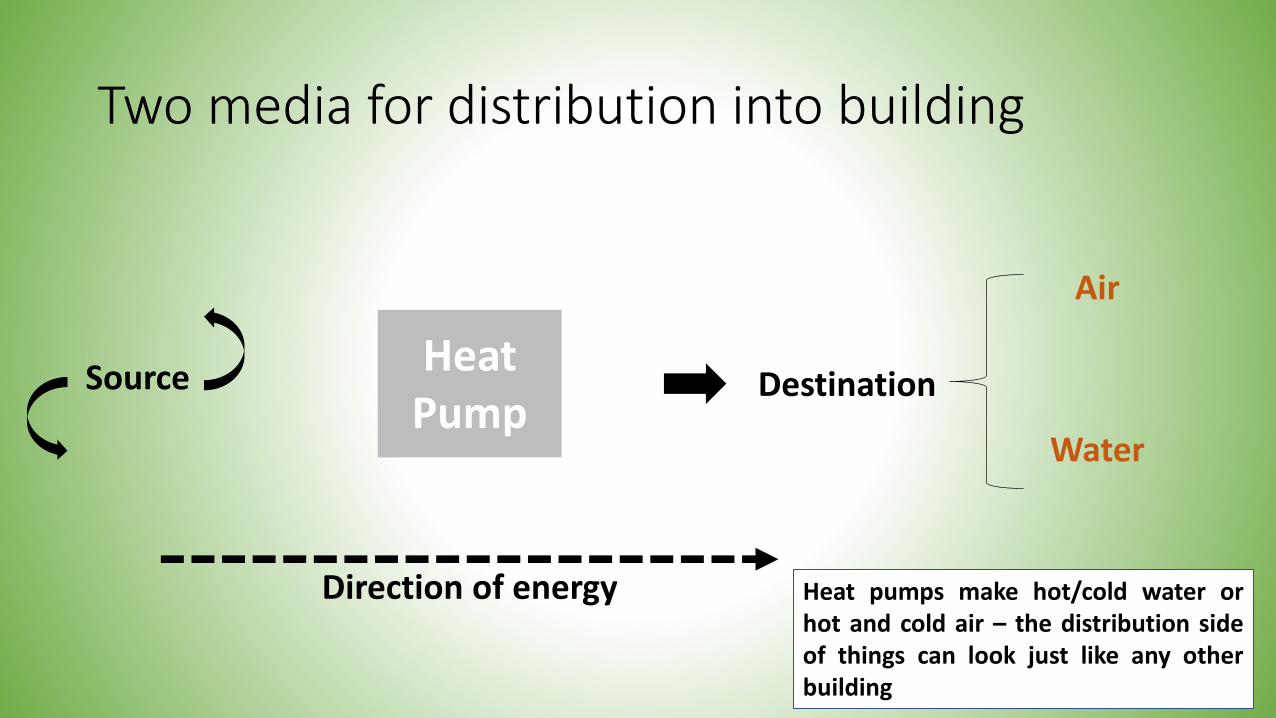
Two media for distribution into building
Heat Pump
Source Destination
Direction of energy
Air
Water
Heat pumps make hot/cold water orhot and cold air – the distribution sideof things can look just like any otherbuilding

Classifying heat pumps for efficient electrification (4 permutations!)
Air
Ground
“to”Air
Water

Classifying heat pumps (4 permutations!)
Air
Ground
“to”
A “variable refrigerant flow” or VRF system is a kind of air to air (or ground to air) system which distributes the destination air deep into the building
floorplate. A VRF system is just a kind of heat pump!
Air
Water

Outline
• Some basics
• Efficient Electrification
• Case Studies – New Construction
• Retrofitting considerations

Pounds of emissions to deliver 1 MMBtu of heat into a space (in 2020)

PROPANEOIL GAS
Pounds of emissions to deliver 1 MMBtu of heat into a space (in 2020)
145170 120

PROPANEOIL GAS ELECTRICCOLD CLIMATE
AIR SOURCEHEAT PUMP
ELECTRIC GROUND SOURCE
HEAT PUMP
Pounds of emissions to deliver 1 MMBtu of heat into a space (in 2020)
145170 120 60 43
50% Less
ELECTRICResistance
193

Electric Grid Emissions: Lower each Year
Hydropower Solar Wind
Massachusetts electric grid emissions decline each year with investment in hydro, solar, and wind.

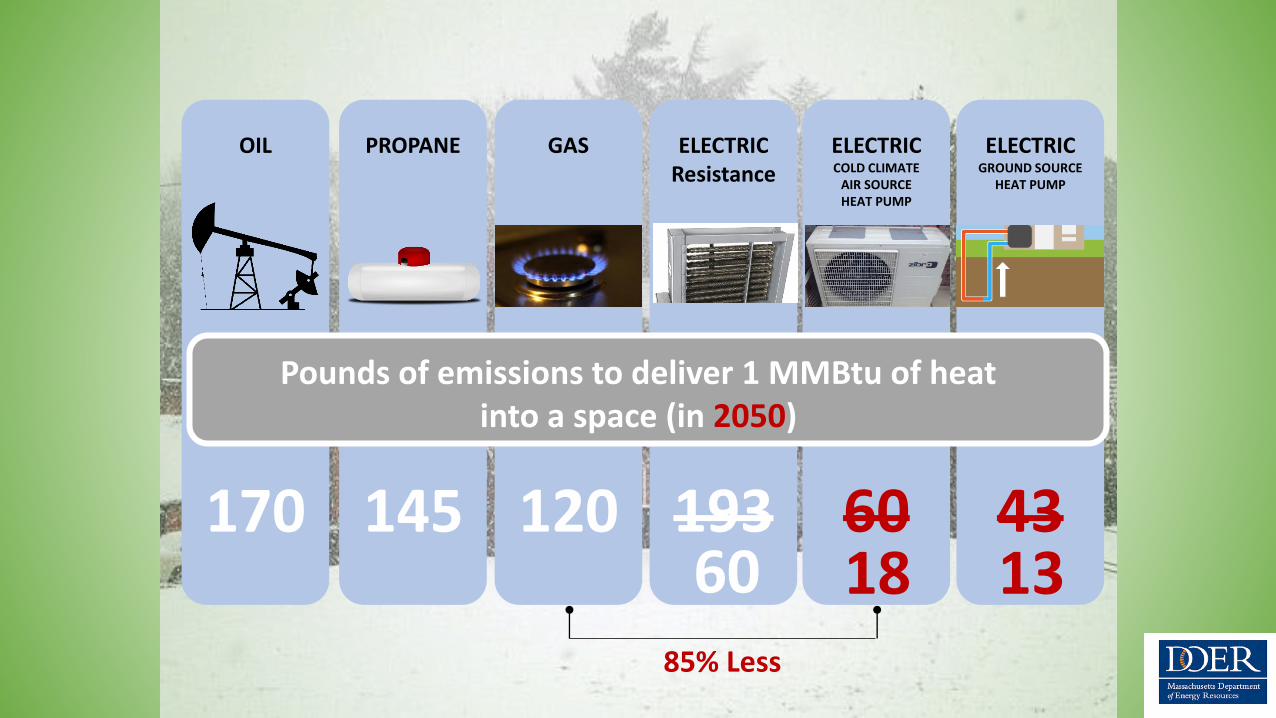
PROPANE
145
OIL
170
GAS ELECTRICCOLD CLIMATE
AIR SOURCEHEAT PUMP
ELECTRIC GROUND SOURCE
HEAT PUMP
120 60 43
Pounds of emissions to deliver 1 MMBtu of heat into a space (in 2050)
18 1385% Less
ELECTRICResistance
19360
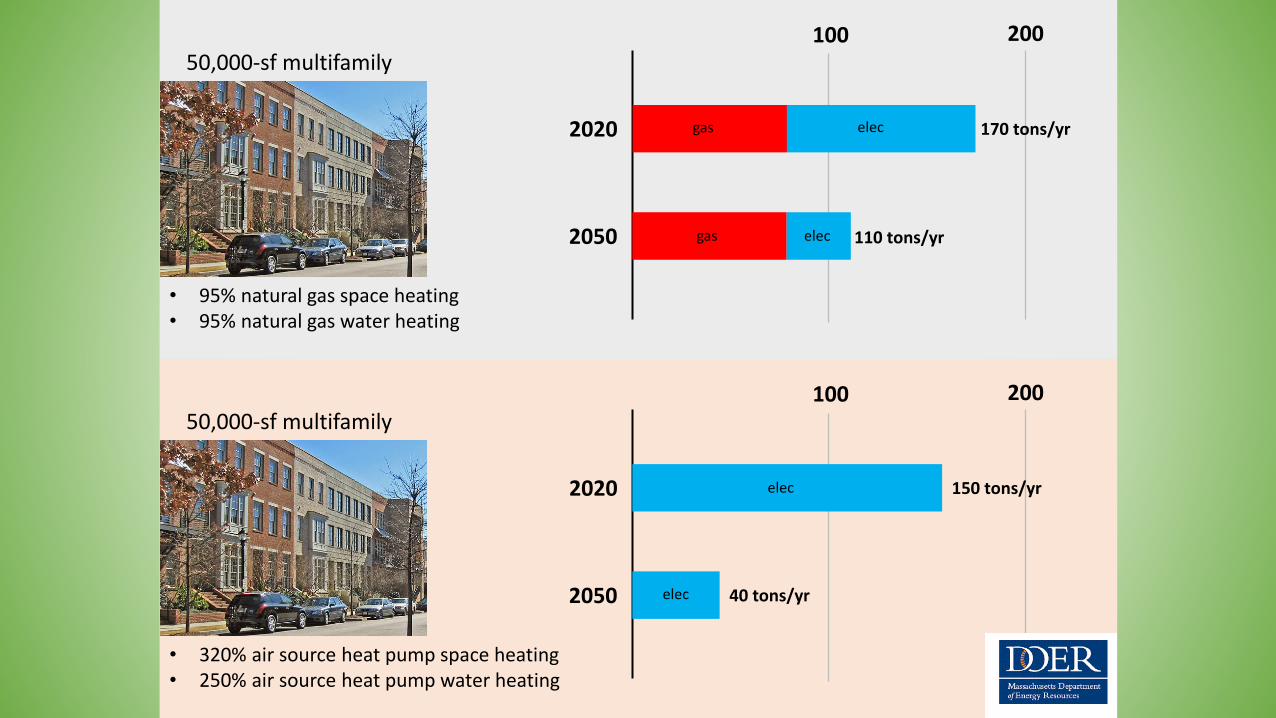
50,000-sf multifamily
50,000-sf multifamily
• 95% natural gas space heating• 95% natural gas water heating
• 320% air source heat pump space heating• 250% air source heat pump water heating
2020
100 200
2050
2020
100 200
2050
170 tons/yr
110 tons/yr
150 tons/yr
40 tons/yr
gas
gas
elec
elec
elec
elec
Outline
• Some basics
• Efficient Electrification
• Case Studies – New Construction
• Retrofitting considerations

New Construction – Air to AirWalden Visitor Center• Variable Refrigerant Flow Heat Pump
• 6,000 sf vaulted ceilings, large open spaces
• Focus on energy efficient design w/ super insulation and triple-glazed windows.
• Net-zero with onsite PV

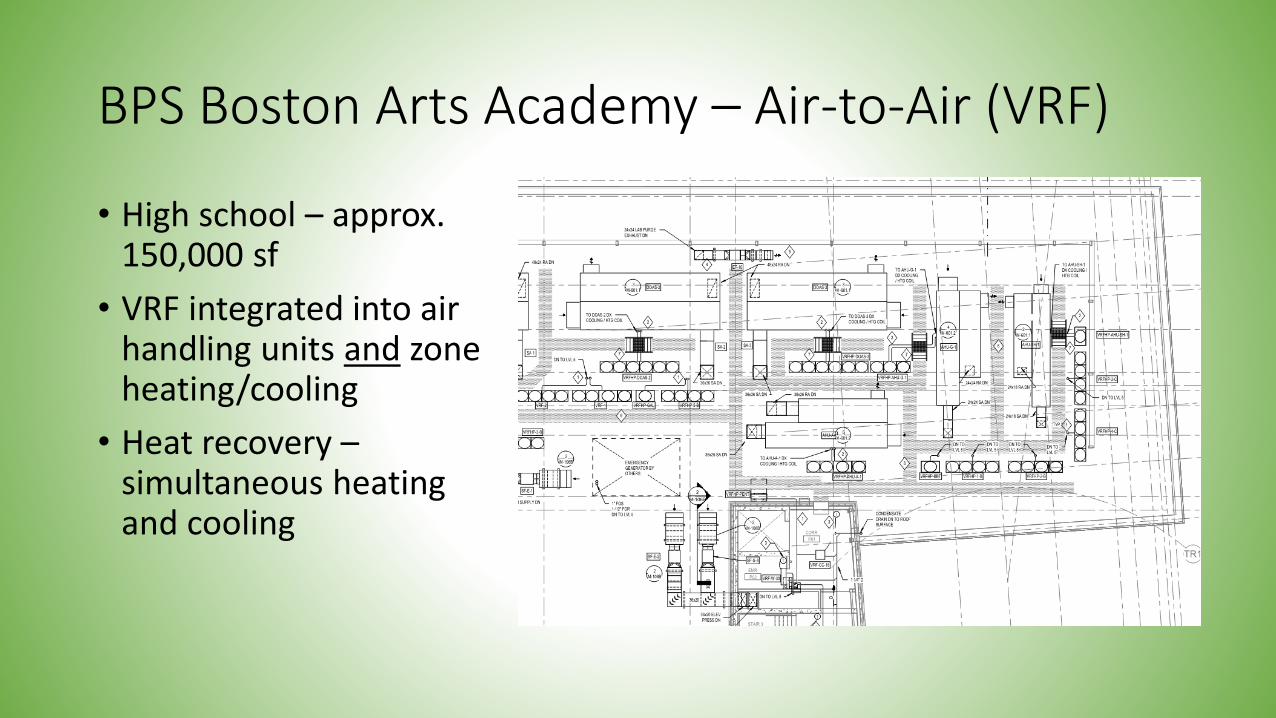
BPS Boston Arts Academy – Air-to-Air (VRF)
BPS Boston Arts Academy – Air-to-Air (VRF)
• High school – approx. 150,000 sf
• VRF integrated into air handling units and zone heating/cooling
• Heat recovery –simultaneous heating and cooling

BPS Boston Arts Academy – Air-to-Air (VRF)

New construction – Ground to waterSbrega Science and Health Science Building• High Performing
Building Envelope
• Energy Recovery Ventilation
• Targeted laboratory ventilation
• Ground to Water Heat pump
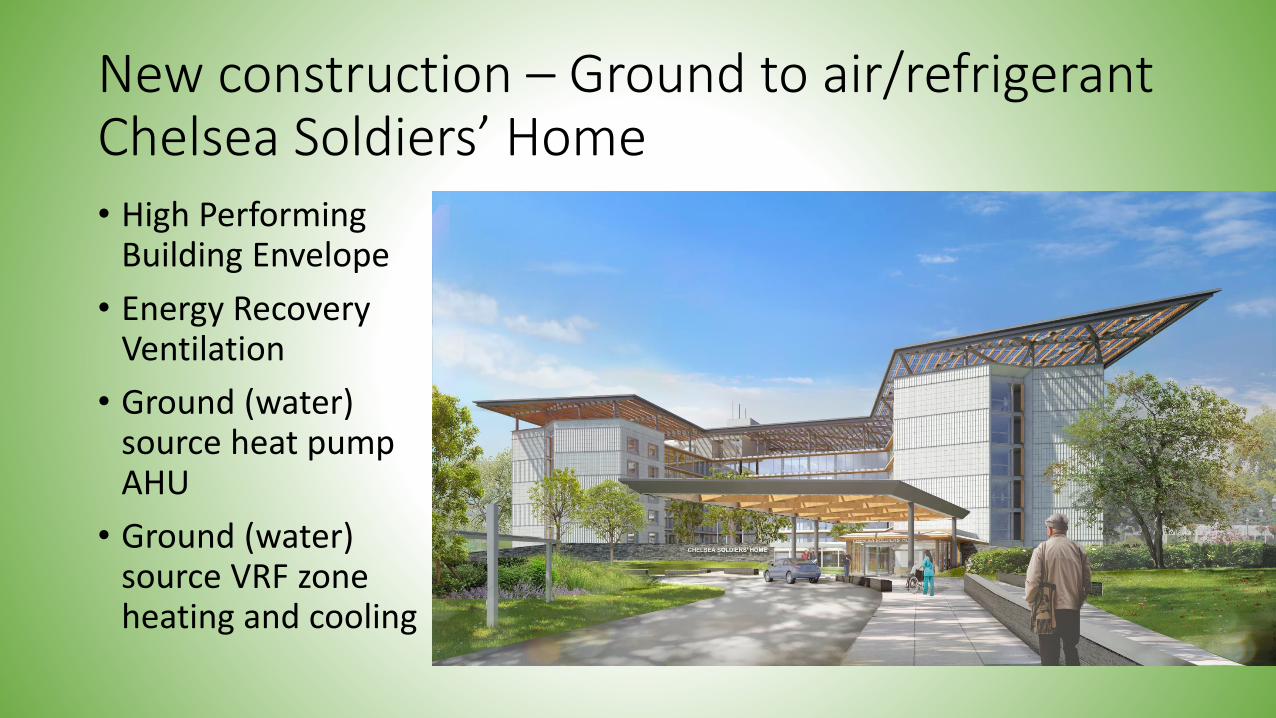
New construction – Ground to air/refrigerantChelsea Soldiers’ Home• High Performing
Building Envelope
• Energy Recovery Ventilation
• Ground (water) source heat pump AHU
• Ground (water) source VRF zone heating and cooling

New construction – Ground to air/refrigerantChelsea Soldiers’ Home
Ground-source VRF
Ground-source DHW

Air-to-water heat pumps
• An air-to-water heat pump is analogous to a boiler and chiller. This is familiar. Little or no perceived changes outside the mechanical room.
• Works with hydronic distribution (hot water heating)
• Most cost-effective in medium and large buildings (>25,000 sf)• Can supply 100% of heating (low/medium EUI buildings) or hybrid
electrification (large buildings with high EUI)
• New construction – decoupled systems are best• Retrofit – connect to existing hydronic distribution. Consider expanding use
of hydronic heating. Retrofit for low-temperature hot water and decoupled systems.

Air-to-water heat pumps
• Good: distribute hot water to preheat (air handler) and reheat (zone) coils. Assumes DX cooling (air), no chilled water. Common in smaller buildings. VRF may be better application.
• Better: distribute hot water to preheat and reheat coils. Chilled water coils in AHU. Opportunities for heat recovery.
• Best: decoupled system. Distribute hot water and chilled water to AHU and zone terminals (fan coil units, fan powered boxes, chilled beams)

Modular Packaged
2-Pipe 4-PipeHW or CHW HW and CHW
Air-to-water heat pumps

Heating Mode Performance
Ambient Temp HW Supply Temp Output Capacity Efficiency
(°F) (°F) MBH COP
-10 170 355 1.85
0 170 450 1.87
10 170 450 2.02
30 170 450 2.2
50 170 450 2.27
-10 145 338 1.87
0 145 400 2
10 145 400 2.11
30 145 400 2.39
50 145 400 2.75
-10 120 292 2.3
0 120 364 2.31
10 120 364 2.62
30 120 364 2.99
50 120 364 3.28
-10 100 275 2.41
0 100 339 2.56
10 100 339 2.88
30 100 339 3.37
50 100 339 3.67
Ambient temperature COP
Hot Water Temperature COP
How low is too low?
Temperature and COP

Do heat pumps need gas “backup” if too cold?(Answer: No)
Back-in-the-day, heat pumps did not work below about 40 F.
Today, heat pumps work down to negative 15 F and have x2 to x3 better efficiency than gas systems at 5 F.
• Step 1: make your building energy efficient (load reduction)
• Step 2: evaluate heating load
• Step 3: low temperature hot water
• Step 4: Heat recovery chiller (electrification)
• Step 5: Heat pump (electrification)
Building Efficiency

Pros• Cost (no drilling)• COP• Flexibility (location)• Predictable Capacity• Scalability• Retrofit• Eligible for utility incentives• Eligible for alternative energy
credits (3x multiplier, 5x for ZNE)
Cons
• Space
• HW Temperature
• Noise
• Glycol
Air-to-water heat pumps – Pros/Cons

Outline
• Some basics
• Efficient Electrification
• Case Studies – New Construction
• Retrofitting considerations

Retrofits: Envelope performance
Heat pump heating is lower temperature than heating with fossil fuel furnace or boiler.
If the building being retrofitted is leaky, swapping from fossil fuel to heat pump equipment can result in serious complaints
It’s essential that air leakage and envelope performance be addressed first in a retrofit.

Retrofits: Compatibility
In many existing buildings, the fan coils, radiators, and other terminal units are designed to receive high-temperature hot water.
Heat pump output is usually lower temperature than these units were initially designed for.
A designer needs to carefully assess the terminal units to evaluate possible performance impacts with lower temperature inputs. Terminal unit modifications may be required.

TEMPERATURE AND COP
Coil Selection Water-to-Water Booster
Retrofits: VRF
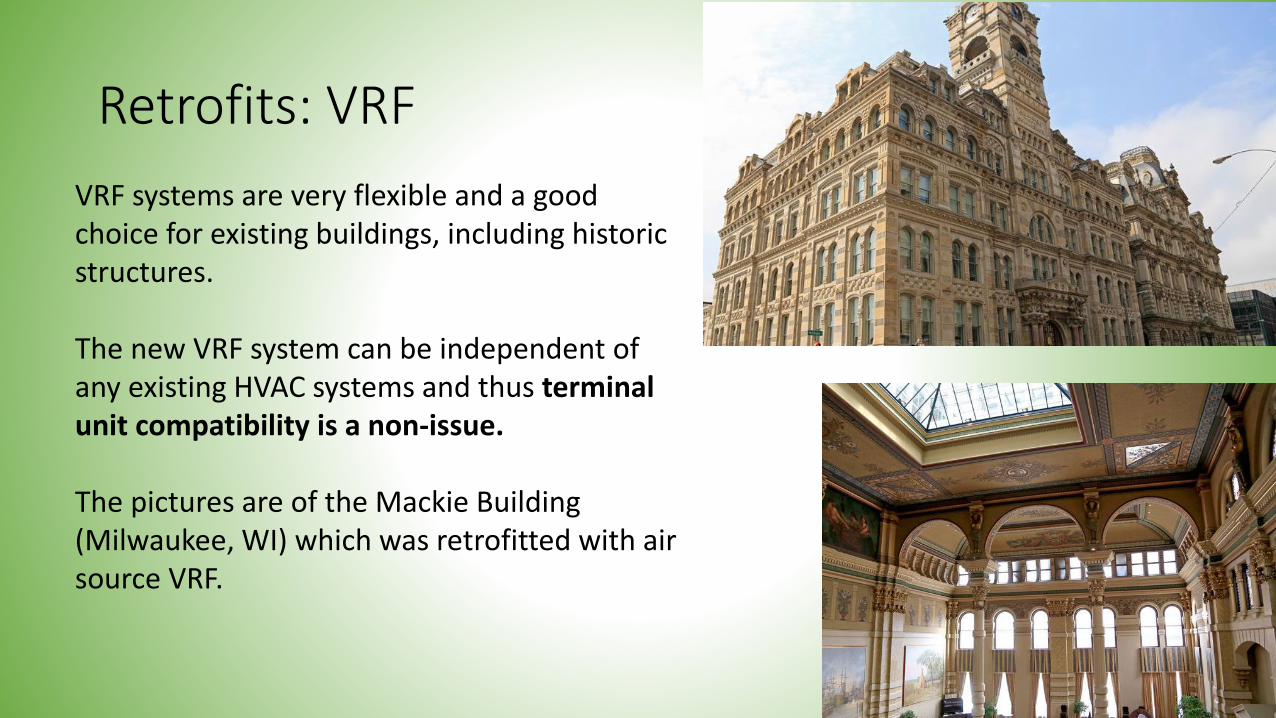
VRF systems are very flexible and a good choice for existing buildings, including historic structures.
The new VRF system can be independent of any existing HVAC systems and thus terminal unit compatibility is a non-issue.
The pictures are of the Mackie Building (Milwaukee, WI) which was retrofitted with air source VRF.

Ball State: District Ground to Water SystemBall State is an example of a ground to water heat pump systems which serves a group (district) of buildings.
Massachusetts has many district steam systems. Retrofitting steam systems to ground to water would require (1) complete replacement of the steam plant and distribution network and (2) retrofitting all buildings’ terminal units to accommodate lower temperature water.
(Keep in mind, the new ground to water system would be heating and cooling)

Stanford: District Air to Water System
Stanford is an example of an air to water heat pump systems which serves a group (district) of buildings.
Transitioning from steam to air to water would also require (1) complete replacement of the steam plant and distribution network and (2) retrofitting all buildings’ terminal units to accommodate lower temperature water.
This air to water systems does heating and cooling.

Heat pump service water heating
Don’t forget service water heating!
Off the shelf, heat pump service water heating appliances are readily available and can be used in homes, townhouses, and offices.

Creating A Clean, Affordable, Equitable and Resilient Energy Future For the Commonwealth
Heat Pumps: Public Entity Perspectives

Woburn Senior CenterASHP

HEAT PUMP PROJECT OVERVIEW
• In an effort to meet the city’s energy reduction goals we installed Air Source Heat Pumps (ASHPs) to replace 2 oil fired furnaces and more than a dozen window AC units
• Working with Spark and Horizon on a phased approach the project was completed over 2 years, in two phases
• With all projects especially those on older buildings there were many obstacles (Power, Hazardous materials, Mounting locations)
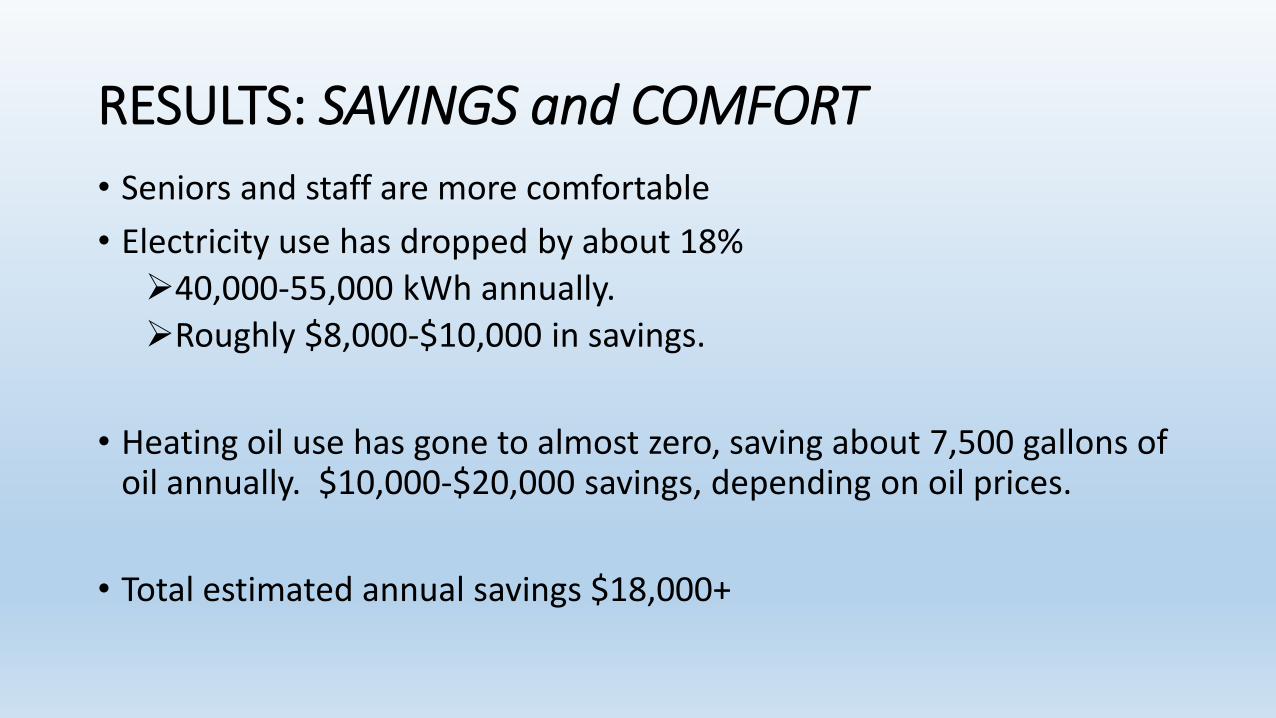
RESULTS: SAVINGS and COMFORT
• Seniors and staff are more comfortable
• Electricity use has dropped by about 18%
➢40,000-55,000 kWh annually.
➢Roughly $8,000-$10,000 in savings.
• Heating oil use has gone to almost zero, saving about 7,500 gallons of oil annually. $10,000-$20,000 savings, depending on oil prices.
• Total estimated annual savings $18,000+


Lessons Learned
• Planning, Planning, Planning !!!
• Things to Consider:➢Your Building Management System➢The Building’s Power Capacity ➢Condensate Drains When Choosing Equipment
• Potential hazards from building materials
• Types of equipment:➢Wall Units➢Ceiling Cassettes➢Cold climate➢VRF
• Training for staff and maintenance personnel, manuals & warranty's
• Added equipment needed to connect to building management sys.

This has been a great project for the Woburn Senior Center
Staff and seniors alike have really enjoyed the climate comfort
Woburn is benefitting from the energy savings
Success of this project would not have been possible without:
Susan McPhee from Spark
Mike Sciaraffa from Horizon Solutions
Paul Medeiros Woburn Facilities
Marie Lingblom Woburn Senior Center Director
Scott Galvin Mayor City of Woburn
Please feel free to contact us if you have any questions
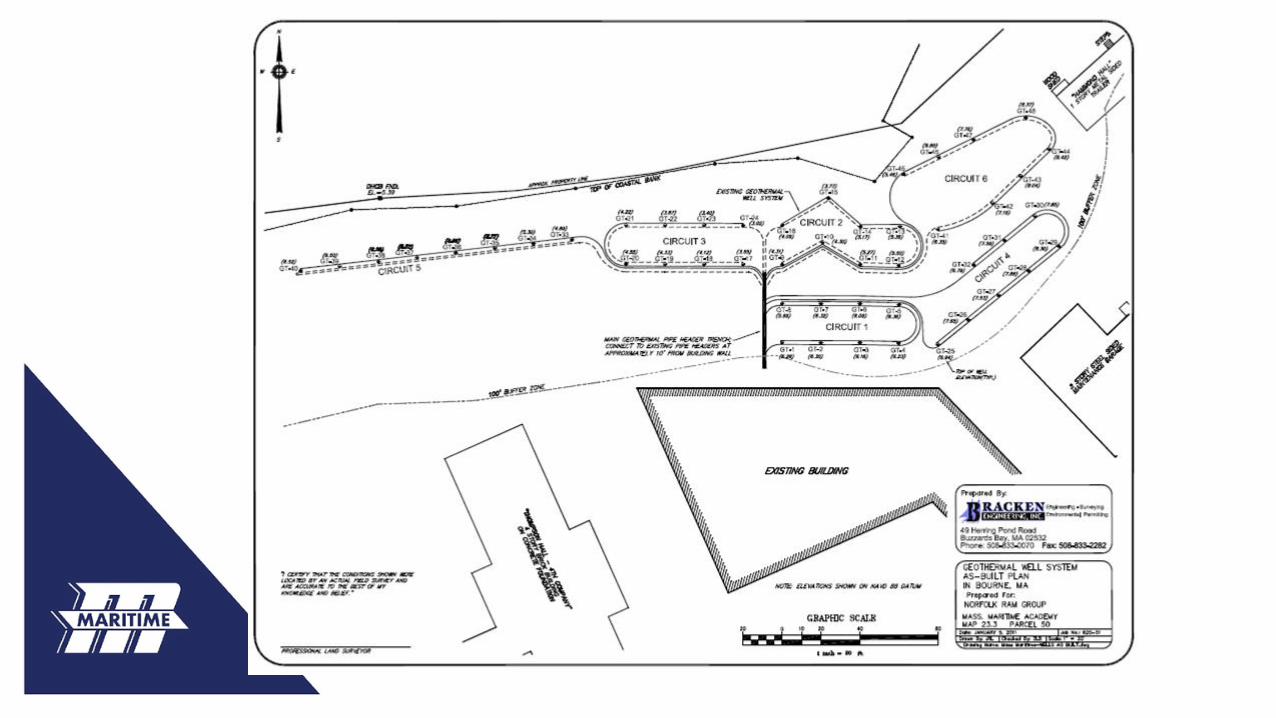
Ground Source Heat Pumpat the
ABS Information Commons
MASSACHUSETTS MARITIME ACADEMY PRESENTATION BY:
Kathy Driscoll - Director of Safety & Sustainability

AboutMMA Geothermal System
The ground source heat pump was installed in 2010-
2011:
● Part of DCAMM library modernization project -
campus resource hub
● Cost ~$800K for 48-well vertical closed-loop
system at 405’
● Groundwater temperature is 54-55oF
● Provides 120 tons for heating and cooling through
chilled beam distribution system
● Installed by National Geothermal

Lessons Learned 1. Initial sequence of operations did not conform to
building conditions
a. Worked with controls company to adjust
operation of chilled water and heat pumps
b. Identified that the building required constant
cooling throughout the year and system required
reconfiguration
2. Draining of glycol tank identified a leak in the system
3. Initial pumps were sized too small to properly handle
the flow rate needed
4. Humidity sensors needed in the chilled beam system to
avoid condensate problems
ALWAYS complete building and equipment commissioning

System Benefits 1. Dual heating and cooling allows for better building
conditions and occupant comfort• Can not please every occupant temperature wise
1. Building use has increased due to its comfort and
ambiance• Now open until 10:00 pm weekdays
1. Back up boiler rarely needed to supplement
heating capabilities
2. No mechanical sound impacts in and around the
building
3. Closed loop system requires less electricity

Creating a Clean, Affordable and Resilient Energy Future for the Commonwealth
Next LBE Council Meeting
Save the Date!Tentative:
Tuesday, November 9th
10:00 am–12:00 pm
115
Upcoming Tentative Meeting Dates:
January 11th
March 8th
May 10th
National Drive Electric WeekSeptember 25 – October 3
Free ride-and-drive events!
Roxbury Community College, September 25th, 10a – 2p
Lawrence Municipal Airport October 2nd, 2p – 6p
Holyoke Veterans’ Memorial Park, October 6th, 4p – 6p
Other Key Dates
Climate WeekSeptember 20-24
LBE ‘Ask the Experts’ Sessions
Peak demand
EVs and EVSE
Solar PPAs