
Leadership Patterns, Civic Engagement, and … Patterns, Civic Engagement, and Quality of Life...
30
Leadership Patterns, Civic Engagement, and Quality of Life Amenities in Small Iowa Towns May 2016
Transcript of Leadership Patterns, Civic Engagement, and … Patterns, Civic Engagement, and Quality of Life...
Leadership Patterns, Civic Engagement, and Quality of Life Amenities in Small Iowa Towns
May 2016

Stephen Sapp, Deborah Tootle, Sela Harcey, Crystal Peoples and Scott Thompson participated as researchers in the study that is the basis of this report.
Report design and layout by Renea Miller, cover design by Nick Van Berkum, Department of Sociology, Iowa State University.
Funding was provided by a 2014 grant provided by the National Institute of Food and Agriculture, U.S. Department of Agriculture (grant # 2013-05186).
Iowa State University does not discriminate on the basis of race, color, age, ethnicity, religion, national origin, pregnancy, sexual orientation, gender identity, genetic information, sex, marital status, disability, or status as a U.S. veteran. Inquiries regarding non-discrimination policies may be directed to Robinette Kelley, Director, Office of Equal Opportunity, Title IX/ADA Coordinator, and Affirmative Action Officer, 3350 Beardshear Hall, Ames, Iowa 50011, Tel. 515 294-7612, email [email protected].

Leadership Patterns, Civic Engagement, and Quality of Life Amenities In Small Iowa Towns—i
Table of Contents
Introduction ......................................................................................................................................1Case Study Towns ............................................................................................................................3Community Social Climate in 1994 and 2014 .................................................................................5Leadership Patterns ..........................................................................................................................8
Shared Leadership ....................................................................................................................9Centralized Leadership ..........................................................................................................10Local Business Owners and Managers ..................................................................................13
Amenities and Quality of Life .......................................................................................................15Natural Resource and Outdoor Recreational Amenities ........................................................15Indoor Recreational/Entertainment/Cultural Amenities ........................................................16Public and Private Service Amenities ....................................................................................17Downtown Amenities .............................................................................................................19Overall Amenity Averages .....................................................................................................20
Conclusion .....................................................................................................................................23
ii— Leadership Patterns, Civic Engagement, and Quality of Life Amenities In Small Iowa Towns
List of Figures
Figure 1. Community Social Capital: Percent of Residents in 1994 Who Agreed or Strongly Agreed with the Statement ...............................................................................................6
Figure 2. Percent of Residents Who Report Being Civically Engaged in 2014 ..............................6Figure 3. Ratings of Leaders in the Larger Towns Compared to the Average for All Sampled
Towns .............................................................................................................................10Figure 4. Ratings of Leaders in the Smaller Towns Compared to the Average for All Sampled
Towns .............................................................................................................................11Figure 5. Residents’ Views of Local Leadership for Towns with More than 3,500 Population ....11Figure 6. Residents’ Views of Local Leadership for Towns with Less than 3,500 Population .....12
List of Tables
Table 1. Case Study Towns ..............................................................................................................3Table 2. Natural Resource Amenities in the County .....................................................................16Table 3. Built Outdoor Recreational Amenities within or Adjacent to City Limits ......................17Table 4. Indoor Recreational/Entertainment/Cultural Amenities within the City Limits
or in an Unincorporated Area within a Ten Mile Drive of Town ....................................18Table 5. Public and Private Service Amenities Located within or Adjacent to the
City Limits .......................................................................................................................19Table 6. Downtown Amenities ......................................................................................................20Table 7. Overall Amenity Scores ...................................................................................................21
Leadership Patterns, Civic Engagement, and Quality of Life Amenities In Small Iowa Towns—1
Leadership Patterns, Civic Engagement, and Quality of Life Amenities in Small Iowa Towns
By Terry L. Besser
IntroductionIowa is a state of small towns. It contains 921 incorporated places each with fewer than 10,000 residents.1 About 40 percent of Iowans live in these small towns. In contrast, ten percent of Illinois residents, 22 percent of Missourians, and 25 percent of Minnesotans live in non-metropolitan areas. Only ten states have a larger proportion of residents residing outside the direct sphere of influence of a major city.2 Even though the proportion of Iowans living in small towns and rural areas has decreased over the last century, the fate of these places still matters to state policy makers and the general public.
The importance of small towns to Iowa, and the nation as a whole, prompted researchers at Iowa State University to secure funding in 1994, 2004, and 2014 to study the quality of life in, and the unique challenges faced by, these places. Each of the studies included a survey of a random sample of 150 residents in each town. An overview of these studies as well as their findings is available at http://www.soc.iastate.edu/rdi/99communitystudy/index.html. This report focuses on a component of the 2014 study which examined a subsample of six towns from the original sample to learn how residents implement community betterment projects and to inventory their amenities. Amenities are facets of a community that contribute to residents’ quality of life and overall satisfaction. They include natural resources (such as lakes, rivers, and forests); built outdoor recreational infrastructure (e.g. trails, tennis courts, aquatic centers); cultural, entertainment, and recreational venues (like
festivals, theaters, museums); the vitality of the downtown; and the quality of the public and private services in town such as medical and educational services. High quality amenities help to attract new residents and retain current ones. Moreover, recent research concludes that the quality of local amenities is significantly correlated with economic vitality, which in turn, provides the resources for more and better amenities.3
To understand how community improvement projects are implemented, an examination of local leadership is essential. By leadership we mean the qualities possessed by the individuals who are active in one way or another in promoting community betterment, and the nature of the relationship between those individuals. Leaders may hold official positions in the community, but many do not. The more successful leaders are able to inspire and motivate others to work together to achieve a goal. They also help others implement projects for which they have no personal interest as a way to reciprocate past support and to show their commitment to overall community welfare. Effective leaders can mobilize resources through their connections with others in the community, their reputation for trustworthiness and effectiveness, and their own hard work.
The nature of the connections between community leaders and between community organizations is a critical factor associated with the scale of community projects which can be effectively implemented. The more people and organizations involved, the greater the cost and dimensions of the initiatives
2—Leadership Patterns, Civic Engagement, and Quality of Life Amenities In Small Iowa Towns
that can be implemented. In like manner, the breadth and diversity of residents actively involved in the community increases the potential for novel ideas and helps prevent over-working any one group or individual. Thus as part of the examination of leadership, we include findings about the overall level of civic engagement in the community. This information is provided by surveys of randomly selected residents conducted in 1994, 2004, and 2014. Residents were asked in each survey about their level of involvement in the community and to report on various aspects of the community and local leadership.
Complementing residents’ views expressed in the surveys is information gathered in June 2015 through face to face interviews with leaders in each of the six towns. Researchers contacted key informants (the city clerk,
county university extension staff, and/or the mayor) in four of the towns and asked them to identify active members of the community. These residents were involved in a variety of community projects. In the other two towns, the key informants were asked to identify residents who were involved in the same recently completed community improvement project. In all 53 people were contacted for interviews. Of those contacted who were available, 92 percent agreed to participate. Interviews lasted approximately one hour. Interviewees were asked questions directly related to a project in which they had actively participated. They were also asked to identify other participants in the project, active community members, and influential members of the community and to describe their relationship with these people (e.g. friend, relative, neighbor, business contact, co-worker).
Leadership Patterns, Civic Engagement, and Quality of Life Amenities In Small Iowa Towns—3
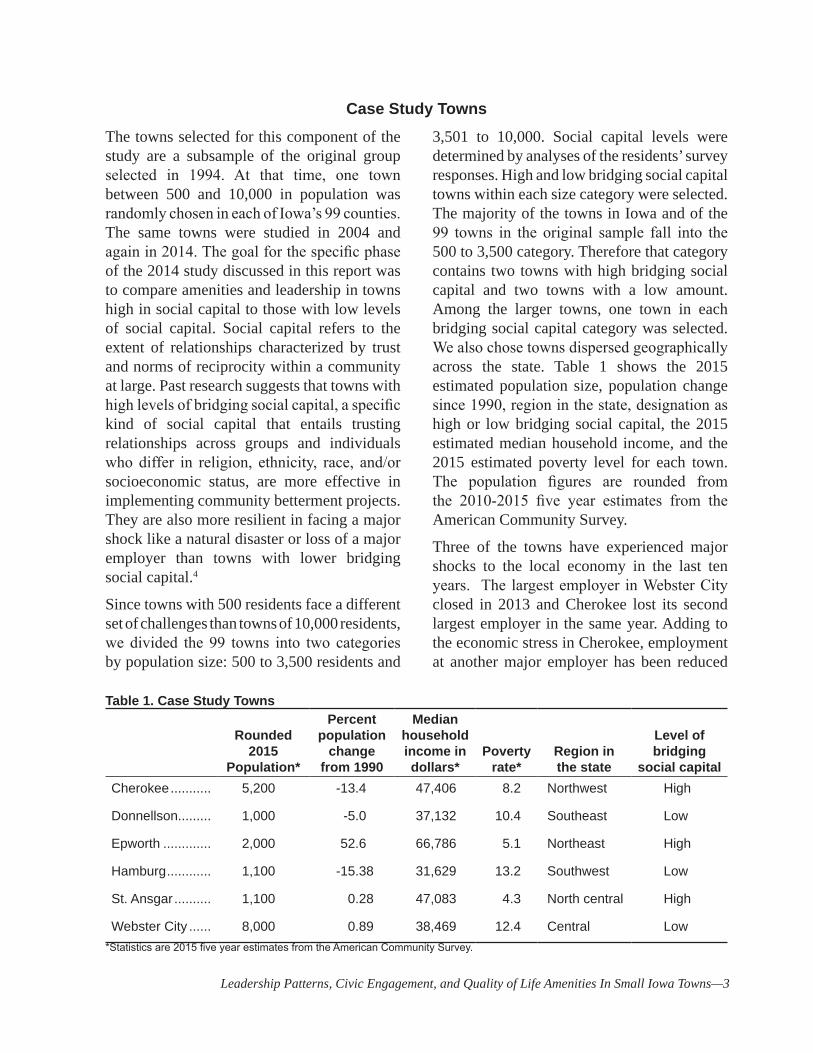
Case Study TownsThe towns selected for this component of the study are a subsample of the original group selected in 1994. At that time, one town between 500 and 10,000 in population was randomly chosen in each of Iowa’s 99 counties. The same towns were studied in 2004 and again in 2014. The goal for the specific phase of the 2014 study discussed in this report was to compare amenities and leadership in towns high in social capital to those with low levels of social capital. Social capital refers to the extent of relationships characterized by trust and norms of reciprocity within a community at large. Past research suggests that towns with high levels of bridging social capital, a specific kind of social capital that entails trusting relationships across groups and individuals who differ in religion, ethnicity, race, and/or socioeconomic status, are more effective in implementing community betterment projects. They are also more resilient in facing a major shock like a natural disaster or loss of a major employer than towns with lower bridging social capital.4
Since towns with 500 residents face a different set of challenges than towns of 10,000 residents, we divided the 99 towns into two categories by population size: 500 to 3,500 residents and
3,501 to 10,000. Social capital levels were determined by analyses of the residents’ survey responses. High and low bridging social capital towns within each size category were selected. The majority of the towns in Iowa and of the 99 towns in the original sample fall into the 500 to 3,500 category. Therefore that category contains two towns with high bridging social capital and two towns with a low amount. Among the larger towns, one town in each bridging social capital category was selected. We also chose towns dispersed geographically across the state. Table 1 shows the 2015 estimated population size, population change since 1990, region in the state, designation as high or low bridging social capital, the 2015 estimated median household income, and the 2015 estimated poverty level for each town. The population figures are rounded from the 2010-2015 five year estimates from the American Community Survey.
Three of the towns have experienced major shocks to the local economy in the last ten years. The largest employer in Webster City closed in 2013 and Cherokee lost its second largest employer in the same year. Adding to the economic stress in Cherokee, employment at another major employer has been reduced
Table 1. Case Study Towns
Rounded 2015
Population*
Percent population
change from 1990
Median household income in dollars*
Poverty rate*
Region in the state
Level of bridging
social capital Cherokee ........... 5,200 -13.4 47,406 8.2 Northwest High
Donnellson......... 1,000 -5.0 37,132 10.4 Southeast Low
Epworth ............. 2,000 52.6 66,786 5.1 Northeast High
Hamburg ............ 1,100 -15.38 31,629 13.2 Southwest Low
St. Ansgar .......... 1,100 0.28 47,083 4.3 North central High
Webster City ...... 8,000 0.89 38,469 12.4 Central Low*Statistics are 2015 five year estimates from the American Community Survey.

4—Leadership Patterns, Civic Engagement, and Quality of Life Amenities In Small Iowa Towns
by half since the 1970s and may be cut further in 2016. Hamburg faced significant flooding events close to the town in 2011 and 2013. In both cases water was kept from the downtown by the efforts of residents and the Army Corp of Engineers. Even so, surrounding farms and homesteads were severely impacted and the town was cut off completely for weeks from roads and highways going west.
The average distance to a metropolitan area for the sampled towns is 52 miles. St. Ansgar and Donnellson are farthest at 62 miles and 73 miles respectively while Epworth is the closest at about 20 miles. Its relative closeness to a metro area may explain Epworth’s population growth and higher median family income compared to the other towns. It has essentially become a bedroom community for residents working in the near-by metropolitan area.
Leadership Patterns, Civic Engagement, and Quality of Life Amenities In Small Iowa Towns—5
Community Social Climate in 1994 and 2014According to past studies, we expect that a town’s social climate will influence its ability to provide the amenities that add to residents’ quality of life and overcome, or at least mitigate, the challenges faced by towns of all sizes. Small towns have fewer employers and fewer residents whose skills, ideas, financial capital, and energy are needed to create betterment projects and sustain community infrastructure than cities have. The resource many small towns possess which is rarer in places with larger populations is residents’ willingness to put their special interests aside to work together for the common good. Places where people know and trust each other are more likely to possess this resource. Scholars call this aspect of community life social capital.
The situation where residents have such tight relationships with others in the community that new comers—and their ideas and leadership—are excluded is called bonding social capital. It is natural that small, rural towns have a tendency toward bonding social capital. When the majority of residents are born in the town, have attended the same schools, share the same religion, and are related to each other, the town has to make continuous, concerted efforts to welcome and include new comers and those with different religious, racial, and ethnic backgrounds. The extent to which towns successfully accomplish this is a measure of bridging social capital. Higher levels of bridging social capital facilitate tapping resources (human, financial, and physical) from divergent groups for community causes.
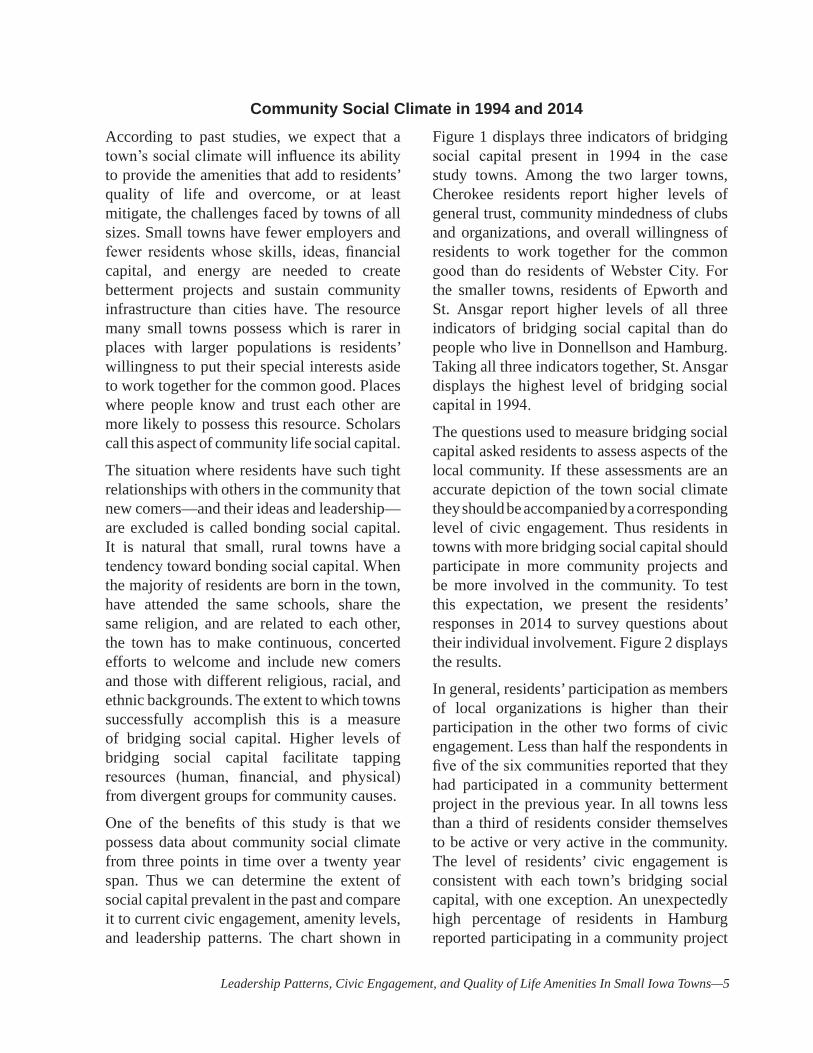
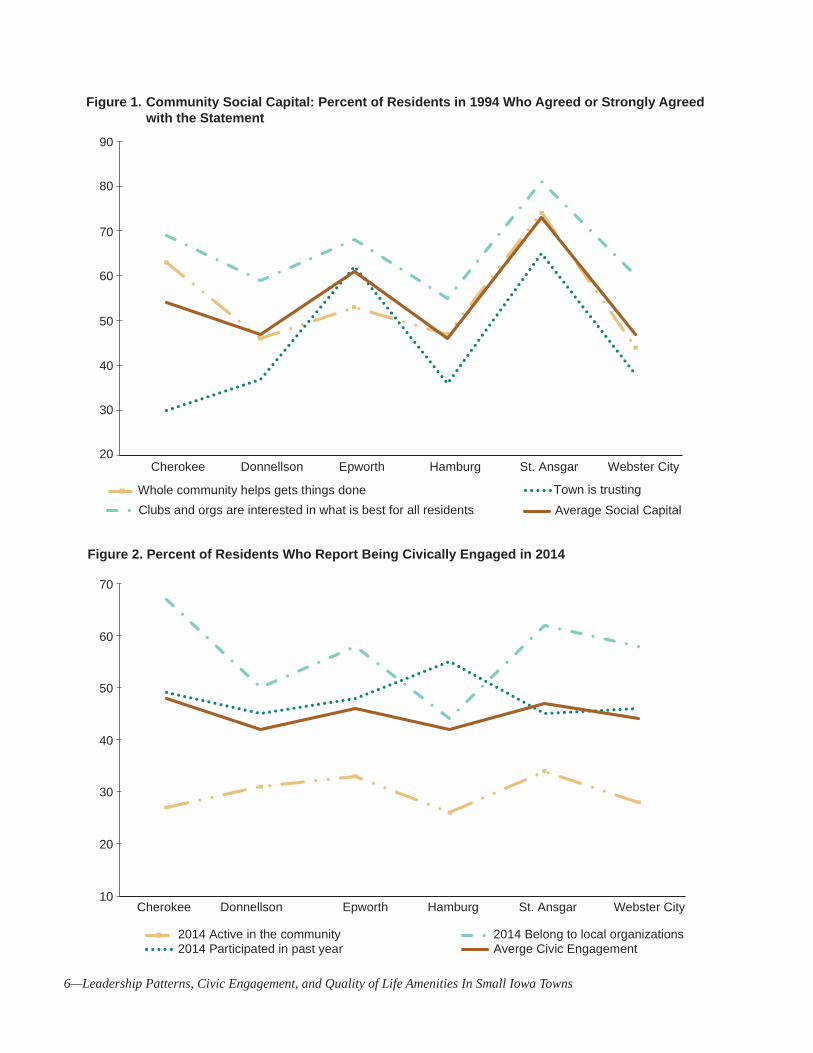
One of the benefits of this study is that we possess data about community social climate from three points in time over a twenty year span. Thus we can determine the extent of social capital prevalent in the past and compare it to current civic engagement, amenity levels, and leadership patterns. The chart shown in
Figure 1 displays three indicators of bridging social capital present in 1994 in the case study towns. Among the two larger towns, Cherokee residents report higher levels of general trust, community mindedness of clubs and organizations, and overall willingness of residents to work together for the common good than do residents of Webster City. For the smaller towns, residents of Epworth and St. Ansgar report higher levels of all three indicators of bridging social capital than do people who live in Donnellson and Hamburg. Taking all three indicators together, St. Ansgar displays the highest level of bridging social capital in 1994.
The questions used to measure bridging social capital asked residents to assess aspects of the local community. If these assessments are an accurate depiction of the town social climate they should be accompanied by a corresponding level of civic engagement. Thus residents in towns with more bridging social capital should participate in more community projects and be more involved in the community. To test this expectation, we present the residents’ responses in 2014 to survey questions about their individual involvement. Figure 2 displays the results.
In general, residents’ participation as members of local organizations is higher than their participation in the other two forms of civic engagement. Less than half the respondents in five of the six communities reported that they had participated in a community betterment project in the previous year. In all towns less than a third of residents consider themselves to be active or very active in the community. The level of residents’ civic engagement is consistent with each town’s bridging social capital, with one exception. An unexpectedly high percentage of residents in Hamburg reported participating in a community project
6—Leadership Patterns, Civic Engagement, and Quality of Life Amenities In Small Iowa Towns
Figure 1. Community Social Capital: Percent of Residents in 1994 Who Agreed or Strongly Agreed with the Statement
20
30
40
50
60
70
80
90
Cherokee Donnellson Epworth Hamburg St. Ansgar Webster City
Whole community helps gets things doneClubs and orgs are interested in what is best for all residents
Town is trustingAverage Social Capital
Figure 2. Percent of Residents Who Report Being Civically Engaged in 2014
10
20
30
40
50
60
70
Cherokee Donnellson Epworth Hamburg St. Ansgar Webster City
2014 Active in the community 2014 Belong to local organizations2014 Participated in past year Averge Civic Engagement

Leadership Patterns, Civic Engagement, and Quality of Life Amenities In Small Iowa Towns—7
in the past year compared to their relatively low bridging social capital and low levels on the other two measures of civic engagement.
We speculate that the higher than expected rate reflects residents’ involvement in the flood protection efforts in 2013.

8—Leadership Patterns, Civic Engagement, and Quality of Life Amenities In Small Iowa Towns
Leadership Patterns
Leadership is an essential resource for community development in towns of all sizes. However, cities and larger towns can partially substitute for volunteer involvement by hiring staff to handle the day to day responsibilities of leadership and furnishing monetary remuneration for elected leaders. Smaller towns with a more limited financial base must rely on volunteer leaders except for a few positions that require specialized knowledge and commitment. City clerks and utilities and streets maintenance department directors are examples. Those towns that have a larger proportion of residents willing to volunteer will be able to undertake larger, more effective projects and ultimately, realize a higher quality of life than towns of the same size with less engaged residents.
A pervasive problem faced by towns of all sizes, however, is the shortage of residents willing to get involved in community affairs. Figure 2 in the previous section provides a snapshot of residents’ participation in the case study towns. A positive conclusion from these statistics is that around half of the respondents were involved in a community project in the previous year. But that optimistic slant masks the difficulty in finding people willing to provide official and unofficial leadership for the community. According to an extensive study of small town leadership, residents believe they do not have the “skills, motivation, or knowledge about how things work in their community; what they perceive to be substantial personal and structural barriers keep them from pursuing leadership roles in public life”.5 One resident we interviewed described the situation this way: “We’re lucky to get people to run in the elections and then, yeah, get them to even vote.”
As explained in the introduction, community leaders are not the charismatic, take charge people frequently heralded in historical and popular renditions of leadership. Specific leaders may have these characteristics but they are not necessary for effective leadership. The distinguishing features of community leaders are a commitment to community betterment and the willingness to work to solve problems and improve the local quality of life – no more, no less. The skills necessary to organize others to achieve a goal can be learned. However, our focus in this research is not on those skills. Rather we examine the connections among residents involved in community projects and how these connections are associated with the kinds of projects undertaken and the general social climate of the community. The support and expectations communicated through residents’ connections to others in the community can encourage or discourage involvement in community affairs.
In our interviews with community residents, we asked them to identify the most significant events that occurred in the last three years affecting community quality of life in their town and list the projects in which they had been actively engaged in the last three years. Thirty four different projects were mentioned in response to the questions. Twenty eight of those were quality of life efforts ranging from mandated water and/or sewer upgrades to walking trails, a dog park, outdoor youth sports facilities, downtown theater renovation, school bond issues, town festivals, and many others. Three were economic development projects involving promoting and supporting new local businesses. Two were memorials to veterans and one was erecting a town sign.
We gathered detailed information about the implementation of the most recent project in
Leadership Patterns, Civic Engagement, and Quality of Life Amenities In Small Iowa Towns—9
which the interviewees participated. From that evidence and answers to the questions “Who in town is most effective at implementing betterment projects?” “Whose support is essential for a project to succeed?” and “Who is most effective at stopping a project?”, and the resident surveys; we detected two general types of leadership structures. The differences in the two relate to the number of individuals involved in specific projects, the centrality of project initiation, and the concentration of influence in the communities.
Shared LeadershipIn one model, projects described to us were accomplished by a decentralized, overlapping network of residents. An individual or a group would identify a project they wanted to accomplish. They then recruited others with similar interests and the resources and skills required for the tasks involved. The individuals participating varied from one project to another with some overlap. Cherokee and St. Ansgar displayed this kind of leadership.
An interviewee explained how a project on which he worked was implemented.
“XX, XX, and myself had the greatest influence. I mean she was so committed to the project that she kind of kept everything going. She was the contact point. XX, he had a lot of contacts. He had a lot of people, business contacts and then like me, I had – I knew the city.”
Another member of this group explained that they involved people with the knowledge gained from raising money for another community project. They also recruited a person with the technical knowledge needed to oversee and plan the enterprise.
A lifetime resident described the benefits of the overlapping network arrangement.
“This is a big deal. If people are serving on multiple boards together, that’s how you get
stuff done. Because they know how all the different boards work. They know if they have extra money. They know what their board has. They may have similar goals and you realize, you know, (organization’s) goals are similar to ours, so why don’t we work together and pool our money instead of doing a half ass job with both of us because we can do the job together. Take the top three people from each board and do something.”
Another described the implicit reciprocal agreement between members of the various networks.
“Everybody wanted to see it (the project) get done, but these people (those involved in this specific project) went out and knocked on doors, and it was favors, you know. I mean, you support my project, I support yours five years from now. That’s just how it works.”
A resident told us, “As far as early on, it (the initiation of the project) was very informal. It was grassroots just like the (second project). The (third project) was a private group saying, we want to do this. A lot of things happened. The (fourth project) was grassroots. Then maybe we (city officials) might get involved with a grant. Something like that. That’s kind of how St. Ansgar works.”
Three of the four projects referred to in this statement involved creating outdoor amenities. According to the interviewee, the groups involved learned from each other and swapped volunteer labor.
Supporting the conclusion that leadership is shared and decentralized, 13 people in Cherokee and 12 in St. Ansgar were nominated by interviewees as individuals whose support is essential for a project to succeed. In both towns, one person received five nominations, two had four nominations, and the remainder had one or two nominations. That is, no one individual was recognized by the majority as pivotal in community affairs. Cherokee and St. Ansgar residents in general also appear to agree that leadership is shared and not centralized in
10—Leadership Patterns, Civic Engagement, and Quality of Life Amenities In Small Iowa Towns
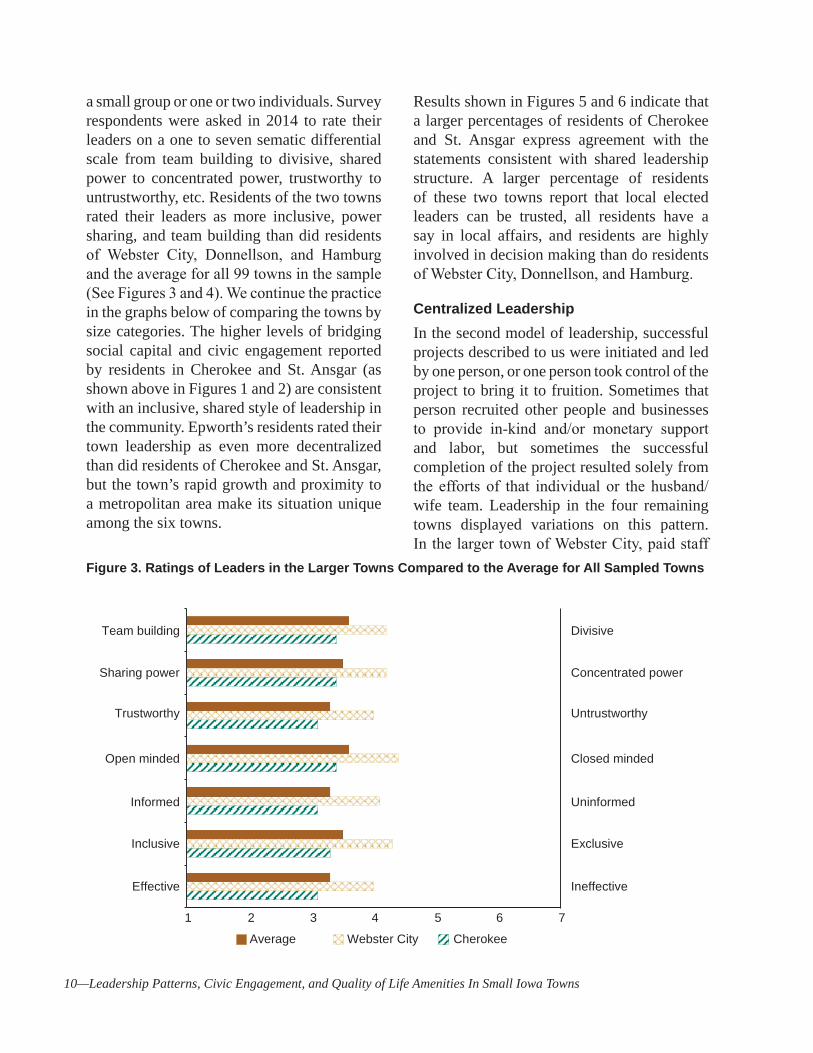
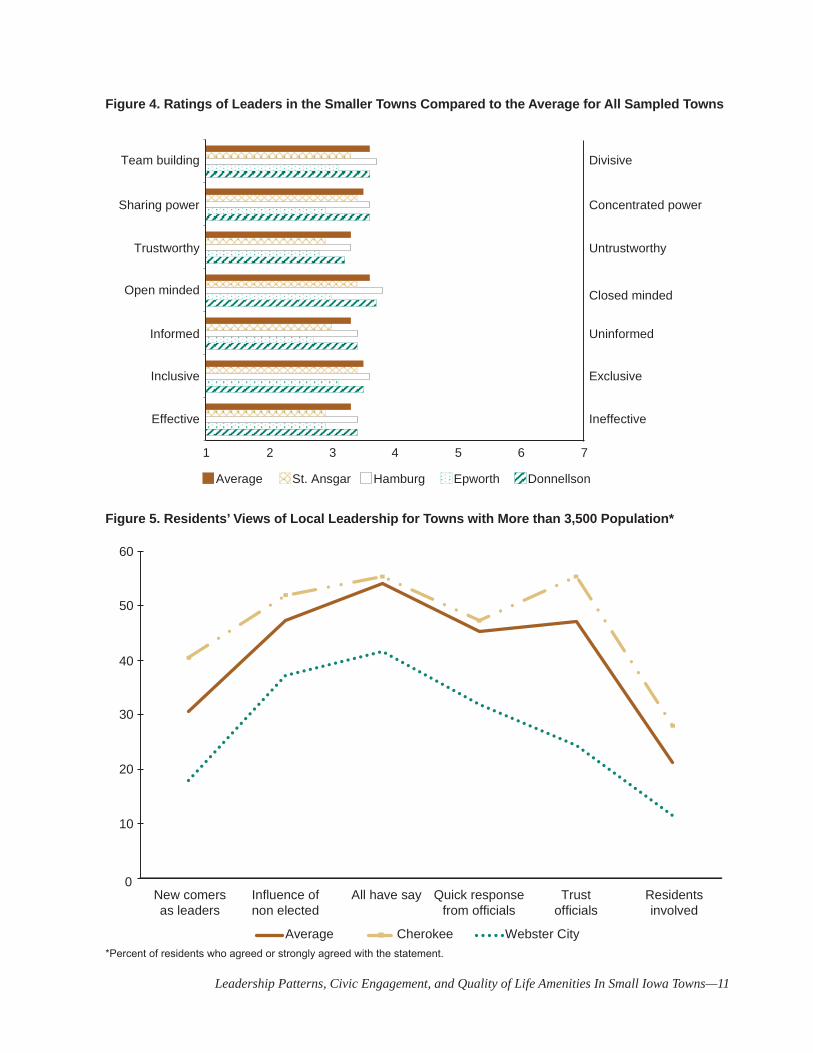
a small group or one or two individuals. Survey respondents were asked in 2014 to rate their leaders on a one to seven sematic differential scale from team building to divisive, shared power to concentrated power, trustworthy to untrustworthy, etc. Residents of the two towns rated their leaders as more inclusive, power sharing, and team building than did residents of Webster City, Donnellson, and Hamburg and the average for all 99 towns in the sample (See Figures 3 and 4). We continue the practice in the graphs below of comparing the towns by size categories. The higher levels of bridging social capital and civic engagement reported by residents in Cherokee and St. Ansgar (as shown above in Figures 1 and 2) are consistent with an inclusive, shared style of leadership in the community. Epworth’s residents rated their town leadership as even more decentralized than did residents of Cherokee and St. Ansgar, but the town’s rapid growth and proximity to a metropolitan area make its situation unique among the six towns.
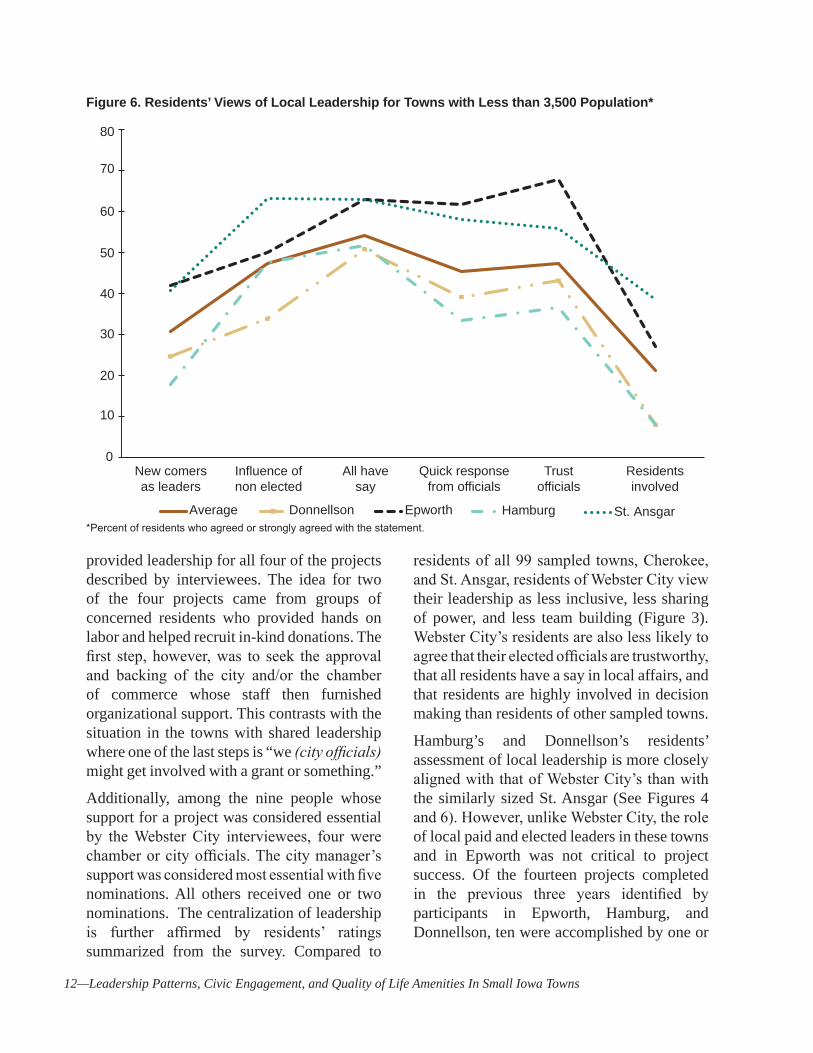
Results shown in Figures 5 and 6 indicate that a larger percentages of residents of Cherokee and St. Ansgar express agreement with the statements consistent with shared leadership structure. A larger percentage of residents of these two towns report that local elected leaders can be trusted, all residents have a say in local affairs, and residents are highly involved in decision making than do residents of Webster City, Donnellson, and Hamburg.
Centralized LeadershipIn the second model of leadership, successful projects described to us were initiated and led by one person, or one person took control of the project to bring it to fruition. Sometimes that person recruited other people and businesses to provide in-kind and/or monetary support and labor, but sometimes the successful completion of the project resulted solely from the efforts of that individual or the husband/wife team. Leadership in the four remaining towns displayed variations on this pattern. In the larger town of Webster City, paid staff
Figure 3. Ratings of Leaders in the Larger Towns Compared to the Average for All Sampled Towns
Ineffective
Exclusive
Uninformed
Closed minded
Untrustworthy
Concentrated power
Divisive
Effective
Inclusive
Informed
Open minded
Trustworthy
Sharing power
Team building
Average Webster City Cherokee
1 2 3 4 5 6 7
Leadership Patterns, Civic Engagement, and Quality of Life Amenities In Small Iowa Towns—11
Figure 4. Ratings of Leaders in the Smaller Towns Compared to the Average for All Sampled Towns
Ineffective
Exclusive
Uninformed
Closed minded
Untrustworthy
Concentrated power
Divisive
Effective
Inclusive
Informed
Open minded
Trustworthy
Sharing power
Team building
Average St. Ansgar Hamburg Epworth Donnellson
1 2 3 4 5 6 7
Figure 5. Residents’ Views of Local Leadership for Towns with More than 3,500 Population*
0
10
20
30
40
50
60
New comersas leaders
Influence ofnon elected
All have say Quick responsefrom officials
Trustofficials
Residentsinvolved
Average Cherokee Webster City*Percent of residents who agreed or strongly agreed with the statement.
12—Leadership Patterns, Civic Engagement, and Quality of Life Amenities In Small Iowa Towns
provided leadership for all four of the projects described by interviewees. The idea for two of the four projects came from groups of concerned residents who provided hands on labor and helped recruit in-kind donations. The first step, however, was to seek the approval and backing of the city and/or the chamber of commerce whose staff then furnished organizational support. This contrasts with the situation in the towns with shared leadership where one of the last steps is “we (city officials) might get involved with a grant or something.”
Additionally, among the nine people whose support for a project was considered essential by the Webster City interviewees, four were chamber or city officials. The city manager’s support was considered most essential with five nominations. All others received one or two nominations. The centralization of leadership is further affirmed by residents’ ratings summarized from the survey. Compared to
residents of all 99 sampled towns, Cherokee, and St. Ansgar, residents of Webster City view their leadership as less inclusive, less sharing of power, and less team building (Figure 3). Webster City’s residents are also less likely to agree that their elected officials are trustworthy, that all residents have a say in local affairs, and that residents are highly involved in decision making than residents of other sampled towns.
Hamburg’s and Donnellson’s residents’ assessment of local leadership is more closely aligned with that of Webster City’s than with the similarly sized St. Ansgar (See Figures 4 and 6). However, unlike Webster City, the role of local paid and elected leaders in these towns and in Epworth was not critical to project success. Of the fourteen projects completed in the previous three years identified by participants in Epworth, Hamburg, and Donnellson, ten were accomplished by one or
Figure 6. Residents’ Views of Local Leadership for Towns with Less than 3,500 Population*
0
10
20
30
40
50
60
70
80
Average Donnellson Epworth Hamburg St. Ansgar
New comersas leaders
Influence ofnon elected
All havesay
Quick responsefrom officials
Trustofficials
Residentsinvolved
*Percent of residents who agreed or strongly agreed with the statement.

Leadership Patterns, Civic Engagement, and Quality of Life Amenities In Small Iowa Towns—13
two residents with the consent and some task specific assistance of others.
We do not know how projects were implemented before the three year horizon of the study. It is clear from the magnitude of some of them that elected officials and larger groups of people were involved. However, the recent projects in which interviewees were involved were initiated and/or implemented primarily by a “lone maverick” who was responsible for the success of the projects. Lone mavericks did not lead or initiate community projects to garner personal wealth or power. Rather it seemed that they reluctantly assumed the central role in community improvement projects when they perceived the projects would not be accomplished otherwise.
This is exemplified by a comment by an interviewee who said
“And it’s one of those things, just take the initiative and say, ‘Hey, let’s do this.’ But I’m not one to form committees and ask for help. That’s just how farmers are. If something needs done, they do it themselves rather than ask somebody else to do it.”
Another interviewee reported “So when I started this project, I said to my husband, I said, I am the boss. I am not going to work with anybody because it’s too important to me to trust somebody to say, get that lined up, and then they don’t do it in time. So that’s why I’m the boss, and they call me the boss.”
It is not true that she worked with no one else. She sought approval from the town and county governments and solicited help from a technical expert and the owners of numerous local businesses. “I haven’t had anybody tell me no, you know.” Even so, one person initiated and was in charge of every phase of this project.
A major community betterment project in one of these towns was initiated by the director
and board of a local organization. However, it languished for years before responsibility was assumed by one local leader. He described the situation in this way.
“It’s gone from being very open to being very restricted because in that time when we were very open, all we did was gather all these different opinions and different ideas, as I’ve talked about, and then as we get to the point where I’m going, okay, I’m either going to spend the rest of my life doing this, but probably what will happen first is this (project) will fall down and we won’t have a (XXX) in town anymore. So I personally will take responsibility for restricting it to deal with the problems as they come up. But I come up with a plan that I knew would work with the budget, see if the board would approve it.”
Interviewees in Hamburg identified one individual as the driving force in the project in which several of them were involved, but also noted the critical role of others in implementing the projects. The impetus and training for the project was provided by a state program. Nevertheless, interviewees identified the local leader as responsible for the success of the program in Hamburg.
Local Business Owners and ManagersOne feature shared by Donnellson, Hamburg, and Webster City is the historically significant role played by one or two local business owners in community affairs. In Webster City, the local business was purchased decades ago by a national company which was then purchased by a foreign company. Eventually, the foreign company closed its operations in town. One interviewee described how the shift from local ownership to non-local ownership affected the business’ involvement in the town.
“A lot of the things that used to be instigated by businesses to make the town better, to volunteer, (the international company) had no interest in. So everybody became disconnected. You know, … they had community projects where they would clean up, fix up. They built
14—Leadership Patterns, Civic Engagement, and Quality of Life Amenities In Small Iowa Towns
the restroom at one of the parks, those kinds of things. Well, once it was (international company), they thought their big contribution was donating a (product made at the factory) for a raffle once a year. I’m sorry. And it spawned that, what I consider a really poor attitude. And it’s—it’s tough digging back out of it.”
Another town with concentrated leadership experienced a similar change after the death of a local business owner committed to the community. According to a long time resident:
“We had (name of a local business owner) who …was kind of like dad, you know, and that’s how it went. And he wanted to know about ideas in the very beginning, not later, but in the very beginning. And then there’s another (name of local business owner) who helps raise money for (local projects) by going to people and saying, this is exactly what he said to me, he went in and he said to the businessmen, okay, I need support, you know, I need some—I need a check and they’d write him a $500 check, and he’d look at it and he goes, I’m here for real money, and he threw it back at them, and he said, I need another zero on that. That’s how he fund raised. He was a Godfather.”
Community research supports the key role played by civic minded, local business owners in community affairs.6 Obviously, local
business owners have a vested interest in the success of the community. Local prosperity and population growth are good for their business. Their commitment to community betterment, however, frequently goes beyond personal monetary gain. The town is their home. Their children and grandchildren attend the local schools. Their friends and family are affected by the presence or absence of, for example, an aquatic center, sports complex, and playhouse. Their commitment to community development is affirmed by the fact that every project described to us except the government mandated water and sewer upgrades involved the support, and sometimes the leadership, of local business owners which includes farm owners.
As the comments from these interviewees suggest the dominance of one or two large local business owners and managers in community affairs can be a mixed blessing. If they are civic minded, they can be a powerful force for community betterment. But even then, a town can become dependent on their leadership. When, for whatever reason, they are no longer involved, a leadership void occurs that is difficult to fill.
Leadership Patterns, Civic Engagement, and Quality of Life Amenities In Small Iowa Towns—15
Amenities and Quality of LifeEvery town wants to boast about being one of the best places to live or do business. The qualities that contribute to the quality of life in a community are called amenities. As indicated above, amenities include natural resources; outdoor recreational opportunities; cultural, entertainment, and indoor recreational opportunities; public and private services; and downtown vitality. The levels of social capital and community spirit also contribute to residents’ satisfaction with their community. However in this section, we focus on the amenities that can be rated without conducting a survey of residents and performing analyses requiring statistical expertise. These tend to be the amenities used by Forbes, Money Magazine, and Places Rated Almanac in producing annual rankings of the best places to live, best places to do business, best small cities, and other “best”s; and the Economic Research Service (ERS) of the United States Department of Agriculture. The ERS has written several reports documenting the level of natural resource amenities for various regions in the U.S. and their positive relationship to population and economic growth for rural as well as metropolitan locations.
Ultimately the value of amenities is the contribution they make to residents’ happiness. People who live in places with more amenities are likely to be happier with their lives than residents of low amenity locations.7 Due to its contribution to economic vitality, population growth, and resident satisfaction, amenity development has become an important community improvement strategy. In fact, most of the community betterment strategies (28 of 34 projects) in which interviewees in the case study towns were involved were amenity development projects. These included projects as diverse as developing walking trails, organizing school bond issues, creating a day care center, and organizing community
festivals. Until recently no validated methodology existed to measure rural small town amenities other than natural resources and climate features at the county level. As a result, there was no way for these towns to determine amenity strengths and weaknesses, nor to determine if amenity enhancement provided other benefits above and beyond improving perceptions of the local quality of life.
Recognizing this shortcoming, researchers at three Midwestern universities developed an amenity inventory in 2010 to investigate how various kinds of amenities and business associations impact rural economic vitality. A copy of the report summarizing the findings from the study can be accessed at http://www.soc.iastate.edu/rural/reports/Amenities%20and%20Rural%20Development%20in%20the%20Corn%20Belt%20and%20Great%20Plains3%20(2).pdf.
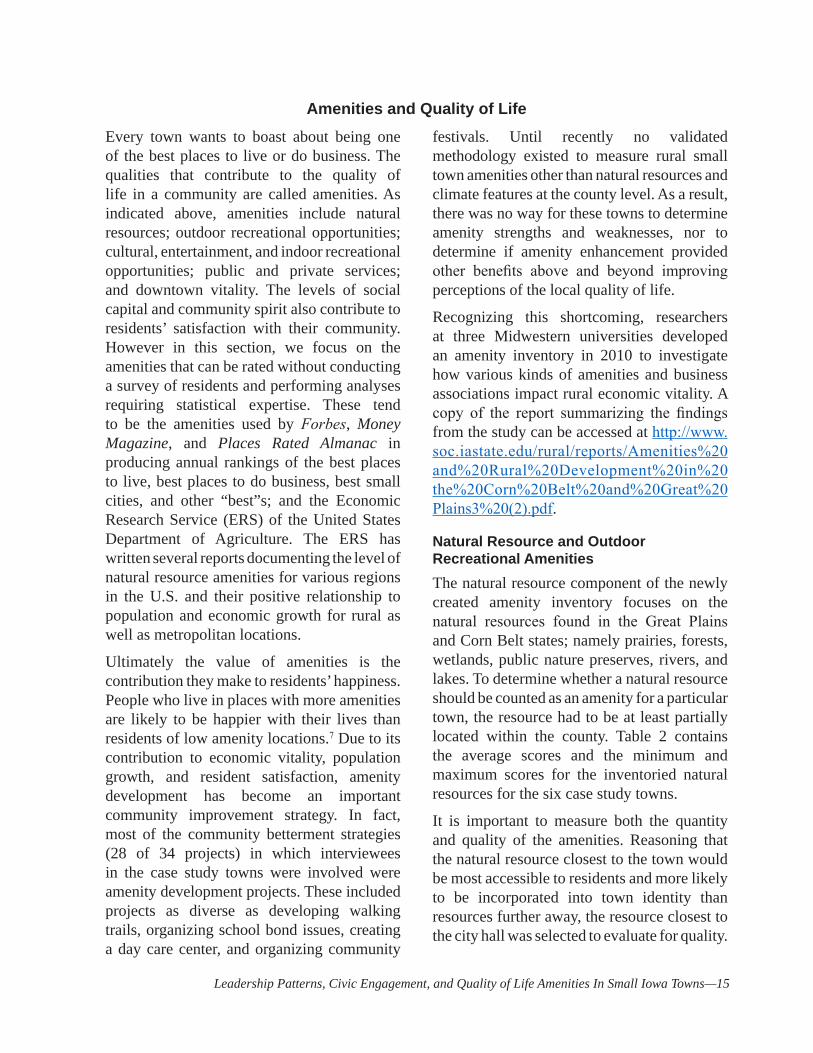
Natural Resource and Outdoor Recreational AmenitiesThe natural resource component of the newly created amenity inventory focuses on the natural resources found in the Great Plains and Corn Belt states; namely prairies, forests, wetlands, public nature preserves, rivers, and lakes. To determine whether a natural resource should be counted as an amenity for a particular town, the resource had to be at least partially located within the county. Table 2 contains the average scores and the minimum and maximum scores for the inventoried natural resources for the six case study towns.
It is important to measure both the quantity and quality of the amenities. Reasoning that the natural resource closest to the town would be most accessible to residents and more likely to be incorporated into town identity than resources further away, the resource closest to the city hall was selected to evaluate for quality.
16—Leadership Patterns, Civic Engagement, and Quality of Life Amenities In Small Iowa Towns
A team of researchers visited this resource and each researcher evaluated the quality of the resource based on pre-determined criteria. If there were differences in the researchers’ assessments and a consensus could not be reached, the average score was recorded. We relied on the state Department of Natural Resources and local residents for evaluations of the quality of fishing in the area. In the future, communities conducting their own amenity inventory may want to include the quality of hunting in the area also.
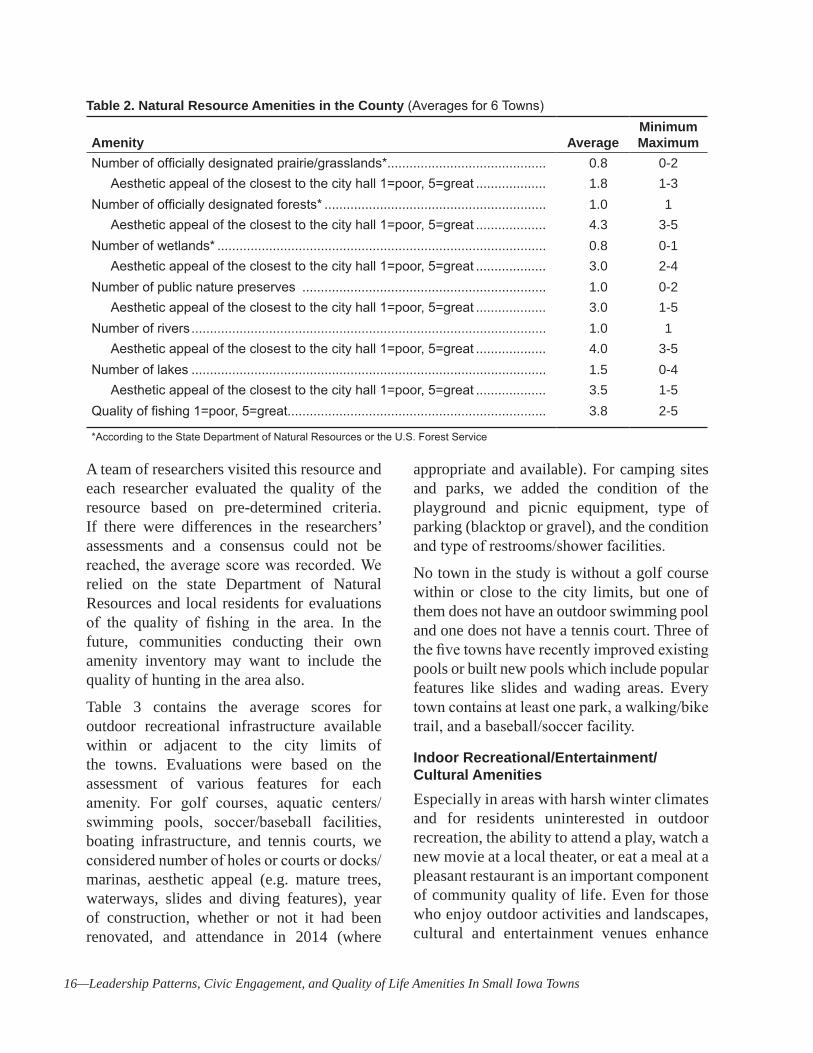
Table 3 contains the average scores for outdoor recreational infrastructure available within or adjacent to the city limits of the towns. Evaluations were based on the assessment of various features for each amenity. For golf courses, aquatic centers/swimming pools, soccer/baseball facilities, boating infrastructure, and tennis courts, we considered number of holes or courts or docks/marinas, aesthetic appeal (e.g. mature trees, waterways, slides and diving features), year of construction, whether or not it had been renovated, and attendance in 2014 (where
appropriate and available). For camping sites and parks, we added the condition of the playground and picnic equipment, type of parking (blacktop or gravel), and the condition and type of restrooms/shower facilities.
No town in the study is without a golf course within or close to the city limits, but one of them does not have an outdoor swimming pool and one does not have a tennis court. Three of the five towns have recently improved existing pools or built new pools which include popular features like slides and wading areas. Every town contains at least one park, a walking/bike trail, and a baseball/soccer facility.
Indoor Recreational/Entertainment/Cultural AmenitiesEspecially in areas with harsh winter climates and for residents uninterested in outdoor recreation, the ability to attend a play, watch a new movie at a local theater, or eat a meal at a pleasant restaurant is an important component of community quality of life. Even for those who enjoy outdoor activities and landscapes, cultural and entertainment venues enhance
Table 2. Natural Resource Amenities in the County (Averages for 6 Towns)
Amenity AverageMinimum Maximum
Number of officially designated prairie/grasslands*........................................... 0.8 0-2Aesthetic appeal of the closest to the city hall 1=poor, 5=great ................... 1.8 1-3
Number of officially designated forests* ............................................................ 1.0 1Aesthetic appeal of the closest to the city hall 1=poor, 5=great ................... 4.3 3-5
Number of wetlands* ......................................................................................... 0.8 0-1Aesthetic appeal of the closest to the city hall 1=poor, 5=great ................... 3.0 2-4
Number of public nature preserves .................................................................. 1.0 0-2Aesthetic appeal of the closest to the city hall 1=poor, 5=great ................... 3.0 1-5
Number of rivers ................................................................................................ 1.0 1Aesthetic appeal of the closest to the city hall 1=poor, 5=great ................... 4.0 3-5
Number of lakes ................................................................................................ 1.5 0-4Aesthetic appeal of the closest to the city hall 1=poor, 5=great ................... 3.5 1-5
Quality of fishing 1=poor, 5=great...................................................................... 3.8 2-5
*According to the State Department of Natural Resources or the U.S. Forest Service
Leadership Patterns, Civic Engagement, and Quality of Life Amenities In Small Iowa Towns—17
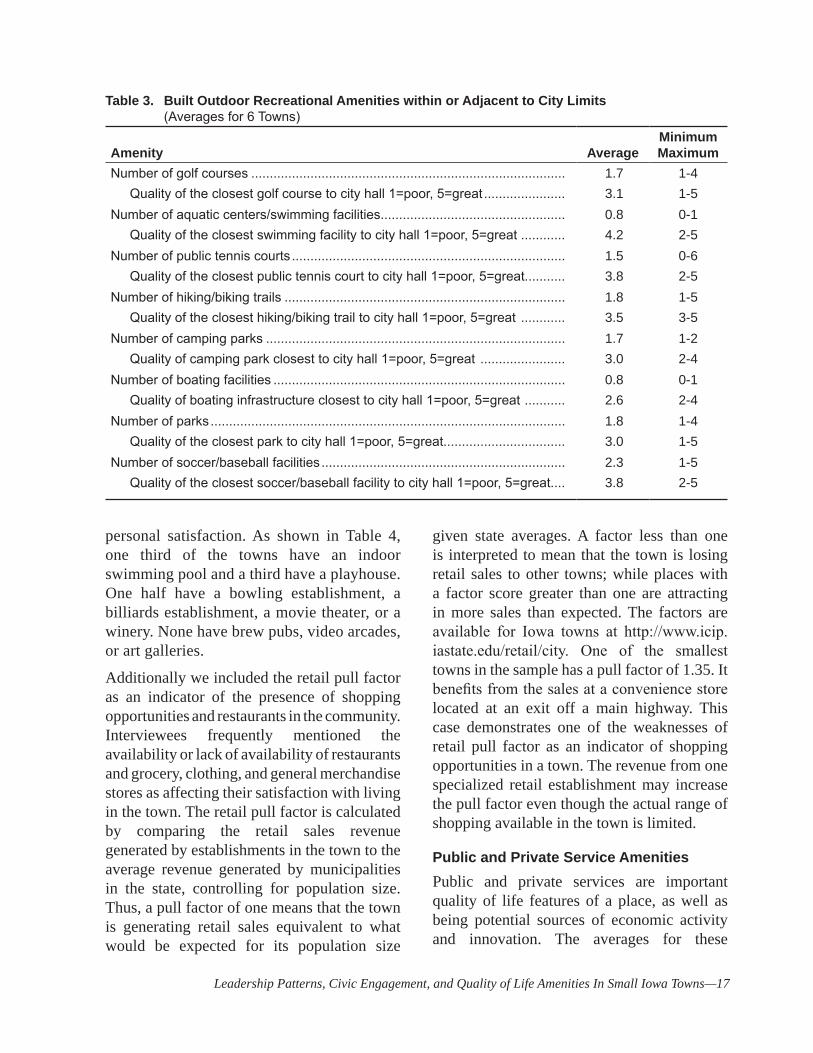
personal satisfaction. As shown in Table 4, one third of the towns have an indoor swimming pool and a third have a playhouse. One half have a bowling establishment, a billiards establishment, a movie theater, or a winery. None have brew pubs, video arcades, or art galleries.
Additionally we included the retail pull factor as an indicator of the presence of shopping opportunities and restaurants in the community. Interviewees frequently mentioned the availability or lack of availability of restaurants and grocery, clothing, and general merchandise stores as affecting their satisfaction with living in the town. The retail pull factor is calculated by comparing the retail sales revenue generated by establishments in the town to the average revenue generated by municipalities in the state, controlling for population size. Thus, a pull factor of one means that the town is generating retail sales equivalent to what would be expected for its population size
given state averages. A factor less than one is interpreted to mean that the town is losing retail sales to other towns; while places with a factor score greater than one are attracting in more sales than expected. The factors are available for Iowa towns at http://www.icip.iastate.edu/retail/city. One of the smallest towns in the sample has a pull factor of 1.35. It benefits from the sales at a convenience store located at an exit off a main highway. This case demonstrates one of the weaknesses of retail pull factor as an indicator of shopping opportunities in a town. The revenue from one specialized retail establishment may increase the pull factor even though the actual range of shopping available in the town is limited.
Public and Private Service AmenitiesPublic and private services are important quality of life features of a place, as well as being potential sources of economic activity and innovation. The averages for these
Table 3. Built Outdoor Recreational Amenities within or Adjacent to City Limits (Averages for 6 Towns)
Amenity AverageMinimum Maximum
Number of golf courses ..................................................................................... 1.7 1-4Quality of the closest golf course to city hall 1=poor, 5=great ...................... 3.1 1-5
Number of aquatic centers/swimming facilities.................................................. 0.8 0-1Quality of the closest swimming facility to city hall 1=poor, 5=great ............ 4.2 2-5
Number of public tennis courts .......................................................................... 1.5 0-6Quality of the closest public tennis court to city hall 1=poor, 5=great........... 3.8 2-5
Number of hiking/biking trails ............................................................................ 1.8 1-5Quality of the closest hiking/biking trail to city hall 1=poor, 5=great ............ 3.5 3-5
Number of camping parks ................................................................................. 1.7 1-2Quality of camping park closest to city hall 1=poor, 5=great ....................... 3.0 2-4
Number of boating facilities ............................................................................... 0.8 0-1Quality of boating infrastructure closest to city hall 1=poor, 5=great ........... 2.6 2-4
Number of parks ................................................................................................ 1.8 1-4Quality of the closest park to city hall 1=poor, 5=great................................. 3.0 1-5
Number of soccer/baseball facilities .................................................................. 2.3 1-5Quality of the closest soccer/baseball facility to city hall 1=poor, 5=great.... 3.8 2-5
18—Leadership Patterns, Civic Engagement, and Quality of Life Amenities In Small Iowa Towns
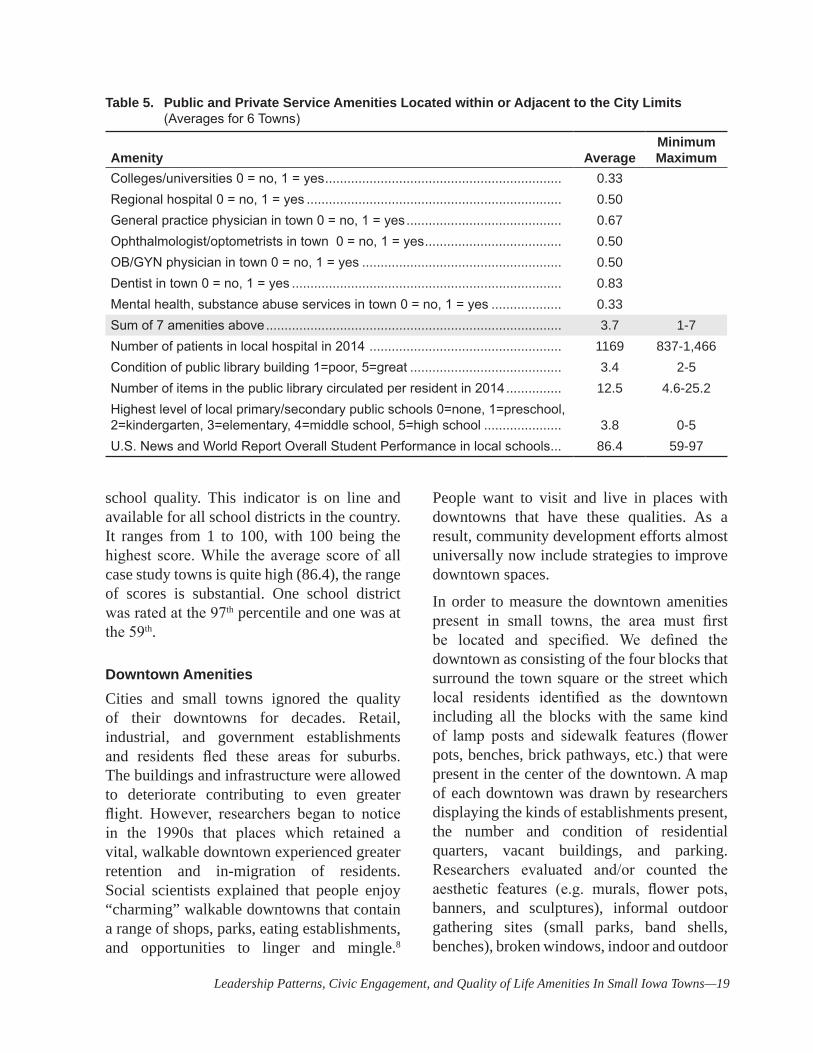
amenities in the case study towns are shown in Table 5. Two of the six towns are the location of a two year or four year college and two have mental health services available in town. Three, or 50 percent, have a regional hospital, an ophthalmologist/optometrist, and an OB/GYN physician in town. Four of the six have a general practice physician available in town five days a week.
Public libraries have become an increasingly indispensable resource for communities. It is clear that residents of the case study towns recognize their value. One interviewee explained the role that libraries can play in community building by saying,
“You know, ….you’re not just there to get a book or get on the internet or to check out a movie. What’s also really enjoyable about that process is you might check out that book or that movie and guess what? You might actually
have a conversation with somebody who also read that book or watched that movie. To me, that’s really what I love about the library.”
Three of the towns had recently renovated or built new library facilities. One town was in the process of raising funds to build a new library at the time of our visit.
School consolidation which started in Iowa in the 1960s has left many small towns without the convenience of a local school for children to attend. Long bus rides are just one consequence of this phenomenon. Schools are also a source of community spirit and pride. Therefore, we deemed the availability and quality of schools to be a critical public service amenity. Four towns have a local high school in or adjacent to the city limits, while one of the smaller towns has no school and one has only an elementary school. We utilized the U.S. News and World Report assessment of
Table 4. Indoor Recreational/Entertainment/Cultural Amenities within the City Limits or in an Unincorporated Area within a Ten Mile Drive of Town (Averages for 6 Towns)
Amenity AverageMinimum Maximum
Public aquatic centers/swimming pools 0 = no, 1 = yes ................................... 0.33Bowling establishments 0 = no, 1 = yes ........................................................... 0.50Pool/billiards establishments 0 = no, 1 = yes ................................................... 0.50Video arcades/laser tag/bumper car establishments 0 = no, 1 = yes .............. 0.00Public gyms and recreation centers 0 = no, 1 = yes......................................... 0.50Private gyms—fitness centers 0 = no, 1 = yes ................................................. 0.50Community playhouse 0 = no, 1 = yes ............................................................. 0.33Movie theater 0 = no, 1 = yes ........................................................................... 0.50Art gallery 0 = no, 1 = yes................................................................................. 0.00Winery 0 = no, 1 = yes...................................................................................... 0.50Brewpub 0 = no, 1 = yes................................................................................... 0.00Sum of 11 amenities above .............................................................................. 3.7 1-7Number of festivals/events in 2014 .................................................................. 6.2 1-13Frequency of plays in 2014 .............................................................................. 1.2 0-4Number of subscribers to the local newspaper* in 2014 .................................. 5,714 350-24,000Retail pull factor in 2015 ................................................................................... 0.91 0.33-1.35*Newspaper that covers local events, city council meetings, weddings, deaths, etc. and has advertisements from local businesses
Leadership Patterns, Civic Engagement, and Quality of Life Amenities In Small Iowa Towns—19
school quality. This indicator is on line and available for all school districts in the country. It ranges from 1 to 100, with 100 being the highest score. While the average score of all case study towns is quite high (86.4), the range of scores is substantial. One school district was rated at the 97th percentile and one was at the 59th.
Downtown AmenitiesCities and small towns ignored the quality of their downtowns for decades. Retail, industrial, and government establishments and residents fled these areas for suburbs. The buildings and infrastructure were allowed to deteriorate contributing to even greater flight. However, researchers began to notice in the 1990s that places which retained a vital, walkable downtown experienced greater retention and in-migration of residents. Social scientists explained that people enjoy “charming” walkable downtowns that contain a range of shops, parks, eating establishments, and opportunities to linger and mingle.8
People want to visit and live in places with downtowns that have these qualities. As a result, community development efforts almost universally now include strategies to improve downtown spaces.
In order to measure the downtown amenities present in small towns, the area must first be located and specified. We defined the downtown as consisting of the four blocks that surround the town square or the street which local residents identified as the downtown including all the blocks with the same kind of lamp posts and sidewalk features (flower pots, benches, brick pathways, etc.) that were present in the center of the downtown. A map of each downtown was drawn by researchers displaying the kinds of establishments present, the number and condition of residential quarters, vacant buildings, and parking. Researchers evaluated and/or counted the aesthetic features (e.g. murals, flower pots, banners, and sculptures), informal outdoor gathering sites (small parks, band shells, benches), broken windows, indoor and outdoor
Table 5. Public and Private Service Amenities Located within or Adjacent to the City Limits (Averages for 6 Towns)
Amenity Average Minimum Maximum
Colleges/universities 0 = no, 1 = yes ................................................................ 0.33Regional hospital 0 = no, 1 = yes ..................................................................... 0.50General practice physician in town 0 = no, 1 = yes .......................................... 0.67Ophthalmologist/optometrists in town 0 = no, 1 = yes ..................................... 0.50OB/GYN physician in town 0 = no, 1 = yes ...................................................... 0.50Dentist in town 0 = no, 1 = yes ......................................................................... 0.83Mental health, substance abuse services in town 0 = no, 1 = yes ................... 0.33Sum of 7 amenities above ................................................................................ 3.7 1-7Number of patients in local hospital in 2014 .................................................... 1169 837-1,466Condition of public library building 1=poor, 5=great ......................................... 3.4 2-5Number of items in the public library circulated per resident in 2014 ............... 12.5 4.6-25.2Highest level of local primary/secondary public schools 0=none, 1=preschool, 2=kindergarten, 3=elementary, 4=middle school, 5=high school ..................... 3.8 0-5U.S. News and World Report Overall Student Performance in local schools ... 86.4 59-97
20—Leadership Patterns, Civic Engagement, and Quality of Life Amenities In Small Iowa Towns
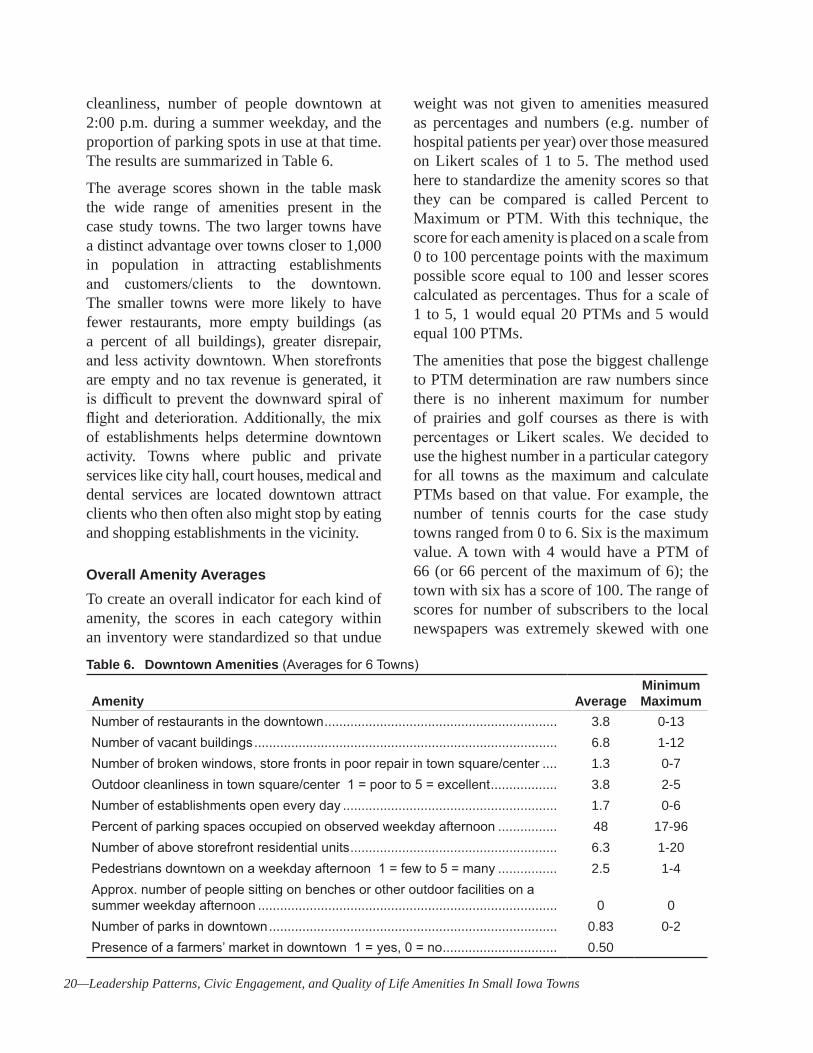
cleanliness, number of people downtown at 2:00 p.m. during a summer weekday, and the proportion of parking spots in use at that time. The results are summarized in Table 6.
The average scores shown in the table mask the wide range of amenities present in the case study towns. The two larger towns have a distinct advantage over towns closer to 1,000 in population in attracting establishments and customers/clients to the downtown. The smaller towns were more likely to have fewer restaurants, more empty buildings (as a percent of all buildings), greater disrepair, and less activity downtown. When storefronts are empty and no tax revenue is generated, it is difficult to prevent the downward spiral of flight and deterioration. Additionally, the mix of establishments helps determine downtown activity. Towns where public and private services like city hall, court houses, medical and dental services are located downtown attract clients who then often also might stop by eating and shopping establishments in the vicinity.
Overall Amenity AveragesTo create an overall indicator for each kind of amenity, the scores in each category within an inventory were standardized so that undue
weight was not given to amenities measured as percentages and numbers (e.g. number of hospital patients per year) over those measured on Likert scales of 1 to 5. The method used here to standardize the amenity scores so that they can be compared is called Percent to Maximum or PTM. With this technique, the score for each amenity is placed on a scale from 0 to 100 percentage points with the maximum possible score equal to 100 and lesser scores calculated as percentages. Thus for a scale of 1 to 5, 1 would equal 20 PTMs and 5 would equal 100 PTMs.
The amenities that pose the biggest challenge to PTM determination are raw numbers since there is no inherent maximum for number of prairies and golf courses as there is with percentages or Likert scales. We decided to use the highest number in a particular category for all towns as the maximum and calculate PTMs based on that value. For example, the number of tennis courts for the case study towns ranged from 0 to 6. Six is the maximum value. A town with 4 would have a PTM of 66 (or 66 percent of the maximum of 6); the town with six has a score of 100. The range of scores for number of subscribers to the local newspapers was extremely skewed with one
Table 6. Downtown Amenities (Averages for 6 Towns)
Amenity Average Minimum Maximum
Number of restaurants in the downtown ............................................................... 3.8 0-13Number of vacant buildings .................................................................................. 6.8 1-12Number of broken windows, store fronts in poor repair in town square/center .... 1.3 0-7Outdoor cleanliness in town square/center 1 = poor to 5 = excellent .................. 3.8 2-5Number of establishments open every day .......................................................... 1.7 0-6Percent of parking spaces occupied on observed weekday afternoon ................ 48 17-96Number of above storefront residential units ........................................................ 6.3 1-20Pedestrians downtown on a weekday afternoon 1 = few to 5 = many ................ 2.5 1-4Approx. number of people sitting on benches or other outdoor facilities on a summer weekday afternoon ................................................................................. 0 0Number of parks in downtown .............................................................................. 0.83 0-2Presence of a farmers’ market in downtown 1 = yes, 0 = no ............................... 0.50
Leadership Patterns, Civic Engagement, and Quality of Life Amenities In Small Iowa Towns—21
town relying on the metro area newspaper for local coverage. To prevent giving undue weight to the newspaper subscriber amenity for the outlier town, we used the median value as the denominator for PTM calculations. The median is the midpoint value. In this case, it was the midpoint between the towns with the three highest number of newspaper subscribers and three lowest. Even then, the outlier town had a 980 PTM. Because this would have drastically distorted the average score for the indoor recreational/cultural amenities for that town, we changed its score to 100 PTM. Another change necessary to accurately summarize the amenities within the downtown amenity category ensured that a high score meant a positive assessment. Therefore, the PTMs for number of vacant buildings and broken windows in the downtown were subtracted from 100. In this way high PTMS for those amenities equates to fewer vacant buildings and fewer broken windows.
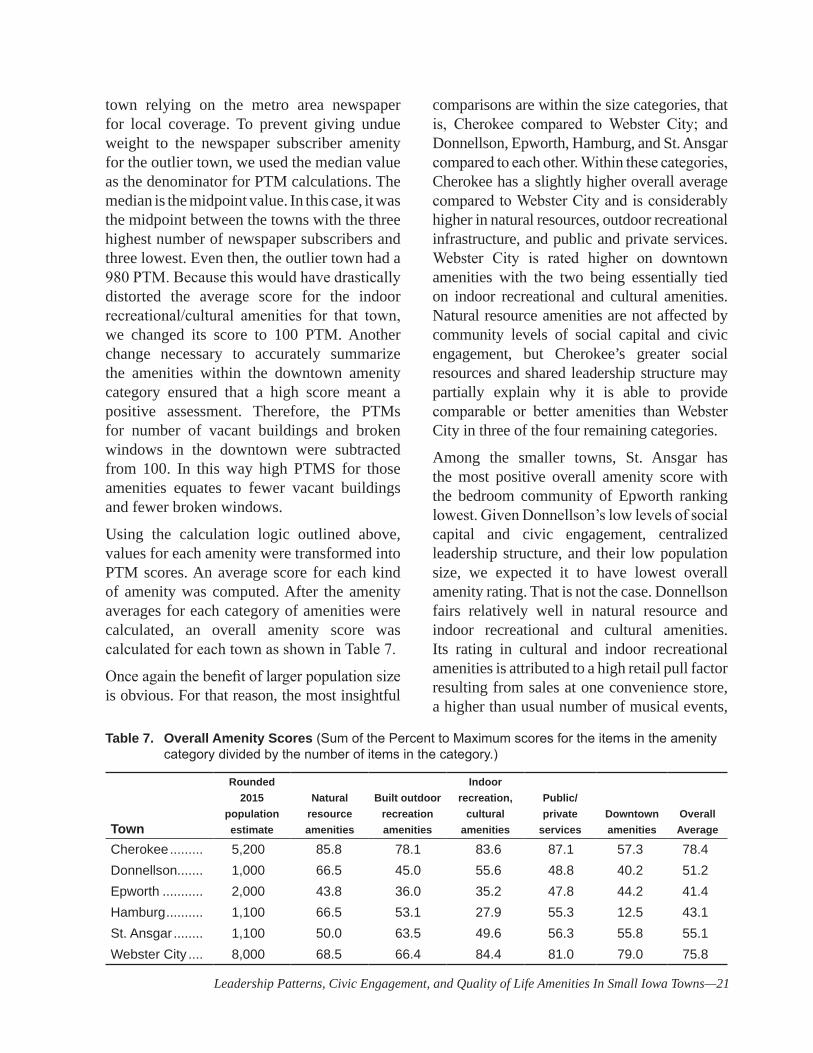
Using the calculation logic outlined above, values for each amenity were transformed into PTM scores. An average score for each kind of amenity was computed. After the amenity averages for each category of amenities were calculated, an overall amenity score was calculated for each town as shown in Table 7.
Once again the benefit of larger population size is obvious. For that reason, the most insightful
comparisons are within the size categories, that is, Cherokee compared to Webster City; and Donnellson, Epworth, Hamburg, and St. Ansgar compared to each other. Within these categories, Cherokee has a slightly higher overall average compared to Webster City and is considerably higher in natural resources, outdoor recreational infrastructure, and public and private services. Webster City is rated higher on downtown amenities with the two being essentially tied on indoor recreational and cultural amenities. Natural resource amenities are not affected by community levels of social capital and civic engagement, but Cherokee’s greater social resources and shared leadership structure may partially explain why it is able to provide comparable or better amenities than Webster City in three of the four remaining categories.
Among the smaller towns, St. Ansgar has the most positive overall amenity score with the bedroom community of Epworth ranking lowest. Given Donnellson’s low levels of social capital and civic engagement, centralized leadership structure, and their low population size, we expected it to have lowest overall amenity rating. That is not the case. Donnellson fairs relatively well in natural resource and indoor recreational and cultural amenities. Its rating in cultural and indoor recreational amenities is attributed to a high retail pull factor resulting from sales at one convenience store, a higher than usual number of musical events,
Table 7. Overall Amenity Scores (Sum of the Percent to Maximum scores for the items in the amenity category divided by the number of items in the category.)
Town
Rounded 2015
population estimate
Natural resource amenities
Built outdoor recreation amenities
Indoor recreation,
cultural amenities
Public/ private
servicesDowntown amenities
Overall Average
Cherokee ......... 5,200 85.8 78.1 83.6 87.1 57.3 78.4Donnellson....... 1,000 66.5 45.0 55.6 48.8 40.2 51.2Epworth ........... 2,000 43.8 36.0 35.2 47.8 44.2 41.4Hamburg .......... 1,100 66.5 53.1 27.9 55.3 12.5 43.1St. Ansgar ........ 1,100 50.0 63.5 49.6 56.3 55.8 55.1Webster City .... 8,000 68.5 66.4 84.4 81.0 79.0 75.8
22—Leadership Patterns, Civic Engagement, and Quality of Life Amenities In Small Iowa Towns
fairs, and festivals, and the large number of subscribers to the newspaper in a neighboring town that covers Donnellson news.
St. Ansgar is relatively low in natural resource amenities and second to lowest in population base compared to other towns in the sample. Nevertheless, it appears to overcome these challenges by providing more and better quality amenities in the other categories. Perhaps its positive social capital and civic engagement levels and shared leadership structure explain how it can rank higher than larger towns in outdoor recreational facilities, cultural and entertainment venues, public and private services, and downtown amenities.
Epworth’s overall lower score results from its low rating in natural resources, built outdoor amenities, public/private services, and second to lowest score in indoor recreational and
cultural amenities. There are no officially designated grassland/prairie areas, wetlands, or lakes in the county. The town does not have an outdoor public swimming pool, a physician present 5 days a week, OB/GYN physician, or mental health services in town. The low level of public/private services may result from residents using the services of the near-by metropolitan area making it harder to build a client base for local facilities and services. Town leaders cannot change the natural resource base in the area, but the recent population growth may furnish the need and the resources to improve the other amenities. Additionally, residents’ reported participation in local affairs and their positive assessment of town leadership and community social climate represent valuable assets to be tapped for future betterment projects.
Leadership Patterns, Civic Engagement, and Quality of Life Amenities In Small Iowa Towns—23
ConclusionThe towns in this study provide a fairly accurate representation of the current status of small Midwestern towns. Three of them have experienced significant shocks within the last decade; two economic and one a natural disaster. Three have lost a substantial portion of their population over the last 25 years. The populations of two have remained about the same and one has grown by more than 50 percent. A town’s location is an important factor in determining how shocks and circumstances impact it. Proximity to a major highway, a large river, or a metropolitan area, for example, can be boons for attracting economic activity and residents. They can also threaten community survival if they lure away businesses, retail sales, and residents; or drain resources necessary to respond to periodic natural emergencies.
Towns’ locations and surrounding natural resource amenities cannot be controlled by local residents. However, other resources are available to increase a town’s resilience to shocks and its ability to provide quality of life amenities for residents. We proposed that the community social climate consisting of bridging social capital, civic engagement, and leadership structure would distinguish the more resilient, successful towns from less successful ones. By successful, we mean able to furnish a sustainable, high quality of life to residents.
In this report we attempted to draw attention to the role amenities can play in rural development. Previous research suggests that amenities help to attract and retain population, especially the well educated, younger population. Community leaders need mechanisms for assessing local amenities in order to promote their strengths and address their weaknesses. However, existing amenity rating systems disadvantage small rural towns in the Corn Belt and Great Plains because
data for small towns are not available forcing them to rely on county indicators of climate and natural resources. Rural areas in the Corn Belt and Great Plains rate low on these measures compared to counties with coasts and mountains and warmer winters.
We utilized a methodology developed specifically for small rural towns. Both the quantity and quality of many of the amenities were measured relying on local experts, researchers’ observations and assessments, and state and national level ratings for quality evaluations. Town residents could gather the information to assess local amenities themselves. The process of deciding which amenities to include and gathering the information would be a community building project in and of itself. Of course, the resulting amenity scores would also be valuable for community planning and promotion.
Our analysis showed that, not surprisingly, larger towns are advantaged in possessing higher amenity scores (except for natural resources). However, amenity levels varied among the towns within the two size categories included in this study. Towns with more bridging social capital and civic engagement and a shared leadership structure (more on this below) are better at creating outdoor recreational; cultural, entertainment, and indoor recreational; downtown; and public and private service amenities than other towns. Epworth, the high growth, bedroom community is the anomaly scoring second highest in social capital and civic engagement but lowest in overall amenities.
Two types of leadership structures emerged from analyses of interviews with local leaders and data from the 2014 resident surveys. Shared leadership is characterized by decentralized, overlapping networks of residents involved and committed to community betterment. The two
24—Leadership Patterns, Civic Engagement, and Quality of Life Amenities In Small Iowa Towns
towns exemplifying this leadership structure also had high levels of bridging social capital and civic engagement; and the highest amenity scores within their population category. The other leadership structure is more centralized with projects sponsored or sanctioned by local officials and/or business “godfathers” and often implemented by “lone mavericks”. The lone mavericks we interviewed were not “hungry for power” or anti-social, but rather individuals who desired community improvement in the face of perceived general community apathy and/or ineffectiveness.
The current residents of towns characterized by concentrated leadership may find the community culture of low bridging social capital and low civic engagement and/or the legacy of godfathers as difficult to change as the surrounding natural resource base. However, a successful on-going project in Hamburg is an attempt to change the local social climate. This community improvement effort was initiated by a new resident with a coach, leadership training, and an “implementation template” provided by the state. Nine long-time residents are actively involved, recruiting as many as ten to fifteen others to help with specific projects. The group has earned a positive reputation through small projects such as the creation of a flower bed in front of city hall and cleaning up vacant lots. The visibility of successful small projects has helped them recruit others to work on short term (one day) efforts and a few others to join the core group. They have plans for more ambitious projects calling for greater community wide participation. Moreover, the initiative shows that residents are willing to accept ideas and leadership from outsiders and new comers. Changing the local social climate and leadership structure can only occur through small, incremental steps such as those demonstrated by this Hamburg project.
(Endnotes)
1 These statistics can be found at http://www.iowadatacenter.org/aboutdata/. Accessed on February 27, 2016.
2 http://kff.org/other/state-indicator/metropolitan-distribution/
3 Deller, S. C., Tsai, T. H., Marcouiller, D. W., & English, D. B. K. (2001). The role of amenities and quality of life in rural economic growth. American Journal of Agricultural Economics, 83, 352-365.
Goe, W. R., & Green, G. P. (2005). Amenities and change in the well-being of non-metropolitan localities. In G. P. Green, S. C. Deller, and D. W. Marcouiller (Eds.), Amenities and Rural Development: Theory, Methods, and Public Policy (pp. 95-112). Northhampton, MA: Edward Elgar.
4 Agnitsch, K., Flora, J. L. & Ryan, V. (2006). Bonding and bridging social capital: The interactive effects on community action. The Journal of the Community Development Society, 37(1), 36-51.
Besser, T. L. (2013). Resilient small rural towns and community shocks. Journal of Rural and Community Development. 8 (1): 117–134.
Crowe, J. (2009). Economic development in the nonmetropolitan West: The influence of built, natural and social capital. Journal of the Community Development Society, 39 (4), 51-70.
Green, G. P. (2005). What role can community play in local economic development. In D. L. Brown and L. E. Swanson (Eds.), Challenges for Rural America in the Twenty-first Century (pp. 343-353). University Park, PA: The Pennsylvania State University Press.
5 Pigg, K., Gasteyer S., K. Martin, G. Apaliyah & K. Keating. (2015). Community Effects of Leadership Development Education: Citizen Empowerment for Civic Engagement. Morgantown, WV: West Virginia University Press.
6 Besser, T. L. and Miller, N. J. (2013). “Social capital, local businesses, and rural community amenities.” Journal of Rural Studies. 32: 186-195.
Leadership Patterns, Civic Engagement, and Quality of Life Amenities In Small Iowa Towns—25
Besser, T. L. (2002). The Conscience of Capitalism: Business Social Responsibility to Communities. Westport, CT: Praeger.
Tolbert, C. M., Lyson, T.A., and Irwin, M.(1998). “Local capitalism, civic engagement, and socioeconomic well being.” Social Forces 77 (2):401-28.
7 Support for this assertion can be found in the following sources:
Clark, T. N. with Lloyd, R., Wong, K. K., & Jain, P. (2002). Amenities drive urban growth. Journal of Urban Affairs, 24(5), 493-515.
Sirgy, M. J. & Cornwell, T. (2001). Further validation of the Sirgey et al.’s measure of community quality of life. Social Indicators Research, 56, 125-143.
Sirgy, M. J., Rahtz, D. R., Cicic, M., & Underwood, R. (2000). A method for assessing residents’ satisfaction with community based services: A quality-of-life perspective. Social Indicators Research, 49, 279-316.
8 Clark, T. N. with Lloyd, R., Wong, K. K., & Jain, P. (2002). Amenities drive urban growth. Journal of Urban Affairs, 24(5), 493-515.
Florida, R. (2002a). The Rise of the Creative Class: And How It’s Transforming Work, Leisure, Community, and Everyday Life. New York: Basic Books.
Florida, R. (2002b). Bohemia and economic geography. Journal of Economic Geography, 2, 55-71.
Oldenburg, R. (1989) The Great Good Place: Cafes, Coffee Shops, Bookstores, Bars, Hair Salons, and Other Hangouts at the Heart of a Community. New York: Da Capo Books.

26— Leadership Patterns, Civic Engagement, and Quality of Life Amenities In Small Iowa Towns