
LEACHING ENVIRONMENTAL ASSESSMENT FRAMEWORK FOR …
23
LEACHING ENVIRONMENTAL ASSESSMENT FRAMEWORK FOR THE POTENTIAL REUSE OF DREDGED SEDIMENTS IN CONCRETE Tristan Lecomte 1,2 , Yannick Mamindy-Pajany 1,2 , Christine Lors 1,2 , Frédéric Becquart 1,2 , Nor-Edine Abriak 1,2 10th International SedNet Conference 14-17 June 2017 1 Mines Douai, LGCgE-GCE, F-59508 DOUAI, France 2 Université de Lille 1, Cité scientifique, 59655 Villeneuve d’Ascq, France
Transcript of LEACHING ENVIRONMENTAL ASSESSMENT FRAMEWORK FOR …
LEACHING ENVIRONMENTAL
ASSESSMENT
FRAMEWORK FOR THE
POTENTIAL REUSE OF
DREDGED SEDIMENTS IN
CONCRETE
Tristan Lecomte 1,2, Yannick Mamindy-Pajany 1,2,
Christine Lors 1,2, Frédéric Becquart 1,2,
Nor-Edine Abriak 1,2
10th International SedNet
Conference 14-17 June 2017 1Mines Douai, LGCgE-GCE, F-59508 DOUAI, France 2Université de Lille 1, Cité scientifique, 59655 Villeneuve d’Ascq, France
1. Context of the study

CONTEXT OF THE STUDY
3
Dunkirk major seaport Natural accumulation of
sediments causes the
reduction of the draught
needed for shipping
Threat for the local economy
Need to dredge 3-4 million
m3 per year
Including 500 000 m3 non
submergible (geochemical characterisation)
SEDIMATERIAUX: French national approach was introduced since 2009 by French
ministry of ecology, Nord-Pas-de-Calais regional Council, prefecture, CD2E and
Ecole des Mines de Douai (IMT Lille – Douai)
Bring adapted answers to manage and reuse marine and
continental dredged sediment on-shore

4
Dredged sediment S
ED
IMA
TE
RIA
UX
ME
TH
OD
OL
OG
Y
ST
EP
1
CH
AR
AC
TE
RIS
AT
ION
S
TE
P 2
LA
BO
RA
TO
RY
ST
EP
3
FIE
LD
Regulation and additional characterisations
Impact assessment of the project
Project finalization and validation
Mix design study
Test samples analysis Experimental boards
conception and follow-up
Validation of mechanical and environmental feasibility of the chosen beneficial reuse
under controlled conditions
Experimental pilot design
and instrumentation
Pilot mechanical and
environmental follow-up
Pilot site groundwater
quality monitoring
Validation of mechanical and environmental feasibility of the chosen beneficial reuse
under real conditions
CONTEXT OF THE STUDY

2. Aims of the study

AIM OF THE STUDY
6
• Implementation of SEDIMATERIAUX methodological approach to check
environmental suitability of marine dredged sediments for their integration in
concrete

3. Lab experimentation:
Standardised tests
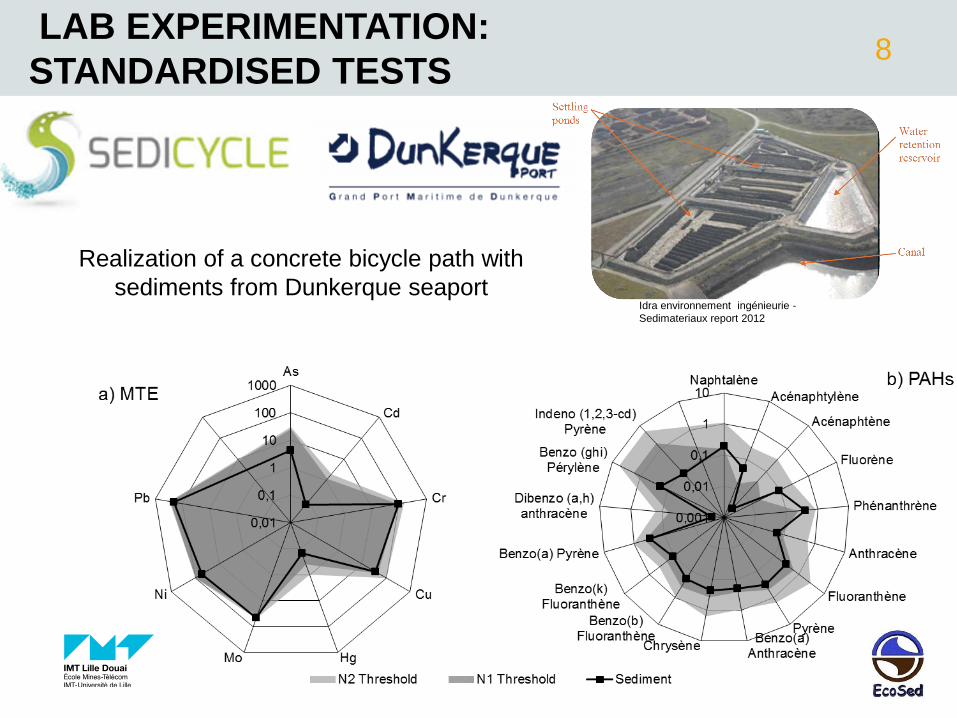
LAB EXPERIMENTATION:
STANDARDISED TESTS 8
Dredged sediment S
TE
P 3
FIE
LD
Realization of a concrete bicycle path with
sediments from Dunkerque seaport Idra environnement ingénieurie -
Sedimateriaux report 2012

9
Sample name C0 C12,5 C25 C50-1 C50-2 C75-1 C75-2 C100
% of sediment substitution of the sand fraction 0 12,5 25 50 50 75 75 100
Plasticizer (% cementitious fraction) 0,5 0,5 0,5 0,5 3 0,5 3 3
Rc (Mpa) 38,09 32,73 31,43 24,69 33,29 19,78 23,01 18,63
Sand fraction amount to 35% of the material
LAB EXPERIMENTATION:
STANDARDISED TESTS

10
Dynamic monolithic leaching test (DMLT)
LAB EXPERIMENTATION:
STANDARDISED TESTS
Standard test NF EN 12457-2 : inert products
(according french decree for Inert Waste Storage)
Concentration (mg/kg dry
matter) C0 C50-1 C50-2
French Inert thresholds
IWS (mg/kg)
As < 0,02 < 0,02 < 0,02 0,5 Ba 11,26 12,42 14,31 20 Cd 0,002 0,002 0,002 0,04 Cr 0,04 0,03 0,03 0,5 Cu 0,08 0,30 0,22 2 Hg - - - 0,01 Mo 0,14 0,16 0,14 0,5 Ni 0,01 0,20 0,19 0,4
Pb <0,05 <0,04 <0,04 0,5
Sb <0,06 <0,06 <0,06 0,06
Se <0,04 <0,03 <0,03 0,1
V 0,07 0,07 0,08 -
Zn 0,02 0,02 0,02 4
Fluorures < 2,5 < 2,5 < 2,5 10
Chlorides 91 91 454 800
Sulphates 21 21 32 1000
Soluble fraction 5000 9500 10000 4000

11 DYNAMIC MONOLITHIC LEACHING TEST (NF EN 15863)
LAB EXPERIMENTATION:
STANDARDISED TESTS

4. Small scale experiments
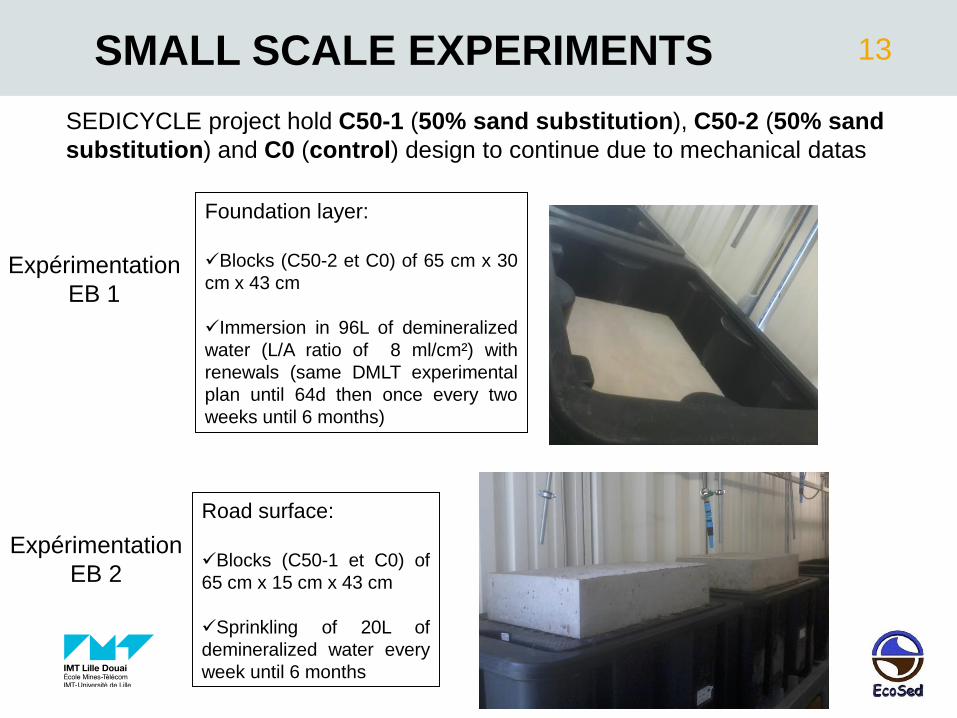
13 SMALL SCALE EXPERIMENTS
Road surface:
Blocks (C50-1 et C0) of
65 cm x 15 cm x 43 cm
Sprinkling of 20L of
demineralized water every
week until 6 months
Foundation layer:
Blocks (C50-2 et C0) of 65 cm x 30
cm x 43 cm
Immersion in 96L of demineralized
water (L/A ratio of 8 ml/cm²) with
renewals (same DMLT experimental
plan until 64d then once every two
weeks until 6 months)
Expérimentation
EB 1
Expérimentation
EB 2
SEDICYCLE project hold C50-1 (50% sand substitution), C50-2 (50% sand
substitution) and C0 (control) design to continue due to mechanical datas

14 SMALL SCALE EXPERIMENTS

15 SMALL SCALE EXPERIMENTS
Under Dutch Soil Quality Decree for 64d results
C0 C50-2 C50-1
64d DMLT 64d EB1 64d EB2 64d DMLT 64d EB1 64d DMLT 64d EB2
As < 3,3 < 3,3 < 3,3 < 3,3 < 3,3 < 3,3 < 3,3 260
Ba 33 43,1 3,3 68,6 47 82,9 3,8 1500
Cd < 0,09 < 0,09 < 0,09 < 0,09 < 0,09 < 0,09 < 0,09 3,8
Co < 1,1 < 1,1 < 1,1 < 1,1 < 1,1 < 1,1 < 1,1 60
Cr < 1,7 < 1,7 < 1,7 < 1,7 < 1,7 < 1,7 < 1,7 120
Cu < 10,1 < 10,1 < 10,1 < 10,1 < 10,1 < 10,1 < 10,1 98
Hg - - - - - - - 1,4
Mo < 1,2 < 1,2 < 1,2 < 1,2 < 1,2 < 1,2 < 1,2 144
Ni < 0,8 < 0,8 < 0,8 < 0,8 < 0,8 < 0,8 < 0,8 81
Pb < 1,5 < 1,5 < 1,5 < 1,5 < 1,5 < 1,5 < 1,5 400
Sb < 2,7 < 2,7 < 2,7 < 2,7 < 2,7 < 2,7 < 2,7 8,4
Se < 2,6 < 2,6 < 2,6 < 2,6 4,5 < 2,6 < 2,6 4,8
Sn < 1,4 4,8 < 1,4 < 1,4 4,6 < 1,4 < 1,4 50
V 1,1 5,6 < 0,7 1,7 6 1,5 0,8 320
Zn < 2 10,5 68,4 1,8 5,3 < 2 60,9 800
Fluorides <150 < 150 < 150 < 150 < 150 < 150 < 150 2500
Chlorides 345 914 695 2022 3912 1922 1312 110000
665 2997 135 1542 4516 1615 2846 165000
180d cumulative
concentration mg/m²
Duch Soil Quality
Decree (64d NEN 7345)
Sulphates
16
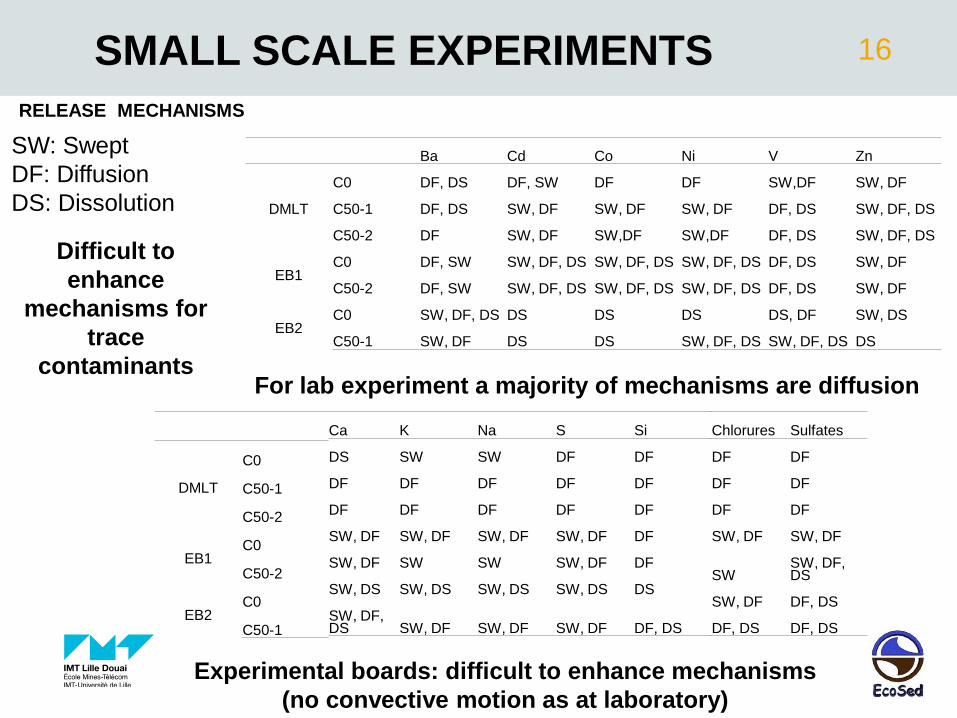
RELEASE MECHANISMS
Chlorures Sulfates
DF DF
DF DF
DF DF
SW, DF SW, DF
SW SW, DF, DS
SW, DF DF, DS
DF, DS DF, DS
Ca K Na S Si
DS SW SW DF DF
DF DF DF DF DF
DF DF DF DF DF
SW, DF SW, DF SW, DF SW, DF DF
SW, DF SW SW SW, DF DF
SW, DS SW, DS SW, DS SW, DS DS
SW, DF, DS SW, DF SW, DF SW, DF DF, DS
SW: Swept
DF: Diffusion
DS: Dissolution
Difficult to
enhance
mechanisms for
trace
contaminants For lab experiment a majority of mechanisms are diffusion
Experimental boards: difficult to enhance mechanisms
(no convective motion as at laboratory)
Ba Cd Co Ni V Zn
DMLT
C0 DF, DS DF, SW DF DF SW,DF SW, DF
C50-1 DF, DS SW, DF SW, DF SW, DF DF, DS SW, DF, DS
C50-2 DF SW, DF SW,DF SW,DF DF, DS SW, DF, DS
EB1 C0 DF, SW SW, DF, DS SW, DF, DS SW, DF, DS DF, DS SW, DF
C50-2 DF, SW SW, DF, DS SW, DF, DS SW, DF, DS DF, DS SW, DF
EB2 C0 SW, DF, DS DS DS DS DS, DF SW, DS
C50-1 SW, DF DS DS SW, DF, DS SW, DF, DS DS
SMALL SCALE EXPERIMENTS
DMLT
C0
C50-1
C50-2
EB1 C0
C50-2
EB2 C0
C50-1
5. Pilot scale experiment

PILOT SCALE EXPERIMENT 18
OUTDOOR EXPOSURE
1. Swept concrete with 50% sand
substitution rate
2. Swept concrete with 30% sand
substitution rate
3. Control concrete
Owen recorders
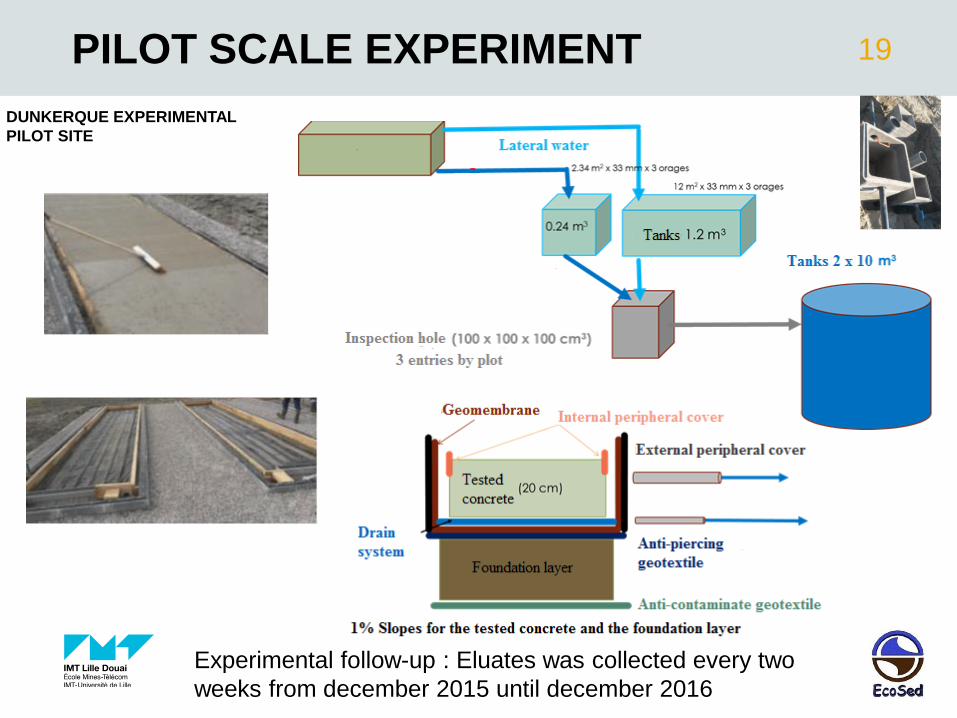
19
DUNKERQUE EXPERIMENTAL
PILOT SITE
Experimental follow-up : Eluates was collected every two
weeks from december 2015 until december 2016
PILOT SCALE EXPERIMENT

20
Contaminant (mg/m²/year)
with lateral water Run- off only Cerema
2015 threshold
C50-1 C30 C0 C50-1 C30 C0
With owen
Without owen
With owen
Without owen
With owen
Without owen
With owen
Without owen
With owen
Without owen
With owen
Without owen
As 3,9 5,4 6,3 7,7 2,3 4,2 2,8 3,6 3,2 4,1 1,6 2,6 10
Ba 38,1 96,8 42,3 98,5 110,2 171,9 29,3 58,5 20,8 51,7 79,4 109,1 700
Cd 0,0 1,1 0,0 1,1 0,0 1,1 0,0 0,6 0,0 0,6 0,0 0,6 4
Cr 1,4 3,1 3,5 5,3 1,8 3,7 0,9 2,0 1,0 1,9 1,6 2,5 50
Cu 3,6 6,1 4,6 7,8 1,2 4,8 1,5 3,1 1,3 3,3 0,9 2,8 625
Hg 0,0 0,5 0,1 0,3 0,2 0,6 0,0 0,3 0,0 0,3 0,2 0,3 1
Mo 6,9 8,2 5,7 7,1 3,4 4,8 5,1 5,8 3,6 4,4 3,1 3,8 70
Ni 2,7 4,0 3,2 4,6 0,8 2,3 1,6 2,3 1,5 2,2 0,7 1,5 20
Pb 0,0 2,9 0,05 3,07 0,2 3,3 0,0 1,5 0,0 1,6 0,2 1,8 10
Sb 0,8 1,6 0,7 1,6 1,2 2,3 0,4 0,9 0,3 0,8 1,0 1,5 5
Se 0,0 3,4 0,03 2,69 0,0 2,6 0,0 1,8 0,0 1,8 0,0 0,9 6
Zn 2,8 13,1 2,9 15,5 3,3 18,3 0,9 6,1 0,3 5,5 1,0 7,8 625
V 18,1 20,2 34,0 36,8 13,0 16,1 15,0 15,9 13,3 14,7 10,1 11,7 -
Fluorides 168 399 162 416 87 340 126 249 94 224 61 191 750
Chlorides 49821 55657 62689 69930 20737 28348 38969 41621 54038 57796 18053 22127 125000
Sulphates 52402 53604 64070 66476 27590 31182 35776 35977 41203 42450 19491 21390 125000
PILOT SCALE EXPERIMENT
With owen: external pollution was substracted
Without owen: externalpollution was not substracted

6. Conclusions
and perspectives

CONCLUSIONS AND PERSPECTIVES 22
The methodology allowed to validate the reuse of marine dredged sediments in concrete
Ease of
set-up
Realistic
conditions Conformity of theses materials regarding
existing guidelines
Confirm laboratory experiment showing
differencies between sediment base concrete
and control chemicals release
Plasticizer concentration could affect
chemicals transfert
Sediment based concrete tested near to field
conditions
Followed up one year
More realistic conditions
Fluxes values under guidelines
23 THANK YOU FOR YOUR ATTENTION
http://www.sedicycle.eu/


![[DRAFT] Environmental Management Framework](https://static.fdocuments.in/doc/165x107/61c7a7aa5dac2441ea5d1d9c/draft-environmental-management-framework.jpg)


