lCAO - caisatech.net
59
lCAO CIRCULAR 280-ATII 17 CIRCULAR I REGIONAL DIFFERENCES IN INTERNATIONAL I AIRLINE OPERATING ECONOMICS Approved by the Secretary General and published undw i s authority INTERNATIONAL CIVIL AVIATION ORGANIZATION MONTREALeCANADA
Transcript of lCAO - caisatech.net
l C A O CIRCULAR 280-ATII 17
C IRCULAR
I REGIONAL DIFFERENCES IN INTERNATIONAL
I AIRLINE OPERATING ECONOMICS
Approved by the Secretary General and published undwis authority
I N T E R N A T I O N A L C I V I L A V I A T I O N O R G A N I Z A T I O N MONTREALeCANADA

Published in separate English, French, Russian and Spanish editions by the International Civil Aviation Organization. All correspondence, except orders and subscriptions, should be addressed to the Secretary General.
Orders should be sent to one of the following addresses, together with the appropriate remittance (by bank draft, cheque or money order) in U.S. dollars or the currency of the country in which the order is placed. Credit card orders (American Express, Mastercard and Visa) are accepted at ICAO Headquarters.
International Civil Aviation Organization. Attention: Document Sales Unit 999 University Street, Montreal, Quebec, Canada H3C 5H7 Telephone: (514) 954-8022; Telex: 05-24513; Facsimile: (514) 954-6769; Sitatex: YULADYA; E-mail: [email protected]
Egypt. ICAO Regional Director, Middle East Office, Egyptian Civil Aviation Complex, Cairo Airport Road, Heliopolis, Cairo 11776 Telephone: (20 2) 267-4840; Facsimile: (20 2) 267-4843; Sitatex: CAICAYA
France. Directeur regional de I'OACI, Bureau Europe et Atlantique Nord, 3 bis, villa mile-~er~erat, 92522 Neuilly-sur-Seine (Cedex) Ttltphone: (33 1) 46 41 85 85; TCMcopieur: (33 1) 46 41 85 00; Sitatex: PAREUYA
India. Oxford Book and Stationery Co., Scindia House, New Delhi 110001 or 17 Park Street, Calcutta 700016 Telephone: (91 11) 331-5896; Facsimile: (91 11) 332-2639
Japan. Japan Civil Aviation Promotion Foundation, 15-12, I-chome, Toranomon, Minato-Ku, Tokyo Telephone: (81 3) 3503-2686; Facsimile: (81 3) 3503-2689
Kenya. ICAO Regional Director, Eastern and Southern African Office, United Nations Accommodation, P.O. Box 46294, Nairobi Telephone: (254-2) 622-395; Facsimile: (254 2) 226-706; Sitatex: NBOCAYA
Mexico. Director Regional de la OACI, Oficina Norteamtrica, Centroamaica y Caribe, Masaryk No. 29-3er. piso, Col. Chapultepec Morales, Mtxico, D.F., 11570 Teltfono: (52 5) 250-3211; Fdcsimile: (52 5) 203-2757; Sitatex: MEXCAYA
Peru. Director Regional de.la OACI, Oficina Sudarntrica, Apartado 4127, Lima 100 TelCfono: (51 14) 302260; Facsimile: (51 14) 640393; Sitatex: LIMCAYA
Russian Federation. Aviaizdat, 48, 1. Franko Street, Moscow 121351 Telephone: (7 095) 417-0405; Facsimile: (7 095) 417-0254
Senegal. Directeur regional de I'OACI, Bureau Afrique occidentale et centrale, Boite postale 2356, Dakar Ttltphone: (221) 8-23-54-52; TCltcopieur: (221) 8-23-69-26; Sitatex: DKRCAYA
South Africa. Avex Air Training (Pty) Ltd., Private Bag X102, Halfway House, 1685, Republic of South Africa Telephone: (27-1 1) 315-000314; Facsimile: (27-1 1) 805-3649; E-mail: [email protected]
Spain. A.E.N.A. - Aeropuertos Espafioles y Navegaci6n ACrea, Calle Juan Ignacio Luca de Tena, 14, Planta Tercera, Despacho 3. 11, 28027 Madrid Teltfono: (34 91) 321-3148; Facsimile: (34 91) 321-3157; Correo electrbnico: [email protected]
Thailand. ICAO Regional Director, Asia and Pacific Office, P.O. Box 11, Samyaek Ladprao, Bangkok 10901 Telephone: (66 2) 537-8189; Facsimile: (66 2) 537-8199; Sitatex: BKKCAYA
United Kingdom. Westward Documedia, 37 Windsor Street, Cheltenham, Glos., GL52 2DG Telephone: (44 1242) 235-15 1; Facsimile: (44 1242) 584-139
m
Catalogue of ICAO Publications and Audio-visual Training Aids
Issued annually, the Catalogue lists all publications and audio-visual training aids currently available.
Monthly supplements announce new publications and audio-visual training aids, amendments, supplements, reprints, etc.
Available free from the Document Sales Unit, ICAO

TABLE OF CONTENTS
Page
................................................... 1 . INTRODUCTION 1
........................................ 2 . LEVELS OF UNIT REVENUES 2
Passengertraffic . . . . . . . . . . . . . . . . . . . . . . . . . . . . . . . . . . . . . . . . . . . . . . . . . . . 2 . . . . . . . . . . . . . . . . . . . . . . . . . . . . . . . . . . . . . . . . . . . . . . . Freight and mail traffic 4
3 . REGIONAL DIFFERENCES IN SCHEDULED PASSENGER UNIT REVENUES ............................................. AND RELATED COSTS 11
. . . . . . . . . . . . . . . . . . . . . . . . Overall financial results by international route group 11 . . . . . . . . . . . . . . . . . . . . . . . . . Comparison of results for 1997 with those for 1992 12
. . . . . . . . . . . . . . . . . . . . . . . . . . . Variations in revenuelcost ratios among airlines 15
................ 4 . FACTORS CAUSING REGIONAL DIFFERENCES IN COSTS 21
. . . . . . . . . . . . . . . . . . . . . . . . . . . . . . . . . . . . . . . . . Aircraft mix and stage length 21
. . . . . . . . . . . . . . . . . . . . . . . . . . . . . . . . . . . . . . . . . Prices for aircraft fuel and oil 23 Airportandassociatedcharges . . . . . . . . . . . . . . . . . . . . . . . . . . . . . . . . . . . . . . . 25 Loadfactor . . . . . . . . . . . . . . . . . . . . . . . . . . . . . . . . . . . . . . . . . . . . . . . . . . . . . . . 26
. . . . . . . . . . . . . . . . . . . . . . . . . . . . . Other causes of regional differences in costs 26 . . . . . . . . . . . . . . . . . . . . . Summary of the causes of regional differences in costs 29
. . . . . . . . . . . . APPENDIX 1 . SELECTED DATA SERIES COVERING 1992 TO 1997 31
. . . . . . . . . . . . . . . . . . . . . . . . . . APPENDIX 2 . DATA SOURCES AND COVERAGE 40
Sources . . . . . . . . . . . . . . . . . . . . . . . . . . . . . . . . . . . . . . . . . . . . . . . . . . . . . . . . . 40 Coverage . . . . . . . . . . . . . . . . . . . . . . . . . . . . . . . . . . . . . . . . . . . . . . . . . . . . . . . . . 40
APPENDIX 3 . METHOD OF ANALYSIS AND MARGINS OF UNCERTAINTY . . . . . . 45
Methodofanalysis . . . . . . . . . . . . . . . . . . . . . . . . . . . . . . . . . . . . . . . . . . . . . . . . . . 45 . . . . . . . . . . . . . . . . . . . . . . . . . . . . . . . . . . . . . . . . . . . . . . . Margins of uncertainty 48
APPENDIX 4 . QUESTIONNAIRES RELATING TO REVENUES AND COSTS . . . . . . 50
. . . . . . . . . . . . . . . . . . . . . . . . . . I . Facsimiles of questionnaires and attachments 50 . . . . . . . . . . . . . . . . . . . . . . . . . . . . . . . . . . . . . . II . Respondents to questionnaires 54

Chapter 2 LEVELS OF UNIT REVENUES
Passenger traffic
2.1 Estimates of average unit passenger revenues in 1997 by route group are presented in Table 2-1.
2.2 The first column of Table 2-1 shows the average revenue per passenger-kilometre for scheduled passenger traffic on each route group. These data are considered representative of all airlines operating on that route group and also include estimates for non-reporting airlines. The data are presented without distinction to class of travel or fare type. Thus they represent the overall weighted average for all individual routes on all route groups and for all fare types. The overall average revenue per passenger-kilometre was estimated at 8.20 cents for 1997, but the route group averages vary from a high of 17.3 cents in local Europe to a low of 5.5 cents on routes across the Mid-Atlantic. Due to inadequate representation in reporting, two route groups, Central AmericdCaribbean and local Africa, are not included in this analysis, although their estimates are included in the worldwide totals.
2.3 The second column of Table 2-1 depicts the average revenue per passenger-kilometre for non- scheduled passenger traffic reported for each route group. In this case, no attempt has been made to estimate unit revenues for non-reporting air carriers. The average revenue per passenger-kilometre for non-scheduled services ranges from a high of 13.6 cents for traffic within North America to a low of 4.3 cents on routes between North America and Central AmericaICaribbean. Except for routes in local Europe, where the bulk of non-scheduled operations is to be found, the non-scheduled traffic reported is limited in volume. It is estimated that non-scheduled traffic represented just under 14 per cent of the total international passenger-kilometres performed in 1997. The final two columns of Table 2-1 show the average passenger load factor for scheduled services and non-scheduled services.
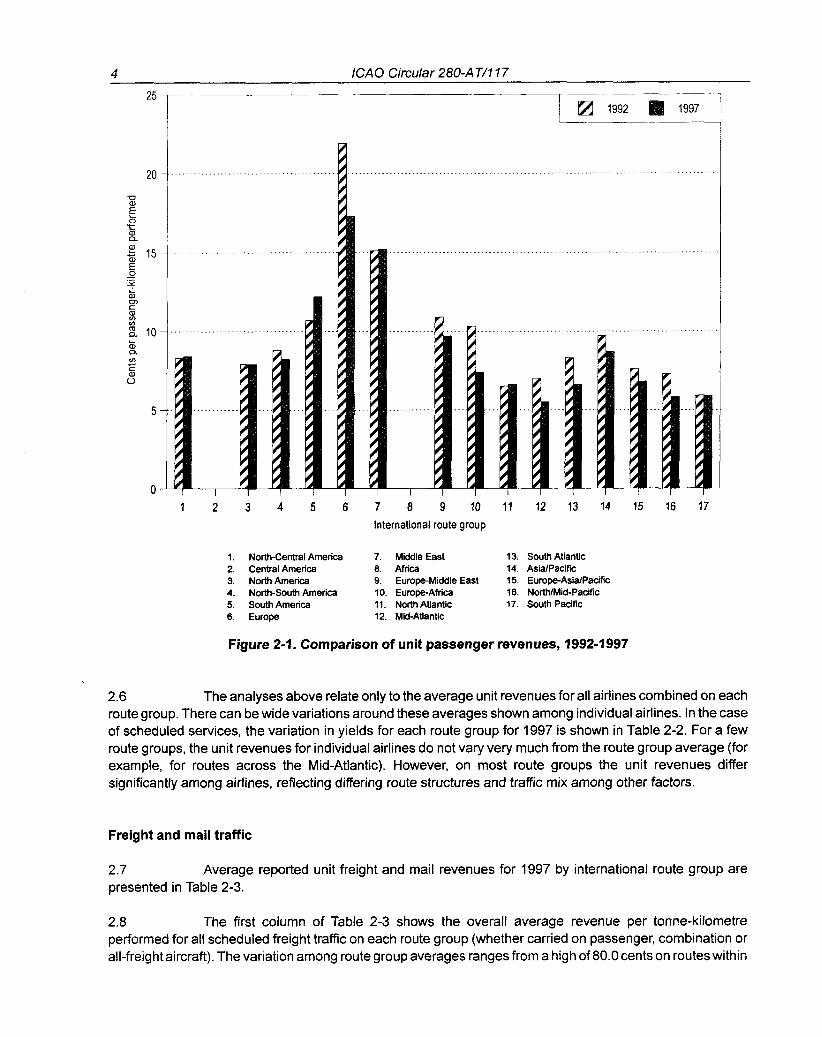
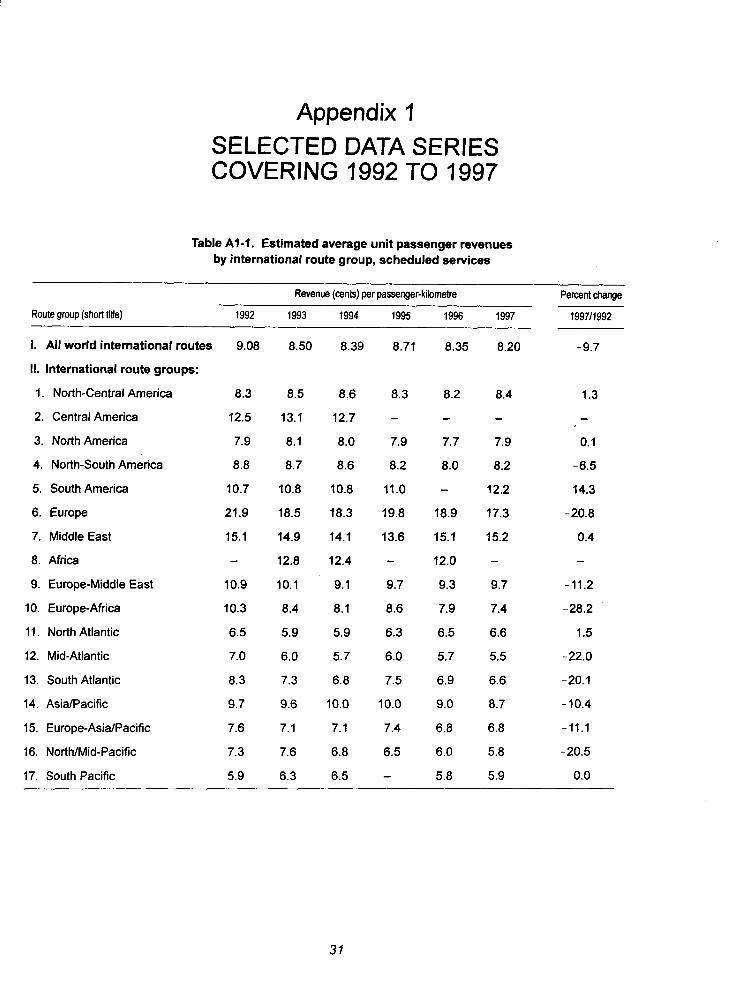
2.4 On a worldwide basis, the estimated average revenue per passenger-kilometre for scheduled services (excluding incidental revenues) at 8.20 cents in 1997 showed a decrease of about 10 per cent from the 9.08 cents achieved in 1992. Comparable data by route group between 1992 and 1997 are only available for 15 individual route groups. Figure 2-1 shows that of these 15 route groups, 9 showed significant decreases in yields between 1992 and 1997, ranging from a reduction of some 28 per cent for routes between Europe and Africa to almost 7 per cent for routes between North and South America. For the South Pacific and North American route groups, the average yield remained almost the same. For the remaining 4 route groups, minor increases were observed, except for routes within South America where an increase of 14 per cent occurred. A year-to-year comparison of the estimated average revenue per passenger-kilometre for the years 1992 to 1997 is shown in Table A l - I of Appendix 1.
2.5 The changes in yields experienced between 1992 and 1997 reflect the strengthening of the U.S. dollar against most of the other world currencies, especially the currencies of African countries. However, some States in the AsiaIPacific Region saw their currencies appreciating against the U.S. dollar. Hence the relative change between 1992 and 1997 would, in many cases, be significantly different if expressed in the national 'currencies of the airlines concerned. A brief evaluation of this effect is given in Chapter 3, 3.10 and 3.11.

ICAO Circular 280-A T/117 3
Table 2-1. Estimated average unit passenger revenues by international route group', 1997
Revenue (cents) per passenger-kihtre Load factors --
Non-schedukd flghts Nm-sdwtduled Rights Scheduled Schedulad
Route group2 s c ~ v i u d All categories service3 All categom
I. Between North America and Central America/ Caribbean 8.4 4.3 68 56
2. Between and within Central America and Caribbean - - - -
3. Between Canada, Mexico and the United States 7.9 13.6 66 78
4. Between North America1 Central AmericalCaribbean and South America 8.2 5.6 61 76
5. Local South America 12.2 - 58 - 6. Local Europe 17.3 4.8 64 82
7. Local Middle East 15.2 - 59 -
8. Local Africa
9. Between Europe and Middle East 9.7 4.5 85 84
10. Between EuropelMiddle East and Africa 7.4 5.4 7 1 80
11. North Atlantic 6.6 4.7 78 78
12. Mid-Atlantic 5.5 5.5 78 82
13. South Atlantic 6.6 - 74 -
14. Local AsiaIPacific 8.7 10.3 65 62
15. Between EuropelMiddle EasffAfrica and AsialPacific 6.8 7.0 72 57
16. North and Mid-Pacific 5.8 6.2 73 59
17. South Pacific 5.9 - 71 -
1 Data for scheduled services, where presented, are considered representative for all a~rllnes operat~ng In the route group concerned Data for nan-scheduled fllghts represent only carners for which substantive lnformat~on was available and are only presented where they Include two or more carriers The tepresentatlve nature of the data for Wttl scheduled servrces and non-scheduled services IS descnbed IR Append~x 2, and the marglns of uncerta~nty to be taken Into account regard~ng the scheduled services are d~scussed In Appendlx 3 For routes between and wth~n Central Amer~ca and Caribbean and In lwal Afnca, the reoresentat~cn was inadequate to justly separate representat~on, but the data have been included In the world averages
2 More deta~led deflnllron of the route groups may be found In Appendlx 4 or; the reverse of the revenue questlonnalre 3 These f~gures do not generally Include such lnc~dental opcrat~ng revenues as rnay be attr~buted to ilternational
passenger traff~c On ~nd~vlduai route groups ~ncidental operatirig revenues not Included may represent up to an addttlonal6 per cent uver the average revenue quoted
4 ICAO Circular 280-A T/17 7
1 2 3 4 5 6 7 8 9 10 11 12 13 14 15 16 17 International route group
I . North-Central America 7. Middle East 13. South Atlantic 2. Central America 8. Africa 14. AsidPacific 3. North America 9. Europe-Middle East 15. Europe-AsidPacific 4. North-South America 10. Europe-Africa 16. NorthIMid-Pacif~c 5. South America 11. North Atlantic 17. South Pacific 6. Europe 12. Mid-Atlantic
Figure 2-1. Comparison of unit passenger revenues, 1992-1997
2.6 The analyses above relate only to the average unit revenues for all airlines combined on each route group. There can be wide variations around these averages shown among individual airlines. In the case of scheduled services, the variation in yields for each route group for 1997 is shown in Table 2-2. For a few route groups, the unit revenues for individual airlines do not vary very much from the route group average (for example, for routes across the Mid-Atlantic). However, on most route groups the unit revenues differ significantly among airlines, reflecting differing route structures and traffic mix among other factors.
Freight and mail traffic
2.7 Average reported unit freight and mail revenues for 1997 by international route group are presented in Table 2-3.
2.8 The first column of Table 2-3 shows the overall average revenue per tonne-kilometre performed for all scheduled freight traffic on each route group (whether carried on passenger, combination or all-freight aircraft). The variation among route group averages ranges from a high of 80.0 cents on routes within
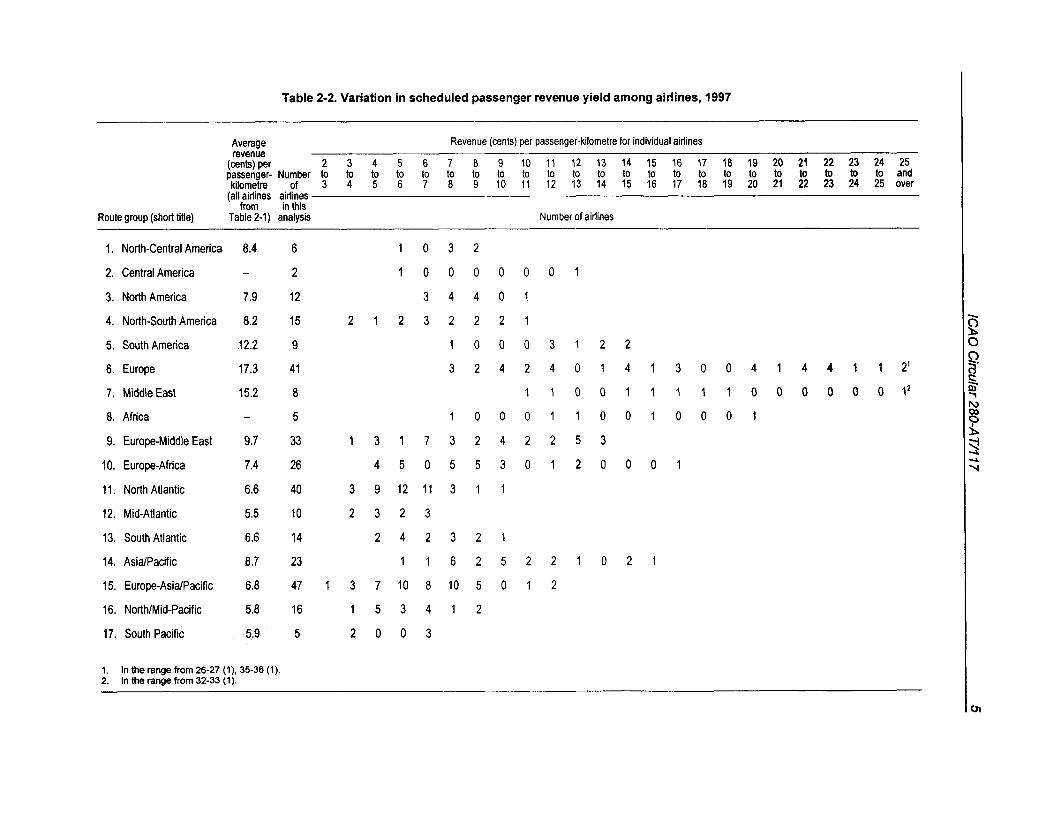
Table 2-2. Var ia t ion in schedu led passenger revenue y i e l d a m o n g airl ines, 1997
Average Revenue (cents) per passenger-kilometre for individual airlines revenue
(cents) per 2 3 4 5 6 7 8 9 10 11 12 13 14 15 16 17 18 19 20 21 22 23 24 25 passenger-Number to to to to to to to to to to to to to to to to to to to to to to to and kilometre of 3 4 5 6 7 8 9 10 11 12 13 14 15 16 17 18 19 20 21 22 23 24 25 over
(all airlines airlines from in this
Route group (short title) Table 2-1) analysis Number of airlines
1. North-Central America 8.4 6 1 0 3 2
2. Central America - 2 1 0 0 0 0 0 0 1
3. North America 7.9 12 3 4 4 0 1
4. North-South America 8.2 15 2 1 2 3 2 2 2 1
5. South America 12.2 9
6. Europe 17.3 41
7. Middle East 15.2 8
8. Africa - 5 1 0 0 0 1 1 0 0 1 0 0 0 1
9. Europe-Middle East 9.7 33 1 3 1 7 3 2 4 2 2 5 3
10. Europe-Africa 7.4 26 4 5 0 5 5 3 0 1 2 0 0 0 1
11. North Atlantic 6.6 40 3 9 1 2 1 1 3 1 1
12. Mid-Atlantic 5.5 10 2 3 2 3
13. South Atlantic 6.6 14 2 4 2 3 2 1
14. AsidPacific 8.7 23 1 1 6 2 5 2 2 1 0 2 1
15. Europe-AsidPacific 6.8 47 1 3 7 10 8 10 5 0 1 2
16. NorthlMid-Pacific 5.8 16 1 5 3 4 1 2
17. South Pacific 5.9 5 2 0 0 3
I. In the range from 26-27 (I), 35-36 (1). 2. In the range from 32-33 (1).

6 ICA 0 Circular 280-A T/1 1 7
Table 2-3. Reported average unit freight and mail revenues by international route group, 1997'
Freight revenue (cents) per tonne-kilometre performed
Mail revenue Scheduled services (cents)
per tonne- Passenger kilometre
and Non- performed - wmb~nation All-freight scheduled scheduled
Route group (short title) Overall aircraft aircraft flights services
1. North-Central America 23.9 23.9 - 58.9 27.5
2. Central America 42.8 42.8 - - -
3. North America
4. North-South America
5. South America
6. Europe
7. Middle East
8. Africa
9. Europe-Middle East
10. Europe-Africa
11. North Atlantic
12. Mid-Atlantic
13. South Atlantic
14. AsiaIPacific
15. Europe-AsiaIPacific
16. NorthlMid-Pacific
17. South Pacific
1. Data represent only carriers for which substantive information was available and are only presented where they include two or more carriers. The representative nature of the data is described in Appendix 2.
Europe to a low of 22.9 cents on routes across the NorthIMid-Pacific. Compared with 1992, of the 17 route groups, 12 experienced a decrease ranging from some 40 per cent for routes within the Middle East to just under 2 per cent for routes between North and South America. Traditionally one of the lowest, average freight yield across the North Atlantic remained unchanged between 1992 and 1997 (Figure 2-2 and Table A1-3 of Appendix 1). For the remaining 4 route groups, routes within South America showed an increase of some 14 per cent while the freight yields within Africa, North America and across the South Pacific grew by around 5 per cent.
2.9 The second and third columns of Table 2-3 show the average revenue per tonne-kilometre performed for scheduled freight traffic carried on passenger or combination aircraft and on all-freight aircraft. The unit revenue from all-freight aircraft on some route groups is lower than that of passenger and combination aircraft because the former are more likely to carry large shipments which are subject to quantity discount rates or low specific commodity rates. However, for some route groups where there is large cargo capacity offered at competitive rates on wide-body passenger and combination aircraft (for example, on routes across the North1

ICAO Circular 280-A T/117 7
1 2 3 4 5 6 7 8 9 10 11 12 13 14 15 16 17 International route group
1. North-Central America 7. Middle East T3. South Atlantic 2. Central America 8. Africa 14. AsiaIPacific 3. NorVl America 9. Europe-Middle East 15. Europe-AsiaIPacific 4. North-South America 10. Europe-Africa 16. Nomid-Pacific 5. South America 11. North Atlantic 17. South Pacific 6. Europe 12. Mid-Atlantic
Figure 2-2. Comparison of unit freight revenues, 1992-1997
Mid-Pacific), the difference in revenue yield may be less or even the opposite, reflecting the fact that, depending on the mix of traffic, the freight cost basis on combination aircraft may allow much lower rates to be offered than those on pure freight services. In the case of some routes involving North America, the higher freight revenue yield on all-cargo services reflects the data of a major all-freight air carrier, which also includes courier traffic and revenue in its figures.
2.10 The fourth column of Table 2-3 shows the average revenue per tonne-kilometre performed for all non-scheduled freight traffic on each international route group. The unit revenues among route groups range from a high of 107.1 cents on routes in local Europe to a low of 20.0 cents on routes within North America. For most of the route groups where comparable data are available, the figure for non-scheduled operations is higher than that for all-freight scheduled operations. In some cases, this reflects the specialized non-scheduled operations of one or two carriers. There were significant fluctuations in average non-scheduled freight unit revenue between 1992 and 1997 for the four route groups for which there are comparable data.
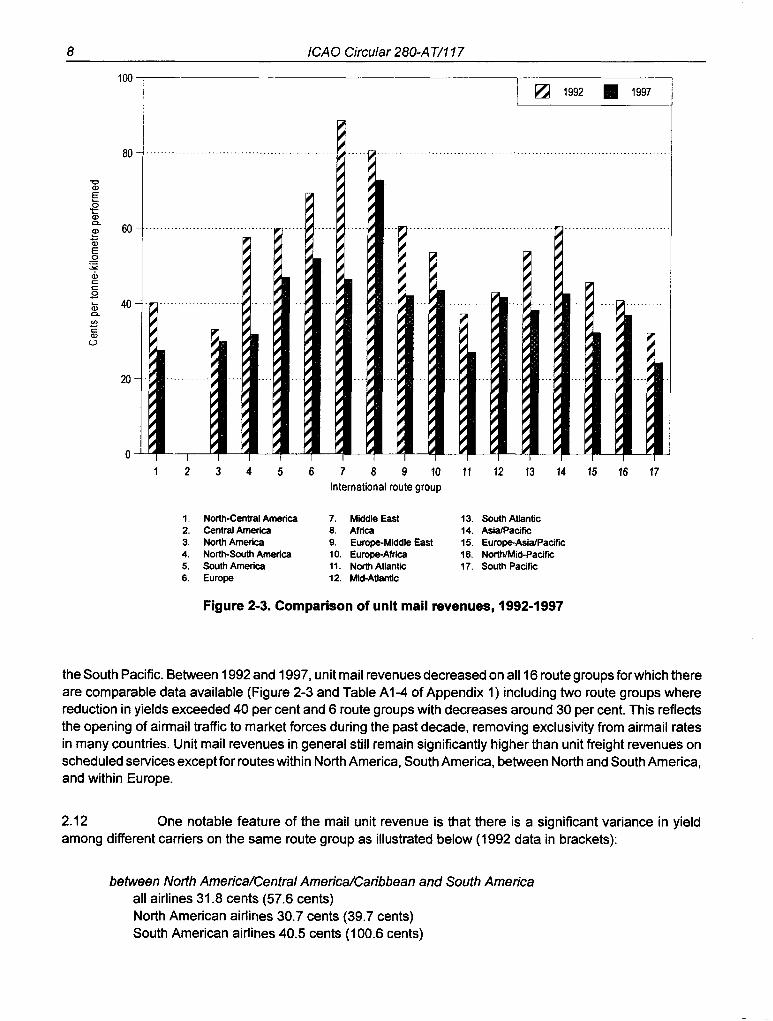
2.11 The final column of Table 2-3 shows the average revenue per tonne-kilometre performed for airmail traffic on each route group (virtually all international mail is carried on scheduled services). The route group averages range from a high of 72.8 cents on routes in local Africa to a low of 24.3 cents on those across
8 ICAO Circular 280-A T/117
1 2 3 4 5 6 7 8 9 10 11 12 13 14 15 16 17 International route group
1. North-Central America 7. Middle East 13. South Atlantic 2. Central America 8. Africa 14. AsidPacific 3. North America 9. Europe-Middle East 15. Europe-AsidPacific 4. North-South America 10. Europe-Africa 16. NorthMid-Pacific 5. South America 11. North Atlantic 17. South Pacific 6. Europe 12. Mid-Atlantic
Figure 2-3. Comparison of unit mail revenues, 1992-1997
the South Pacific. Between 1992 and 1997, unit mail revenues decreased on all 16 route groups for which there are comparable data available (Figure 2-3 and Table A1-4 of Appendix 1) including two route groups where reduction in yields exceeded 40 per cent and 6 route groups with decreases around 30 per cent. This reflects the opening of airmail traffic to market forces during the past decade, removing exclusivity from airmail rates in many countries. Unit mail revenues in general still remain significantly higher than unit freight revenues on scheduled services except for routes within North America, South America, between North and South America, and within Europe.
2.12 One notable feature of the mail unit revenue is that there is a significant variance in yield among different carriers on the same route group as illustrated below (1992 data in brackets):
between North AmericdCentral America/Caribbean and South America all airlines 31.8 cents (57.6 cents) North American airlines 30.7 cents (39.7 cents) South American airlines 40.5 cents (1 00.6 cents)

Table 2-4. Variation in scheduled freight revenue yield among airlines, 1997
Average Revenue (cents) per tonnekilometre for individual airlines revenue (cents) 0 10 20 30 40 50 60 70 80 90 100 110 120 130 140 150 160
pertonne- Number to to to to to to to to to to to to to to to to and kilometre of 10 20 30 40 50 60 70 80 90 100 110 120 130 140 150 160 over
(all airlines airlines from in this
Route group (short title) Table 2-3) analysis Number of airlines
1. North-Central America 23.9 6 1 2 1 2
2. Central America 42.8 2 1 1
3. North America
4. North-South America
5. South America
6. Europe
7. Middle East
8. Africa
9. Europe-Middle East
10. Europe-Africa
11. North Atlantic 23.9 42 1 2 0 1 3 6 1 0 0 0 0 0 0 0 0 0 0 1
12. Mid-Atlantic 23.5 9 3 5 1
13. South Atlantic 26.1 14 4 6 2 2
14. AsiaIPacific 31.8 24 2 8 4 2 1 3 3 0 1
15. Europe-AsiaIPacific 26.0 47 2 1 1 2 1 8 3 1 0 0 1
16. NorthIMid-Pacific 22.9 19 8 8 2 1
17. South Pacific 23.2 5 1 2 1 1
1. In the range of 190-200 (I) and 220-230 (1). 2. In the range of 170-180 (1).

10 ICA 0 Circular 280-A T/117
between Africa and Europe all airlines 43.6 cents (53.7 cents) African airlines 68.4 cents (50.5 cents) European airlines 41.7 cents (53.9 cents)
South Atlantic all airlines 38.3 cents (53.9 cents) European airlines 33.6 cents (50.8 cents) South American airlines 56.2 cents (60.1 cents)
North/Mid- Pacific all airlines 37.0 cents (40.9 cents) Asian airlines 45.8 cents (56.0 cents) North American airlines 33.8 cents (32.7 cents)
2.13 The variation among individual airlines in freight revenue per tonne-kilometre for scheduled services for each route group is shown in Table 2-4. For a few route groups, the unit revenues for individual airlines do not vary much from the route group average (for example, on routes across the NorthIMid-Pacific and South Pacific). However, as with passenger traffic, on most route groups the unit revenues differ significantly among airlines.
Chapter 3 REGIONAL DIFFERENCES IN
SCHEDULED PASSENGER UNIT REVENUES AND RELATED COSTS
Overall financial results by international route group
3.1 Selected operational data and estimated financial results for the year 1997, overall and by route group, are presented in Table 3-1.
3.2 The first column of Table 3-1 shows that the number of scheduled airlines operating jet services in each route group ranged from a low of 11 on South Pacific routes to a high of 187 serving routes in local Europe. It should be noted that the propeller aircraft operations of these airlines are excluded from the study, as are the operations of some 116 small international airlines which operate propeller-driven aircraft exclusively; together these operations with propeller aircraft represented about 0.7 per cent of world international seat-kilometres in 1997 with their highest representations in any single route group being some 27 per cent between and within Central America and the Caribbean, about 5 per cent in local Africa and some 4 per cent in local Europe. Supersonic aircraft operations, which were also excluded, represented less than 0.1 per cent of world operations.
3.3 The operational data included in columns 3 to 5 of Table 3-1 all have a significant effect on unit operating costs (see Chapter 4), and the world unit cost is also affected by the geographical traffic composition presented in column 2. There are considerable differences among route groups in the volume of traffic, the average length of flight stages, the average number of seats per aircraft and the average passenger load factor.
3.4 Financial results are presented in columns 6 to 8. It should be borne in mind that the revenue figures do not generally take into account the incidental operating revenues. Those incidental revenues, which may be directly attributed to passenger traffic, include revenues from passengers paying less than 25 per cent of the normal applicable fare, commissions received on sales of transportation on other carriers, "no-show" and cancellation fees (however, expenses incurred against these revenue items are included in the cost figures shown in column 7); these incidental revenues also include, on a net basis, capacity equalization payments arising from pooled andlor joint services as well as from the sale of own capacity to other carriers. Revenues accruing from the provision of services other than for airtransportation (such as service and maintenance sales or handling services for third parties) and the corresponding costs are excluded from all figures presented in this study. An analysis of incidental revenue data on this basis for 1997 indicates that for international routes as a whole, relevant incidental revenues not included in Table 3-1 were about 0.10 cents per passenger- kilometre which, if added to the estimated worldwide unit revenue, increases it by 1.2 per cent from 8.20 cents to 8.30 cents per passenger-kilometre. For individual route groups, the passenger-related incidental operating revenues may represent up to an additional 6 per cent over the average revenue.
3.5 The average operating cost per passenger-kilometre for all international routes was 8.39 cents (column 7), the figures for individual route groups ranging from a high of 16.0 cents in local Europe to a low

12 ICA 0 Circular 280-A T/117
of 5.9 cents on routes across the Mid-Atlantic. These estimated costs include such items as depreciation and interest charges, and sales commission paid, which are sometimes accounted differently, but exclude costs attributable to the carriage of freight and mail.
3.6 The ratio of passenger revenues to passenger costs (column 8) for international routes as a whole is estimated at 0.98 for 1997, varying between individual route groups from 0.85 to 1.10. Taking into account relevant incidental revenues associated with international passenger traffic and margins of uncertainty in estimated revenues and costs (discussed in Appendix 3), the revenuelcost ratio for all international passenger traffic in 1997 is estimated to be between 0.97 and 1.01, with a most likely value of 0.99.
3.7 Components of the total passenger costs are presented in Table 3-2. The primary breakdown is between "aircraft operating costsn, being those directly attributable to the operation of aircraft on each route group, and "other operating costs". All the itemized data carry relatively wide margins of uncertainty and should be regarded as indicative only. Nevertheless, it appears that most of the individual items vary significantly among route groups.
Comparison of resuits for 1997 with those for 1992
3.8 An overall comparison between data for 1997 and corresponding data for 1992 shows a decrease of 9 per cent in the estimated passenger cost per available seat-kilometre, from 6.51 to 5.89 cents. Since the worldwide average load factor increased from 66 per cent in 1992 to 70 per cent in 1997, the cost per passenger-kilometre shows a decrease of about 15 per cent, from 9.83 to 8.39 cents (Figure 3-1). Unit revenues (excluding incidental operating revenues) showed a decrease of over 9 per cent, from 9.08 cents per passenger-kilometre to 8.20 cents in 1997. As a result, the overall revenuelcost ratio increased from 0.92 in 1992 to 0.98 in 1997.
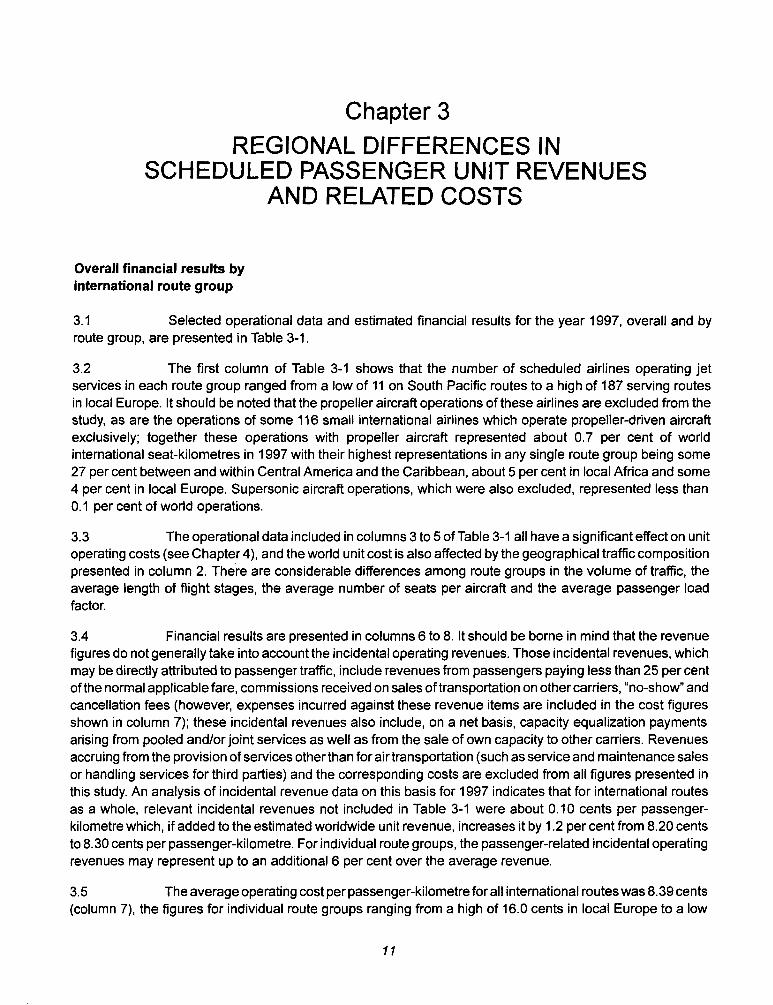
3.9 As far as the individual route groups are concerned, the year-to-year cost changes show wide variations which are accentuated by differences in trends in load factors. Between 1992 and 1997,14 out of the 15 route groups forwhich comparable data were available showed decreases in costs per passenger-kilometre ranging from a reduction of some 34 per cent on routes across the Mid-Atlantic to a reduction of some 4 per cent for those across the South Pacific. There was little change in the cost per passenger-kilometre for routes between North America and Central AmericaICaribbean (Figure 3-2 and Table A1-2).
3.10 As with the revenue figures discussed in Chapter2, the comparison of unit costs between 1992 and 1997 has been affected in some cases by a change in the value of the United States dollar against other world currencies. Within the Americas, where most fares and rates are transacted in United States dollars, the changes in yields generally reflect market changes. Similarly, changes in unit costs in the Americas to a large extent reflect the general change in costs, as well as some operational changes, since the greater part of costs are generally borne in United States dollars.
3.11 Outside the Americas, for those route groups where beheen 1992 and 1997 the mix of national currencies generally weakened against the United States dollar (such as route groups involving Africa, Europe and Latin America), with some exceptions which caused local distortions, the decreases shown in revenues and costs when expressed in U.S. dollars are effectively overstated. Hence, between 1992 and 1997, the yields and costs expressed in local currencies for some of the route groups involving airlines from these regions would have shown increases rather than decreases.

ICA 0 Circular 280-A T/117 13
Table 3-1. Basic operational data and financial results for scheduled passenger services by international route groups, 1997'
Operational data Financial results3
Percentage Average of world's Average Average Average passenger
international length of Average passenger revenue costs Number traffic fl~ght number of load (cents) (cents) Ratio
of (available stages seats per factor Per per revenue1 airlines seat-krn) (krn) aircraft' (I) pass-km5 pass-km e ~ s t s ~ , ~
Route groupZ (1) (2) (3) (4) (5) (6) (7) (8)
I. All world international routes 366 100.0 2 084 237 70 8.20 8.39 0.98
11. International route groups:
1. North-Central America 37 1.9 1 450 179 68 8.4 9.3 0.90
2. Central America 27 0.1 678 132 - - - - 3. North America 36 3.8 1 335 133 66 7.9 9.1 0.85
4. North-South America 45 3.8 2 825 202 6 1 8.2 8.4 1 .OO
5. South America 37 0.7 1 072 146 58 12.2 12.0 1 .OO
6. Europe 187 11.3 965 137 64 17.3 16.0 1.10
7. Middle East 47 0.7 894 185 59 15.2 13.7 1.10
8. Africa 53 0.4 1 058 156 - - - - 9. Europe-Middle East 82 3.1 2 557 205 65 9.7 9.9 1 .OO
10. Europe-Africa 59 3.5 4 020 266 7 1 7.4 7.8 0.95
11. North Atlantic 64 18.5 5555 269 78 6.6 6.8 0.95
12. Mid-Atlantic 28 3.4 5161 304 78 5.5 5.9 0.90
13. South Atlantic 22 2.5 4998 303 74 6.6 6.9 0.95
17. South Pacific 11 2.4 6434 364 71 5.9 6.1 0.95
1. Excluding operational and financial data attributed to supersonic and propellerdriven aircraft. 2. More detailed definition of the route groups may be found in Appendix 4 on the reverse of the revenue questionnaire. 3. The margins of uncertainty which should be considered in relation to these results are discussed in Appendix 3. For routes between and within
Central America and Caribbean and in local Africa, representation was inadequate to justify separate representation, but the data have been included in the world averages.
4. As defined by available seat-kilometres divided by aircraft-kilometres flown. 5. These figures do not generally include incidental operating revenues. For all international routes, that part of this additional revenue which may be
directly attributed to international passenger traffic is about 0.1 cents per passenger-kilometre. On individual route groups it may represent up to an additional 6 per cent over the average revenue quoted.
6. Rounded to the nearest twentieth for individual route groups.

Table 3-2. Estimated passenger costs' per passenger-kilometre by cost item, 1997
Aircraft operating wsts Other operating costs
Total operating Aircraft Landing
costs operating and General, (cf. TaMe wsts Aircraft associated En-route Ticketing, adminlstra-
3-1) excluding fuel and airport facility Station Passenger sales and tive and (sum of fuel and o1l2 c h t ~ expenses services Cornmission promotion miscellaneous
Route group (short title) columns 1-9) (1) (5) (6) (7) (8) (9)
I. All: Cents 8.39 2.53 1.03 0.35 0.27 0.85 1.30 0.82 0.58 0.66 Percentage of total costs 100.0 30.2 12.3 4.2 3.2 10.1 15.5 9.8 6.9 7.9
II. International route groups
1. North-Central America 9.3 3.1 1.2 0.2 0.1 1.4 1.3 0.8 0.6 0.6
2. Central America - - - - - - - - - - 3. North America 9.1 3.4 1.1 0.2 0.1 1.3 1.3 0.8 0.5 0.6
4. North-South America 8.4 2.8 1.1 0.2 0.2 0.7 1.1 1 .I 0.5 0.6
5. South America 12.0 3.9 1.5 0.5 0.5 1.2 1.2 2.0 0.8 0.5
6. Europe 16.0 4.9 1.2 1.3 0.9 2.3 2.0 1.6 1.3 0.7
7. Middle East 13.7 4.5 1.4 0.4 0.3 1.7 1.5 1.4 1 .I 1.5
8. Africa - - - - - - - - - - 9. Europe-Middle East 9.9 3.0 1 .O 0.4 0.4 1 .O 1.4 1 .O 0.7 1 .O
10. Europe-Africa 7.8 2.2 1.1 0.3 0.4 0.5 1.3 0.6 0.5 1 .O
11. North Atlantic 6.8 1.9 0.9 0.2 0.2 0.6 1.1 0.6 0.4 0.8
12. Mid-Atlantic 5.9 1.8 0.9 0.2 0.2 0.3 1 .I 0.5 0.3 0.7
13. South Atlantic 6.9 2.1 I .O 0.2 0.3 0.4 1 .O 0.9 0.4 0.5
17. South Pacific 6.1 1.6 1 .O 0.1 0.0 0.4 1 .O 0.9 0.5 0.5
1. 'Passenger" costs have been derived for each route group taking into account the contribution made by the revenue earned for the carriage of freight and mail on passenger flights towards covering total costs for these flights. Due to the margins of uncertainty in the estimates of individual cost items, the figures should be regarded as indicative only.
2. This item indudes flights operations expenses (cockpit crew salaries and expenses, rentals and insurance of flight equipment), aircraft maintenance and overhaul, and aircraft standing charges such as depredation and interest charges.

ICA 0 Circular 280-A T/117 15
1992 1993 1994 1995 1996 1997 Year
general and administrative h] commission and sales passenger services station costs airport and en-route charges fuel aircraft costs
Figure 3-1. Average passenger unit costs by item, 1992-1997
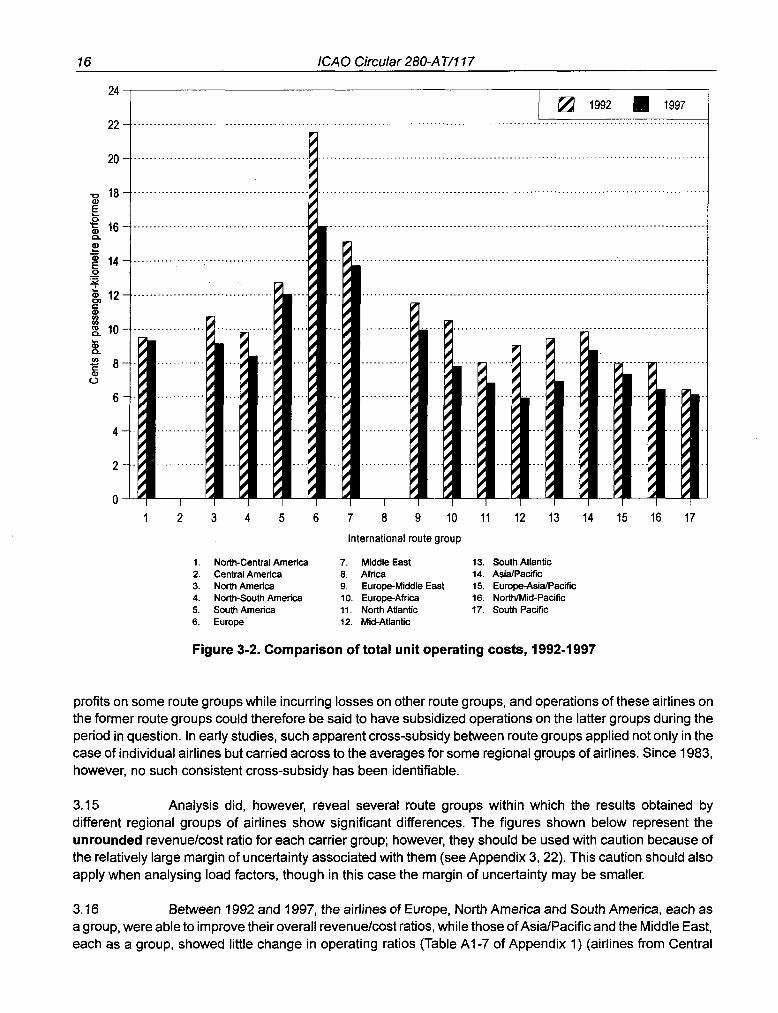
3.12 Of the 15 route groups analysed in this study for which comparable data were available, 10 showed an increase in their respective revenuelcost ratios between 1992 and 1997, 1 showed a decrease, while there was little change in the remaining 4 (Figure 3-3 and Table A1-6 of Appendix 1). Contributions to these changes by different regional groups of airlines are discussed below.
3.13 For most of the 10 route groups where there was an improvement in revenuelcost ratios, in general yields expressed in cents per passenger-kilometre showed a lower reduction than unit costs expressed in terms of cents per seat-kilometre. However, in all cases the improvement in the passenger load factor contributed to the increase in the revenuelcost ratio. For routes between Europe and Africa, where there was a reduction in the revenuelcost ratio, the unit cost expressed in cents per seat-kilometre showed a decrease of about 16 per cent, and the passenger load factor grew from 62 to 71 per cent, which was nevertheless insufficient to offset a significant decrease in unit revenues (some 28 per cent). The 4 route groups which showed no change in revenuelcost ratio generally also showed little change in the average passenger load factor between 1992 and 1 997.
Variations in revenuelcost ratios among airlines
3.14 The overall financial results in Table 3-1 show that differences in revenues between route groups broadly reflect differences in costs. However, there are instances where individual airlines earn significant
16 ICAO Circular 280-A T/117
International route group
1. Notth-Central America 7. Middle East 13. South Atlantic 2. Central America 8. Africa 14. AsiaJPacific 3. North America 9. Europe-Middle East 15. Europe-AsiaIPacific 4. Notth-South America 10. Europe-Africa 16. NorthIMid-Pacific 5. South America 11. North Atlantic 17. South Pacific 6. Europe 12. Mid-Atlantic
Figure 3-2. Comparison of total unit operating costs, 1992-1997
profits on some route groups while incurring losses on other route groups, and operations of these airlines on the former route groups could therefore be said to have subsidized operations on the latter groups during the period in question. In early studies, such apparent cross-subsidy between route groups applied not only in the case of individual airlines but carried across to the averages for some regional groups of airlines. Since 1983, however, no such consistent cross-subsidy has been identifiable.
3.15 Analysis did, however, reveal several route groups within which the results obtained by different regional groups of airlines show significant differences. The figures shown below represent the unrounded revenuelcost ratio for each carrier group; however, they should be used with caution because of the relatively large margin of uncertainty associated with them (see Appendix 3,22). This caution should also apply when analysing load factors, though in this case the margin of uncertainty may be smaller.
3.16 Between 1992 and 1997, the airlines of Europe, North America and South America, each as a group, were able to improve their overall revenuelcost ratios, while those of AsiaIPacific and the Middle East, each as a group, showed little change in operating ratios (Table A1-7 of Appendix 1) (airlines from Central
lCA 0 Circular 280-A T/117 17
1 2 3 4 5 6 7 8 9 10 11 12 13 14 15 16 17 International route group
1. North-Central America 7. Middle East 13. South Atlantic 2. Central America 8. Africa 14. AsidPacific 3. North America 9. Europe-Middle East 15. Europe-AsidPacific 4. North-South America 10. Europe-Africa 16. Nomid-Pacific 5. South America 11. North Atlantic 17. South Pacific 6. Europe 12. Mid-Atlantic
Figure 3-3. Comparison of revenuelcost ratios, 1992-1997
AmericaICaribbean and Africa are excluded from this analysis because of their low representation). For the European airlines, the major factors that contributed to the improvements in the revenuelcost ratios were considerable reduction in passenger cost per seat-kilometre (by some 15 per cent, with reservations about its expression in U.S. dollars - see 3.11) and the increase of the passenger load factor (by 5 percentage points), whereas for the North American airlines this was achieved mainly due to a higher load factor (by some 7 percentage points), and for the South American air carriers it was also mainly due to the load factor increase (by 7.5 percentage points), which contributed to a significant decrease in the unit cost per passenger-kilometre.
3.17 Table A1-8 of Appendix 1 presents a global picture of developments in major operating and economic indicators for 1992 and 1997 at the level of route groups and groups of airlines according to the region of their registration (the African and Central American and Caribbean airlines are again excluded due to their inadequate representation in reporting). In 1997, all groups of airlines reduced their unit cost per seat- kilometre on all route groups with a few exceptions, mainly on route groups that account for a marginal per cent of the overall traffic of all groups. On the yield side, with a general down trend, there were more exceptions. The AsiaIPacific and European airlines experienced decreases in their respective yield levels on all route

18 ICAO Circular 280-A T/117
groups they operated. The North American airlines managed to increase or to keep unchanged their yields on all route groups except across the North and Mid-Pacific where a considerable reduction in the average yield was recorded (26 per cent). Two other notable exemptions from this trend were for the Middle East airlines on the route group across the North Atlantic and for South American airlines on local regional routes where yields grew by 21 and 15 per cent, respectively.
3.18 The overall growth of the passenger load factor during the 1992-1997 period played an important role in the revenuelcost ratio improvements. The load factor increased on all route groups operated by groups of airlines covered by the analysis except for just two regional route groups, within AsiaIPacific and local South America, where it fell by 2.2 and 1.3 percentage points, respectively. Simultaneously, a major improvement in the load factor of nearly 21 percentage points was achieved by the South American airlines on the route group across the Mid-Atlantic, while an increase of around 9 percentage points was recorded by the European airlines on routes to Africa and across the Mid-Atlantic and by the North American airlines on the North Atlantic and North American routes.
3.19 The European, North American and South American air carriers improved their revenuelcost ratios on all route groups except for routes to Africa and the AsiaIPacific for the European airlines and routes across the North and Mid-Pacific for North American airlines. For air carriers of the AsidPacific and the Middle East regions, results by route group were less homogeneous showing reductions in operating ratios on routes across the North Atlantic and to Europe for the former group and on routes to Europe, Africa and AsiaIPacific for the latter.
3.20 To compare the performance of regional groups of airlines within an inter-regional route group, only groups of airlines with a substantial share of traffic on that route group were included in Table A1-8 of Appendix 1. Applying this criterion, for most of the route groups only two regional groups of air carriers were left. In other cases, two major groups of air carriers still drive the financial indicators for each particular route group (such as the European airlines and North American airlines for routes across the North Atlantic, with the AsiaIPacific airlines and the Middle East carriers playing a secondary role).
3.21 On routes between Europe and the Middle East, both the European and the Middle East groups of airlines showed similar trends in yields and load factors, but the European airlines achieved a much higher reduction in the cost per seat-kilometre between 1992 and 1997: 18 per cent compared to 6 per cent for the Middle East air carriers. Hence, the former saw an improvement in operating ratio between 1992 and 1997 from 0.99 to 1 .lo, whereas the latter experienced a further decline from 0.91 to 0.87.
3.22 Similarly, on the Europe-AsialPacific route group, more efficient cost control by the European airlines enabled them to prevent a decrease in operating ratio in 1997 as compared to 1992, whereas for the AsiaIPacific carriers, the ratio went marginally down in spite of the somewhat better gain in the average passenger load factor.
3.23 On routes between EuropelMiddle East and Africa, data are available only for the European and Middle East carriers, and though both groups experienced the same deterioration of 6 per cent of their respective revenuelcost ratios, a comparison of their economic performance is not indicative because their market shares are extremely different. For the same reason, on routes across the North Atlantic, the performance of the AsiaIPacific and Middle East airlines is not exactly comparable with that of the European and North American airlines.
3.24 Significant improvements in operating ratios (by some 19 per cent) were gained on routes across the North Atlantic by the two major groups of airlines. Between1992 and 1997, the gap in the level of yields recorded by the European airlines and by those from North America narrowed, with the former showing

ICA 0 Circular 280-A T/117 19
a reduction in yields by more than 4 per cent and the latter an increase by nearly 5 per cent. On the cost side, both carrier groups also reached about the same level: the European airlines through cost-cutting by 10 per cent (in terms of United States cents per seat-kilometre) and the North American airlines by maintaining their cost low (a marginal decrease). However, the North American airlines achieved a better gain in the average passenger load factor (from 69.5 to 78.6 per cent) compared with the European airlines (from 71.2 to 77.8 per cent).
3.25 Results of the two other groups of airlines on routes over the North Atlantic were completely different. For the AsiaIPacific carriers, there were only marginal changes in the yield (minus 4 per cent) and in the seat-kilometre cost (plus 3 per cent), which were not offset by the improvement in the passenger load factor (nearly 3 percentage points), leading to a decrease of the operating ratio from 0.91 in 1992 to 0.88 in 1997. For the Middle East carriers, both yields and unit costs went up (by 21 and 8 per cent, respectively); this considerable improvement in the yields, helped by growth in the load factor by 2.5 percentage points, resulted in the increase of operating ratio during the period from 0.80 to 0.91. In 1997, the yields and cost per seat- kilometre of the Middle East airlines were almost at the same level as those of the European and North American airlines, though the improvement in load factors was not sufficient to reach the level of that for those two major groups of airlines. In 1997, the average yield, cost and load factor of the AsiaIPacific airlines across the North Atlantic were all at much lower levels than those of the other three airline groups.
3.26 On routes across the Mid- and South Atlantic, there were considerable improvements in the revenuelcost ratios for both major groups of airlines with the significant decreases of unit costs (except for routes across the Mid-Atlantic by the South American airlines), falling yields and substantial increases in the load factor suggesting a growing share of leisure traffic.
3.27 The trends in the unit costs were virtually the same for the two major groups of carriers (AsiaIPacific and North American) on routes across the North and Mid-Pacific, which decreased in 1997 by 15 per cent as compared to 1992. However, the yields of the AsiaIPacific airlines were much lower than those of the North American carriers, though the gap in their levels was narrowing with the decreases during the period being, respectively, 13 and 26 per cent. The North American airlines posted a lower load factor in 1992 (69.3 per cent) than the AsialPacific carriers (69.8 per cent), but in 1997 they both achieved higher ones (74.5 and 71.6 per cent, respectively). Nevertheless, the positive changes were not sufficient for the North American carriers to offset a loss of revenue, and they experienced a marginal deterioration in the operating ratio from 1.02 to 0.98, whereas the AsiaJPacific airlines raised it from 0.77 to 0.83.
3.28 There were more similarities in the trends of economic performance of these two regional airline groups on routes across the South Pacific (although the groups have different composition on routes across the NorthIMid-Pacific and the South Pacific). Both North American and AsiaIPacific groups achieved in 1997: (i) the same revenuelcost ratio of 0.97 (though the North American airlines in 1992 had shown a ratio of 0.88, which was much lower than 0.96 for the AsiaIPacific carriers); (ii) yields unchanged (at levels of 6.1 and 5.8 cents per passenger-kilometre, respectively); and (iii) costs per seat-kilometre in 1997 at the same level of 4.3 cents (though the North American airlines decreased the 1992 unit cost by 8.5 per cent, whereas AsiaIPacific airlines increased it by 5 per cent).
3.29 On routes between North and South America, once again both major groups of airlines achieved in 1997 virtually the same unit cost level of 5.1 cents per seat-kilometre, unchanged for the North American carriers from the 1992 level and reduced by 7 per cent for the South American airlines. The former also saw their yield of 9.4 cents per passenger-kilometre unchanged between 1992 and 1997, whereas the latter experienced a fall of 15 per cent to 7.0 cents. Both groups of airlines increased their respective operating ratios, though at essentially different levels: the North American airlines from 1 .OO in 1992 to 1 . I3 in 1997 and the South American airlines from 0.81 to just 0.85 in 1997.
20 ICA 0 Circular 2804 T/117
3.30 From the above analysis, a trend towards narrowing the gap in the major operating and economic indicators of competing groups of air carriers with different managerial culture and national traditions can be clearly observed in mature markets with intense traffic and competition.
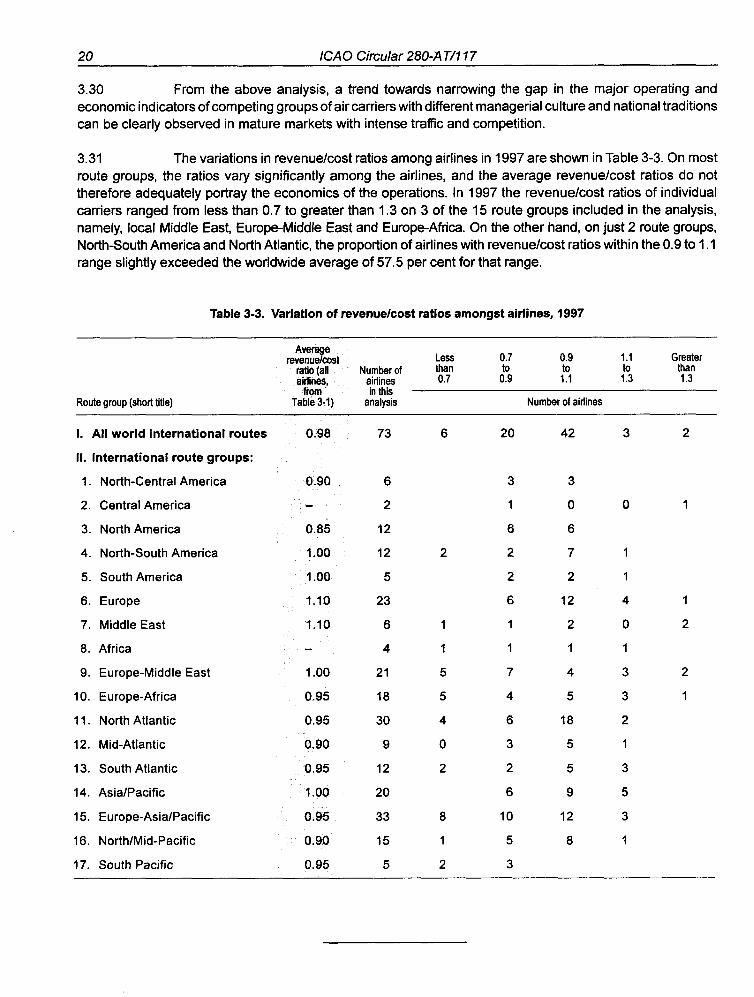
3.31 The variations in revenuelcost ratios among airlines in 1997 are shown in Table 3-3. On most route groups, the ratios vary significantly among the airlines, and the average revenuelcost ratios do not therefore adequately portray the economics of the operations. In 1997 the revenuelcost ratios of individual carriers ranged from less than 0.7 to greater than 1.3 on 3 of the 15 route groups included in the analysis, namely, local Middle East, Europe-Middle East and Europe-Africa. On the other hand, on just 2 route groups, North-South America and North Atlantic, the proportion of airlines with revenuelcost ratios within the 0.9 to 1 .I range slightly exceeded the worldwide average of 57.5 per cent for that range.
Table 3-3. Variation of revenuelcost ratios amongst airlines, 1997
Route group (short title)
$e=&t Less 0.7 0.9 1.1 Greater ratio (all Number of than to to to than airlines. airlines 0.7 0.9 1.1 1.3 1.3
from in this Table 3-1) analysis Number of airlines
I. All world international routes 0.98 73 6
11. International route groups:
1. North-Central America
2. Central America
3. North America
4. North-South America
5. South America
6. Europe
7. Middle East
8. Africa
9. Europe-Middle East
10. Europe-Africa 0.95 18 5 4 5 3 1
1 1. North Atlantic 0.95 30 4 6 18 2
12. Mid-Atlantic 0.90 9 0 3 5 1
13. South Atlantic 0.95 12 2 2 5 3
14. AsialPacific 1 .OO 20 6 9 5
15. Europe-AsialPacific 0.95 33 8 10 12 3
16. NorthlMid-Pacific 0.90 15 1 5 8 1
17. South Pacific 0.95 5 2 3

Chapter 4 FACTORS CAUSING REGIONAL
DIFFERENCES IN COSTS
4.1 The financial analysis presented in Chapter 3 included estimates of the average cost per passenger-kilometre performed for each of the 15 international route groups for which adequate data were available. This chapter is concerned with assessments of the factors which caused this average cost to vary among the route groups. Some main factors can be identified and their effects quantified, but a number of other factors do not lend themselves to individual assessment and are therefore dealt with in a summary manner, although their combined influence on cost differences is significant.
4.2 The factors which have been considered are:
a) the effect on aircraft operating costs of differences among route groups in the aircraft equipment being used;
b) the effect of differences among route groups in the average length of flight stages;
c) the effect of varying fuel and oil prices in different parts of the world;
d) the effect of different levels of airport user charges in different parts of the world;
e) the effect of differences in the average load factor achieved on each route group; and
f) other factors.
An examination of the influence exercised by each of the above on the operating costs for traffic in the route groups is made below, and the resulting variations in the costs per passenger-kilometre from the world average are subsequently presented in Table 4-5 and discussed in 4.23 and 4.24 of this chapter.
Aircraft mix and stage length [factors a) and b)]
4.3 The volume of traffic on a route and the geographical characteristics of the route (in particular the length of flight stages) determine the sizes of aircraft that are utilized in the route group, the number of seat-kilometres per departure and per flight hour that can be produced by these aircraft, and the possible utilization of the aircraft in terms of flight hours per year. For these reasons, the geographical characteristics of a route group strongly influence the operating costs per seat-kilometre that will be incurred on that route group. Effects on these costs of differences among the route groups in aircraft mix and average stage length are discussed below.
4.4 In general, the aircraft operating costs per aircraft-kilometre or per seat-kilometre on a long-haul flight are lower than on a short-haul flight, mainly because of the higher block speed that may be achieved on a long-haul flight and the generally higher aircraft daily utilization recorded. Similarly, large aircraft,

22 ICA 0 Circular 280-A T/1 I 7
which may be used where traffic density is high, have lower aircraft operating costs per seat-kilometre than small aircraft. The combined impact of these two factors may be illustrated by looking at the average aircraft operating costs incurred in international passenger service in 1997 for different categories of aircraft. Table 4-1 presents the average aircraft operating costs per block hour and per available seat-kilometre for 5 categories of aircraft, grouped according to their size and by the length of haul forwhich they were generally used in 1997. The average hourly cost varied from $2 622 for narrow-body short-haul aircraft to $6 192 for wide-body long- haul aircraft, but primarily because of their greater productivity, the average aircraft operating cost per available seat-kilometre (adjusted to exclude costs attributable to freight and mail traffic) of the wide-body long-haul aircraft was, at 2.3 cents, the lowest for any category. At the other end of the spectrum, the narrow-body short-haul aircraft averaged 3.8 cents per seat-kilometre, which is some 65 per cent higher than the figure for wide-body long-haul aircraft.
Table 4-1. Operational and cost data for aircraft categories, 1997 (international scheduled passenger services)
Percentage Primary jet of world's
tY Pes international operated on traffic international (available Average
Grouping of scheduled seat-km) number subsonic aircraft services' (%I of seats2
Average length Aircraft operating costs4 of flight stages Average Dollars Cents per
operated utilization3 Per available (km) (hourslday) block hour seat-km5
World 100.0 237
Narrow-body A320 14.3 123 998 7.8 2 622 3.8 short-haul 8737
MD80
Narrow-body 8727 6.3 171 1 723 7.9 3 098 2.7 medium-haul 8757
TU154
Narrow-body long-haul
Wide-body A300 14.8 227 2 594 8.8 4 670 2.7 medium-haul A31 0
A330 8767
Wide-body A340 64.4 318 5 203 long-haul 8747
8767 8777 DClO
L1011-500 M D l l
1. Only aircraft types providing more than 0.5 per cent ofthe world international scheduled available seat-kilometres in 1997 are listed in this column. The categorization of aircraft types is based on the average number of seats and length of flight stages in 1997.
2. Available seat-kilometres divided by aircraft-kilometres flown. 3. Including domestic and non-scheduled operations of the international airlines concerned. 4. Data in these columns include flight operations expenses, aircraft fuel and oil (at the world average cost of 18.6 cents per litre), aircraft
maintenance and overhaul, and aircraft standing charges such as depreciation and interest charges. If prevailing regional prices rather than the world average price were to be used for aircraft fuel and oil, there would be no change in the seat-kilometre cost data presented but small changes in some of the per block hour data.
5 . Aircraft operating costs have been adjusted in this case to exclude costs attributable to freight and mail traffic.

ICAO Circular 280-A T/17 7 23
4.5 The apparent contradiction in unit cost per seat-kilometre shown for narrow-body and wide- body medium-haul aircraft must be seen in the context of the age of the major aircraft types used. In the case of narrow-body aircraft, except for the Boeing 757, the other major types being used, the Boeing 727 and the Tupolev TU-1 54, are much older aircraft forwhich depreciation and interest charges are very low in comparison with those of the newer wide-body aircraft used for medium-haul operations. A similar situation arises with narrow-body medium- and long-haul aircraft. In this case too, the few Boeing 707s and DC-8s used for passenger services also have low depreciation and interest charges (if any); however, their average daily utilization is less than half that of the medium-haul aircraft, and hence their standing charges have a greater impact on unit costs. On the other hand, the proportion of newer aircraft within these two groups of aircraft (narrow body medium- and long-haul) is growing as can be seen from the fact that in 1997 the unit cost increased by about 0.1 and 0.6 cents, respectively, compared with 7992, whereas for the wide-body medium- haul aircraft it decreased by 1.6 cents, and for the remaining two groups it remained almost unchanged (due to the margins of uncertainty and rounding of numbers, these small changes should be considered as purely indicative).
4.6 Aircraft operational data for each route group (excluding utilization effects) are shown in Table 4-2. The average block speed achieved is shown to be significantly higher on route groups with a long average stage length, such as transatlantic and transpacific routes, than on route groups with a short average stage length such as Europe, Central America and the Middle East.
4.7 This relative economic advantage for the operations of long-haul routes is amplified by the fact that in 1997 large wide-body aircraft accounted for a high proportion of the total capacity on long-haul routes but were being used less on the route groups with a short average stage length. The variation in average aircraft productivity resulting from variations in average block speed and average size of aircraft is very wide. For example, the seat-kilometres per aircraft block hour for routes within Central America, within North America and within Europe are in each case less than one-third of the seat-kilometres per block hour on the North and Mid-Pacific and South Pacific route groups.
4.8 Differences in aircraft fleet composition among route groups contribute to the differences in both aircraft and other operating costs, but mainly to the aircraft costs. The contribution to regional differences in aircraft operating costs arising from differences in aircraft mix (excluding the effects of differences in stage length, fuel prices and load factors) has been estimated and is presented in 4.23 and 4.24.
4.9 Other operating costs as well as aircraft operating costs are, of course, also strongly influenced by the average length of flight stages operated in a route group. This is because certain important cost items, such as station expenses and landing charges, are primarily dependent upon the number of aircraft and passenger departures. Since the number of seat-kilometres (or passenger-kilometres) per departure increases proportionally with increasing stage length, the cost per seat-kilometre (or per passenger-kilometre) of station expenses and landing charges falls with increasing stage length. Estimated effects of differences in stage length on operating costs (both aircraft and other) are also presented in 4.23 and 4.24.
Prices for aircraft fuel and oil [factor c)]
4.10 The estimated total consumption of aircraft fuel and oil on international subsonic jet passenger routes in 1997 was nearly 105 billion litres, and the total cost to the airlines was some $19.5 billion for an average price per litre of 18.6 cents. This average price paid per litre was just marginally above the 1992 average price of 18.3 cents per litre. In 1997, fuel represented some 12.3 per cent of the total passenger operating costs which was, once again, just marginally above the 1992 level of 12.0 percent. It should be noted that significant variations occurred during the interim period due to the volatility of fuel prices (Figure 4-1).

24 ICAO Circular 280-AT/l17
Table 4-2. Aircraft operational data by route group, 1997
Average Percentage distribution aircraft
Average productivity: length of Average available seat-
flight block kilometres per stage speed Narrow- Wide- block hour
Route group (short title) (km) (kmlh) MY body (thousands)
I. All world international routes
II. International route groups:
1. North-Central America
2. Central America
3. North America
4. North-South America
5. South America
6. Europe
7. Middle East
8. Africa
9. Europe-Middle East
10. Europe-Africa
11. North Atlantic
12. Mid-Atlantic
13. South Atlantic
14. AsiaIPacific
15. Europe-AsiaIPacific
16. NorthIMid-Pacific
17. South Pacific
4.11 Detailed estimates have been made of the average price of fuel purchased in the different regions of the world (Table 4-3) and of the average price of fuel consumed on the various route groups (Table 4-4). As shown in Table 4-3, on a regional basis the price per litre of fuel in 1997 ranged from 16.4 cents in North America to 22.4 cents in Africa (nearly 37 per cent higher than the price paid in North America). Between 1992 and 1997, changes in fuel prices varied from region to region, from an increase of 2.5 per cent in North America to a decrease of more than 8 per cent in Africa (Table A1-9 of Appendix 1).
4.12 On a route group basis (Table 4-4), the estimated fuel prices range from a low of 16.9 cents per litre for routes in North America to a high of 20.6 cents per litre for routes within the AsiaIPacific. Between 1992 and 1997, changes in fuel prices varied also from route group to route group, from an increase of nearly 10 per cent on routes across the South Pacific to a decrease of more than 9 per cent on regional routes in South America (Table A1-10 of Appendix 1).

ICA 0 Circular 280-A T/117 25
20 - - fuel cost
'V I I I I I I
1992 1 993 1994 1995 1996 1997 Year
Figure 4-1. Average world fuel prices, 1992-1997
Airport and associated charges [factor d)]
4.13 Airport charges in 1997 represented some 4 per cent of the total costs for international passenger operations. The basis on which these charges are levied varies from airport to airport, but aircraft gross mass is the predominant element, and a broad and simple comparison of the levels of airport charges in different parts of the world can be based on dollars paid per tonne of aircraft maximum take-off mass. Using this measure, estimated average airport charges in different regions of the world are presented in Table 4-3. The table shows that the world average was $11.1 per tonne and that the average charges in regions ranged from $4.4 in the Middle East to $16.8 in Europe. En-route charges are not generally included in these estimates because of the margin of uncertainty associated with their estimation on a regional basis.
4.14 Estimates of landing and associated airport charges have also been made on a route group basis and are shown in Table 4-4. The range of these estimates for route groups is from $3.7 per tonne for traffic within the Middle East to $17.4 for traffic within Europe. One of the reasons why airport charges in Europe seem high is because the airport passenger service charge is generally paid by the air carrier. This approach is also applied by a majority of States in the Caribbean and less than half the States in Africa and the Middle East, but in most States in other regions of the world, these are collected from the passenger either at the point of embarkation or are added onto the ticket as a separate charge when the ticket is issued.

26 ICA 0 Circular 280-A T/117
Table 4-3. Estimated unit fuel prices and airport charges by region, 1997 (international scheduled services)
Area'
Landing and Aircraft fuel associated
and oil prices airport charges (centsflitre) (dollarsldeparted tonne)2
World 18.6 11.1
North America 16.4 6.0
Central ArnericaICaribbean 19.5 4.8
South America 19.9 6.1
Europe 17.9 16.8
Middle East 19.5 4.4
Africa 22.4 9.2
1. More detailed descriptions of areas and route groups may be found in Appendix 4 on the reverse of the revenue and cost questionnaire.
2. Tonnes of aircraft maximum take-off mass.
Load factor [factor e)]
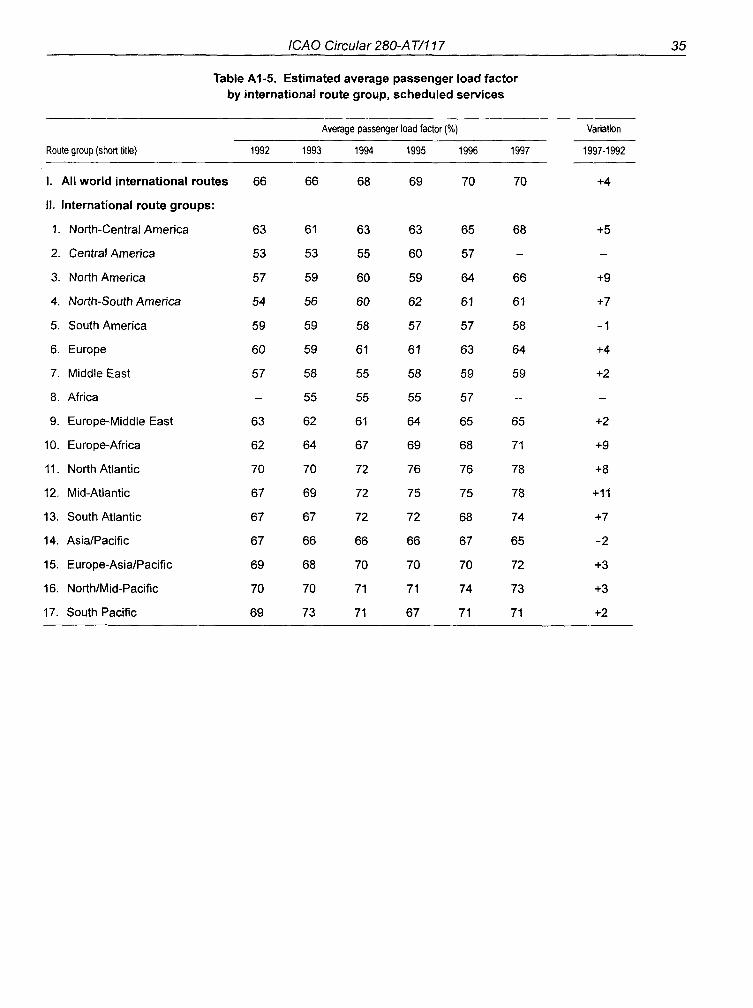
4.15 A large part of the total costs of operating a flight on a scheduled air service is independent of, or only moderately affected by, the number of passengers actually carried on the flight. Since, as shown in Table 3-1, the passenger load factors achieved in 1997 varied significantly among route groups, from a low of 58 per cent on routes within South America to a high of 78 per cent on routes across the North and Mid- Atlantic, they had a significant influence on the differences in total operating costs per passenger-kilometre. Estimated effects of differences in load factor on operating costs for each route group are presented in 4.23 and 4.24.
Other causes of regional differences in costs
4.16 Among the factors that led to regional differences in the total cost of passenger operations in 1997, the varying aircraft operating costs, including the effect of varying prices of fuel, have been discussed above. The effect of varying stage lengths and load factors has been assessed for both aircraft operating costs and other cost items, but with the exception of variations in airport charges, other effects of differences in non-aircraft cost items have not been analysed. The remaining cost items include station expenses, passenger services, commission, ticketing, sales and promotion and general, administrative and miscellaneous and together accounted for some 50 per cent of the total costs for international passenger operations in 1997 (compared with 53 per cent in 1992). Some of these cost items for passenger operations show significant differences among route groups even after extraction of any stage length and load factor effects. A general commentary concerning these items and their variation is given below.
4.17 Station expenses (column 5 of Table 3-2) relate mainly to the servicing of aircraft and passengers at airports. While they vary greatly among route groups, from 0.3 to 2.3 cents per passenger-kilometre

ICA 0 Circular 280-A T/I 1 7 27
Table 4-4. Estimated unit fuel prices and airport charges by route group, 1997 (international scheduled services)
Route group (short title)
Landing and Aircraft fuel assodated
and airport charges oil prices (dollars1
(centsllitre) departed tonne)'
I. All world international routes
It. International route groups:
1. North-Central America
2. Central America
3. North America
4. North-South America
5. South America
6. Europe
7. Middle East
8. Africa
9. Europe-Middle East
10. Europe-Africa
11. North Atlantic
12. Mid-Atlantic
13. South Atlantic
14. AsiaIPacific
15. Europe-AsiaIPacific
16. NorthlMid-Pacific
17. South Pacific
1. Tonnes of aircraft maximum take-off mass
in 1997, some of the variation is due to the effects of differences in stage length. If this effect is extracted from station expenses, routes in the local Middle East and in local South America show the lowest costs per passenger while routes across the North Atlantic show the highest.
4.18 Passenger services (column 6 of Table 3-2) relate primarily to cabin services provided in flight. In 1997, passenger service costs represented 15.5 per cent of total passenger operating costs. The differences in their level among the route groups, from 1.0 to 2.0 cents per passenger-kilometre, primarily reflect differences in salary, service levels and utilization of cabin crew.
4.19 Commission (column 7 of Table 3-2) is paid by each airline to travel agents and other airlines for the sale of passenger tickets. Commission is dependent on the extent to which airline sales are handled by agents in different parts of the world and also reflect the intensity of competition and traditions in the product distribution methods on different regional markets. However, because the commission is usually a certain
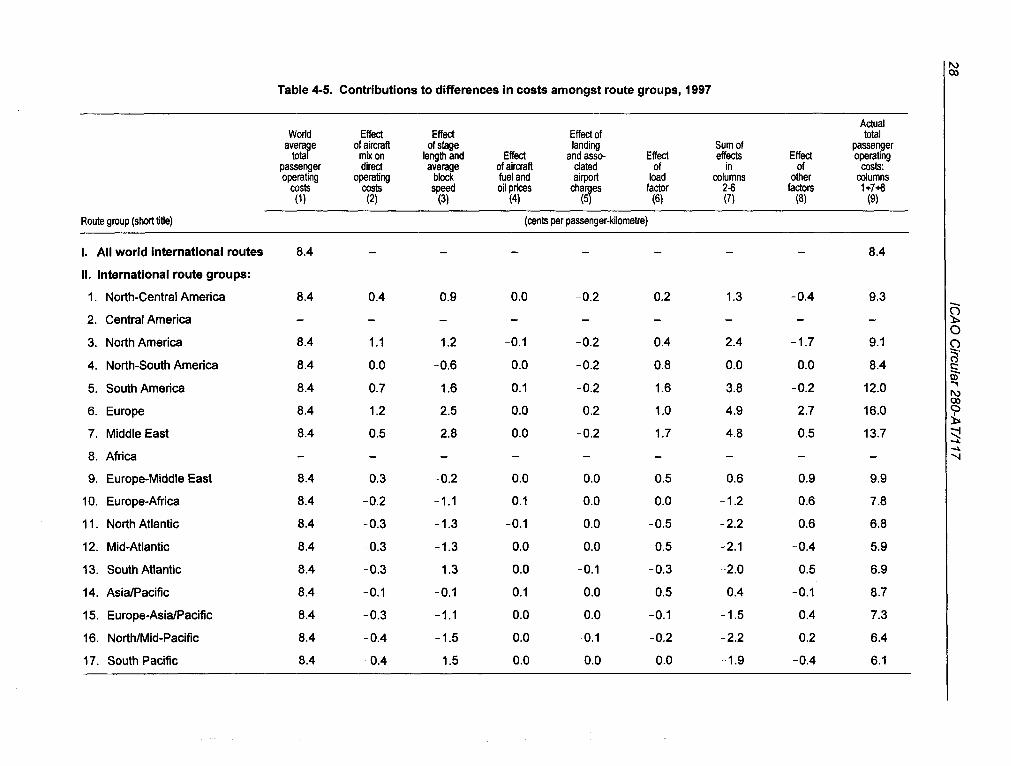
Table 4-5. Contributions to differences in costs amongst route groups, 1997
- -
Route group (short We)
Actual World Effect Effect Effect of total
average of aircraft of stage landing Sum of passenger total mix on length and Effect and asso- Effect effects Effect operating
~assenaer direct averaae of aircraft ciated of in of costs: 'operati'ng operating bled fuel and airport load columns other columns
costs costs speed oil prices factor 2-6 factors 1 +7+8 (1) (2) (3) (4) (6) (7) (8) (9)
(cents per passenger-kilometre)
I. All world international routes
II. International route groups:
I . North-Central America
2. Central America
3. North America
4. North-South America
5. South America
6. Europe
7. Middle East
8. Africa
9. Europe-Middle East
10. Europe-Africa
11. North Atlantic
12. Mid-Atlantic
13. South Atlantic
14. AsialPacific
15. Europe-AsiaIPacific
16. NorthIMid-Pacific
17. South Pacific

ICAO Circular 280-A T/117 29
percentage of the price of the ticket, the variation in this cost item, from 0.5 to 2.0 cents per passenger-kilometre, is also related to the variation in average revenue per passenger-kilometre. In 1997, commission expenses accounted for about 10 per cent of the world's scheduled international airline costs.
4.20 Ticketing, sales and promotion (column 8 of Table 3-2) is a cost item the level of which is largely determined by decision-making within individual airlines. In 1997, this item represented almost 7 per cent of passenger costs. The variation among the route groups, from 0.3 to 1.3 cents per passenger-kilometre, reflects differing competitive situations and the extent to which airlines handle their own sales in the various route groups.
4.21 Commission, ticketing, sales and promotion together reflect the overall cost of selling passenger tickets. Depending on the route group, between 15 and 22 per cent of total passenger revenues are used to defray this cost with 17 per cent as the world average.
4.22 General, administrative and miscellaneous expenses (column 9 of Table 3-2) vary from 0.4 to 1.5 cents per passenger-kilometre. This partly reflects variations in the organizational structure and the accounting practices of airlines in different parts of the world, as well as variations in salary levels and the staff productivity among regions. Additionally, economies of scale may be an important factor affecting variations in this cost item since large airlines, which tend to have lower administrative overheads per passenger- kilometre performed than smaller airlines, play a greater role on some route groups than on others. In recent years, those expenses, which include gains or losses due to changes in exchange rates, have been heavily influenced by fluctuations in exchange rates.
Summary of the causes of regional differences in costs
4.23 The effects of the factors described in 4.3 to 4.22 on the cost levels for route groups are shown in Table 4-5. Column 1 of that table shows against each route group the world average cost per passenger- kilometre in 1997, which was 8.4 cents. Columns 2 through 6 show the deviations from this world average that may be attributed to each of the individually assessed factors described in 4.3 to 4.15 above, and column 8 shows the aggregate effect of the other factors (some other factors were described in summary form in 4.16 to 4.22). Column 9 shows the resulting actual total costs per passenger-kilometre for each route group.
4.24 Comparing the various factors identified in columns 2 to 6 of Table 4-5, it will be noted that each of them contributed significantly to differences from the world average cost per passenger-kilometre. On 11 out of the 15 route groups included in the analysis, the effect of stage length and average block speed was the most important single factor; on the other 3 route groups, load factorwas the most important single factor; and on 1 route group, each of them contributed equally but neither of them was consistently the dominant cause. Also, as may be seen by comparing column 7 (the sum of the effects in columns 2 to 6) with column 8, an important proportion of the differences in route group costs from the world average was due to the other factors which do not lend themselves to precise analysis.

THIS PAGE INTENTIONALLY LEFT BLANK
Appendix 1 SELECTED DATA SERIES COVERING 1992 TO 1997
Table A l - I . Estimated average unit passenger revenues by international route group, scheduled services
Revenue (cents) per passenger-kilometre Percent change
Route gmup (short title) 1992 1993 1994 1995 1996 1997 199711 992
I. All world international routes 9.08 8.50 8.39 8.71 8.35 8.20 -9.7
II. International route groups:
1. North-Central America 8.3 8.5 8.6 8.3 8.2 8.4 1.3
2. Central America 12.5 13.1 12.7 - - - - 3. North America
4. North-South America
5. South America
6. Europe
7. Middle East
8. Africa
9. Europe-Middle East
10. Europe-Africa
11. North Atlantic
12. Mid-Atlantic
13. South Atlantic
14. AsiaIPacific
15. Europe-AsiaIPacific
16. NorthIMid-Pacific
17. South Pacific

32 ICAO Circular 280-A T/117
Table A1-2. Estimated average unit passenger costs by international route group, scheduled services
Passenger cost (cents) per passenger-kilometre
Route group (short title) 1992 1993 1994 1995 1996 1997
Percent change
199711 992
I. All world international routes 9.83 9.29 8.63 8.74 8.61 8.39
11. International route groups:
1. North-Central America 9.5 9.4 9.6 9.5 9.4 9.3
2. Central America 12.9 13.8 13.4 - - - 3. North America
4. North-South America
5. South America
6. Europe
7. Middle East
8. Africa
9. Europe-Middle East
10. Europe-Africa
11. North Atlantic
12. Mid-Atlantic
13. South Atlantic
14. AsialPacific
15. Europe-Asia/Pacific
16. NorthNid-Pacific
17. South Pacific 6.4 6.4 6.3 - 5.9 6.1
1. Reporting was below a satisfactory level for a number of years including 1997.

ICAO Circular 280-AT/117 33
Table A1-3. Reported average unit freight revenues by international route group, scheduled services
Route group (short title)
Freight revenues (cents) per tonne-kilometre performed
1992 1993 1994 1995 1996 1997
Percent change
1. North-Central America
2. Central America
3. North America
4. North-South America
5. South America
6. Europe
7. Middle East
8. Africa
9. Europe-Middle East
10. Europe-Africa
11. North Atlantic
12. Mid-Atlantic
13. South Atlantic
14. Asia/Pacific
15. Europe-AsialPacific
16. NorthlMid-Pacific
17. South Pacific

34 ICAO Circular 280-A T/117
Table A1-4. Reported average unit mail revenues by international route group, scheduled services
Mail revenues (cents) per tonne-kilometre performed Percent change
Route group (shorl title) 1992 1993
1. North-Central America 40.2 32.9
2. Central America 64.4 72.7
3. North America 33.1 33.2
4. North-South America 57.6 59.9
5. South America
6. Europe
7. Middle East 88.6 63.4
8. Africa 80.6 73.5
9. Europe-Middle East 60.5 50.2
10. Europe-Africa
11. North Atlantic
12. Mid-Atlantic
13. South Atlantic 53.9 48.0
14. AsiaIPacific 60.6 57.6
15. Europe-AsialPacific 45.7 39.0
16. NorthIMid-Pacific 40.9 42.1
17. South Pacific 32.2 33.0
ICAO Circular 280-A T/ l17 35
Table A1-5. Estimated average passenger load factor by international route group, scheduled services
Route group (short title) 1992
I. All world international routes 66
11. International route groups:
1. North-Central America 63
2. Central America 53
3. North America 57
4. North-South America 54
5. South America
6. Europe
7. Middle East 57
8. Africa -
9. Europe-Middle East 63
10. Europe-Africa
11. North Atlantic
12. Mid-Atlantic
13. South Atlantic
14. AsialPacific
- - - - -- -
Average passenger load factor (%) Variation
16. NorthlMid-Pacific
17. South Pacific
36 ICAO Circular 280-A T/117
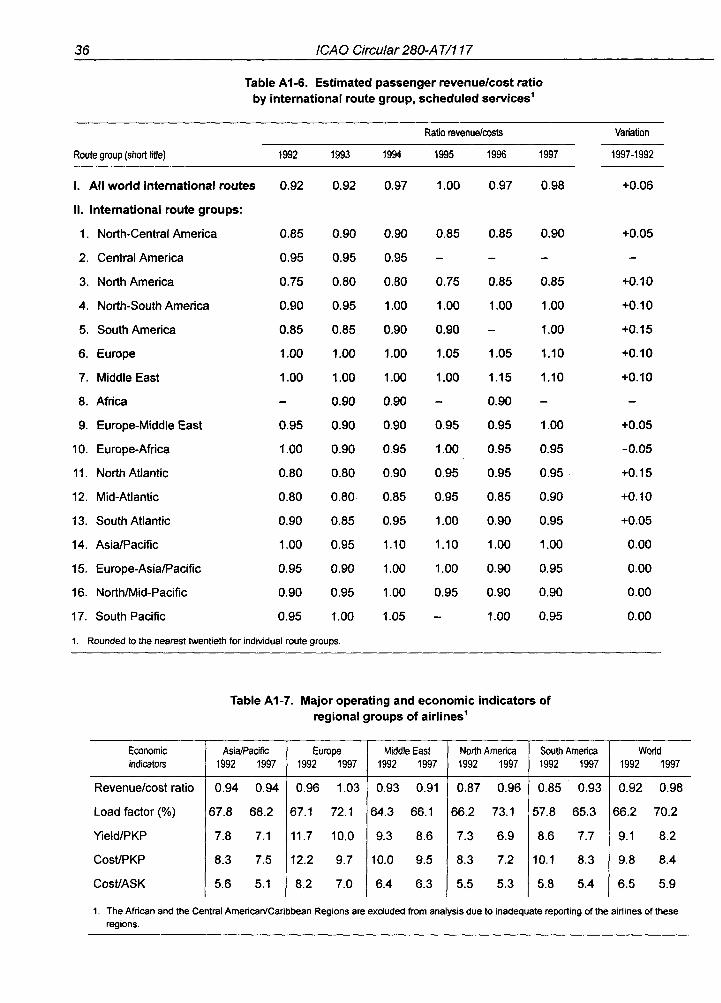
Table Al-6. Estimated passenger revenuelcost ratio by international route group, scheduled services1
Ratio revenuelcosts
Route group (short title) 1992 1993 1994 1995
I. All world international routes 0.92 0.92 0.97 1.00
II. International route groups:
1. North-Central America 0.85 0.90 0.90 0.85
2. Central America 0.95 0.95 0.95 - 3. North America 0.75 0.80 0.80 0.75
4. North-South America 0.90 0.95 1.00 1.00
5. South America
6. Europe
7. Middle East
8. Africa - 0.90 0.90 - 9. Europe-Middle East 0.95 0.90 0.90 0.95
10. Europe-Africa 1.00 0.90 0.95 1.00
11. North Atlantic 0.80 0.80 0.90 0.95
12. Mid-Atlantic 0.80 0.80 0.85 0.95
13. South Atlantic 0.90 0.85 0.95 1.00
14. AsiaIPacific 1.00 0.95 1.10 1.10
15. Europe-AsiaIPacific 0.95 0.90 1.00 1.00
16. NorthIMid-Pacific 0.90 0.95 1.00 0.95
17. South Pacific 0.95 1.00 1.05 - 1. Rounded to the nearest twentieth for individual route groups
Variation
1997-1992
Table A1-7. Major operating and economic indicators of regional groups of airlines1
1. The African and the Central AmericanICaribbean Regions are exduded from analysis due to inadequate reporting of the airlines of these regions.
Economic indicators
Revenuelcostratio
Load factor (%)
YieldlPKP
CostlPKP
CostiASK
AsialPaciL 1992 1997
0.94 0.94
67.8 68.2
7.8 7.1
8.3 7.5
5.6 5.1
Europe 1992 1997
0.96 1.03
67.1 72.1
11.7 10.0
12.2 9.7
8.2 7.0
Middle East 1992 1997
0.93 0.91
64.3 66.1
9.3 8.6
10.0 9.5
6.4 6.3
North America 1992 1997
0.87 0.96
66.2 73.1
7.3 6.9
8.3 7.2
5.5 5.3
South America 1992 1997
0.85 0.93
57.8 65.3
8.6 7.7
10.1 8.3
5.8 5.4
World 1992 1997
0.92 0.98
66.2 70.2
9.1 8.2
9.8 8.4
6.5 5.9

ICA 0 Circular 280-A T/117 3 7
Table Al-8. Major operating and economic indicators of groups of airlines according to region of registration and by route group'
I Eurooe ~nter-rea~onal mute arou~s I Reoional route arouo
Revenuelwst ratio Load factor (%) YieldlPKP CosVPKP CosVASK
I - , I " - .
Regional route group
Route group 14 1992 1997
l . W 1.00 6 6 9 647
9.8 8 7 9.9 8.7 6 6 5.6
AsialPaciRc inter-regional route groups
Route group 9 1992 1997
Revenuelwst ratlo Load factor (%) MeldIPKP CosUPKP CosVASK
Route group 11 1992 1997
0.91 0 88 658 68 7
5 2 5 0 5 8 5 7 3 8 3 9
Revenuelwsl ratlo Loadfador(%) YieldIPKP CosVPKP CosUASK
0 99 1.10 652 667 125 11.1 126 10.1 8 2 6 7
Revenuelcost ratio Loadfaclor(K) YieldlPKP CosVPKP CosVASK
1. The Afrlcan and the Central American and Caribbean Regions are excluded from analysis due to madequate reporting of the alrlmes of these regions.
Route group 15 1992 1997
0.95 0 91 67.3 70.8
7 1 6 4 7.5 7 0 5.0 4 9
Route group 10 1992 1997
Revenuelwsl ratio Load factor (X) YieldIPKP CosVPKP CosUASK
Route group 12 1992 1997
Route group 11 1992 1997
1.07 1.01 65.4 74.3 11.0 7 8 102 7.7 6.7 5 7
Regional route group
Route grow 7 1992 1997
1.00 1.12 57.3 58.9 15.1 152 15.1 13.6 8.7 8.0
Middle East inter-regional route group
Route group 16 1992 1997
0 77 083 698 71 6 6.2 5.4 8.0 6 5 5.6 4.7
' Route group 9 1992 1997
0 91 0 87 62.0 64.2
9 7 8.5 10.7 9.7 6.7 6.3
Regional route group
Rw(egmup3 1992 1997
0.74 0.86 56.6 65.4 8.1 8.0
10.9 9.4 6.2 6.1
North America inter-regional route groups
Route group 17 1992 1997
0.96 0.97 68.7 71 1 5.8 5.8 6.0 6 0 4 1 4.3
Route group 13 1992 1997
0.82 0 97 712 77.8 7 0 6.7 8.5 6.9 6 0 5 4
Regional route group
Route group 5 1992 1997
0.85 1 02 59.2 57.9 10.7 12 3 12.7 12.0 7.5 7.0
South America inter-regional mute groups
Route grow 10 1992 1997
0 79 0.74 56.6 56.6 8.6 7.5
10.9 10.2 6 1 5.8
Route group 1 1992 1997
0.86 0.90 61.9 70.6
8.0 8.3 9.3 9.2 5.7 6.5
Route group 15 1992 1997
0 80 0.94 701 79.1
7.3 5 6 9.1 5.9 6 4 4.7
Route gmup H 1992 1997
0 81 0.97 69.5 78.6 6.2 6.5 7.7 6 6 5.3 5.2
Route gmw 4 1992 1997
1.00 1.13 54.8 61.4 9.4 9.4 9.4 8.3 5.1 5.1
Route group 13 1992 1997
0.91 0.94 63 8 72.1 8.9 6.6 9.8 7 0 6 2 5.1
Rose group 4 1992 1997
0 81 0 85 53 8 62.3 8 2 7.0
10.1 8.2 5.5 5 1
Route group 6 1992 1997
Route group 11 1992 1997
0 80 0.91 69.4 71.9
5.6 6.8 7.0 7.4 4.9 5.3
Route group 12 1992 1997
0.75 0.93 51 5 72 4 7.1 6.5 9 5 7.0 4 9 5 1
0 86 0 99 69.7 77.1
7.9 6 7 9 1 6 8 6.4 5 3
Route group 15 1992 1997
0 99 0 85 68.1 70.3
8 6 7 2 8.7 8.5 6.0 6.0
Roule group 16 1992 1997
1.02 0.98 69.3 74.5 8.2 6.1 8.0 6.2 5.5 4.7
Routegmupl7 1992 1997
0 88 0.97 68.4 69.1 6.1 6.1 6.9 6.3 4.7 4 3
0 97 0 97 71.9 73.7 7 9 7.2 8.1 7 4 5.9 5 4
1.02 108 596 6 4 5 21.9 17.4 21 5 1 6 0 1 2 8 10.3

38 ICAO Circular 280-AT/117
Table A1-9. Estimated unit fuel prices by region (international scheduled services)
Aircraft fuel and oil prices (centsllii) Percent change
1992 1993 1994 1995 1996 1997 1997-1992
I. World 18.3 17.5 16.3 16.6 19.3 18.6 1.6
11. Area'
1. North America 16.0 15.3 13.8 14.0 16.8 16.4 2.5
2. Central AmericalCaribbean 19.4 18.3 17.2 17.1 20.5 19.5 0.5
3. South America 20.2 19.7 18.4 17.2 19.5 19.9 -1.5
4. Europe 17.8 16.8 15.7 16.2 18.9 17.9 0.6
5. Middle East 19.8 19.4 17.6 18.1 20.3 19.5 -1.5
6. Africa 24.4 23.5 21.7 21.6 23.4 22.4 -8.2
1. More detailed descriptions of areas and route groups may be found in Appendix 4 on the reverse of the revenue and cost questionnaire.

lCA 0 Circular 280-A 1/71 7 39
Table A1-10. Estimated average unit fuel prices by international route group, scheduled services
Route group (short title)
Aircraft fuel prices (centsllitre)
1992 1993 1994 1995 1996 1997
I. All world international routes
II. International route groups:
1. North-Central America
2. Central America
3. North America
4. North-South America
5. South America
6. Europe
7. Middle East
8. Africa
9. Europe-Middle East
10. Europe-Africa
11. North Atlantic
12. Mid-Atlantic
13. South Atlantic
14. AsialPacific
15. Europe-AsialPacific
16. NorthlMid-Pacific
17. South Pacific
Percent change
Appendix 2 DATA SOURCES AND COVERAGE
Sources
1. Primary sources of information for this study were two questionnaires which were dispatched (under cover of State letter EC 2120.3.2-98175 of 16 October 1998) to all Contracting States to be filled out with respect to their international carriers. One questionnaire sought information on scheduled and non-scheduled passenger, freight, mail and incidental revenues for each route group, together with corresponding volumes of traffic and capacity. Replies to this questionnaire were received with respect to 66 States. The second questionnaire sought information on costs for international scheduled passenger airlines, and replies were received with respect to 67 States. Facsimiles of the two questionnaires and a list of States for which replies were received are given in Appendix 4.
2. Another important source of information as far as scheduled operations were concerned was a computer analysis carried out by the ICAO Secretariat of timetable material obtained from the Official Airline Guides. The data obtained from this analysis were the number of departures, aircraft block hours and distance flown for each and every airline and aircraft type operating in each of the route groups. In addition, research was carried out on the operating characteristics of aircraft types and sub-types, with resulting data on average number of seats (combination aircraft), fuel consumption per block hour (as a function of stage length), maximum take-off mass, payload and volumetric capacity. This information was related to the basic data to provide a bank of operating statistics for each route group and for each geographical area of operation within each route group, as well as aggregate statistics for each area and for the world as a whole.
3. A wide range of supplementary information sources was used, in particular, data on airline traffic, traffic by flight stage, on-flight origin and destination traffic, fleet and personnel, and airline financial data regularly filed by Contracting States on Air Transport Reporting Forms and published in the ICAO Digest of Statistics.
Coverage
4. For scheduled services, traffic, capacity and other operational data were derived both from the questionnaires and from the timetable material, supplemented by material from the regular statistical reports to ICAO, and may be considered as fully comprehensive of all international operations. Revenue and cost data originated essentially from the questionnaires, supplemented by national publications or other suitable sources of financial data where available; in the case of passenger traffic, available revenue and cost data were adapted according to operational data to render them representative of all international operations (see Appendix 3). In the case of non-scheduled traffic, the sole source of both operational and financial data was the responses to the questionnaires, and the results shown in this study represent only these responses.
5. The study was based on revenue data obtained for 107 scheduled airlines (including 6 all-cargo airlines) and 5 other carriers, and on cost data for 73 scheduled passenger airlines.

ICA 0 Circular 280-A T/117 4 1
6. The number of airlines and the coverage of international scheduled passenger traffic represented by revenue and cost data are shown in Table A2-1 by region of airline registration. The overall representation in terms of available seat-kilometres is 81 per cent for revenue data and 71 per cent for cost data. Representation of the Central AmericaICaribbean Region at 52 per cent was the lowest in 1997 and that of North America at 90 per cent was significantly higher than for the other regions.
Table A2-1. Representation by ICAO region of airline registration, 1997
Region
Revenue data represent Cost data represent International scheduled Available Available available seat-kilometres seat-kilometres
seat- Number Number kilometres of No. % of of No. % of (millions)' airlines (millions) total airlines (millions) total
All 2107405 101 1709668 8 1 73 1 487676 7 1
Africa 76 807 10 55 215 72 7 42 133 55
Europe 750 291 40 646 590 86 23 487 567 65
Middle East 95 642 6 53 925 56 5 53 144 56
North America 411 720 10 371 907 90 10 371 907 90
Central AmericaICaribbean 40 636 4 21 275 52 4 21 275 52
South America 83 957 9 55 056 66 5 49 237 59
1. ICAO Air Transport Reporting Form A-1
7. For each route group, the number of airlines and the percentage of traffic represented by these airlines are shown in Table A2-2. The differences in the overall representation between Tables A2-1 and A2-2 occur partly because of some differences in the ICAO Statistical Programme definitions on what constitutes a domestic or international service. Another reason is the different databases used for these tables; Table A2-1 contains reported traffic, whereas Table A2-2 includes traffic volume according to published timetables.
8. In terms of available seat-kilometres, representation of either revenue or cost data is 70 per cent or above for 11 route groups. Representation of some route groups on the cost side, however, is substantially lower than on the revenue side. For route groups in local South America, the Middle East and across the South Pacific, representation is below 60 per cent; hence cost and revenue figures must be interpreted with a certain degree of caution. For routes in Africa and Central AmericaICaribbean, the representation is so low (11 and 23 per cent, respectively) as to cast significant doubt on the validity of the results for those route groups; hence figures for these route groups are not presented in this study, although their estimates are included in the worldwide totals.
9. The coverage of revenue data for non-scheduled passenger operations is shown in Table A2-3 and the coverage of revenue data for scheduled freight and mail services is shown in Table A2-4.

42 ICAO Circular 280-AT/117
Table AZ-2. Representation by international route group, 1997
Revenue data represent Cost data represent
Percentage of Percentage of Number of total scheduled Number total scheduled
Route group (short title) airlines seat-kilometres of airlines seat-kilometres
I. All world international routes 101
II. International route groups:
1. North-Central America
2. Central America
3. North America
4. North-South America
5. South America
6. Europe
7. Middle East
8. Africa
9. Europe-Middle East
10. Europe-Africa
11. North Atlantic
12. Mid-Atlantic
13. South Atlantic
14. AsiaIPacific
15. Europe-AsialPacific
16. NorthIMid-Pacific
17. South Pacific 5 47 5 47

Table A2-3. Representative nature of revenue data for non-scheduled passenger operations, by tCAO region of registration, 1997
- - -
Revenue data represent International non-scheduled
passenger-kilometres All carriers International scheduled airlines Other carriers performed (millions)'
Region
By inter- Pass-km performed Pass-km performed Pass-km performed national Number Number Number
By all scheduled By o!her of No. % of of No. % of of No. % of carriers airlines carriers carriers (millions) total carriers (millions) total carriers (millions) total
All 233131 124949 108182 55 33 839 15 50 24 904 20 5 8 935 8
Af r i ca 3131 3131 ** 1 71 2 1 7 1 2 0 0 0
As ia lPac i f i c 10556 10556 ** 13 2 370 22 13 2 370 22 0 0 0
E u r o p e 202 662 97 763 105 499 23 26787 13 18 17852 18 5 8 935 8
M i d d l e E a s t 3 762 3 762 ** 2 1 502 40 2 1502 40 0 0 0
N o r t h A m e r i c a 10 239 7 556 2 683 10 898 9 10 898 12 0 0 0
Cent ra l Amer ica1 Car ibbean 1 844 1 844 ** 4 1 792 97 4 1 792 97 0 0 0
S o u t h A m e r i c a 937 937 *' 2 419 45 2 419 45 0 0 0
lCAO Air Transport Reporting Forms A-1 and A-2. " Less than 0.5 million.

44 ICA 0 Circular 280-A T/117
Table A2-4. Representative nature of revenue data for scheduled freight and mail services, by ICAO region of airline registration, 1997
Region
Freight revenue data represent International Mail revenue data represent
scheduled scheduled freight Tonne-km performed mail Tonne-km performed
tonne-km Number tonne-km Number performed of No. % of performed of No. % of (millions)' airlines (millions) total (millions) airlines (millions) total
All 88 111 103 71 015 8 1 2 492 7 1 2 127 85
Africa 1618 10 906 56 2 1 8 14 67
Europe 29 298 38 25 630 87 840 24 68 1 81
Middle East 3 972 6 2 495 63 61 5 36 59
North America 16 630 13 13661 82 830 11 800 96
Central AmericaICaribbean 36 1 4 139 39 8 3 3 38
South America 3 400 9 1 760 52 45 3 3 1 69
1. ICAO Air Transport Reporting Form A-I .

Appendix 3 METHOD OF ANALYSIS AND MARGINS OF UNCERTAINTY
Method of analysis
1. General. Data sources in general are discussed in Appendix 2. All airline financial data were initially adjusted where necessary to represent the calendar year 1997 and converted where necessary from local currency to United States dollars. For currency conversions, use was made of the exchange rates provided by States in their reply to the questionnaires. In those cases where an exchange rate was not supplied, the rate used was the average IATA Clearing House Five-Day Monthly Rate for 1997.
2. Prior to detailed analysis all financial and operational data were verified: (a) as to the mutual consistency and consistency with data for previous years; (b) with information provided on statistical reporting forms regularly submitted to ICAO; and (c) with data obtained from a computer analysis of published timetable material (see Appendix 2).
3. Analysis ofavailable revenue data. Scheduled andlor non-scheduled passenger, freight and mail revenues for each international route group, together with corresponding volumes of traffic and capacity, as well as incidental revenues attributable directly to international scheduled services were obtained for individual carriers directly from the revenue questionnaires designed for this purpose (facsimiles of the revenue and the cost questionnaires are included inAppendix4). This information for individual carriers was aggregated for each route group to obtain weighted average revenues per passenger-kilometre and per seat-kilometre (for passenger traffic) or per tonne-kilometre performed (for freight and mail traffic). In the case of scheduled operations, the data for individual airlines, and hence the average unit revenues, include allowance for discounts, pro-rates, etc., but generally exclude deductions for commission payments.
4. Analysis of available cost data. Cost data are obtained and analysed only for international scheduled passenger airlines. While most scheduled (and non-scheduled) carriers maintain revenue and traffic data on a route by route and/or route group basis, far fewer maintain cost data in a correspondingly disaggregated form. Hence, in order to present data which are generally representative of scheduled passenger airline operations in each region of the world, and at the same time minimize the reporting burden on States and their airlines, a questionnaire was designed in which the requirement for disaggregation of system-wide operating costs was both sparing and in line with practices followed by a majority of airlines. The cost data obtained for individual airlines through this questionnaire were subsequently allocated by the Secretariat among route groups as necessary (that is where an airline operated on more than one route group) using the analysis of published timetable material.
5. The cost data obtained for an individual airline, and the procedures used for allocating these costs among the route groups on which the airline operated, may be divided into three broad categories as shown in Table A3-1: firstly (A), operating costs which for a given airline and a given aircraft type may, for this purpose, be considered as independent of where the aircraft is flying; secondly (B), operating costs which are significantly related both to aircraft type and to geographical area of operation; and thirdly (C), operating costs and pertinent non-operating items which may be related only in part to aircraft type or to the region in which they are incurred, but which are related significantly to the volume of trafhc or the volume of capacity in each route group.
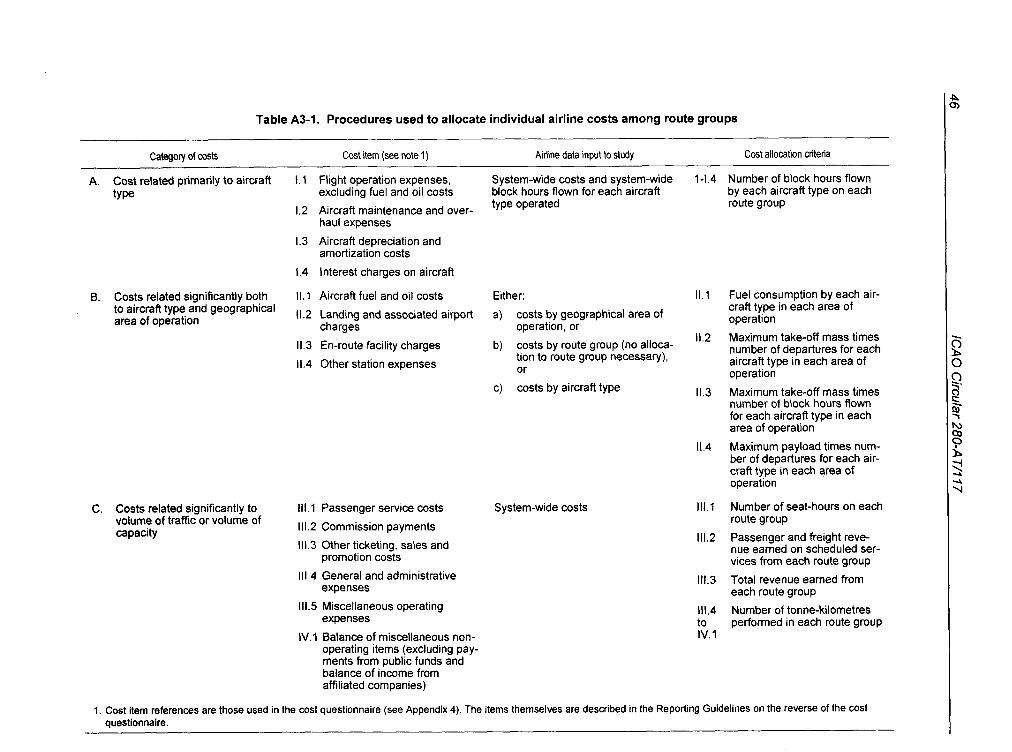
Table A3-1. Procedures used to allocate individual airline costs among route groups
Category of costs Cost item (see note 1) Airline data input to study Cost allocation criteria
A. Cost related primarily to aircraft 1.1 Flight operation expenses, System-wide costs and system-wide 1-1.4 Number of block hours flown type excluding fuel and oil costs block hours flown for each aircraft by each aircraft type on each
type operated route group 1.2 Aircraft maintenance and over- haul expenses
1.3 Aircraft depreciation and amortization costs
1.4 Interest charges on aircraft
8. Costs related significantly both 11.1 Aircraft fuel and oil costs Either: 11.1 Fuel consumption by each air-
aircraft type and geographical 11.2 Landing and associated airport a) costs by geographical area of craft type in each area of
area of operation operation charges operation, or 11.2 Maximum take-off mass times
11.3 En-route facility charges b) costs by route group (no alloca- number of departures for each tion to route group necessary),
11.4 Other station expenses aircraft type in each area of or operation
c) costs by aircraft type 11.3 Maximum take-off mass times number of block hours flown for each aircraft type in each area of operation
C. Costs related significantly to 111.1 Passenger service costs volume of traffic or volume of Commission payments ca~acitv
111.3 Other ticketing, sales and promotion costs
111.4 General and administrative expenses
111.5 Miscellaneous operating expenses
IV.l Balance of miscellaneous non- operating items (excluding pay- ments from public funds and balance of income from affiliated companies)
System-wide costs
11.4 Maximum payload times num- ber of departures for each air- craft type in each area of operation
III.l Number of seat-hours on each route group
111.2 Passenger and freight reve- nue earned on scheduled ser- vices from each route group
111.3 Total revenue earned from each route group
111.4 Number of tonne-kilometres to performed in each route group IV.1
1. Cost item references are those used in the cost questionnaire (see Appendix 4). The items themselves are described in the Reporting Guidelines on the reverse of the cost questionnaire.

ICAO Circular 280-A T/117 47
6. Costs in the first category (A) were obtained from the data for each airline as an average system-wide cost per aircraft block hour for each aircraft type used in international scheduled service. The costs for each route group were calculated according to the number of block hours flown by each aircraft type operated by the airline on that route group.
7. Costs in the second category (B) were recorded for each airline by route group or by geographical area (or in a few instances by aircraft type). Where recorded by area or by aircraft type, data were adapted to obtain corresponding data by route group using appropriate operational criteria (such as consump- tion in the case of "aircraft fuel and oil"). The relationships between route groups, geographical areas and aircraft types in terms of operational data were available from the computer analysis of timetable material.
8. Costs in the third category (C) were recorded as system-wide totals for the operations of each airline. These costs were disaggregated into route group costs using a suitable allocation parameter for each cost item. The allocation parameter devised for each item bears a direct or indirect relationship with the volume of traffic or capacity in each route group. In the case of "Commission payments" and "Other ticketing, sales and promotion costs", the allocation parameter used is the total revenue earned from each route group, thereby including effects both from traffic and from regional differences in revenue yields (and hence regional differences in ticketing, sales and promotion costs).
9. For some airlines, cost data within the three categories were reported relating to domestic operations and/or international non-scheduled operations as well as to international scheduled operations. Such costs associated with domestic and non-scheduled operations were subtracted using the same allocation procedures as were used to distribute costs among route groups.
10. As far as data for individual airlines were concerned, total costs for the scheduled international passenger flights in each route group were estimated by summing the itemized costs allocated to the route group. Finally, costs allocable to the carriage of freight and mail on passenger flights were deducted from these total costs to arrive at passenger costs. For this purpose, it was assumed that the cost of the carriage of freight and mail on passenger and combination aircraft on a route group was equal to the freight and mail revenue from operations of these aircraft.
11. Estimates of revenues and costs for airlines for which financial data were not available. The procedures described above led to the production of total revenues and (for international scheduled passenger traffic) total costs on each route group by airline region of registration for all those carriers for which the basic financial data were available. In most cases, this financial database did not include all carrier operations. However, for scheduled passenger traffic, estimated revenues and costs presented in this study were formulated to cover all airlines operating on each route group.
12. In the case of revenues, the reported average revenue yield per passenger-kilometre for airlines registered in the same region within each route group has been applied to the total revenue passenger- kilometre for all airlines registered in that region operating on the route group.
13. In the case of costs, the estimates for non-reported airlines have been based on cost data for reported airlines from the same region of registration for the route group and also take into account differences in the operating characteristics of the two groups of airlines concerned (including differences in load factors). With respect to the costs in category A (see Table A3-I), the average costs per block hour for the aircraft of airlines for which cost data were available were applied to the hours flown by the same aircraft types by non- reported airlines from the same region of registration, thus taking into account differences in the aircraft fleet, in block speed and in seating configuration. Costs in categories 6 and C were similarly estimated on the basis of criteria parallel to those used in allocating costs of individual airlines among route groups.

4 8 ICA 0 Circular 280-A T/11 7
14. For some route groups where airlines of a particular region had a very low representation, the grossing-up process for revenues and costs was adjusted to take into account the revenues and costs of major non-reported airlines on the basis of data provided for previous studies as well as data regularly collected for ICAO digests of statistics.
Margins of uncertainty
15. General. It is important to recognize that the revenue and cost data presented in this circular are not perfectly defined quantities but involve margins of uncertainty. Such margins of uncertainty are inherent in any presentation of airline financial data which covers a multiplicity of currencies, involves disaggregation of system-wide revenues and costs, or has an incomplete database. Hence, an important feature of the method used in this series of studies has been to identify and evaluate the various sources of uncertainty for the purpose of establishing the degree of precision in the published data and hence the constraints on drawing conclusions from these data. The evaluations concerned were carried out by means of statistical analysis of detailed airline data and by means of tests to determine the sensitivity of the published data to the procedures used in the study. The resulting assessments of margins of uncertainty in average unit revenues, average unit costs and average revenue/cost ratios published in this study for scheduled passenger traffic in 1997 are presented below.
16. Estimates of unit revenues. The margin of uncertainty in the estimated unit revenues for a route group arises from limitations on the quality of reported data, from exchange rate fluctuations and, for scheduled passenger traffic, from the assumption that the average yield for non-reported airlines is the same as that for reported airlines on the same route group. An analysis was carried out to evaluate each of these sources of uncertainty and their cumulative effect, thus producing composite margins of uncertainty for the various route groups. The conclusion was that with the exception of routes in the Middle East where there was a significant variation in unit revenues among the reporting carriers, along with a mere 52 per cent representation, the estimated scheduled passenger revenue per passenger-kilometre for the other routegroups presented can be relied upon to +5 per cent. More caution should also be exercised when interpreting the revenue data for routes within South America and across the South Pacific due to the relatively low representation in these route groups. For regional routes in Africa and- Central AmericaICaribbean, the representation was so low as to cast some doubt on the validity of the results for those route groups; hence revenue (and cost) figures for these routes are not presented in this study, although their estimates are included in the worldwide totals. A significantly narrower margin of uncertainty than +5 per cent applies for those route groups where the representation was relatively high. On a global basis, taking into account all route groups as a whole, the margin of uncertainty is reduced by compensatory effects and by scale and is estimated at *3 per cent.
17. Estimates of unit costs. The estimates of unit passenger costs for a route group contain similar elements of uncertainty as those for passenger revenues, plus further elements which arise from the need to allocate costs among route groups according to standardized procedures. These additional sources of uncertainty arise because:
a) the generic nature of some cost items (for example, general administrative costs) makes their allocation among route groups a matter of convention; and
b) even for those cost items which are region or route-specific, the standardized allocation procedures do not take into account the detailed conditions under which individual airlines operate.

ICA 0 Circular 280-A T/117 49
18. As for the revenue data, a composite margin of uncertainty was developed in respect of the average unit costs for each route group and for all route groups together. The margin of uncertainty in the estimated scheduled passenger costs per passenger-kilometre for all route groups presented, except one within South America, is considered to be within k9 per cent. On the cost side, there were more route groups with lower representation, which increases the degree of uncertainty (see Appendix 2, 8). On a global basis, taking into account all route groups as a whole, the margin of uncertainty in the average costs per passenger- kilometre is estimated at 25 per cent.
19. On a few route groups where the margin of uncertainty approaches + I0 per cent, the contribution of the different sources of uncertainty is approximately as follows:
Relative contribution to Sources of uncertainty the margin of uncertainty
Incomplete cost database 3
Generic nature of certain costs and use of standardized allocation procedures
Fluctuations in currency exchange rates 2
Other (primarily imperfections in reported data) 2
All 10
20. Much of the uncertainty arising from the generic nature of certain costs is inherent and cannot be influenced (see 17), and little can be done to reduce the uncertainty arising from fluctuations in currency exchange rates. A major factor in these studies therefore is getting as much coverage of financial data as possible, while at the same time making efforts to improve the quality of reported data.
21. All the above estimates of uncertainty apply only to overall average cost data (as presented in Chapter 3, Table 3-1). Estimates of individual elements making up the overall cost are, in a number of cases, subject to wider margins of uncertainty.
22. Estimates of revenue/cost ratios. The estimated ratios of revenues to costs have margins of uncertainty which vary from route group to route group depending on the margins of uncertainty in the estimated revenue and cost data. It should be noted, however, that the uncertainties in the revenue and the cost figures for a route group are to some extent interdependent; in other words, if the revenue on a route group is overestimated, the cost figure is also probably overestimated. This circumstance reduces the margin of uncertainty in the revenuelcost ratios compared with those for either the revenue data alone or the cost data alone. The composite margin of uncertainty in the revenuelcost ratio for the individual route group in this study is estimated at between +4 and +5 per cent, and for all the route groups together it is estimated at k2.5 per cent.

Appendix 4 QUESTIONNAIRES RELATING TO
REVENUES AND COSTS
I. Facsimiles of questionnaires and attachments
QUESTIONNAIRE ON REVENUES OF INTERNATIONAL SCHEDULED AND NON-SCHEDULED AIR CARRIERS (Reporting Guidelines and Route Group Descriptions Overleaf)
Carrlar Name: . . . .,., . . . . . . . . . . . . . . CALENDAR PERIOD. 12 Months (mm . . . . . . . . to . . . . . . . .
. R e m t b g currency fUSS or National)
Exchange Rate betmcn N.Uonal Curnncy and Ms US Dollar during Period: tU.S.Z° . . . . . . . . . . . . . . . . . . . . . . . .
Section I - Scheduled Sankea
1 ROVQnIM
a) Pas~ngertra&
(i*dmQ ex*ss -age) b) Freight WaffiC
c) Marl trafic
d) Other
1.2 Comepondlng Volume of T&c a) Passenger-kibrnetm (millins]
b) Seat-kilometres (mi l l is )
c) Freight lonnbkilwm,trss pe~onnad (millions)
d) Mail t o n n a k i paffwmd (thousands)
e) AvadaMF tonne-kilometma (millions)
1.3 All-Cargo S.wkar Only (included
..................................................................................................................................................................
14 13
.Y 'E
3 5 V)
............................................................................................................................................................................................
.......................................................................................................................................................................
.....................................................................................................................................................................................................................................
.............._.
..............................................................................................................................................................................................................................................................................................................................................................................................................
INTERNATIONAL SERVICES BY ROUTE GROUP
11
U '2
L
2
15
1 W 0
U) w g 1 2 3 4 5 . . U) a-
D 3 3 .O a
4 I
..........................................................................................................................................................................................
..................................................................................................................................................................................................
.........................................................................................................................................................................................................
...........................................................................................................................................................................................
8 12
2 I s
.................................................................................................................................................................................................................
.................................................................................................................................................................................................................
................................................................................................................................................................................................................
0
..........................................
5
8 .-
...................................................
................... -
a) Revenue (total)
b) Tonne-k i t res Wrfwmsd (mlllmm)
Saction I1 - Non-Scheduled OpaRtlons
11-1 Rwenue
a) Passenger traffic
b) Freight traffic
11-2 Corresponding Volume of Traffic and Capacity
16 9
TI
*
6 17
9 Z
3
.........................................
_,.._.__
......_. ........
........................................................................................................................... .....................................................................................................
...........................................................................................................................................
10
.. m w
5
7
.d
P 8 la
V)
0 W 4
V) W f i:
H
(millions)
Remans:
P 3 3 .= 3
and C~pdcity
............... L..
........... ...._....
a) Passenger-kllometms (millions)
b) Seal-kilomeires (milli?r)
C) Freght tonnuklometres perfurmed (millions)
d) Available tonnekilometres
2
.......
..............................................................................................................................................................................................................................................................................................................................................................................................................
...__
............................................................................................................................................................................................................................................................................................................................................................................................
................................................................................................................................
..........................................................................................................................................................................
..............................................................................................................................................................................................
..................................................................................
__
.........................................................................................................................................................................................
.................................................................................................................................................
-.
......................................................................................................
..............................................................................................................................................................................................
.......___
in 1.1 and 1.2
...................................................................................................................................................................
..........................................................................
......................................................................................................................................................................................................................................
.........___.
....................................................................................................................................................................................................................................
above)
............................
__
...................................... _.
..............................................................

ICAO Circular 280-A T/17 7 51
GENERAL
a) This questionnaire is to be returned completed by ICAO Contracting States for each of their major international scheduled and non-scheduled air carriers (including any all-cargo carriers). The material provided will not be made public in such a way as to permit identification of individual operators. Information provided should be the total amount for a 12-month period as close as possible to the calendar year specified in the covering State Letter, with the period being identified in the space provided. It is recognized that, in order for your reply to reach ICAO by the date indicated in the State Letter, final audited financial data may not be available, but preliminary data are acceptable.
b) Data for all-cargo aircraft operations should be included in the relevant sections of the questionnaire. Data for scheduled services with such aircraft should be included in ltems 1.1 and 1.2, and specifed under 1.3 if possible.
c) Financial data may be provided either in terms of national currency or in terms of U.S. dollars. In either case the weighted average annual exchange rate used or to be applied to convert national currency into U.S. dollars should be specified in the space provided.
d) A brief description of each financial data item is given below; for more detailed definitions see the Instructions for completion of ICAO Air Transport Reporting Form EF-1, for airline Financial Data. For definitions of traffic and capacity data items see ICAO Air Transport Reporting Form A-1 for airline Traffic data.
e) Descriptions of the route groups, which are based on those used by IATA's Cost Committee are also given below, followed by guidelines on allocating data amongst them.
SECTION I - SCHEDULED SERVICES
For ltems 1.1 a) to 1.1 c) and 1.3 a) report gross revenues related to scheduled flights before capacity equalization payments arising from pooled services and from the sale of own capacity to other carriers.
For Item 1.1 d) Otherrevenue is intended to include on a net basis capacity equalization payments arising from pooled services and from the sale of own capacity to other carriers; and on a gross basis (with related expenses reported under the relevant expense item, indicate where different) incidental revenues accruing from air transportation services such as revenues from passengers paying less than 25% of the normal applicable fare; commissions received on sales of transportation on other carriers; "no-show" and cancellation fees. Exclude revenue accruing from the provision of services other than for air transportation, such as for surface transportation; food services; service and maintenance sales; handling services for third parties; and property.
SECTION II - NON-SCHEDULED OPERATIONS
Include revenue derived from all non-scheduled flights performed for remuneration, including empty flights related thereto, when the responsibility for the performance of transportation is that of the carrier reported.
DESCRIPTIONS OF ROUTE GROUPS
Between North America and Central AmericalCaribbean
lncludes routes between on the one hand Canada and/or the United States (including Alaska and Hawaii) and on the other hand Central America and the Caribbean. Routes between the United States and Puerto RicoNirgin Islands are considered domestic and are excluded. Central AmericaICaribbean is defined as the geographical area covered by route group 2 below but excluding Mexico.
Between and within Central America and the Caribbean
lncludes routes between or among the Bahamas, Belize, Bermuda, Costa Rica, El Salvador, Guatemala. Honduras, the Islands of the Caribbean Sea (including Puerto Rico and the Virgin Islands), Mexico, Nicaragua and Panama.
Between Canada, Mexico and the United States
lncludes routes between or among the above States. The United States includes Alaska and Hawaii but excludes Puerto Rico and the Virgin Islands.
Between North AmericaICental AmericaICaribbean and South America
lncludes routes between the geographical areas defined on the one hand by route group 1 andlor Mexico and on the other hand by route group 5 ("Local South America").
Local South America
lncludes routes between or among the following States: Argentina, Bolivia, Brazil. Chile, Colombia (including San Andres Islands), Ecuador, Falkland islands (Malvinas), French Guiana, Guyana, Paraguay, Peru, Suriname, Uruguay and Venezuela.
Local Europe
lncludes routes between or among the States of geographical Europe, Algeria, Azores, Canary Islands. Greenland, Iceland. Madeira. Malta. Morocco, Tunisia and Turkey.
Local Middle East
Includes routes between or among the following States: Bahrain, Cyprus, Egypt, lran (Islamic Republic of), Iraq, Israel, Jordan, Kuwait, Lebanon, Oman, Qatar, Saudi Arabia, Sudan, Syrian Arab Republic, United Arab Emirates and Yemen.
Local Africa
lncludes routes between or among the States of continental Africa and offshore islands, but excluding Algeria, Azores, Canary Islands, Egypt, Madeira, Malta. Morocco, Sudan and Tunisia.
Between Europe and Middle East
lncludes routes between the two geographical areas defined by route group 6 ("Local Europe") and route group 7 ("Local Middle East") respectively.
Between EuropelMiddle East and Africa
lncludes routes between on the one hand the geographical areas defined by route
11. North Atlantic
12. Mid Atlantic
lncludes routes betwee defined by route group Rio de Janeiro and on t Conference 2 ("Local E
13. South Atlantic
lncludes routes between on the one hand Rio de Janeiro or any other gateway south thereof in route group 5 ("Local South America") and on the other hand the geographical areas defined by IATA Tariff Conference 2 ("Local Europe" andlor "Local Middle East" andlor "Local Africa").
14. Local AsialPacific
lncludes IATA Tariff Co ference 3, that is international routes within Asia to the east of the Islamic Republic f lran and of the Ural Mountains, Australia, New Zealand, Papua New Guinea, the slands of the Pacific Ocean excluding the Hawaiian Islands. Midway and Palmyra.
a 15. Between EuropelMidd e EasffAfrica and AsialPacific I
lncludes routes betwee the geographical areas defined by IATA Tariff Conference 2 on the one hand and t t at defined by IATA Tariff Conference 3 on the other hand.
16. North and Mid Pacific
lncludes routes via the North and Central Pacific Ocean between on the one hand points in the Americas (that is IATA Tariff Conference 1) and on the other hand Asia andlorthe islands adjacent thereto (that is IATA Tariff Conference 3 exceptAustralia, New Zealand, Papua New Guinea and the islands of the South Pacific).
17. South Pacific
lncludes routes via the South Pacific Ocean between on the one hand points in the Americas (that is IATA Tariff Conference 1) and on the other hand Australia, New Zealand, Papua New Guinea and the islands of the South Pacific.
ALLOCATION TO ROUTE GROUPS
All data referring to domestic legs of international operations should be included as international in data for the ropte group concerned. Any service with a single flight number should be allocated to the route group which covers travel from the point of origin to the point of destination. For example, a flight Zurich-Geneva-Abidjan-Dakar should be reported as a EuropeIMiddle East-Africa flight (in route group 10) and not spl~t between domestic, Europe-Africa and Local Africa. Speclfy all reporting differences.
Also specify any services which fall into more than one route group, including the criterion used for allocating data amongst the route groups concerned.
group 6 ("Local Europe") andlor route group 7 ("Local Middle East") and on the other hand the geographical area defined by route group 8 ("Local Africa").

52 ICA 0 Circular 280-A T/117
QUESTIONNAIRE ON COSTS INCURRED BY INTERNATIONAL SCHEDULED AIR PASSENGER CARRIERS
(Report ing Guidelines and Geographical Descriptions Overleaf)
during period: 1U.S.S- . . . . . . . . . . . . . . . . . . . . . . . . . . .
I I I I I
CarrlerName . . . . . . . . . . . . . . . . . . . . . . . . . . . . . . . . . .
Reporting Currency . . . . . . . . . . . . . . . . . . . . . . . . . . . . . . (U.S.S or Natronal)
Exchange Rate Between National Currency and the US.$
.......................... ...................................................... CALENDAR PERIOD: 12 Months from to
TOTAL AMOUNTS FOR CALENDAR PERIOD
See General Note b) overleaf and check boxes if cost data In this Section include:
domestic^ Non-Scheduled 17
Sectlon I - Expenses and Operatlng Data (AIRCRAFT by AircraR Type TYPE) -
I I I I I
I S d o n Ill - Other Operating Expenses 1 All Amas 1 Remarks: (Include delrcription of any dewations from Report~ng Guidelines and Gecgraphical Descriptions overleafl. I
1.1 Flight operations expenses, excluding fuel and oil costs
1.2 Maintenance and over-haul expenses
1.3 Depreciatron and amoitjzatron costs
1.4 Interest charges
1.5 Revenue block hours:
a) operated on lnternatlonal scheduled services
b) operated on international non-scheduled services
c) operated on domestlc services ................. d)totalanaewicea ..............................
Sectlon II - Operating Expenses by m- Geographical Area or mute group
OR
See General Note b) overleaf and check (ROUTE box(es) if data in this Section ~nclude: GROUP) - ~ o m e s t i c n NonScheduled
11.1 Aircraft fuel and oil
11.2 Landing and associated airport charges
11.3 Route fadlity charges
11.4 Station expenses . . . . . . . . . . . . . . . . . . . . . . . . .
See General Note b) overleaf and check box(es) if data in this Section include: I Domest lcn NonScheduled I I I
.....................................................................................................................................
............... _ . _ _
North America
..........................................
/ III.1 Passenger services (including cabin attendants) . . . . . 1. ...................... 1 1 111.2 Comm~ssion payments . . . . . . . . . . . . . . . . . . . . . . . ........................ {
_ ..................
Centni
c$gdn
...............................................................................................................................................................
/ 111.3 Other ticketing, sales and promotion . . . . . . . . . . . ................... 1 1 Ill4 General and administrative . . . . . . . . . . . . . . . . ....................... /
............................................................................................................................................................................................
...........................................................................................................................................................................................
...
South America
......................................................................................................................................................................................
...........................................................................................................................................................................................................
111.5 Miscellaneous operating expenses . . . . . . . . . . . ........................ I Sectlon IV - Balance of Miscellaneous Non-operating Items . . . . . . . . . . . . . . . . . . . . . . . . . . . . . . . .
(Note: + = revenue. -=expense)
......................................................................................................................................................................
..................................................................................................................................................................................
.............................................................................................................................................................................
Europe
.............................................................................................................................................................................
. . . . . . . . . . . . / TOTAL - SECTIONS I TO IV I I
......___........._
Middle East
............................................................................................................................
Africa
............
Asid Paclffc

ICA 0 Circular 280-AT/117 53
GENERAL
a) This questionnaire is to be returned completed by ICAO Contracting States for each of their airlines that provide international scheduled air passenger services. The material pmvided will not be made public in such a way as to pennitidentification of individualopemt~~~. Information provided should be the total amount for a 12-month period as close as possiMe to the calendar year specified in the covering State Letter. with the period being identified in space provided. it is recognized that. in order for your reply to reach ICAO by the date indicated in the State Letter, final audited financial data may not be available, but preliminary data are acceptable. Similarly, i f full infonnation is no1 available for any Section of the questionnaire, partial andlor aggregated data w l d be appreciated.
b) All data provided should preferably ntn only to intornatlonal scheduled wwicw. Should carriers not be able to break w t such information separately, the domestic andlor non-scheduled data should be included; the a~ropriate box(es) at the beginning of each Section should then be checked. Data referring to domestic legs of international services should be included as international. Indicate any exceptions.
c) Financial data may be pmvided either in terms of national currency or in terms of U.S. dollars. in either case the weighted average annual exchange rate used or to be applied to convert national currency into U.S. dollars should be specified in the space provided.
d) All expense, revenue and operating data relating to freight and mail, including those for all-cargo aircraft operatiis, shouldbe Includedvhsre relevant in the questionnaire. Expenses incurred for the provision of sewices to other airlines such as maintenance, handling and catering should be excluded.
e) A brief description of each data item is given below. More detailed definitions of financial data items are given in the Instructions for completion of ICAO Air Transport Reporting Form EF-1. for airline Financial Data.
SECTlON I - EXPENSES AND OPERATING DATA BY AIRCRAFT TYPE
Report for all aircraft types used, whether combinatimn or all-cargo, using model designation (e.g. A300-B4, DCID-30CF. Boeing 747-200F).
1.1 flight operation expenses, excludingfuel and oil cost*. This item comprises flight crew salaries and expenses. flight equipment insurance, rental of flight equipment (excluding any payments made under aircraft capital or finance lease arrangements), flight crew training, and other flight expenses excluding those covered by Items 1.2, 1.3, 1.4 and 11.1.
1.2 Maintenance and overhaul expenses. Includ. here all expenses incurred for the repair. o v e h u l and maintenance d flight equipment, including payments to outside contractors and manufacturers. Exclude expenses incurred for the pmvision of maintenance and overhaul services to other airlines.
1.3 Depreciation and amortization costs. Incorporate all such costs relating to flight equipment. including depreciation charges for aircraft acquired through capital or finance lease arrangements. Depreciation of ground propetty and equipment should be included if possible under the appropriate headings or in Item 111.5.
1.4 Interest charges. Include here gross interest charges on loans for the purchase of flight equipment, including the interest dement of aircraft financing leases. Interest charges on other loans or overdrafts should be reported net under ltem 111.5.
1.5 Revenue block hours. Provide data by aircraft type wherever possible, even where disaggregated cost data for this Section are not available.
SECTION II - OPERATING EXPENSES BY GEOGRAPHICAL AREA
Geographical Areas are described below. Data for this W m may alternatively be reported by route group in accordance with the descriptions appearing in the associated questionnaire on revenues (in which case @ease specify each route group).
11.1 Aircraft fuel and oil. lnclude through-put charges, non-refundable duties and taxes.
11.2 Landing and associated airport charges. lnclude all charges and fees related to air traffic operations which are levied against the airline for services provided at the airport for landing charges, passenger and cargo fees, security, parking and hangar charges.
11.3 Route faciilty charges. lnclude all fees levied against the airline for the provision of route facilities and services. Where a sagle charge is levied for both airport and route fac~lities, the amount should be reported under ltem 11.2.
11.4 Station expenses. lnclude all expenses incurred (passenger andlor cargo) for traffii handling and aircraft loading and servicing, including payments to outside contractors. Exclude expenses incurred for sales staff at airports (to be included under ltem 111.3) and for the handling and servicing of traffic and aircraft of other airlines.
SECTION Ill - OTHER OPERATING EXPENSES
111.1 Passenger sewices. Include all expenses incurred for the pmvision of passenger services (including pay, allowances and expenses of cabin attendants and other passenger service personnel); premiums for passenger liability and accident insurance paid by the airline; expenses of handling passengers incurred because of cancelled and delayed flights. Exclude expenses incurred for the provision of passenger services to other airlines.
111.2 Commission payments. lndude commissions payable to third parties for the sale of transportation on the airline's services, preferably on a gross basis (specify where different).
111.3 Other ticketing, sales and promotion. include all expenses related to these three functions, including staff, accommodation, reservations, and advertisinplpubiicity.
111.4 General and administrative. Indude all expenses incurred in performing the general and administrative functions of the airline. Overhead costs directly related tospecific functions should preferably be allocated elsewhere under the appropriate heading.
111.5 MWlaneousoperatingexpenses. lncludealloperatingexpenseswhichcould not be assigned elsewhere in Sections 1 to Ill. lnclude here net interest charges on loans and overdrafts not related to the purchase of flight equipment (see ltem 1.4).
SECTION IV - BALANCE OF MISCELLANEOUS NOKOPERATING ITEMS
lnclude profits and losses from retirement of property and equipment, foreign exchange transactions, and miscellaneous non-operating items. Exclude payments from public funds and balance of income from affiliated companies.
DESCRIPTIONS OF GEOGRAPHICAL AREAS
North h r l u Canada and the United States, including Hawaii and Alaska but excluding
Puerto Rico and the Virgin Islands.
Central AmericdCaribbean Bahamas, Belize, Bermuda. Costa Rica, El Salvador, Guatemala, Honduras,
the islands of the Caribbean Sea (including Puerto Rim and the Virgin Islands), Mexico, N i a g u a and Panama.
South Anwrlca Argentina. Bolivia. Brazil, Chile. Colombia (including San Andres Islands),
Ecuador, Falkland Islands (Malvinas), French Guiana. Guyana. Paraguay. Peru. Suriname. U ~ g u a y and Venezuela.
Middle East Bahrain, Cyprus, Egypt, lran (Islamic Republic of). Iraq. Israel. Jordan. Kuwait,
Lebanon. Oman. Qatar. Saudi Arabia. Sudan. Syrian Arab Republic. United Arab Emirates and Yemen.
Europe Geographical Europe and Algeria. Azores. Canary Islands, Greenland. Iceland,
Madeira, Malta. Morocco. Tunisia and Turkey.
Am- The continent Of Africa and offshore islands, but excluding Algeria. Azores.
Canary Islands. Egypt. Madeira. Malta, Morocco. Sudan and Tunisia.
AsidPacific IATA Tariff Conference 3 (including Asia to the east d the Islamic Republic of
lran and of the Urai Mountains. Australia. New Zealand. Papua New Guinea and the islands of the Pacific Ocean exciuding the Hawaiian Islands. Midway and Palmyra).
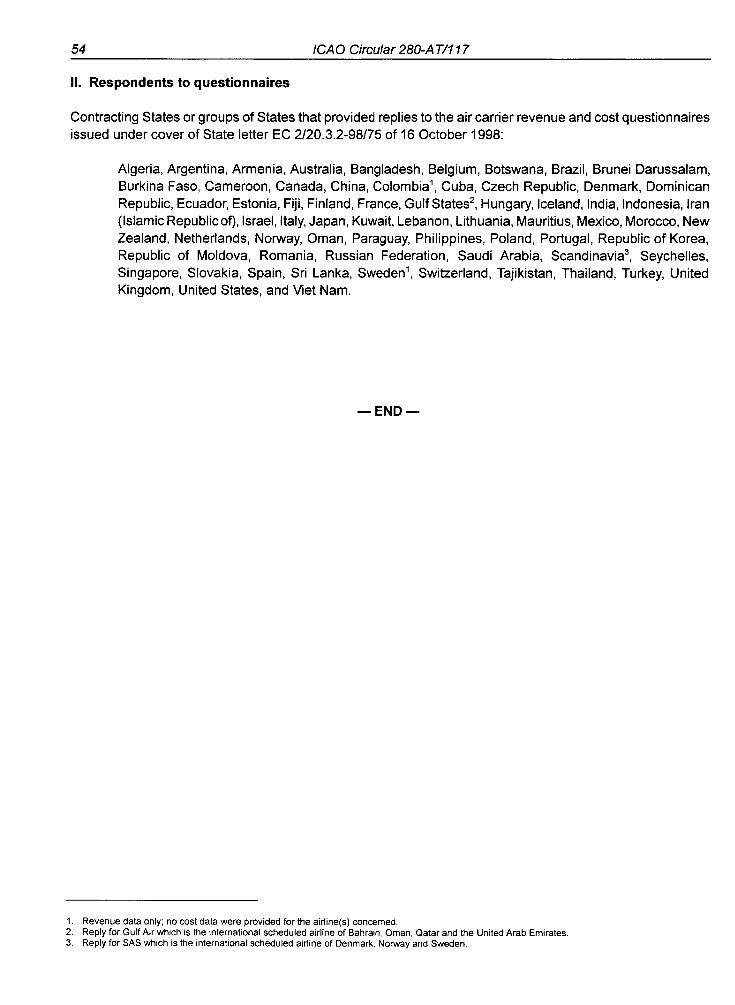
54 ICA 0 Circular 280-A T/117
II. Respondents to questionnaires
Contracting States or groups of States that provided replies to the air carrier revenue and cost questionnaires issued under cover of State letter EC 2120.3.2-98175 of 16 October 1998:
Algeria, Argentina, Armenia, Australia, Bangladesh, Belgium, Botswana, Brazil, Brunei Darussalam, Burkina Faso, Cameroon, Canada, China, Colombia1, Cuba, Czech Republic, Denmark, Dominican Republic, Ecuador, Estonia, Fiji, Finland, France, Gulf States2, Hungary, Iceland, India, Indonesia, Iran (Islamic Republicof), Israel, Italy, Japan, Kuwait, Lebanon, Lithuania, Mauritius, Mexico, Morocco, New Zealand, Netherlands, Norway, Oman, Paraguay, Philippines, Poland, Portugal, Republic of Korea, Republic of Moldova, Romania, Russian Federation, Saudi Arabia, Scandinavia3, Seychelles, Singapore, Slovakia, Spain, Sri Lanka, Sweden1, Switzerland, Tajikistan, Thailand, Turkey, United Kingdom, United States, and Viet Nam.
- END -
1. Revenue data only; no cost data were provided for the airline(s) concerned. 2. Reply for Gulf Air which is the international scheduled airline of Bahrain, Oman, Qatar and the United Arab Emirates. 3. Reply for SAS which is the international scheduled airline of Denmark, Norway and Sweden.
ICAO PUBLICATIONS IN THE AIR TRANSPORT FIELD
The following summary gives the status and also describes in general terms the contents of the various series of publications in the air transport field issued by the International Civil Aviation Organization:
International Standards and Recommended Practices on Facilitation (designated as Annex 9 to the Convention) which are adopted by the Council in accordance with Articles 37, 54 and 90 of the Convention on International Civil Aviation. The uniform observance of the specifications contained in the International Standards on Facilitation is recognized as practicable and as necessary to facilitate and improve some aspect of international air navigation, while the observance of any specification contained in the Recommended Practices is recognized as generally practicable and as highly desirable to facilitate and improve some aspect of international air navigation. Any differences between the national regulations and practices of a State and those established by an International Standard must be notified to the Council in accordance with Article 38 of the Convention. The Council has also invited Contracting States to notify differences from the provisions of the Recommended Practices:
Council Statements on policy relating to air transport questions, such as charges for airports and air navigation services, taxation and aims in the field of facilitation;
Digests of Statistics which are issued on a regular basis, presenting the statistical information received from Contracting States on their civil aviation activities;
Circulars providing specialized information of interest to Contracting States. They include studies on trends in the air transport industry at a global and regional level and specialized studies of a worldwide nature:
Manuals providing information or guidance to Contracting States on such questions as airport and air navigation facility tariffs, air traffic forecasting techniques and air transport statistics.
Also of interest to Contracting States are reports of meetings in the air transport field, such as sessions of the Facilitation Division and the Statistics Division and conferences on the economics of airports and air navigation facilities. Supplements to these reports are issued, indicating the action taken by the Council on the meeting recommendations, many of which are addressed to Contracting States.

0 ICAO 2000 12/00, E/P1/1500
Order No. CIR280 Printed in ICAO


![Distributed Local Outlier Detection in Big Datapeople.csail.mit.edu/lcao/papers/kdd17-ddlof.pdf · Local Outlier Factor (LOF) [7] introduces the notion of local outliers based on](https://static.fdocuments.in/doc/165x107/5f0d2d0c7e708231d4390b9e/distributed-local-outlier-detection-in-big-local-outlier-factor-lof-7-introduces.jpg)